
A Machine Learning Approach to Predict the Consumer Purchasing Behavior on E-commerce Website During Covid-19 Pandemic
Muhtasim1 , Redoanul Haque2 , Md. Sumon Ali3 , Md. Showrov Hossen41 Lecturer, Dept. of CSE, Bangladesh Army University of Engineering & Technology (BAUET), Natore, Bangladesh
2 Lecturer, Dept. of CSE, Bangladesh Army University of Engineering & Technology (BAUET), Natore, Bangladesh
3 Lecturer, Dept. of CSE, Bangladesh Army University of Engineering & Technology (BAUET), Natore, Bangladesh
4 Lecturer, Dept. of CSE, City University, Dhaka, Bangladesh ***
Abstract - COVID-19 is the name of a recent terror around the whole world. This pandemic situation rapidly affecting every stages of a human life. To decrease the outbreak of COVID-19 and keeping everyone safe from the bad impact of this situation some precautionary steps like lockdown and curfew are taken places all over. In this current pandemic situation e-commerce sites are playing an important role to fulfil dailylifeneeds andnow a daystheconsumersaregetting dependent on e-commerce services. Variety of consumers purchasing behavior helps the owners of e-commerce sites to improvebusiness andservingtheirconsumersproperly.Inthis research work we will try to determine the consumers purchasing behavior using several machine learning algorithms. We have used here Linear Regression, Logistic Regression, Support Vector Machine (SVM), K-Nearest Neighbor (KNN), Random Forest and Naïve Bayes algorithms topredict theconsumers purchasingbehaviorone-commerce website.
Key Words: (COVID-19, Pandemic, E-Commerce, PurchasingBehaviour
1. INTRODUCTION
Nowadaysinthemoderneraoftechnologypeoplerapidly getting dependent on purchasing product from various ecommercewebsite.ButinthispandemicsituationofCOVID19thisdependencyhasincreased.Duetosafetyconsumers arepreferringtopurchaseproductsfromonlineratherthan purchasefrommarketinthiscurrentsituation.Ontheother hand,e-commercesitesarealsodevelopingandgrowingata goodnumberdaybyday.Duringpandemichumanityfaced severe problems due to staying at home. So, they had to purchase things online to survive. Clothes, foods and all othernecessarygoodshadtoorderonline Asdependencyis increasing,theownersofthesee-commercesitesshouldbe more alert about their services and products. This improvementcanbemademorepreciselyiftheholdersof this sites have an average idea about the consumers purchasingbehaviour.Thisresearchworkwillhelpthemto have an overview knowledge of consumer needs in this currentpandemicsituationsothattheycanimprove their service according to this. Our proposed system can easily predictthedemandofaproductbeforeaddingtheproduct one-commercewebsite.
1.1 Motivation
Analyzing the importance of e- commerce websites in the recentsituationofCOVID-19pandemicandsomeconcerned researchpaper,wehavemotivatedtoworkonthistopicand thatispredictionoftheconsumerpurchasingbehaviouronecommerce website during Covid-19 pandemic. Some significantissuesnoticedbyusnotanalyzedyet:
-Determination of the consumers purchasing behavior accordingtotherecentsituationofCOVID-19pandemicfrom e-commercewebsites.
-Comparisonoftheconsumerspurchasingbehaviorduring pandemicandbeforepandemicsituation.
2. Literature Review

Customer purchasing behavior is an important and interesting issue in the field of digital marketing or ecommerceservice.Generatingthisresearchwork wehave reviewedheresomerelatedpapers.
In paper [1] consumer purchasing behavior of an ecommerce website is estimated by tracking the usage and sentiments attached to their products. Some data-driven marketing tools are used here such as data visualization, natural language processing and machine learning models that help in understanding the demographics of an organization.
Accordingtothepaper[2]apredictiveframework,Customer Purchase Prediction model (COREL) has created for determiningcustomerpurchasebehaviorinthee-commerce context. This model works in two stages, when a product purchasedbyaparticularconsumerissubmittedtoCOREL, theprogramcanreturnthetopnproductsmostlikelytobe purchasedbythatcustomerinthefuture.
Similarly in paper [3] the authors employed collaborative filteringtopredictauser'sselectionofanewadvertisement basedontheuser'sviewinghistory.Therecommendations are made using the N-CRBM model (neighborhood conditional RBM) with joint distribution conditional on similarityandpopularityofscoresoftheneighboringusers.
Paper[4]usescustomer’spurchaseandclickhistorytobuild customer’s profile and then incorporate the profile into a one-classCFmodel.Thefactorizingresultsofthemodelare usedtomakeproductrecommendation.
In paper [5] Sentimental Analysis of comments on social media for predicting the person's mood which can further affectthestockprices.Theauthorscategorizedtheperson's mood into happy, up, down,and rejected,and the polarity indexiscalculatedwhichisfurthersuppliedtoanartificial neuralnetworktopredicttheresults.
In paper [6] Sentimental Analysis can be used to extract meaningful insights from customer reviews and feedback. Previousstudieshavefocusedonthesentimentalanalysisof micro-blogservicessuchasTwitter.Thesentimentsattached to tweets are analyzed and classified into positive and negativesentiment.
Inthepaper[7]apredictionmodelisproposedtoanticipate theconsumerbehaviorusingmachinelearningmethods.Five individualclassifiersandtheirensembleswithBaggingand Boosting are examined on the dataset collected from an online shopping site. The results indicate the model constructed using decision tree ensembles with Bagging achievedthebestpredictionofconsumerbehaviorwiththe accuracyof95.3%.
In online based shopping platform, the purchasing behavior of the consumers has a great impact The knowledge-basedeconomyhasgottenalotofhyperecently, especially in online shopping apps that track all of the transactionsandcustomerfeedback.
3. Methodology
Totalresearchworkisaccomplishedinsomestages.Scraping the datasetofconsumers purchasing behavioratCovid-19 pandemic situation. Then removing the junk values all the datasetispreprocessedandvalidfeaturesfromthedatasetis selectedtoperformtheresearchwork.Afterexploringallthe dataset, selected features are visualized with different prospect.Nowtheresearchworkisproceededaftertraining theselecteddatawithdifferentmachinelearningalgorithms and purchasing behavior at this pandemic situation is predicted.
3.1 Overview of Proposed Methodology
Toimplementthistask,firstwecollectedahugeamountof data from different online sources. Then, we analyzed the dataset to determine which features were useful for our specific requirements. We then selected those features to makeourproposedsystemeffective.Wealsotookhelpfrom RandomForestalgorithmtoselectthebestsuitedfeatures forourproposedmethod.
ThenwevisualizedourpreprocesseddatausingPythonand different python libraries to understand the demand of differentproductsthoseweresoldonline.Byvisualizingthe datasetinsuchaway,wegotaclearconceptionaboutthe relationbetweenconsumerbehavioranddifferentonlineecommerce services. Wetook thehelp ofpie chartand bar charttounderstandtheconsumerbehaviorgraphicallythat canbeusedtomakepeopleunderstandeasily.
Afterthat,wetrainedourpreprocesseddatasetwithsome classification machine learning algorithm. 70% data were usedtotrainourmodelandtheremaining30%datawere usedtotestthevalidityofourmachinelearningalgorithm. Thus,wecreatedatrainedmodelthosewereusedtopredict theconsumersbehaviorduringpandemicsituation.

3.2 Data Preprocessing
Collected datasets generally appears with unnecessary values. These values should be removed to get the better performance without affecting the contribution of trained modelsthatpredicttheoutcome.
3.2.1 Datasets
We have considered here the dataset of consumers purchasing behavior during Covid-19. The source of this datasetisKaggle.Thereweredifferentdatasetsinrelevance ofourrequirements.Butweintentionallyselectedthisone becauseofthedataquantity.Otherdatasetswereavailable but the data quantity were so little that those were not enoughtoproperlytrainourmachinelearningmodel.
3.2.1 Feature Selection
Performing this research some concerned features are selected. Selected features are Event Time, Event Type, ProductId,CategoryId,CategoryCode,Brand,Price,UserId andUserSession.
3.2.2 Data Conversion into Appropriate Forms
Conducting the research work more precisely some data shouldbeconvertedintoaneligibleform.ThevalueofEvent Type,CategoryCodeandBrandneedstobeconvertedinto numericvalue.
3.2.2 Missing Value Handle
After collecting data, there remains some missing values presentinthedataset.Someanomaliesisobservedwhenwe trainthedatasetwithmissingvalues.Because,thesemissing valuescreatessomeanomaliesornoiseinourtrainedmodel. So,wemustremovethemfromthedataset.Missingvalues fromthedatasetshouldbefilledusingthemeanormedian function.
3.2.2 EXPLORATORY DATA ANALYSIS
In this section we have analyzed our dataset in different aspecttoperformtheresearchinasoundway.
3.2.2.1 Category vs Total Number of Ordered Product

HerethisPieChartrepresentsthetotalnumberofordered products against that product category. This chart also expressTopCategoriesofthedatasetwhichproductorder morethan10,000.Amongthetopcategorieswecanseethat, total number of orders were the most for the electronic devices like smartphones, computers, notebooks, laptops and other electronic accessories. The least ordered categorieswerehouseapplianceslikerefrigerators,vacuum, air_heater,kitchenwasherandotherhomeappliances.
vsOrders
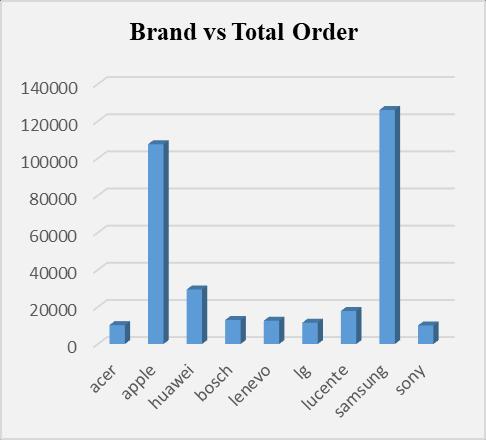
3.2.2.2 Brand vs Total Number of Ordered Product
This Bar Chart represents the number of total ordered products against the product’s Brand. It also express Top Brands of the dataset which product order more than 10,000.Amongthetopbrandswecanseethat,totalnumber oforderswerethemostforthebrandappleandsamsung. Peoplebelievedtheirproductmuchotherthanthebrands mentioned later during pandemic situation. The least orderedbrandswereLenovo,Lg,Sonyandotherbrandslike these.

3.2.2.3 Purchase from E- Commerce Sites Before Covid-19 Pandemic vs During Pandemic
Here we have analyzed the purchasing rate from the ecommerce sites before the pandemic situation and during the Covid-19 pandemic situation. Analyzing this we have representeditwithagraphicalcurve.Accordingtothecurve we have explored that at the year of 2019 when the pandemicsituationnotoccurredthenthepurchasingrateof the products from e- commerce websites is less than the currentpandemicsituation.Graduallythesituationbecame worst and spread all over the world and lockdown took placetodecreasetheoutbreak.

People started getting dependent on e-commerce sites to purchasetheirdailylifeneeds.Fromgraphwecanvisualize thatproductpurchasingratehasincreasedintheyear2020. Conducting the research work more precisely some data shouldbeconvertedintoaneligibleform.ThevalueofEvent Type,CategoryCodeandBrandneedstobeconvertedinto numericvalue.
4. Result Analysis
Analyzingtheconsumerbehaviorforpurchasingproducts wehaveusedheresomeMachineLearningAlgorithmsand shows3casesforpurchasingobservedhere-onlyview,add to cart or purchase. Resulted output 1 indicate that the productisonlyviewbytheconsumer,2indicatesthatthe productisaddedtocartand3indicatesthattheproductis purchased by the consumer. Here the input attributes are category,brandandpriceandtheoutputattributeisevent type (consumer purchasing behavior). Used Machine Learning Algorithms are – Linear Regression, Logistic Regression, Support Vector Machine (SVM), K-Nearest Neighbor(KNN),RandomForestandNaïveBayes.
4.1 Linear Regression
Whenmodelingtheconnectionbetweenascalaranswerand oneormoreexplanatoryfactors,linearregressionisalinear method.Futurepredictionsmaynowbemadescientifically andwithhighreliabilityusinglinear-regressionmodels.The features of linear-regression models are well understood andcanbetrainedextremelyrapidlysincelinearregression isastatisticaltechniquethathasbeenaroundforaverylong time.
4.2
Consumers Purchasing Behavior
4.3
Table4.2.Predictedresultofconsumerpurchasing behaviorbyLogisticRegression.
Consumers Purchasing Behavior
AlthoughtheK-NNapproachismostfrequentlyemployed forclassificationissues,itmayalsobeutilizedforregression. Since K-NN is a non-parametric technique, it makes no assumptions about the underlying data. The KNN method simplysavestheinformationduringthetrainingphase,and whenitreceivesnewdata,itcategorizesitintoacategory thatisquitesimilartothenewdata.
Table4.4.Predictedresultofconsumerpurchasing behaviorbyK-NearestNeighbor(KNN).
Consumers
4.5 Random Forest
Table4.5.Predictedresultofconsumerpurchasing behaviorbyRandomForest. Consumers
4.6 Naive Bayes
Table4.6.Predictedresultofconsumerpurchasingbehavior
byNaiveBayesConsumers Purchasing Behavior
Technologies, and Optimization (Trends and Future Directions)(ICRITO),Nodia,2016.
[6] B.R.Chamlertwat,"Discoveringconsumerinsightfrom twitter via sentiment analysis," Journal of universal computerscience,pp.973-992,2012.
[7] F.Safara,"AComputationalModeltoPredictConsumer BehaviourDuringCOVID-19Pandemic,"Springer,2020.
BIOGRAPHIES
B.Sc.inCSEfromPSTU
M.Sc.inCSITfromPSTU Research Interest: Data Science, Machine LearningandDataMining.
Email:muhtasim222@gmail.com
4. Conclusion
The main objective of this research work is to assist the ownersoftheE-commercewebsites.Asthedependencyon e-commerce is increasing at the Covid-19 pandemic accordingtothisresearchtheywillbeabletoknowabout the consumers purchasing choice and analyze about their products.Consumerspurchasingintentionshelptheowners tohaveapreciseknowledgeandmakeproperschemeabout theirproductsusingconsumer’ssentiment.Hereconsumer’s behavior is visualized in various aspects and different machine learning algorithms are used to identify their shoppingdemands.WefoundthatRandomForestalgorithm provides the better prediction than any other algorithms. Such factors identified by the owners of e-commerce organizationswillhelpthemtakenecessarystepstoprovide a better service to the consumers and add more lifetime valuetotheirbusiness.
REFERENCES
[1] J.S.H.S.D.M.V.VishwaShrirame,"ConsumerBehavior AnalyticsusingMachineLearningAlgorithms,"inIEEE, India,2020.


[2] Z. L. Y. L. Jiangtao Qiu, "Predicting customer purchase behaviorinthee-commercecontext,"Springer,2015.
[3] U. Z. A. A. L. T. Ben Yedder, "Modeling prediction in recommender,"inIEEE,2017.
[4] J. H. C. Z. Y. C. Yanen Li, "Improving one-class collaborative filtering by incorporating rich user information," in ACM International Conference on InformationandKnowledgeManagement,2010.
[5] S.K.K.a.A.Srivastava,"Usingsentimentalanalysisin," in5thInternationalConferenceonReliability,Infocom
B.Sc.inCSEfromCUET Research Interest: Internet Security, Machine LearningandNLP
Email:redoanulroni@gmail.com
B.Sc.inCSEfromDUET Research Interest: Deep Learning, Machine Learning and Image Processing
Email:sumanalicse@gmail.com
B.Sc.inCSEfromPSTU
M.Sc.inCSITfromPSTU Research Interest: Data Science, Machine LearningandDataMining.
Email:sourovhossen96@gmail.com