An exploration of the latest market shifts, buyer behaviors, and investment patterns shaping the Phoenix real estate landscape.
Overall Insights
1 A concise and insightful breakdown of the Phoenix Metro real estate market
3-4 A deep dive into detailed market data, analyzing past and present trends for a comprehensive perspective Highlights
2 Leveraging The Cromford Index™ to assess supply and demand dynamics through critical market metrics
OVERALL INSIGHTS
As of June 1, 2025, the Arizona housing market is showing signs of cooling compared to the same time last year Active listings have risen sharply, up 47% year-over-year, while pending and under-contract listings have declined Monthly sales are also down 6.6%, although that drop is partly explained by fewer working days in May 2025 versus May 2024. Overall, demand has weakened, while supply growth is slowing, largely due to fewer new listings hitting the market
Price trends are somewhat mixed. The average sales price per square foot ticked up 0.8% from last year and 0.3% from last month, but this was heavily influenced by a higher proportion of luxury home sales in May Median sales prices saw a stronger increase of 2 2% month-overmonth, which may not be sustainable. The Cromford® Market Index sits at a notably low 73, indicating a weak market for sellers, although not one in crisis
Mortgage rates remain stubbornly high near 7%, though some homebuilders are offering rate buydowns to attract buyers, often aiming for rates near 4.99%. This has helped some buyers move forward despite affordability pressures, but overall, builders have not had the spring sales performance they were hoping for
Luxury real estate has become increasingly detached from the broader market, mirroring movements in the stock and crypto markets After a sluggish April, luxury homes over $3 million performed well in May, even as supply in this tier fell due to increased demand. However, these transactions remain a small portion of the overall market.
Looking ahead, market balance will largely depend on whether new listing activity stays suppressed. If it does, it may help stabilize conditions for sellers. Price forecasts suggest a slight rebound, with a projected average sales price per square foot of $296.56 by mid-June. However, the broader trend over the past two months has been one of declining price per square foot, and while a pause is expected, the market remains vulnerable to further softening.
PRESIDENT & BROKER OF RECORD
HIGHLIGHTS
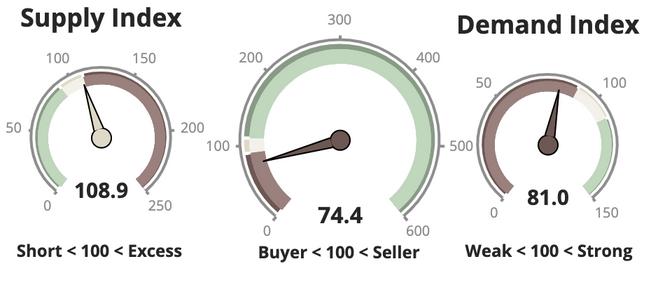
SUPPLY TREND
The Supply Trend Index has has increased slightly.
MARKET INDEX
The 100 mark represents the index value for a balanced market. A value above 100 represents a market that favors a seller. A value below 100 represents a market that favors a buyer
DEMAND TREND
The Demand Index Trend has decreased slightly.
TRENDS
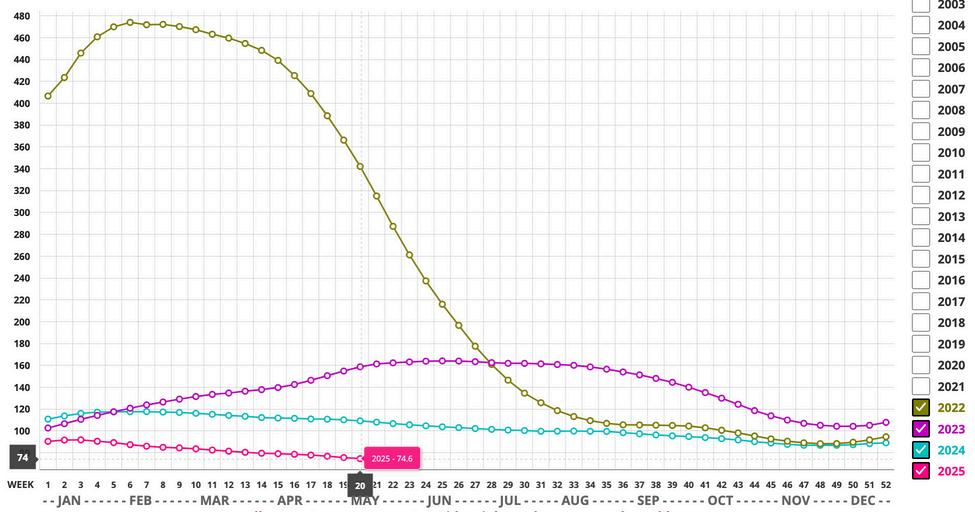
CROMFORD MARKET INDEX
MARKET HIGH
The Market Index was 514 at the height of the market in May 2021.
EXPECTATIONS
The Cromford® Market Index is down to 73 and we consider this unusually low. Yes, we saw much lower values in the CMI during the crash of 2006-2009 but we are not in a crash situation.
MARKET LOW
In the late Spring of 2022, the market decelerated quickly. A Market Index of 88.3 was seen in December 2022
PRICING
The monthly median sales price decreased by 1.1%. The monthly average price per square foot trends down 2.4% YOY.
INVENTORY
Active listings (excluding UBC) are up 53% YOY and months of inventory is up 46.7% from 3.1 to 4.5 months YOY.
VOLUME
Overall volume of residential sales for the year is up 1% compared to May 2024.
Questions or Comments? Email Report author: Nicole Kobrinsky at nicole@housegallery com
6901 East 1st St Suite 103 Scottsdale, Arizona 85251 480 808 1223 | housegallery com
IF YOUR PROPERTY IS CURRENTLY LISTED WITH ANOTHER REAL ESTATE BROKER, OR YOUR ARE UNDER A BUYER REPRESENTATION CONTRACT WITH ANOTHER REAL ESTATE BROKER, PLEASE DISREGARD THIS OFFER IT IS NOT OUR INTENTION TO SOLICIT THE OFFERINGS OF OTHER REAL ESTATE BROKERS