HOUSE
R E P O R T
EXPERT GUIDANCE
Navigate this year’s market with confidence
INDUSTRY INSIGHT
Reflections from advisory CEO & Broker, Nicole Kobrinsky
Copyright February © 2025
TRENDS
A look at which trends to watch
Overall Insights
1 A quick and insightful look at the realities of the real estate market in Phoenix Metro
Highlights
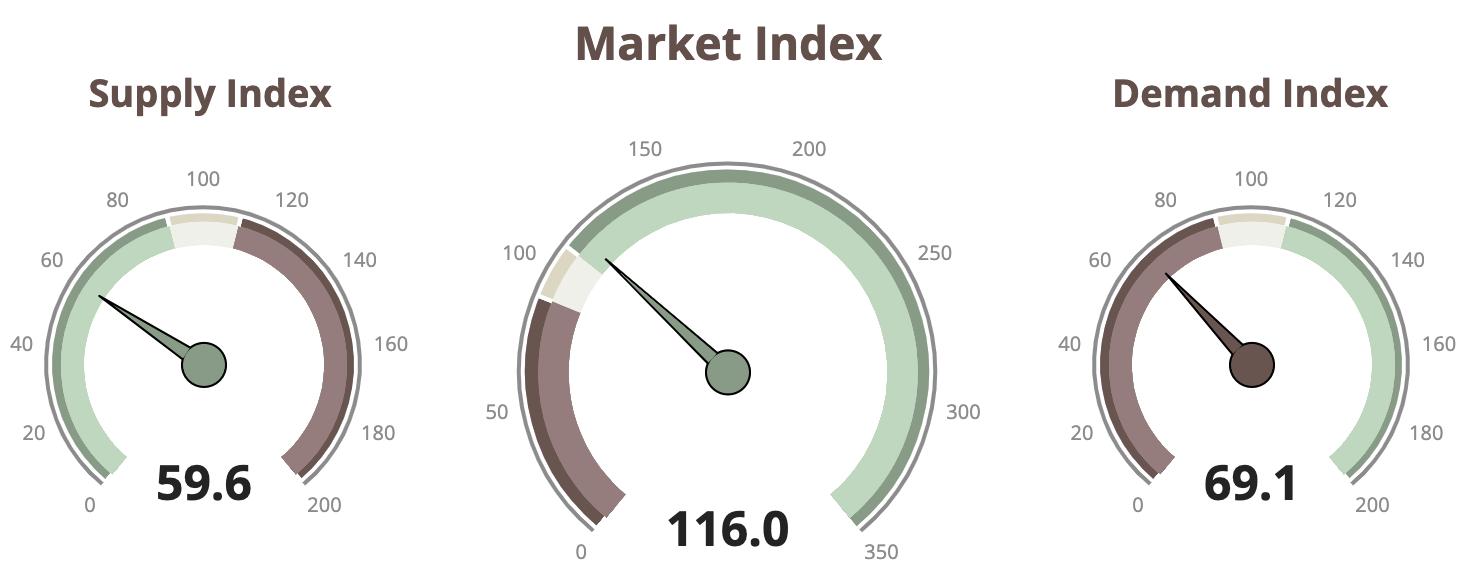
2 We utilize The Cromford Index™ which is a set of market indicators to measure the balance of supply and demand
3-4 A comprehensive look at more detailed market statistics from a past and current perspective
OVERALL INSIGHTS
There is significant bad news for sellers in the active listing counts Active listings jumped over 12%, worsening conditions for sellers as buyers have ample choices, compared to a 7% increase last year Closings rose 5 5% year-over-year, but contract listings grew only 35% in January 2025, down from 45% in 2024.
In contrast, the news on pricing is deceptively good. The average price per sq. ft. has risen a colossal 8.4% over the past 2 months and 8.8% over the past year. Almost all the annual increase has happened in the last 2 months This news is accurate mathematically, but needs to be treated with extreme caution The top end of the market has been on fire over the last 2 months with closed sales up dramatically compared with a year earlier. The higher up the price range you go, the more startling the increase in sales volumes.
In the past two months, there have been 142 closings of homes over $3 million, with an average price of $864 per sq ft , compared to 92 closings and $801 per sq ft last year
For homes over $6 million, there were 35 closings at an average of $1,047 per sq. ft., up from 9 closings at $1,074 per sq. ft. last year.
These high-end sales are much higher than the rest of the market, with closings over $6 million up 289%.
This small number of closings has an out-sized effect on the overall average price for the market as well as the average price per square foot It has only a tiny effect on the median sales price. In these circumstances the median sales price is a much more accurate indicator of price movements for the bulk of the market. The monthly median sales price has barely moved over the last 3 months Although it bumped up to $453,500 on Feb 1, it is back down to $450,000 again today
Although interest rates are off their heights, the key 30-year fixed rate is still a little over 7% and the Federal Reserve has little appetite for further cuts. At this stage, there seems to be more chance that buyers will have to get used to these rates than there is of rates coming down significantly. We therefore expect demand to stay subdued and supply to continue to rise, though perhaps not as strongly as it did in January.
The Cromford® Market Index is in a slow falling pattern which is likely to persist during February. There is nothing obvious in the near term to disturb that trend
There is a wide difference in market balance between the cheaper and more far-flung areas of the valley and the more expensive areas closer to Phoenix itself. Meanwhile, the high-end market will continue to be a law unto itself, but it has almost no impact on the market below $1 million There is no trickledown effect here High-end buyers pay little attention to mortgage rates and are influenced more heavily by how their stocks and other investments are performing.
If the stock market and/or crypto markets were to cool, then this may take some wind out of the sails for the housing market over $3 million. If they don't cool then the topend housing market probably won't slow down either. We should remember that expensive homes have much more tangible value than many investments that exist only in the digital world, but they are not totally immune to volatility.
PRESIDENT & BROKER OF RECORD
DATA SOURCE: ARIZONA REGIONAL MULTIPLE
TRENDS
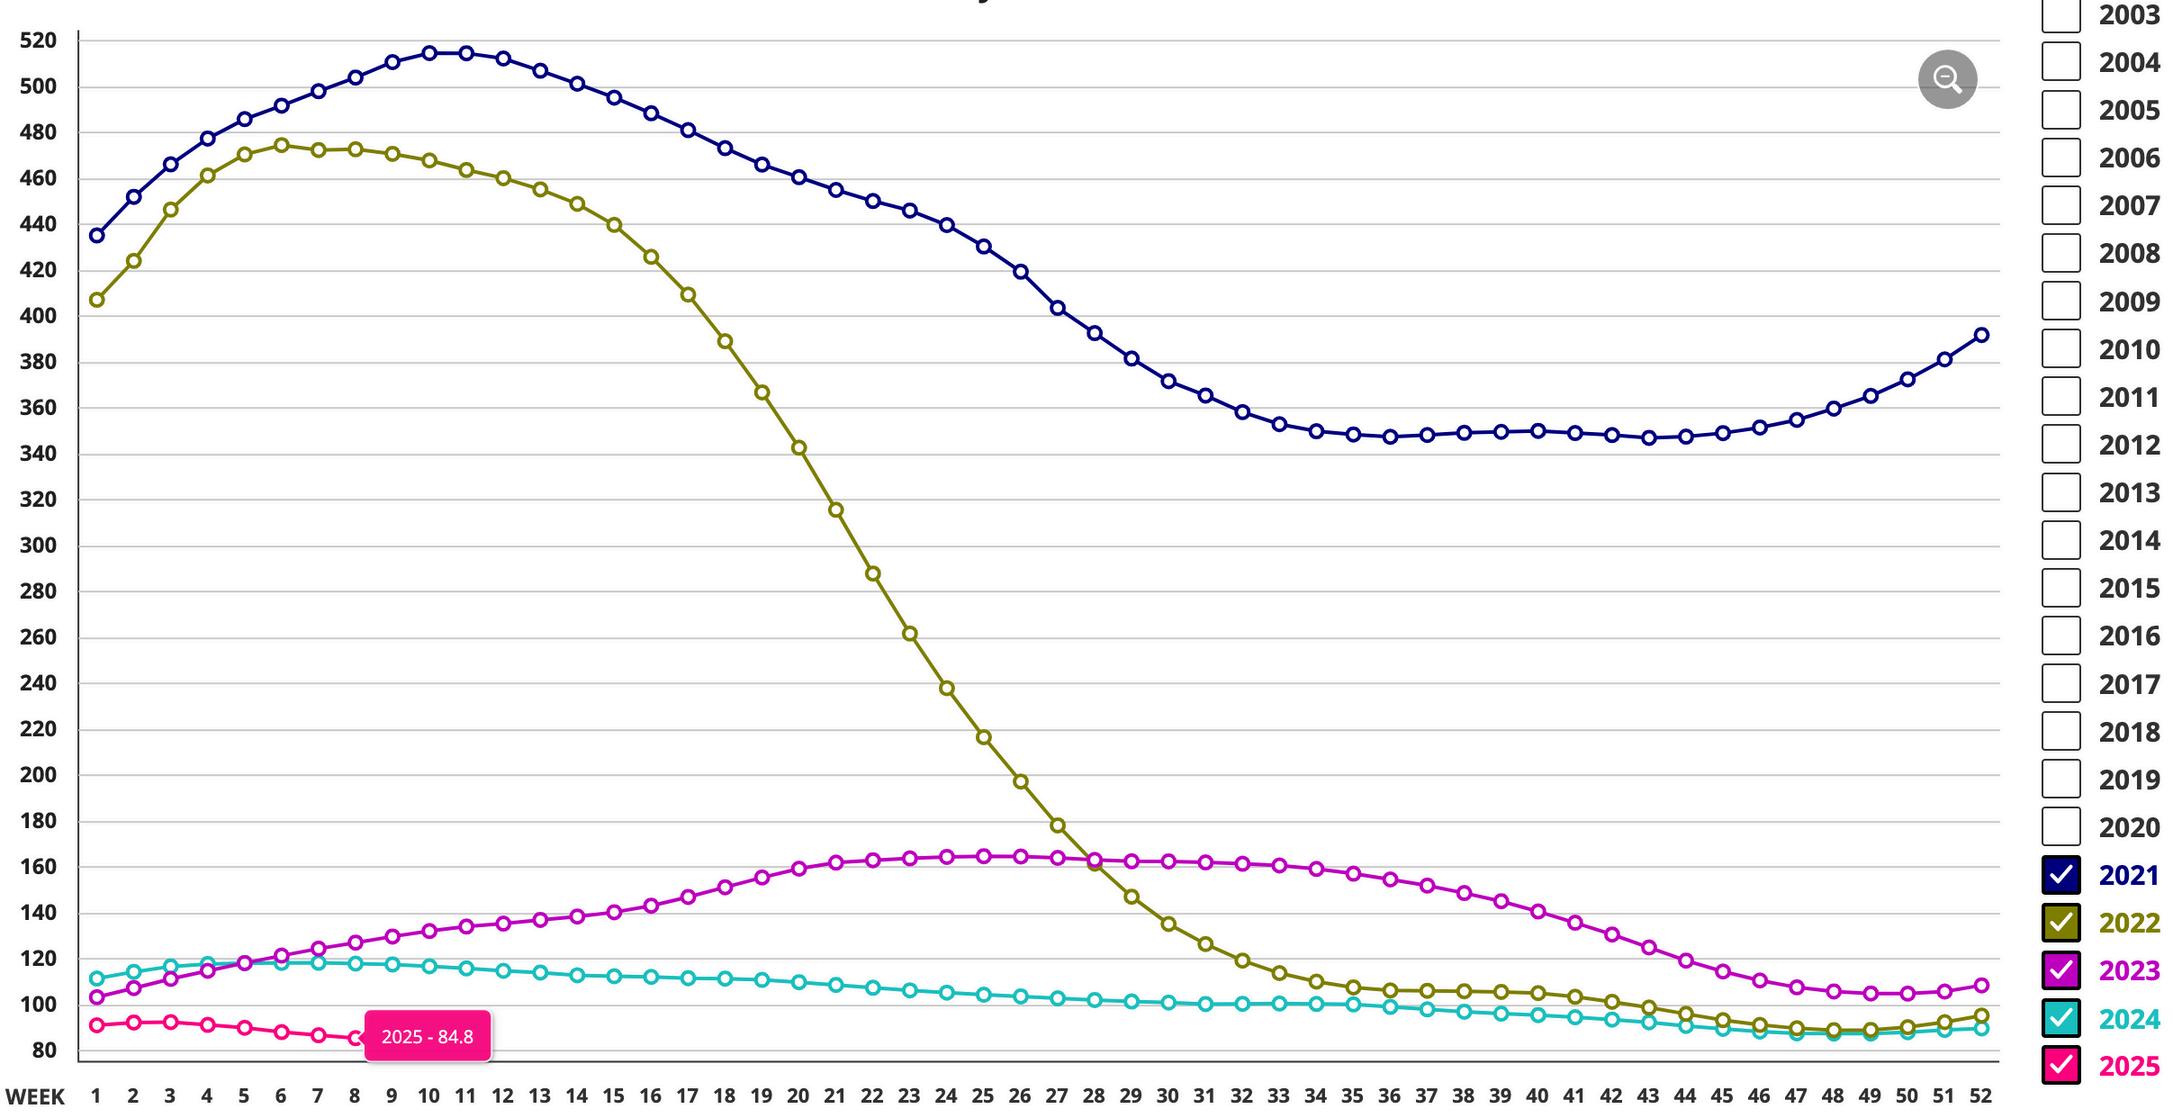
CROMFORD MARKET INDEX
MARKET HIGH
The Market Index was 514 at the height of the market in May 2021
EXPECTATIONS
The Cromford® Market Index is in a slow falling pattern which is likely to persist during February. There is nothing obvious in the near term to disturb that trend. Meanwhile, the high-end market will continue to be a law unto itself,
MARKET LOW
In the late Spring of 2022, the market decelerated quickly A Market Index of 88.3 was seen in December 2022. We appear to be in a similar market two years later.
PRICING
The monthly median sales price increased by 0 8% The monthly average price per square foot trends up 8.8% YOY. Pricing is trending slightly upward but generally remains stable.
INVENTORY
Active listings (excluding UBC) are up 44% YOY and months of inventory is up 41.9% from 3.1 to 4.4 months YOY.
VOLUME
Overall volume of residential sales for the year is up 0 7% compared to February 2024.
Questions or Comments? Email Report author: Nicole Kobrinsky at nicole@housegallery com
6901 East 1st St Suite 103 Scottsdale, Arizona 85251
(480)808-1223 | housegallery com
© 2025 HOUSE GALLERY COLLECTIVE. ALL WORLDWIDE RIGHTS RESERVED. ALL MATERIAL PRESENTED HEREIN IS INTENDED FOR INFORMATION PURPOSES ONLY WHILE, THIS INFORMATION IS BELIEVED TO BE CORRECT, IT IS REPRESENTED SUBJECT TO ERRORS, OMISSIONS, CHANGES OR WITHDRAWAL WITHOUT NOTICE THIS INFORMATION IS BASED ON DATA FROM ARIZONA REGIONAL MULTIPLE LISTING SERVICE, INC (ARMLS), CROMFORD ASSOCIATES LLC , REALTORS PROPERTY RESOURCE®, LLC AND INTERPRETED BY HOUSE GALLERY COLLECTIVE, LLC DATA HAS BEEN LIMITED TO SALES REPORTED WITHIN THE COUNTY OF MARICOPA BOUNDARIES
IF YOUR PROPERTY IS CURRENTLY LISTED WITH ANOTHER REAL ESTATE BROKER, OR YOUR ARE UNDER A BUYER REPRESENTATION CONTRACT WITH ANOTHER REAL ESTATE BROKER, PLEASE DISREGARD THIS OFFER IT IS NOT OUR INTENTION TO SOLICIT THE OFFERINGS OF OTHER REAL ESTATE BROKERS