An exploration of the latest market shifts, buyer behaviors, and investment patterns shaping the Phoenix real estate landscape.
Overall Insights
1 A concise and insightful breakdown of the Phoenix Metro real estate market
3-4 A deep dive into detailed market data, analyzing past and present trends for a comprehensive perspective Highlights
2 Leveraging The Cromford Index™ to assess supply and demand dynamics through critical market metrics
OVERALL INSIGHTS
Each month about this time we look back at the previous month, analyze how pricing has behaved and report on how welforecasting techniques performed We also give a forecast for how pricing will move over the next month
As of March 15, the average sales price per square foot (PPSF) across ARMLS is $314.40, up 0.7% from February 15 ($312.16). Our forecast had predicted a decline, but prices remained stronger than expected.
Even the median sales price has moved upwards over the past month as closing volumes were much stronger for the more expensive sectors of the market and relatively weak for the affordable sectors.
As of March 15th, pending listings averaged $334.28 per square foot, unchanged from February 15th, indicating stable prices through mid-April Foreclosure activity remains low, with 98 7% normal sales, 0 4% REOs, and 0 9% preforeclosures (including a few short sales), similar to last month
Our mid-point forecast for the average monthly sales $/SF on March 15 is $313.01, which is down 0.4% from the March 15 reading. We have a 90% confidence that it will fall within ± 2% of this mid point, i.e. in the range $306.75 to $319.27.
However we are seeing weakness in the average price per square foot for active listings This measure tends to adjust months before measurement of closing prices, for obvious reasons. It is very unusual for the $/SF for active listings to fall during this time of year. We are therefore not optimistic that the current strength in closing prices can be sustained indefinitely.
There were 20 working days in February 2025 and 21 in February 2024, so we should allow for the fact that there was 4 8% less time for title companies to close transactions in 2025 In this light, the sales numbers in 2025 look more positive
The active listing counts continue to rise but at least they did not rise quite as fast as in January. Interest rates have eased to around 6.75% for the 30 year fixed, and demand has started to improve. The problem for sellers is that supply is growing faster than demand so getting a successful sale gets a little harder each day. Conversely for buyers, their negotiation leverage gets a little better each day
None of this applies to the very top end of the market which is running under new rules. There is strong demand for ultraluxury homes from wealthy buyers who pay scant attention to interest rates. The activity at this level is skewing the average price per sq ft which would be much lower if sales over $3 million are excluded There were 73 closed sales over $3 million, just over 1% of all transactions, but excluding them drops the average $/SF by 7% to $291 from $313. Those 73 sales over $3 million closed at an average of $882 per sq. ft.
Pricing is under downward pressure in areas with a large excess of supply, such as Maricopa, Buckeye and other outlying areas with plenty of new builds for re-sale homes to compete with But in much of the market pricing is holding strong. Even in a balanced market we would expect home prices to rise with inflation. We anticipate inflation to increase in 2025 from the more moderate pace of 2024.
Nicole Kobrinsky PRESIDENT & BROKER OF RECORD
SOURCE: ARIZONA
HIGHLIGHTS
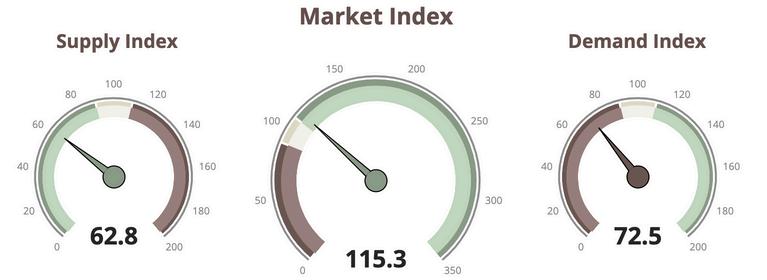
MARKET INDEX
SUPPLY TREND
The Supply Trend Index has has increased 3.2 pts since last month.
The 100 mark represents the index value for a balanced market. A value above 100 represents a market that favors a seller. A value below 100 represents a market that favors a buyer The Market Index Trend is down 7 5 pts in the last month.
DEMAND TREND
The Demand Index Trend is up 3.4 pts in the last month
TRENDS
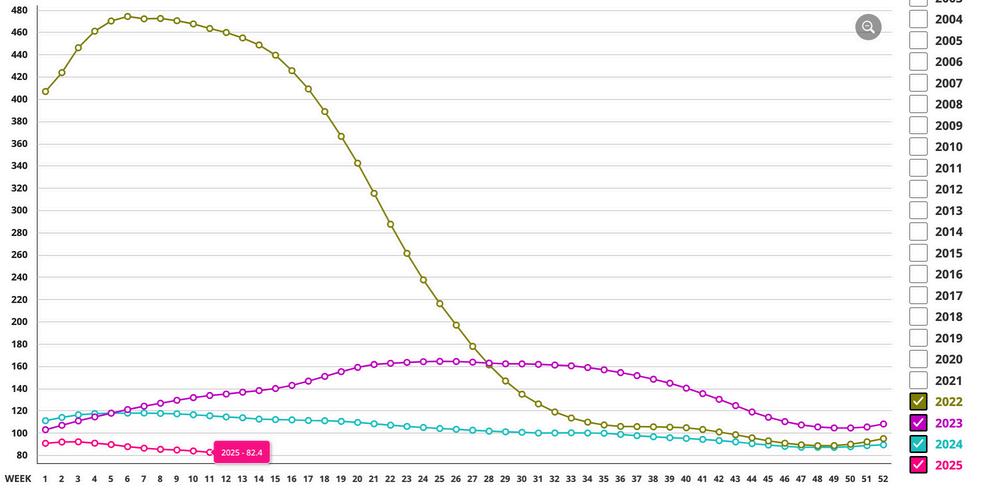
CROMFORD MARKET INDEX
MARKET HIGH
The Market Index was 514 at the height of the market in May 2021.
EXPECTATIONS
The Cromford® Market Index is in a slow falling pattern which is likely to persist during March. There is nothing obvious in the near term to disturb that trend. Meanwhile, the high-end market will continue to be a law unto itself
MARKET LOW
In the late Spring of 2022, the market decelerated quickly. A Market Index of 88.3 was seen in December 2022 We appear to be in a similar market two years later.
PRICING
The monthly median sales price increased by 1.3% The monthly average price per square foot trends up 6.8% YOY. Pricing is trending slightly upward but generally remains stable.
INVENTORY
Active listings (excluding UBC) are up 44% YOY and months of inventory is up 39.3% from 2.8 to 3.9 months YOY.
VOLUME
Overall volume of residential sales for the year is down .01% compared to March 2024.
Questions or Comments? Email Report author: Nicole Kobrinsky at nicole@housegallery com
6901 East 1st St Suite 103 Scottsdale, Arizona 85251 480 808 1223 | housegallery com
IF YOUR PROPERTY IS CURRENTLY LISTED WITH ANOTHER REAL ESTATE BROKER, OR YOUR ARE UNDER A BUYER REPRESENTATION CONTRACT WITH ANOTHER REAL ESTATE BROKER, PLEASE DISREGARD THIS OFFER IT IS NOT OUR INTENTION TO SOLICIT THE OFFERINGS OF OTHER REAL ESTATE BROKERS