An exploration of the latest market shifts, buyer behaviors, and investment patterns shaping the Phoenix real estate landscape.
Overall Insights
1 A concise and insightful breakdown of the Phoenix Metro real estate market
3-4 A deep dive into detailed market data, analyzing past and present trends for a comprehensive perspective Highlights
2 Leveraging The Cromford Index™ to assess supply and demand dynamics through critical market metrics
OVERALL INSIGHTS
For the monthly period ending July 15, we are currently recording a sales $/SF of $288.76 averaged for all areas and types across the ARMLS database. This is down 3.8% from the $299 96 we now measure for June 15 Our forecast range mid-point was $295 49 We correctly forecast a drop from mid-May to midJune but significantly underestimated the size of the decline. In fact the fall was so severe that it exceeded the 90% confidence boundary to the downside. A combination of seasonal effects and the buyer's market conditions is causing pricing to weaken noticeably
On July 15 the pending listings for all areas and types show an average list $/SF of $319.64, up 0.1% from the reading for June 15. This suggests that closed prices are likely to stabilize during the next 4 to 5 weeks Among those pending listings we have 97 9% normal, 0 7% in REOs and 1 7% in pre-foreclosures (including a very small number of short sales). The level of distress is the highest we have recorded since January 2020 more than 5 years ago, but remains low by long-term standards
Our mid-point forecast for the average monthly sales $/SF on August 15 is $288.77, which is up 1 cent or 0.04% from the July 15 reading. We have a 90% confidence that it will fall within ± 2% of this mid point, i.e. in the range $282.99 to $294 55
Although the Cromford® Market Index for all areas & types is now rising slowly, it remains well below 75, indicating a downward trend for prices overall. Thus the forecast for flat pricing over the next month merely represents a pause after the sharp decline between June and July Our expectation is that pricing will decline again between August and September
The average $/SF for active listings is on a strong downward trend, losing another 3.5% over the last month. The average $/SF for listings under contract has also fallen, but only by 0 4% over the past month It would not surprise me if this forecast proves to be optimistic
Nicole Kobrinsky
PRESIDENT & BROKER OF RECORD
HIGHLIGHTS
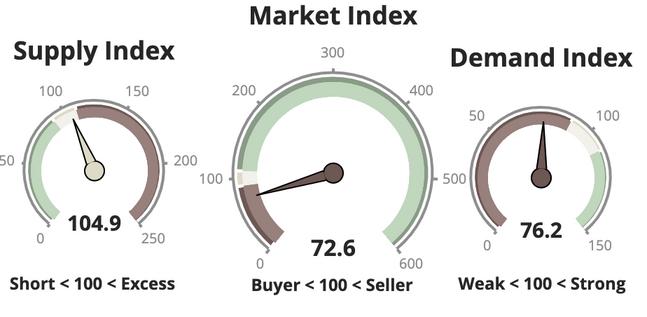
SUPPLY TREND
The Supply Trend Index has has decreased slightly.
MARKET INDEX
The 100 mark represents the index value for a balanced market. A value above 100 represents a market that favors a seller. A value below 100 represents a market that favors a buyer
DEMAND TREND
The Demand Index Trend has decreased slightly.
TRENDS
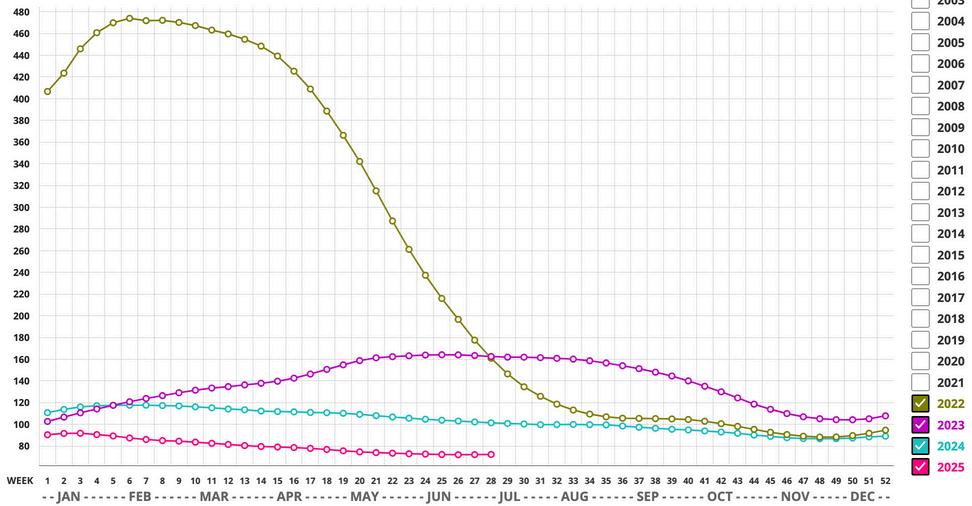
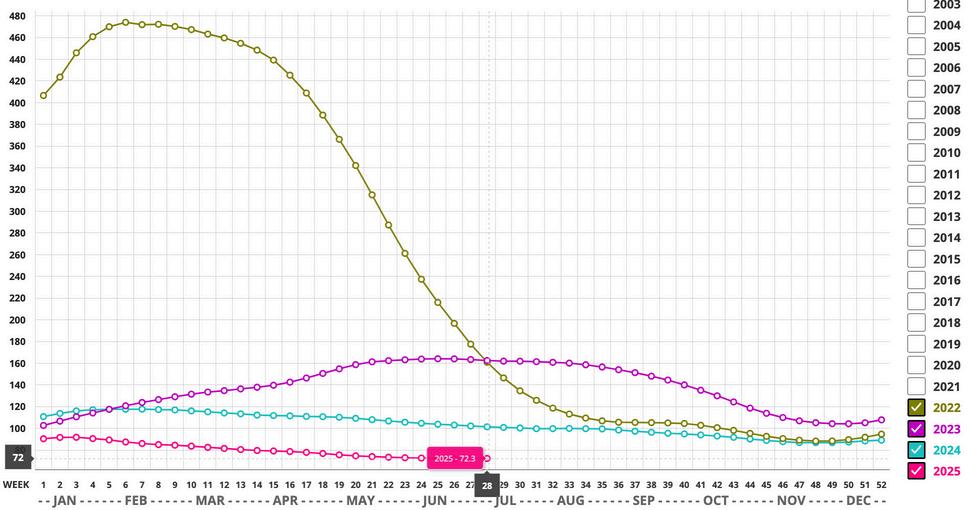
CROMFORD MARKET INDEX
MARKET HIGH
The Market Index was 514 at the height of the market in May 2021.
EXPECTATIONS
The Cromford® Market Index is down to 72 and we consider this unusually low. Yes, we saw much lower values in the CMI during the crash of 2006-2009, but we are not in a crash situation.
MARKET LOW
In the late Spring of 2022, the market decelerated quickly. A Market Index of 88.3 was seen in December 2022
PRICING
The monthly median sales price remained unchanged. The monthly average price per square foot trends down 0.8% YOY.
INVENTORY
Active listings (excluding UBC) are up 42% YOY and months of inventory is up 36.7% from 3.0 to 4.1 months YOY.
VOLUME
Overall volume of residential sales for the year is up 2.5% compared to July 2024.
Questions or Comments? Email Report author: Nicole Kobrinsky at nicole@housegallery com
6901 East 1st St Suite 103 Scottsdale, Arizona 85251 480 808 1223 | housegallery com
IF YOUR PROPERTY IS CURRENTLY LISTED WITH ANOTHER REAL ESTATE BROKER, OR YOUR ARE UNDER A BUYER REPRESENTATION CONTRACT WITH ANOTHER REAL ESTATE BROKER, PLEASE DISREGARD THIS OFFER IT IS NOT OUR INTENTION TO SOLICIT THE OFFERINGS OF OTHER REAL ESTATE BROKERS