E P O R T
EXPERT GUIDANCE
Gain the knowledge needed to confidently make informed real estate decisions in this year’s market with confidence
INDUSTRY INSIGHT
Professional perspective on market movements and investment opportunities from advisory President & Broker of Record, Nicole Kobrinsky
Copyright April © 2025
TRENDS
An exploration of the latest market shifts, buyer behaviors, and investment patterns shaping the Phoenix real estate landscape.
Overall Insights
1 A concise and insightful breakdown of the Phoenix Metro real estate market
3-4 A deep dive into detailed market data, analyzing past and present trends for a comprehensive perspective Highlights
2 Leveraging The Cromford Index™ to assess supply and demand dynamics through critical market metrics
OVERALL INSIGHTS
There is good news and bad news for both sellers and buyers
The active listing counts continue to rise, which is very unusual between March and April, and therefore bad news for sellers, but the rate of increase has at least slowed down. Interest rates have eased to around 6.63% for the 30 year fixed, and demand shows clear signs of improving during March Pending listings are higher than last year and listings under contract are up over 6% The sales count is also stronger (up 2 6% from March 2024) This is encouraging for sellers, and generates more transactions from which agents and title companies get paid The problem remains that even with this higher transaction and contract level, supply is still rising There are simply more sellers than we expected, with year-todate new listings almost 20% higher than this time last year.
Closed pricing is still looking surprisingly strong but once again this is heavily skewed by high-end deals that were agreed before pandemonium hit the stock market. The luxury market is highly dependent on how wealthy people feel about their investments, and they have gone from ebullient in early January to despondent in early April This change is not reflected in closings, but is appears to be making itself felt in active list pricing and under contract counts for the top end of the market
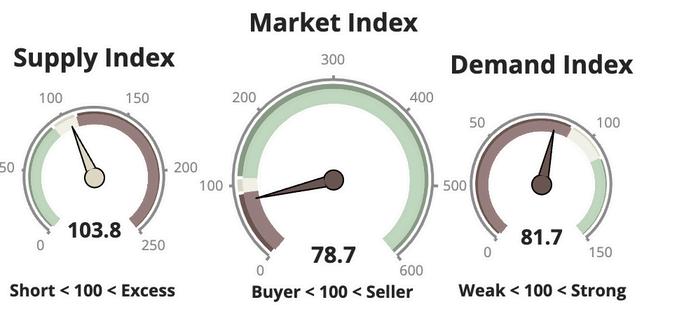
With the Cromford® Market Index now below 80, the downward pressure on prices is building just as inflation starts to tick up again The cost of building a home is rising quickly because so many of the physical components are sourced from abroad, but new home selling prices will have to come down when supply exceeds demand to the extent we are now seeing Despite new home closings in Greater Phoenix reaching the highest level for January and February since 2006, home builders are starting to cut their base prices - KB Home being the first major builder to report doing so Other builders may be hoping that increasing concessions will work, but just one look at the stock charts for homebuilders is enough to paint the picture clearly Lennar is currently down 32% over the past 12 months and DR Horton is down 22% Even Toll Brothers, operating at a much higher median price point, is down 22% from a year ago
Although there are more buyers about at the moment, they have a lot of choice and growing bargaining power, especially in the outlying and less expensive areas. With patience and care, they should be able to secure a good deal if the seller is realistic about market conditions If the seller is unrealistic, there is no harm in walking away.
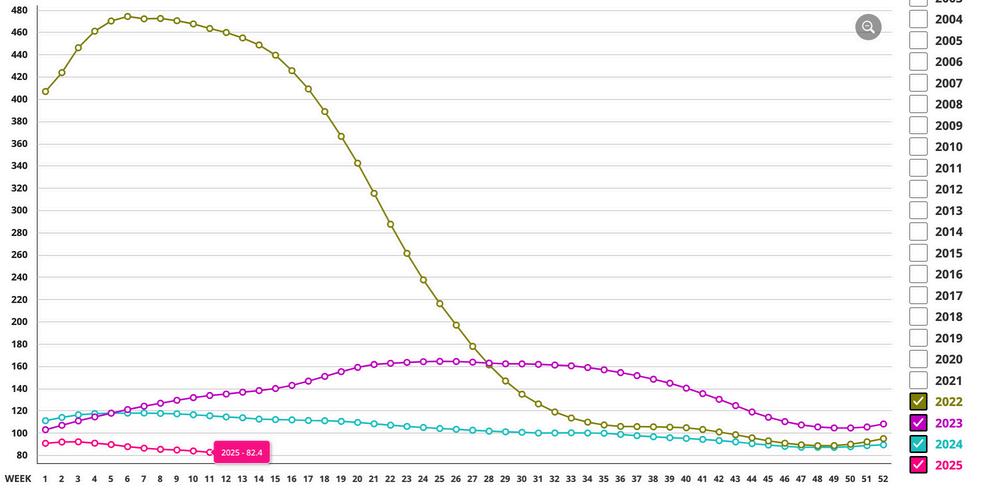
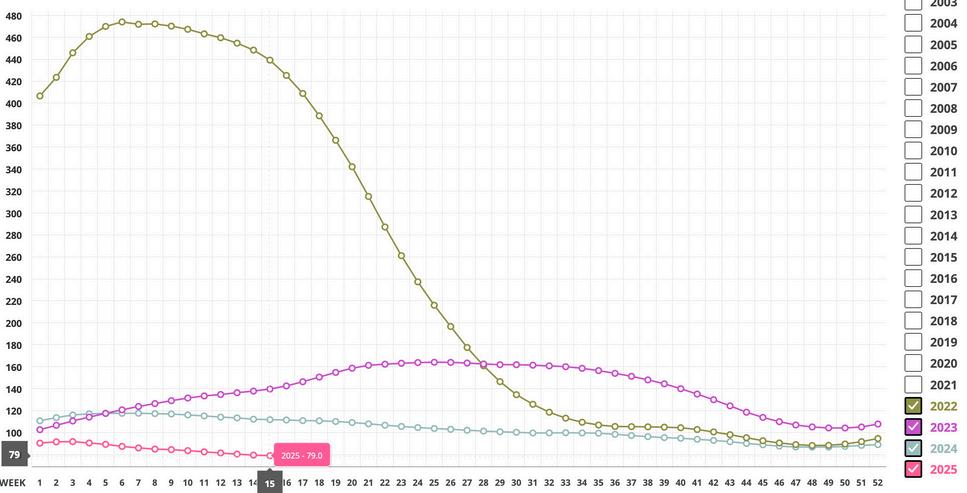
Around mid-month, we review the previous month’s pricing trends and evaluate how accurate our forecasts were For the period ending April 15, the average sales price per square foot across all ARMLS areas and property types came in at $305.88, a notable 2.8% drop from $314.81 on March 15 Our forecast had predicted a decline, but the actual drop was much steeper than expected falling even below the lower bound of our 90% confidence interval That’s a significant reversal from last month’s upward momentum and one that warrants close attention
Supporting this shift, the median sales price also declined sharply from $465,000 to $450,000 a 3 2% drop in just one month, which is unusually steep for this time of year.
On April 15 the pending listings for all areas and types show an average list $/SF of $322 13, down 3 6% from the reading for March 15. This suggests that closed prices will move lower still between now and mid-May. Among those pending listings we have 98.7% normal, 0.5% in REOs and 0 8% in pre-foreclosures (including a very small number of short sales). The level of foreclosure activity is similar to last month and it remains low by long-term standards, though the trend in notices of trustee sale is moving steadily upwards.
Our mid-point forecast for the average monthly sales $/SF on May 15 is $295 51, which is down 3 4% from the April 15 reading. We have a 90% confidence that it will fall within ± 2% of this mid point, i e in the range $289 60 to $301 42 This is only a forecast, but it does represent a 3.6% decline when compared May 15, 2024 As such we are now expecting annual appreciation to move below zero by mid-May.
For a couple of months we have been reporting weakness in the average $/SF for active listings and a significant downward trend in the average $/SF for listings under contract These are both precursors for a drop in the average $/SF for closed listings. However this average has stayed stubbornly high and only in the last two weeks has it shown significant weakness Like Wile E Coyote running beyond a cliff edge, closed prices did not seem to realize they were defying gravity even when the Cromford® Market Index moved a long way below 90 They have now looked down and realized gravity and the laws of supply and demand cannot be defied for very long
Luxury homes close in lower numbers through the hotter months, so we should not expect any relief from that segment until Autumn comes around.
Nicole Kobrinsky
PRESIDENT & BROKER OF RECORD
TRENDS
CROMFORD MARKET INDEX
MARKET HIGH
The Market Index was 514 at the height of the market in May 2021.
EXPECTATIONS
The Cromford® Market Index is in a slow falling pattern which is likely to persist during May. There are precursors for a drop in the average $/SF for closed listings
MARKET LOW
In the late Spring of 2022, the market decelerated quickly. A Market Index of 88.3 was seen in December 2022
PRICING
The monthly median sales price increased by 0.1%. The monthly average price per square foot trends up 5.8% YOY. We are now expecting annual appreciation to move below zero by midMay.
INVENTORY
Active listings (excluding UBC) are up 47% YOY and months of inventory is up 51.7% from 2.9 to 4.4 months YOY.
VOLUME
Overall volume of residential sales for the year is up 0.4% compared to April 2024.
ARIZONA
Questions or Comments? Email Report author: Nicole Kobrinsky at nicole@housegallery com
6901 East 1st St Suite 103 Scottsdale, Arizona 85251 480 808 1223 | housegallery com
© 2025 HOUSE GALLERY COLLECTIVE. ALL WORLDWIDE RIGHTS RESERVED. ALL MATERIAL PRESENTED HEREIN IS INTENDED FOR INFORMATION PURPOSES ONLY WHILE, THIS INFORMATION IS BELIEVED TO BE CORRECT, IT IS REPRESENTED SUBJECT TO ERRORS, OMISSIONS, CHANGES OR WITHDRAWAL WITHOUT NOTICE THIS INFORMATION IS BASED ON DATA FROM ARIZONA REGIONAL MULTIPLE LISTING SERVICE, INC (ARMLS), CROMFORD ASSOCIATES LLC , REALTORS PROPERTY RESOURCE®, LLC AND INTERPRETED BY HOUSE GALLERY COLLECTIVE, LLC DATA HAS BEEN LIMITED TO SALES REPORTED WITHIN THE COUNTY OF MARICOPA BOUNDARIES
IF YOUR PROPERTY IS CURRENTLY LISTED WITH ANOTHER REAL ESTATE BROKER, OR YOUR ARE UNDER A BUYER REPRESENTATION CONTRACT WITH ANOTHER REAL ESTATE BROKER, PLEASE DISREGARD THIS OFFER IT IS NOT OUR INTENTION TO SOLICIT THE OFFERINGS OF OTHER REAL ESTATE BROKERS