1 A quick and insightful look at the realities of the real estate market in Phoenix Metro
Highlights
2 We utilize The Cromford Index™ which is a set of market indicators to measure the balance of supply and demand
3-4 A comprehensive look at more detailed market statistics from a past and current perspective
OVERALL INSIGHTS
There is quite a lot of positive news in these numbers. Obviously supply is down from the November peak, but we would expect that as part of the usual seasonal pattern. What we don't know is how fast supply will grow again in January and we will be closely watching that over the next several weeks. The decline was late starting in November but it really accelerated in December and ended in a big bang with a large number of listings expiring at the end of December. For sellers it is much better to have 7 3% fewer active listings to compete with But if those expiring listings come straight back in January, the good news will have been an illusion
Closed sales counts are improving nicely. December's count was up more than 13% from a year ago, although we have to admit this was an easy target to beat. It is encouraging that the annual sales count has risen to almost 72,000. much healthier than the 69,627 we saw at the end of September However, it is still well below the long term average of 85,000 per year
Under contract counts remain subdued but at least we managed a 7% increase from the beginning of 2024.
A combination of reduced supply and a slight recovery in demand means the Cromford® Market Index has returned to a slight seller’s market We are no longer in a buyer's market across all areas, though several outlying locations remain very favorable to buyers
Overall, demand is slowly starting to rebuild, despite mortgage rates remaining stubbornly high. Our concern is that we do not know how much new supply will arrive during the next 3 months. If we get a light load then the market will continue to move towards balance. If we get a large number of new listings then we could slip back into a buyer's market. The next 4 weeks are likely to be critical.
Pricing was unusually strong in December, particularly when we look at the $/SF numbers This measure is distorted by the relatively hot market in upscale luxury homes. These are selling in healthy numbers and for higher prices A frothy stock market, combined with elevated cryptocurrency values means that those with significant capital investments are feeling much better off. The very wealthy have done extremely well over the past couple of years and as usual this has increased demand in the extreme high end markets, especially the Northeast Valley.
Most home builders' stocks tell quite an interesting story in 2024 having gained hugely in value by the end of September only to give most or all of those gains back by the end of December once it became clear that mortgage rates were not coming down in a hurry. The inventory of completed but unsold new homes has recently been increasing for the USA as a whole and new home supply is more plentiful than it was this time last year. This may lead to more flexibility from home builders in sales negotiations during the first half of 2025, especially concerning homes that are ready to move in.
With 30-year fixed mortgage rates over 7%, we do not anticipate strong growth in demand, but the reversal of the earlier declining demand trend is a good sign that we have seen the worst. Everything now depends on how much additional supply will arrive over the next few months.
Nicole Kobrinsky PRESIDENT & BROKER
HIGHLIGHTS
SUPPLY TREND
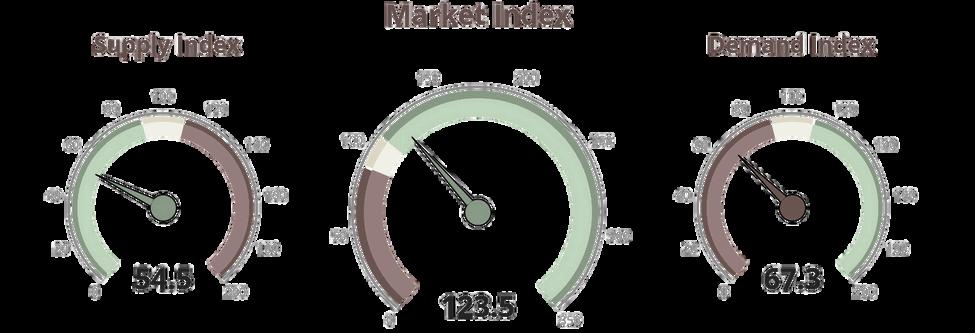
The Supply Trend Index has has decreased 5.3 pts since last month.
MARKET INDEX
The 100 mark represents the index value for a balanced market. A value above 100 represents a market that favors a seller. A value below 100 represents a market that favors a buyer. The Market Index Trend is up 7.9pts in the last month.
DEMAND TREND
The Demand Index Trend is down a small 1.8 pts in the last month
TRENDS
MARKET HIGH
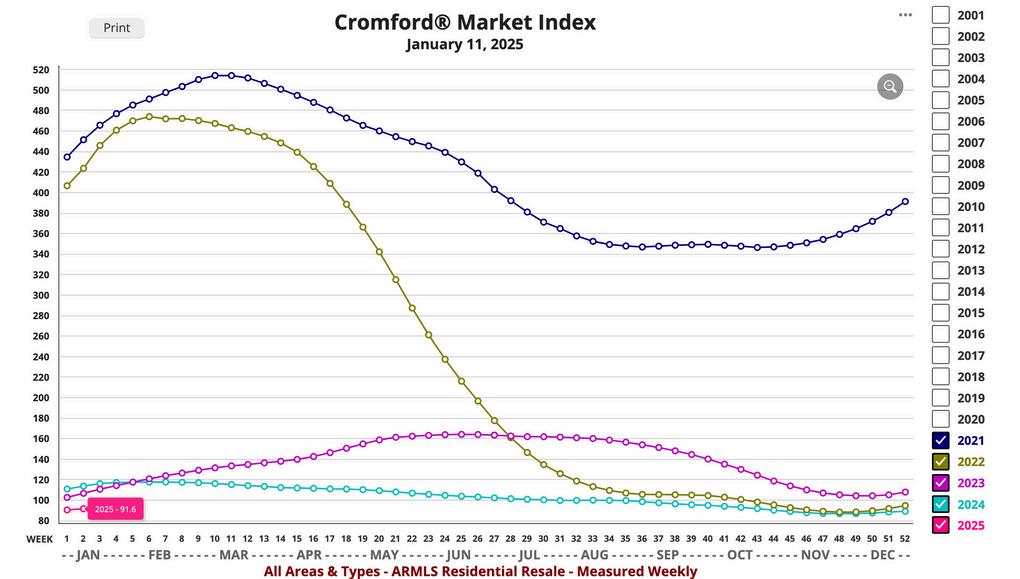
The Market Index was 514 at the height of the market in May 2021
EXPECTATIONS
We do not anticipate strong growth in demand If we get a large number of new listings then we could slip back into a buyer's market. The next 4 weeks are likely to be critical.
MARKET LOW
In the late Spring of 2022, the market decelerated quickly A Market Index of 88.3 was seen in December 2022. We appear to be in a similar market two years later.
PRICING
The monthly median sales price remained the same The monthly average price per square foot trends up 6.8% YOY. Pricing is trending slightly upward but generally remains stable.
INVENTORY
Active listings (excluding UBC) are up 35% YOY and months of inventory is up 27% from 3.2 to 4.2 months YOY.
VOLUME
Overall volume of residential sales for the year is down 0 67% compared to December 2024.
Questions or Comments? Email Report author: Nicole Kobrinsky at nicole@housegallery com
6901 East 1st St Suite 103 Scottsdale, Arizona 85251
IF YOUR PROPERTY IS CURRENTLY LISTED WITH ANOTHER REAL ESTATE BROKER, OR YOUR ARE UNDER A BUYER REPRESENTATION CONTRACT WITH ANOTHER REAL ESTATE BROKER, PLEASE DISREGARD THIS OFFER IT IS NOT OUR INTENTION TO SOLICIT THE OFFERINGS OF OTHER REAL ESTATE BROKERS