FISHER’S FEB ‘24 REVIEW
KEY MARKET
Market Insights BY
JEN ALLEN
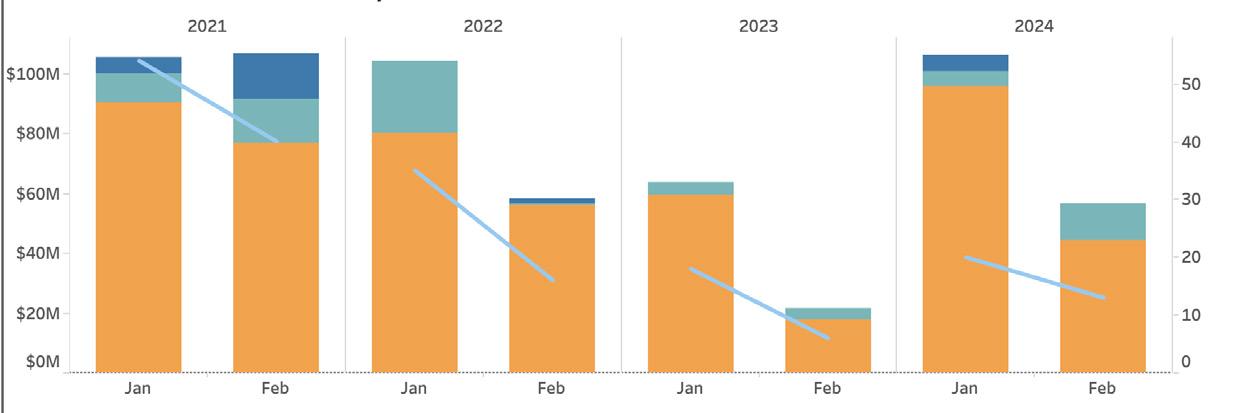
The Nantucket real estate market is off to a vibrant start in 2024 as January and February transactions point to a market that is, thus far, notably different than one year ago. Transaction volume is up 26 percent year-over-year while dollar volume is handsomely higher than the comparable period. This is due to three transactions above $10 million as well as a greater percentage of property sales between $4 million and $7 million. In fact, through February, there have been 13 transactions in this price range compared to the normal one to four transactions we typically see in the first two months of the year. Here are Fisher’s February Market Insights…


(508) 228–4407 21 MAIN STREET, NANTUCKET, MASSACHUSETTS 1
NANTUCKET
REAL ESTATE
$12,000,000 76 EEL POINT ROAD PRIVATE SALE $5,800,000 10A DELANEY ROAD MARKETED FOR [116 Days] $4,295,000 14 DELANEY ROAD PRIVATE//SAME PRICE AS ‘23 HIGHEST RESIDENTIAL SALE HIGHEST SPEC SALE MONTHLY SALES HIGHLIGHTS ALL PROPERTY TYPES 2024 2023 % CHANGE YOY 5-YEAR AVG. Transactions 33 24 38% d 55 Dollar Volume ($ in 000s) $156,340 $85,000 84% d $140,131 Months on Market 2.5 1.9 32% d 5.6 Sale Price to Last Ask 95% 98% 3 d 94% Active Listings 124 87 43% d 171 Projected Absorption 4.9 2.5 95% d 5.0 New Monthly Contracts 12 13 -8% f 25 Dollar Volume # of Transactions NANTUCKET REAL ESTATE ACTIVITY THROUGH FEBRUARY 2014 - 2024
NOTABLE RESALE $ Volume: Land Commercial Residential # of Transactions
METRICS
Market Insights
BY JEN ALLEN
PROPERTY SALES BY PRICE POINT
NOTABLE
RISE IN $4M-$7M & $10M+ SALES


• While early 2024 transaction volume was significantly lower than the same period in 2020-2022, dollar volume tallied $156 million thanks to a notable increase in sales between $4 million to $7 million (light blue in the chart) and sales above $10 million (dark blue) during February. As compared to the five-year average, sales between $4 million to $7 million were 40 percent higher.
• These higher dollar volume sales played a large part in driving the average selling price up 42 percent and the median sale value up 81 percent from one year ago. But with just 33 transactions on the books, we can expect both numbers to moderate significantly as more property sales occur.
RESIDENTIAL SALES ACTIVITY
• Aside from the outsized increases in average and median sale values, sales metrics were otherwise mixed for early 2024. The average marketing time increased 56 percent to 2.5 months, while average sale prices to both the last listing price and the original price slid from 2023 figures.
• Interestingly, there were two property resales that occurred in January & February (these are transfers of properties where there isn’t a material change to the property between sales). The first represents the highest sale of the year so far, 5 Grant Avenue, for $26 million. The previous sale was $19.9 million less than 18 months ago, representing a very healthy return. The second was the $4.295 million sale of 14 Delaney Road which transferred for the same price in June of 2023. We anticipate we are going to see more resales in 2024 and anticipate there will be a wide range of gains (and losses) as homeowners trade out of properties purchased during the 2020-2022 period when values were soaring. We will continue to track and report on them and see if our predictions line up with our 2023 year-end analysis.
PROPERTY INVENTORY
FOR-SALE PROPERTIES ON THE RISE

• For the first time since 2020, the number of available for sale properties was significantly higher at the end of February compared to the same time one year ago. While 124 properties for sale is still well below the pre-pandemic average, it is 57 percent higher than one year ago.
• In fact, nearly every price point (except properties under $1 million) had more properties for sale in February 2024 than in February 2023. This is part of the reason we expect to see varied returns (or losses) in resales as it depends largely on any comparable ‘competition’, which could change quickly, and also the original purchase price (which was influenced by drastically lower competition).
(508) 228–4407 21 MAIN STREET, NANTUCKET, MASSACHUSETTS 2 2
RESALE ACTIVITY SHOWS GAINS & LOSSES
2022 2024 2023 $2M-$4M $4M-$7M $7M-$10M $10M+ $1M-$2M <$1M 2024 2023 % Change 5 Year Avg. Transactions 28 20 40% d 35 Total Sales Dollar Volume $137,772,500 $74,550,500 85% d $113,503,382 Avg. Selling Price $5,102,685 $3,727,525 37% d $3,453,304 Median Selling Price $4,350,000 $2,300,000 89% d $2,682,083 Avg. Months on Market 2.4 1.6 56% d 5.1 Avg. Price as % of Last Ask 95% 99% -4 f 95% Avg. Price as % of Original Ask 89% 98% -9 f 91% Avg. Price as % of Assessed Value 129% 165% -36 f 143%


