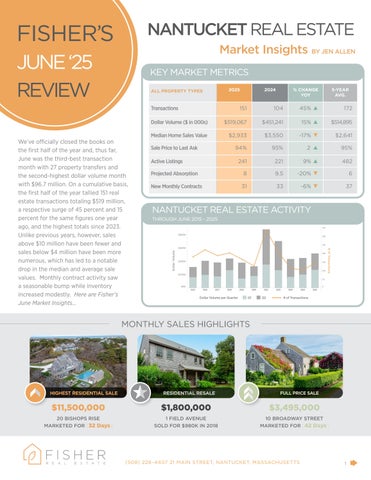
We’ve officially closed the books on the first half of the year and, thus far, June was the third-best transaction month with 27 property transfers and the second-highest dollar volume month with $96.7 million. On a cumulative basis, the first half of the year tallied 151 real estate transactions totaling $519 million, a respective surge of 45 percent and 15 percent for the same figures one year ago, and the highest totals since 2023. Unlike previous years, however, sales above $10 million have been fewer and sales below $4 million have been more numerous, which has led to a notable drop in the median and average sale values. Monthly contract activity saw a seasonable bump while inventory increased modestly. Here are Fisher’s June Market Insights...
KEY MARKET METRICS
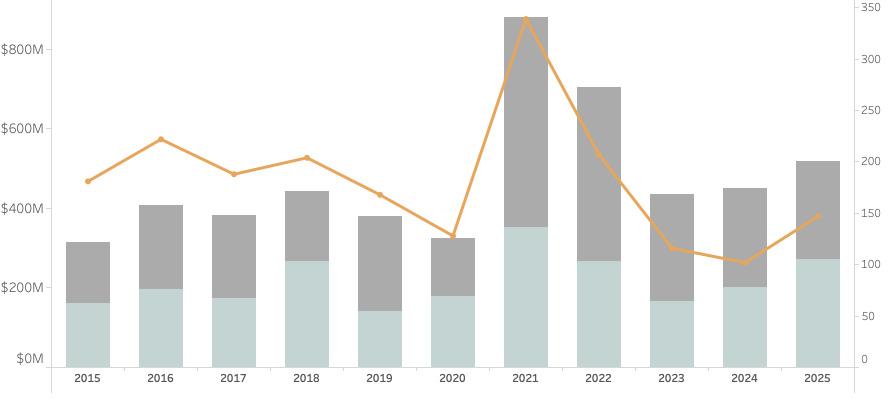
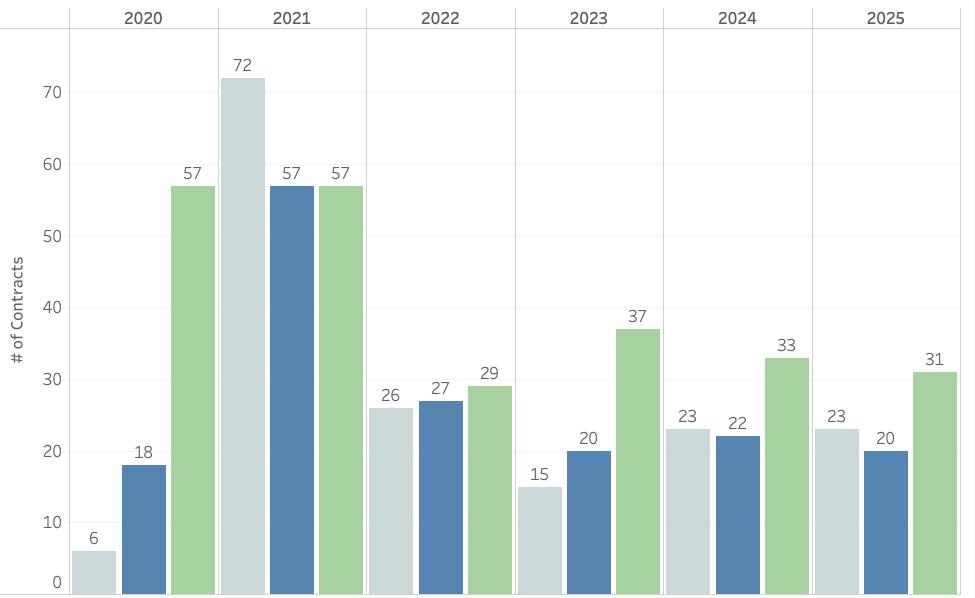
NANTUCKET REAL ESTATE ACTIVITY THROUGH JUNE 2015 - 2025
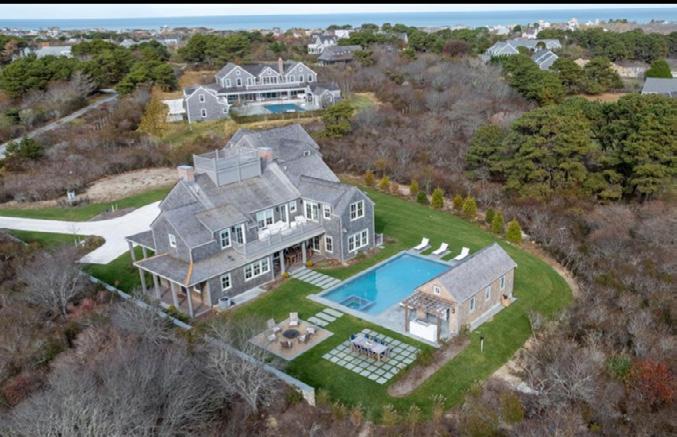
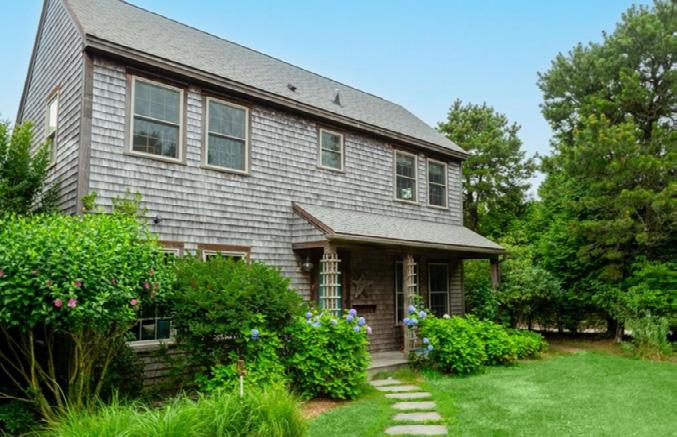
MONTHLY SALES HIGHLIGHTS
Market Insights BY JEN ALLEN
RESIDENTIAL SALES ACTIVITY
HIGHER
• In addition to residential sales, vacant land sales are also well ahead of 2024 figures. Through June 30, 2025, vacant land sales measured 24 transactions totaling $52 million, double the transaction volume we saw one year ago and an increase of 22 percent in dollar volume. Year to date activity was slightly lower than five-year average which measured 30 transactions amounting to $56 million in dollar volume.
• As is typical of vacant land transactions on the island, there has been a wide array of transaction types. The highest sale of the year thus far was the $7 million sale of six acres (four lots of record) of commercially zoned land on Nancy Ann Lane. In fact, commercially zoned land has been a sizable portion of this year’s transaction activity as there were also three separate land transactions along Rosebud Lane in RC-2 zoning and one 10,000 square foot sale for $1.5 million for a vacant parcel in CN zoning.
• On the residential land front, there have been a handful of high-end residential lot sales, including the $5.175 million sale of .32 acres along the Cliff or the $4.8 million sale of one acre in Pocomo. The metric that stands out the most for land sale activity thus far is the average sale price to the Town’s assessed value as it jumped to 224 percent, well above the same metric for residential properties and something we’ll be diving into for more insights.
MARKET WIDE CONTRACT ACTIVITY
• First half single-family home sales (excluding condos, co-ops & 40B or covenant properties) totaled 98 transactions and nearly $400 million in aggregate dollar volume. This represented a sizable 21 percent rise in transaction activity from one year ago but just a three percent rise in total dollar volume. Despite an increase in transaction activity, the average marketing time lengthened and pricing discounts widened.
• Interestingly, the YTD median home sale price was 17 percent lower than it was one year ago. The largest contributing factor to this decline seems to be that through June 30th, 68 percent of all transactions were for sales between $1 million and $4 million, 17 percentage points more than one year ago for this price range. So, not only are there 21 percent more single-family home transactions this year than there were last year, far more of them have been concentrated at the lower end of the market. As more transactions occur throughout the summer months, we should see whether this trend holds or whether an uptick in higher price-point sales brings a swing in the median and average home sale values. The fourth quarter is historically when the Nantucket market sees a higher percentage of sales above $10 million.
VACANT LAND SALES ACTIVITY STRONG FIRST HALF FOR LAND SALES
• During the month of June, there were 31 new purchase contracts recorded, a nearly identical number and monthly pattern of activity as compared to 2024. June contracts represented a solid rebound from May activity but were a fraction of what we saw in the peak years of 2020 & 2021.
• Of the contracts that were publicly recorded during June, the majority (54 percent) were for properties last listed between $1 million and $3 million (a markedly higher percentage than one year ago) while one contract was executed for a property listed above $10 million (slightly lower than the three-year average when there are typically four or five contracts). This suggests we may continue to see a lower than typical median home sale value until/unless there are more higher end sales.
• On an anecdotal basis, this year’s purchase contracts still tend to have limited contingencies relative to pre-2020. Just has been the case the last few years, they often solely include an inspection period. Where we are seeing a slight mindset shift is in more financing contingencies being accepted by sellers. Perhaps this is because we are seeing a higher amount of activity in the sub-$4 million market. August is typically the most active contract month of the year so we will see what the next 31 days bring and what we can predict for the third quarter.