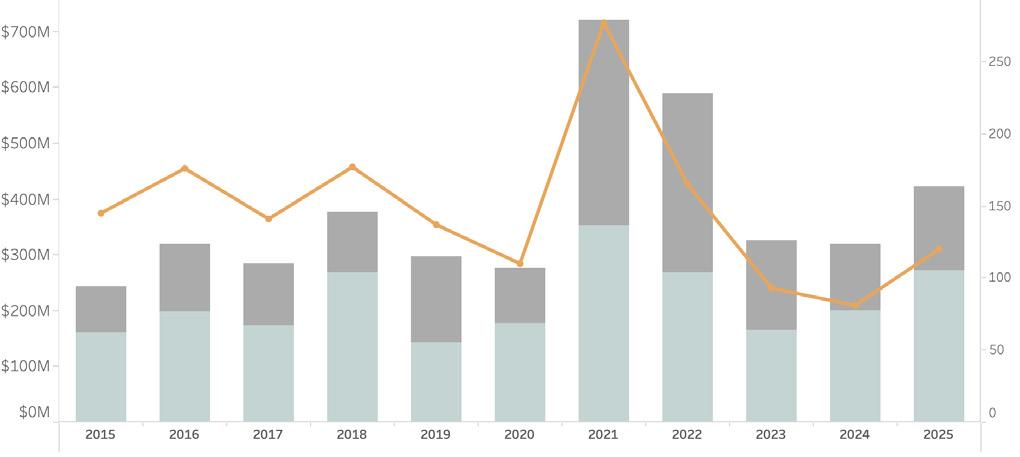
After a strong start to 2025, with each month showing double-digit year-overyear gains, May marked the first month of declines. May 2025 transactions totaled $53.8 million through just 19 transactions, a decline of five percent and 21 percent respectively for the same month in 2024. Year-to-date, however, remains solid with $367 million across 101 property sales, a 66 percent gain in transaction volume and a 46 percent gain in dollar volume. While activity is higher in 2025 and inventory remained steady, most sales metrics trended weaker. We will be keeping an eye on pricing and value trends as we head into what is typically the busiest part of the season. Here are Fisher’s May Market Insights...
KEY MARKET METRICS
NANTUCKET REAL ESTATE ACTIVITY THROUGH MAY 2015 - 2025
Market Insights BY
JEN ALLEN
RESIDENTIAL SALES ACTIVITY
STRONG YTD VOLUME BUT SALES METRICS WEAKENED
• With transaction and dollar volume handsomely higher than in 2024, it’s interesting to see the median home sale value down 16 percent. Even though we are seeing pricing discounts widen, the decline in the median sale value doesn’t (yet) appear to stem from declining values on the whole. Analysis of resales suggests property values just aren’t rising as quickly as they were over the last five years, but we recognize the sample size of resales is small and will be keeping a close eye on values.
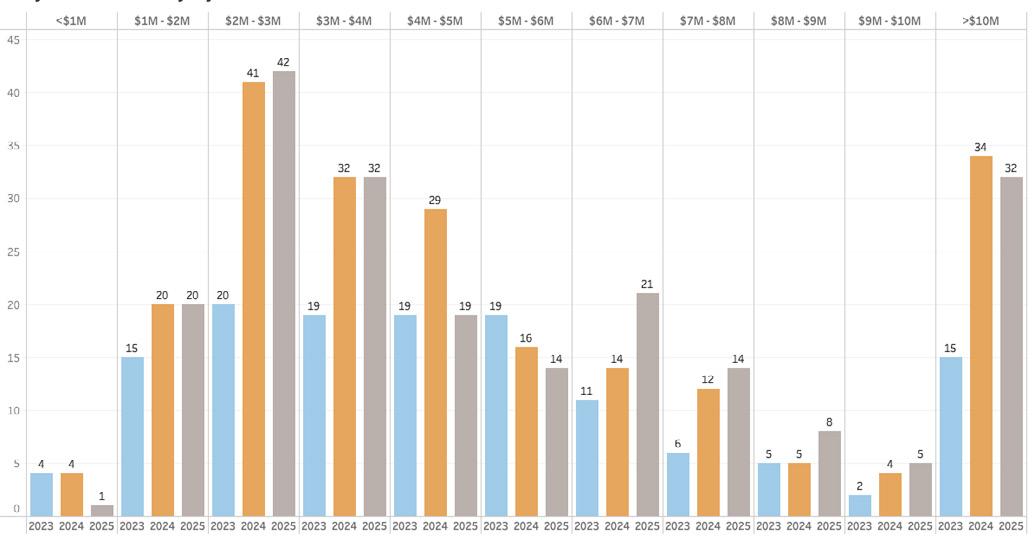
• The 2025 sales distribution shows a higher share of lower-end transactions (31% vs. 20% in 2024) and fewer sales in the $2M–$3M and $4M–$5M ranges, with the latter down 15% from last year. This shift in the price mix is the primary factor behind the lower median sale value. As the year progresses, more data will help clarify trends impacting sale values.
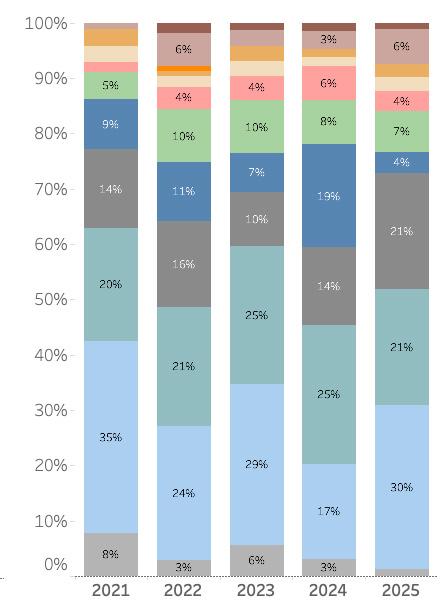
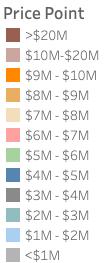
PROPERTY INVENTORY BY PRICE POINT
• May saw 14 single-family home sales (excluding condos, co-ops, and 40B/ covenant properties), matching last year’s count but reflecting an 18% decline in dollar volume. Compared to the five-year average, both transactions and dollar volume were down 33%.
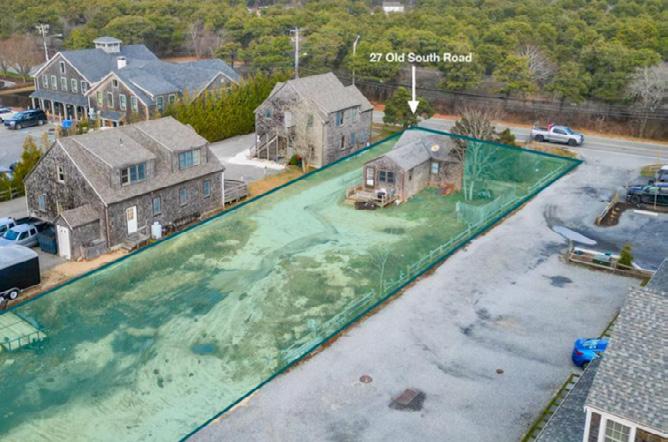
• Despite May’s dip, strong performance earlier in the year drove year-to-date residential sales up 27% in transaction volume and 24% in dollar value compared to 2024. Sales ranged from a $400K waterfront property in Madaket to a $14.25M sale in Pocomo—the sixth residential transaction over $10M this year, doubling last year’s figure.
• A shift in the price distribution of sales contributed to lower average and median sale prices. Marketing time increased to 4.8 months, more in line with the five-year average, indicating a less urgent buyer approach. Wider pricing discounts suggest sellers are starting high but showing willingness to negotiate.
RESIDENTIAL
SALES ANALYSIS BY PRICE POINT HIGHER CONCENTRATION OF LOWER END SALES IN 2025 VS 2024
• As of May 31, 2025, there were 208 properties (residential, land, and commercial) listed for sale—virtually unchanged from 211 listings at the same time in 2024. However, the overall months’ supply dropped to seven, down from nine last year, thanks to steady inventory and increased transaction volume.
• While total listings remained stable, the breakdown by price point revealed notable shifts. Listings in the $4M–$5M range saw the sharpest year-over-year decline, while those in the $6M–$7M bracket experienced the largest increase. With more listings expected as we head into peak season, it will be important to watch how activity plays out across these price points over the summer and whether pricing discounts continue, particularly in segments with more inventory.