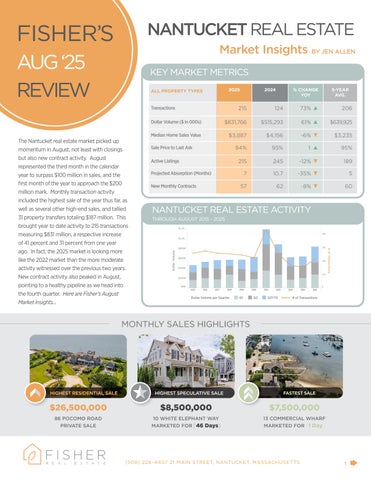
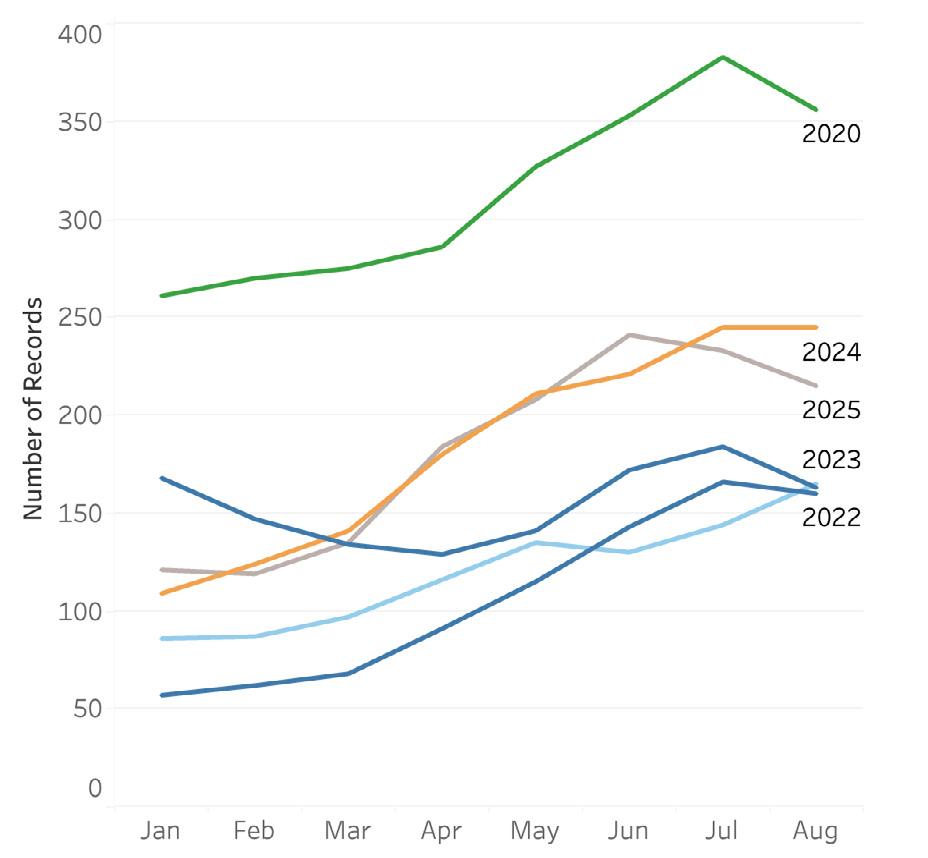
The Nantucket real estate market picked up momentum in August, not least with closings but also new contract activity. August represented the third month in the calendar year to surpass $100 million in sales, and the first month of the year to approach the $200 million mark. Monthly transaction activity included the highest sale of the year thus far, as well as several other high-end sales, and tallied 31 property transfers totaling $187 million. This brought year to date activity to 215 transactions measuring $831 million, a respective increase of 41 percent and 31 percent from one year ago. In fact, the 2025 market is looking more like the 2022 market than the more moderate activity witnessed over the previous two years. New contract activity also peaked in August, pointing to a healthy pipeline as we head into the fourth quarter. Here are Fisher’s August Market Insights...
KEY MARKET METRICS
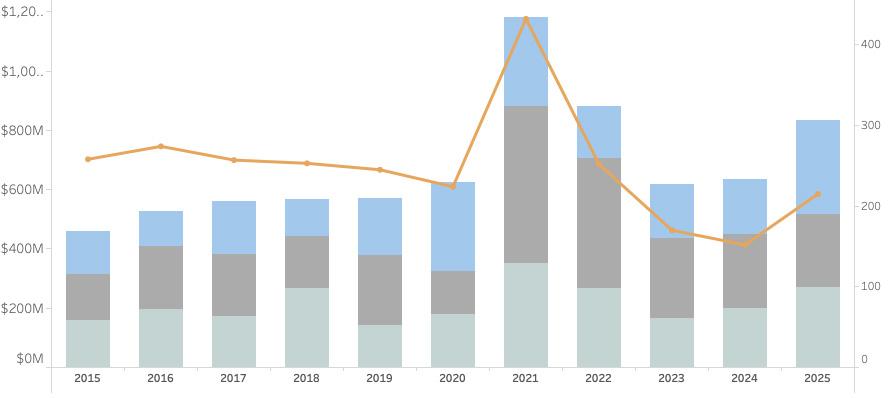
NANTUCKET REAL ESTATE
THROUGH AUGUST 2015 - 2025
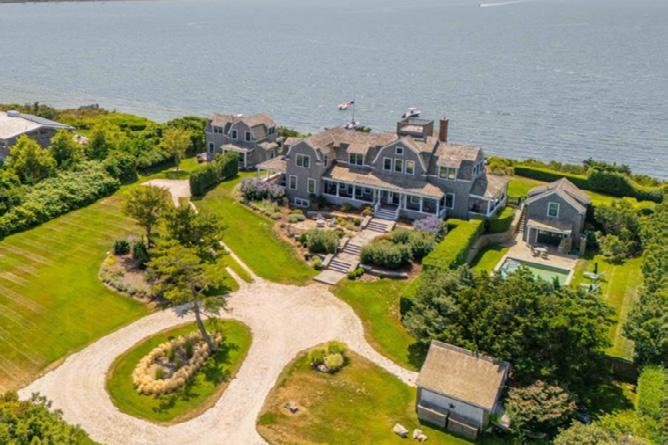
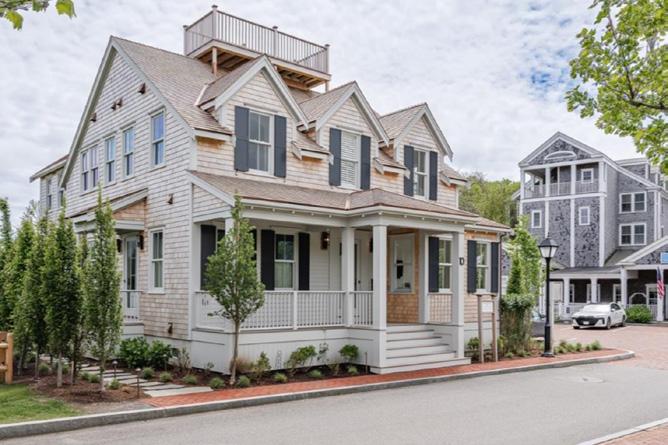
MONTHLY SALES HIGHLIGHTS
Market Insights BY
JEN ALLEN
RESIDENTIAL SALES ACTIVITY
• August was the first month since February where we saw multiple sales in the $10 million to $20 million segment and the second month to see a mega high-end sale. This helped narrow the year-to-year gap in both the average and median home sale value, though both metrics remain lower than 2024 figures.
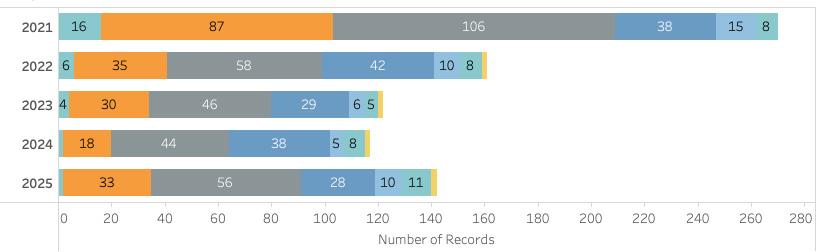
• Perhaps surprisingly, the highest percentage of total transaction activity through August 31, 2025, was in the $1 million to $2 million range. In fact, these sales remain eight percentage points higher than they were one year ago, which is part of the reason we are still seeing lower median and single-family home values. The other reason is that sales between $4 million to $5 million are 10 percentage points lower than the totals they represented in 2024. Until and unless we start to see more sales in these segments, or a relative increase in sales for homes above $7 million, we will continue to see lower values in 2025, but it doesn’t mean property prices are lower on a comprehensive basis.
PROPERTY INVENTORY & CONTRACT ACTIVITY
• August single-family home sales (excluding condos, co-ops, and 40B/covenant properties) included 24 transactions, slightly ahead of last year’s count and handsomely higher in comparative dollar volume thanks to four sales above $10 million. Compared to the five-year average, transactions were relatively similar, but dollar volume was 56 percent higher.
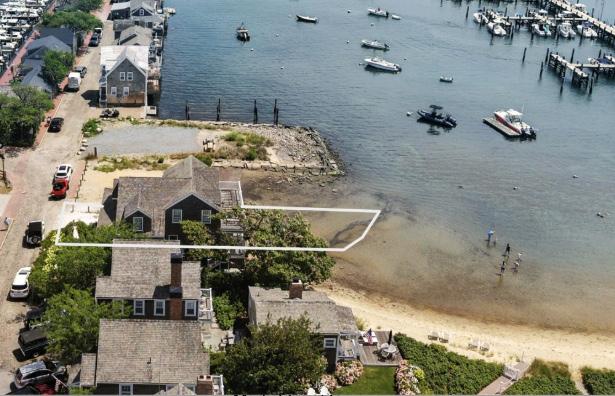
• Monthly sales ranged from a $1.85 million home in Miacomet to a $26.5M waterfront sale in Pocomo—the highest thus far in the calendar year. This August surge, combined with the strong performance in July, drove year-to-date residential transactions 21 percent higher and dollar volume 16 percent higher on a cumulative basis as compared to 2024.
• The year-to-date price distribution of sales at the lower end of the market continued to contribute to lower average and median home sale prices while the marketing time decreased to 4.2 months. Slightly wider pricing discounts suggest sellers started high but are willing to negotiate.
RESIDENTIAL SALES ANALYSIS BY PRICE POINT
SALES BY PRICE POINT STILL CONCENTRATED IN LOWER END
• As of August 31, 2025, there were 215 properties (residential, land & commercial) listed for sale and the total months’ supply (how long it would take to sell all listings based on trailing 12-month sales) measured seven months. This is the first month of the year where we’ve seen a notable decline in year-to-year inventory levels, which translated into a faster projected marketing time.
• The number of listed properties by price point is lower in nearly every price point. However, the number of properties listed between $8 million to $9 million is three times higher than one year ago and listings between $6 million to $7 million are higher than the last two years.
• August was not only a busy month for sales but also new contract activity which rose to 57 contracts from the 48 witnessed in July. The majority of contracts, 25 percent, were for properties last priced between $2 million to $3 million. There was also a healthy amount (11 percent) marked for properties last listed above $10 million. The market should have a vibrant fourth quarter.