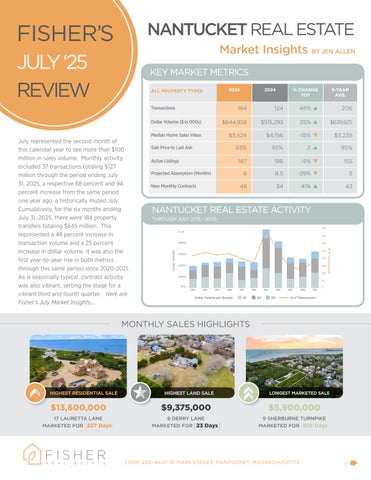
FISHER’S JULY ‘25
KEY MARKET METRICS
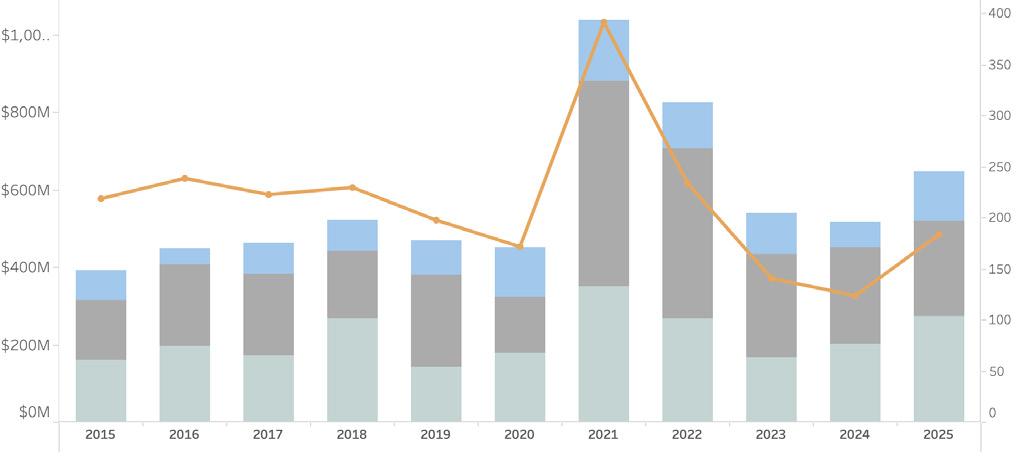
July represented the second month of this calendar year to see more than $100 million in sales volume. Monthly activity included 37 transactions totaling $127 million through the period ending July 31, 2025, a respective 68 percent and 94 percent increase from the same period one year ago, a historically muted July. Cumulatively, for the six months ending July 31, 2025, there were 184 property transfers totaling $645 million. This represented a 48 percent increase in transaction volume and a 25 percent increase in dollar volume. It was also the first year-to-year rise in both metrics through this same period since 2020-2021. As is seasonally typical, contract activity was also vibrant, setting the stage for a vibrant third and fourth quarter. Here are Fisher’s July Market Insights...
MONTHLY SALES HIGHLIGHTS
Market Insights BY
JEN ALLEN
RESIDENTIAL SALES ACTIVITY
RISE IN VOLUME, AVERAGE SALE VALUES REMAINED LOWER
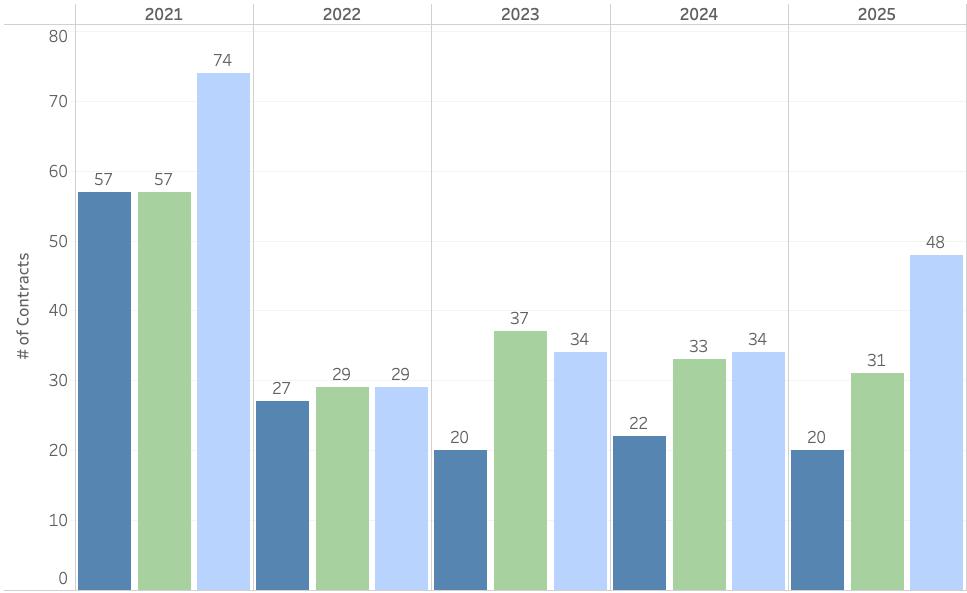
• Summer contract activity heated up in July where recorded contracts (Offers to Purchase and Purchase & Sale Contracts excluding duplicates) rose to a total of 48, up from the 31 contracts recorded June and the highest number on record for July since 2021. Preliminary August activity is even higher, suggesting the market will see a very robust fall closing schedule.
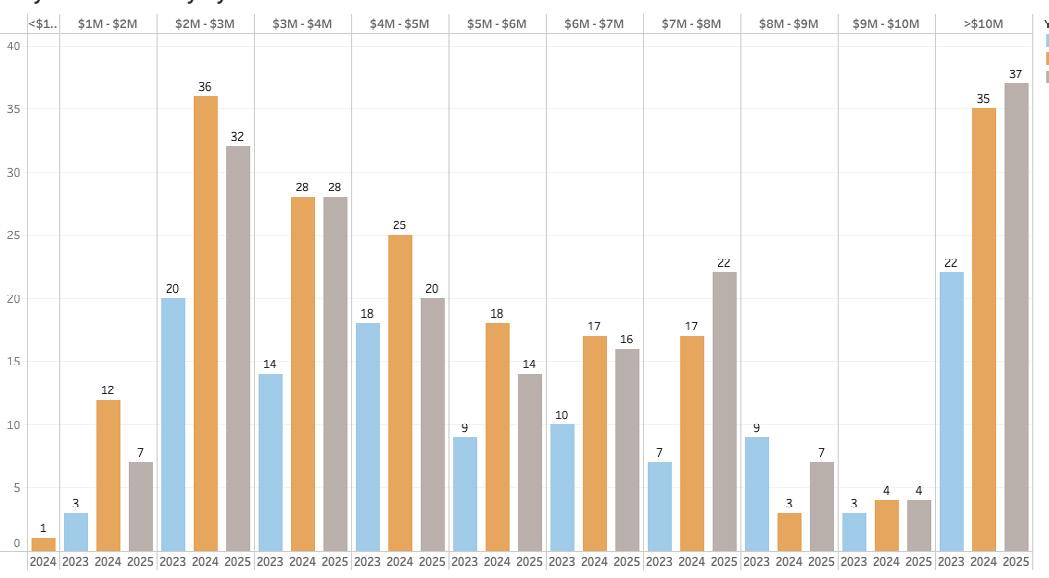
• Most of the July contracts, 23 percent, were for properties last priced between $3 million and $4 million, notably higher than what we saw during this period in 2024. The $4 million to $5 million segment also saw nice bump in contract activity while ultra high-end contracts over $10 million were lower than one year ago and the three-year average.
• As of the time of this report, there was over $680 million in pending contracts, forecasted totals that will put the full-year estimate well over $1 billion.
PROPERTY INVENTORY & PRICE REDUCTIONS
• Single-family home sales (excluding condos, co-ops & affordable housing) totaled 20 transactions totaling $75 million in July, an increase of 43 percent for both metrics and just three transactions fewer than the five-year average. Cumulative transactions figures rose to 118 transactions and $475 million, a respective 24 percent and eight percent increase from 2024. As transaction activity increased, the average marketing time decreased to 4.4 months through July, slightly faster than one year ago and the five-year average.
• Despite the increase in transaction and dollar volume, the average home sale price fell 15 percent below the $4.1 million average from one year ago while the median home sale value dropped by the same percentage. As previously reported, this is largely attributed to the decrease in $4 million to $5 million transactions from 2024 and a doubling of sales between $1 million and $2 million in 2025.
RISE IN NEW PURCHASES POINT TO A $1B+ MARKET
• As of July 31, 2025, there were 187 properties (residential, land & commercial) listed for sale and the total months’ supply (how long it would take to sell all listings based on trailing 12-month sales) measured six months. This projected marketing time is two and a half months faster than in 2024 thanks to a rise in transaction activity. Nearly every price point saw steady or fewer listings as compared to last year. The number of properties listed between $7 million to $9 million saw notable YOY growth.
• As the first full month of summer passed by, the number of price changes increased, though not more than adjustments from one year ago. Through July 31, 2025, there were price adjustments to 48 properties, a 10 percent decrease from the same period last year but nearly double the adjustments we saw in 2023 for the same period. The average price discount from the original list price was approximately eight percent.