
SPECIAL TOPIC

SPECIAL TOPIC
EAGE NEWS Make room for a space adventure
CROSSTALK Industry challenges lost in transition
TECHNICAL ARTICLE A model to generate pseudo sonic logs


The world is in an ‘ energy addition ’ phase. Oil and gas will be needed for decades to come, with demand continuing to be robust beyond 2035. Meeting this demand will only be possible by utilising the latest technology and leveraging strategic partnerships . The geoscience and engineering community has much to contribute.


FIRST BREAK ®
An EAGE Publication www.firstbreak.org
ISSN 0263-5046 (print) / ISSN 1365-2397 (online)
CHAIR EDITORIAL BOARD
Clément Kostov (cvkostov@icloud.com)
EDITOR Damian Arnold (arnolddamian@googlemail.com)
MEMBERS, EDITORIAL BOARD
• Philippe Caprioli, SLB (caprioli0@slb.com) Satinder Chopra, SamiGeo (satinder.chopra@samigeo.com) Anthony Day, NORSAR (anthony.day@norsar.no)
• Peter Dromgoole, Retired Geophysicist (peterdromgoole@gmail.com)
• Kara English, University College Dublin (kara.english@ucd.ie)
• Hamidreza Hamdi, University of Calgary (hhamdi@ucalgary.ca)
• Fabio Marco Miotti, Baker Hughes (fabiomarco.miotti@bakerhughes.com)
• Roderick Perez Altamar, OMV (roderick.perezaltamar@omv.com)
• Susanne Rentsch-Smith, Shearwater (srentsch@shearwatergeo.com) Martin Riviere, Retired Geophysicist (martinriviere@btinternet.com)
• Angelika-Maria Wulff, Consultant (gp.awulff@gmail.com)
EAGE EDITOR EMERITUS Andrew McBarnet (andrew@andrewmcbarnet.com)
PUBLICATIONS MANAGER
Hang Pham (publications@eage.org)
MEDIA PRODUCTION
Saskia Nota (firstbreakproduction@eage.org) Ivana Geurts (firstbreakproduction@eage.org)
ADVERTISING INQUIRIES corporaterelations@eage.org
EAGE EUROPE OFFICE
Kosterijland 48
3981 AJ Bunnik
The Netherlands
• +31 88 995 5055 eage@eage.org
• www.eage.org
EAGE MIDDLE EAST OFFICE
EAGE Middle East FZ-LLC Dubai Knowledge Village PO Box 501711 Dubai, United Arab Emirates
• +971 4 369 3897
• middle_east@eage.org
• www.eage.org
EAGE ASIA PACIFIC OFFICE
EAGE Asia Pacific Sdn. Bhd.
UOA Centre Office Suite 19-15-3A No. 19, Jalan Pinang 50450 Kuala Lumpur
Malaysia
• +60 3 272 201 40
• asiapacific@eage.org www.eage.org
EAGE LATIN AMERICA OFFICE
EAGE Americas SAS Av Cra 19 #114-65 - Office 205 Bogotá, Colombia
• +57 310 8610709 americas@eage.org
• www.eage.org
EAGE MEMBERS’ CHANGE OF ADDRESS
Update via your MyEAGE account, or contact the EAGE Membership Dept at membership@eage.org
COPYRIGHT & PHOTOCOPYING © 2025 EAGE
All rights reserved. First Break or any part thereof may not be reproduced, stored in a retrieval system, or transcribed in any form or by any means, electronically or mechanically, including photocopying and recording, without the prior written permission of the publisher.
PAPER
The publisher’s policy is to use acid-free permanent paper (TCF), to the draft standard ISO/DIS/9706, made from sustainable forests using chlorine-free pulp (Nordic-Swan standard).

29 A robust empirical model to generate pseudo sonic logs from neutron porosity logs
James Corey Morgan, Kevin Chesser and Theodore Stieglitz
37 Modelling and inversion of superconducting quantum interference device transient electromagnetic survey data for geothermal resource exploration
Michael S. Zhdanov, Alexander Gribenko, Leif Cox, Keiichi Tanabe, Tsunehiro Hato, and Akira Tsukamoto
43 Assessing petroleum system risks in deep Middle Eastern gas plays using regional screening
Chris Gravestock, Owen Sutcliffe, Thomas Jewell, Mike Simmons and Joseph Jennings
49 Sand-clay distribution and best quality sand thickness in the Våle and Lista Formations of Rogaland Group: Comparison of stratigraphic reference maps and AI-based inversion results in the Norwegian North Sea Elephant database
Vita Kalashnikova, Rune Øverås, Tatiana Nekrasova, Carl Fredrik Gyllnehammar and Ivar Meisingset
59 Interactive seismic stratigraphic analysis: user-guided visual enhancement and AI-driven depositional element extraction
Julien Razza, Remi Leblond, Nasser Olleik, Étienne Legeay, Marie Etchebes and Laurent Souche
69 Super Nova Scotia: It’s time for an old sun to reignite
Karyna Rodriguez, Lauren Found, George Kovacic and Neil Hodgson
73 Enhancing FWI convergence through self-supervised low-frequency extrapolation of legacy marine data: A case study from the Asri Basin, Indonesia
Sonny Winardhi, Asido Saputra Sigalingging and Ekkal Dinanto
81 From data to discovery: Exploring East Java’s subsurface with the Facies Map Browser
David Little
86 Calendar
cover: Seismic survey data visualised on a digital map used by geologists to identify oil reserves in various geological formations.
Environment, Minerals & Infrastructure Circle
Andreas Aspmo Pfaffhuber Chair
Florina Tuluca Vice-Chair
Esther Bloem Immediate Past Chair
Micki Allen Liaison EEGS
Martin Brook Liaison Asia Pacific
Ruth Chigbo Liaison Young Professionals Community
Deyan Draganov Technical Programme Representative
Madeline Lee Liaison Women in Geoscience and Engineering Community
Gaud Pouliquen Liaison Industry and Critical Minerals Community
Eduardo Rodrigues Liaison First Break
Mark Vardy Editor-in-Chief Near Surface Geophysics
Oil & Gas Geoscience Circle
Johannes Wendebourg Chair
Timothy Tylor-Jones Vice-Chair
Yohaney Gomez Galarza Immediate Past Chair
Wiebke Athmer Member
Alireza Malehmir Editor-in-Chief Geophysical Prospecting
Adeline Parent Member
Jonathan Redfern Editor-in-Chief Petroleum Geoscience
Robert Tugume Member
Anke Wendt Member
Martin Widmaier Technical Programme Officer
Sustainable Energy Circle
Giovanni Sosio Chair
Benjamin Bellwald Vice-Chair
Carla Martín-Clavé Immediate Past Chair
Emer Caslin Liaison Technical Communities
Sebastian Geiger Editor-in-Chief Geoenergy
Maximilian Haas Publications Assistant
Dan Hemingway Technical Programme Representative
Carrie Holloway Liaison Young Professionals Community
Adeline Parent Liaison Education Committee
Longying Xiao Liaison Women in Geoscience and Engineering Community
Martin Widmaier Technical Programme Officer
SUBSCRIPTIONS
First Break is published monthly. It is free to EAGE members. The membership fee of EAGE is € 85.00 a year including First Break, EarthDoc (EAGE’s geoscience database), Learning Geoscience (EAGE’s Education website) and online access to a scientific journal.
Companies can subscribe to First Break via an institutional subscription. Every subscription includes a monthly hard copy and online access to the full First Break archive for the requested number of online users.
Orders for current subscriptions and back issues should be sent to First Break B.V., Journal Subscriptions, Kosterijland 48, 3981 AJ Bunnik, The Netherlands. Tel: +31 (0)88 9955055, E-mail: subscriptions@eage.org, www.firstbreak.org.
First Break is published by First Break B.V., The Netherlands. However, responsibility for the opinions given and the statements made rests with the authors.


The call for abstracts will open this month for the 87th EAGE Annual Conference & Exhibition, taking place from 8 to 11 June 2026 in Aberdeen. This will be the first time the event is held in the city, long known as a global hub for oil and gas and now increasingly at the centre of energy transition efforts in Europe.
The theme for this year is Maximising recovery: Unlocking value through technology and partnerships, and we’re looking for contributions that show how geoscience and engineering can deliver real, practical solutions across sectors. Whether you’re focused on hydrocarbons, geothermal, CCS, or emerging technologies, we want to hear how your work is driving innovation, improving efficiency, and building collaboration.
This year’s event is hosted by bp. The company is also leading the Local Advisory Committee (LAC). The committee brings together experts from across industry and academia, including bp, TotalEnergies, Viridien, Heriot-Watt University, and the University of Aberdeen, to help shape a programme that reflects both local strengths and global relevance.
We’re aiming for a broad and balanced Technical Programme that brings together the full EAGE community: from geophysics, geology and reservoir engineering, to renewables, infrastructure and
data science. We also want to highlight the growing number of crossover technologies and projects, those that don’t fall neatly into one category, but push the boundaries of our disciplines.
If you’re working on something new, testing ideas, or bringing different fields together, now is the time to share it. This is a chance to present your work to peers from around the world, take part in tech-
nical discussions that matter, and connect with others in your field.
We’re especially keen to see strong involvement from early-career professionals and students, those who are just starting out and already helping to shape the future of the industry.
The deadline for submissions is 15 January 2026. Visit www.eageannual.org for full details and to submit your abstract.
Two special optional events have been added to our EAGE Digital 2026 being held in Stavanger, Norway on 9-12 March next year. One is a hackathon Wind power revolution: Harnessing AI and simulation for optimal wind farm design and energy integration , the other is a short course Language models for geoscience applications
The hackathon aims to empower participants to explore and implement AI-driven models to forecast and optimise renewable energy production. Participants will get hands-on experience using various tools, such as using NVIDIA Earth-2 and FourCastNet to forecast wind patterns. Participants will be invited to combine in a unified workflow machine learning-based weather predictions, wind farm simulation with PyWake, and energy system optimisation with PyPSA.
The short course is being presented by Dr Thomas Bartholomew Grant, domain expert of Cegal, and will explore the potential of generative AI (Gen-AI) for geoscience. By examining the key concepts of large language models and
real-world applications of them, participants can gain insights into how these technologies are being used to solve complex geoscience challenges. The course material is aimed at geoscientists
who are looking to use AI applications and want a better understanding of how they work, how to get the best out of them and how to critically evaluate their performance.
Abstracts welcomed
The side activities are designed to enrich your conference experience. For those joining us in Stavanger, Norway and interested in being part of shaping the future of digitalization, there is the opportunity to submit your abstract for the Technical Programme by 1 November 2025.
We’re excited to announce a webinar that takes our geoscience discussions out of this world – literally. It also includes a special incentive for becoming an EAGE member for 2026.

As part of World Space Week 2025 (4-10 October), led by Bruno Pagliccia, a veteran geophysicist and space exploration enthusiast, we will explore how geophysics is contributing to the next frontier: space exploration. Geophysical activities in space exploration – Moon, Mars and beyond will bring a fresh perspective to the ways our community’s expertise is being applied beyond Earth including analysis of seismic activity on the Moon and Mars and examination of the potential for using underground 3D imaging in planetary exploration.
As space missions ramp up and interest in off-Earth resources intensifies, geophysics is emerging as a critical enabler of sustainable, science-based space initiatives. The webinar will reflect on past seismic studies and explore the tools, strategies, and questions surrounding the search for and extraction of resources in space.
The timing couldn’t be better. With the membership renewal period opening on 1 October, this webinar is a great early benefit for returning members, and a perfect welcome for new ones. By joining, you will not only gain access to this webinar planned on 7 October, but also enjoy full membership benefits for the rest of 2025 and all of 2026, including unlimited free webinars and learning resources, discounts on all EAGE courses and events, and more.
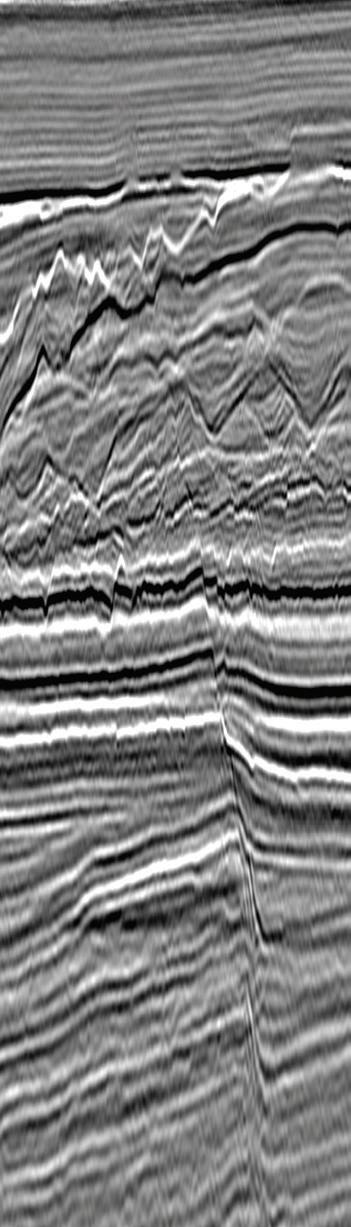

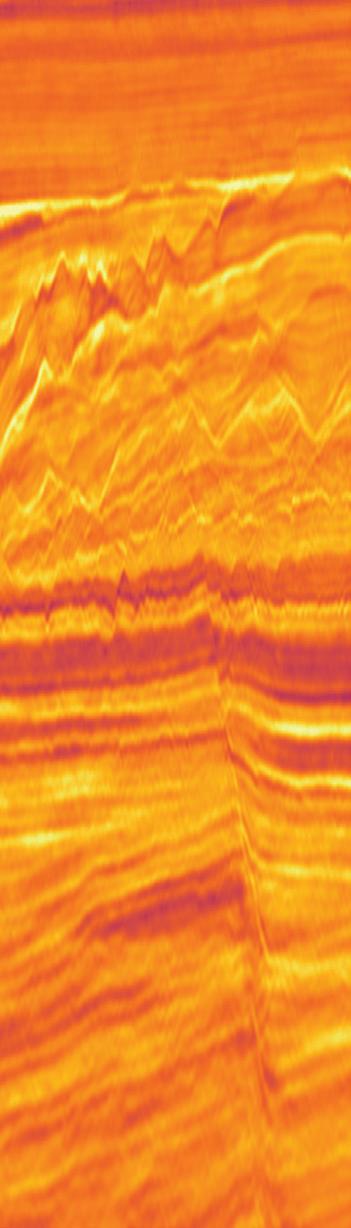


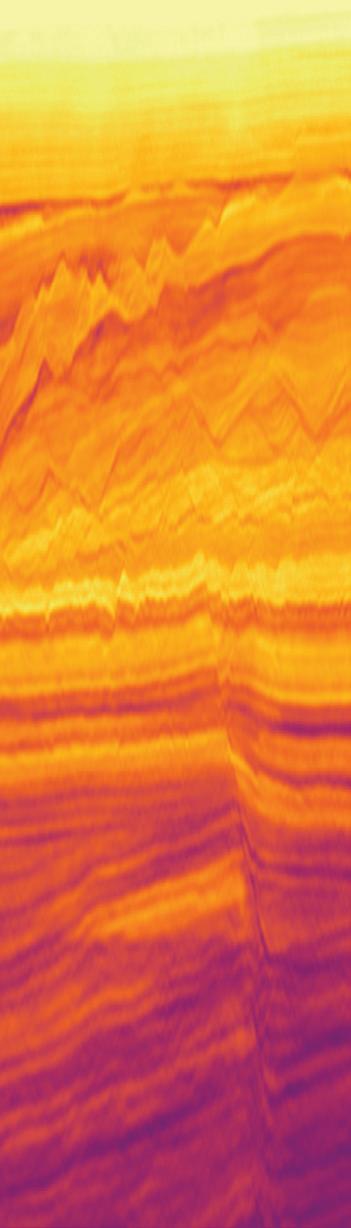
DUG Elastic MP-FWI Imaging provides accurate models of of Vp, density, Vp/Vs, S-impedance and P-impedance ratio directly from raw field data. These quantities were derived without the need to generate angle stacks for an AVA inversion workflow.
The DUG Elastic MP-FWI Imaging derived quantities are geologically conformable and show a significant increase in resolution. We can readily identify the reservoir location and fluid effects — a beautiful example of a flat spot!
info@dug.com | dug.com/fwi
At the upcoming EAGE Masterclass on Geothermal Energy (17-20 November 2025, Paris), Professor Denis Voskov of TU Delft will lead a course on Geothermal reservoir engineering of energy production. Here he tells us what is involved.
What can participants learn from the course?
The main thing they will learn are the key physical concepts behind geothermal energy production, understanding the basic principles of reservoir simulation for geothermal applications, obtaining some practical grasp of geothermal operations through simulation exercises, and evaluating how different numerical and physical properties affect the dynamics of geothermal production.
How does reservoir engineering integrate with other disciplines in geothermal energy production?
Reservoir engineering allows us to integrate different geological concepts and hypotheses, a large variety of geophysical observations, environmental
constraints, and production data into a single simulation model. This model can help in further adjustment and improvement of geological concepts, suggest which geophysical observations can improve our understanding of subsurface reservoirs, prevent environmental hazards, and finally optimise the production of geothermal resources.
Does the course incorporate real-world cases to reinforce theoretical concepts?
Besides learning the theory behind geothermal energy production and its modelling, participants will improve their understanding with several buildfor-purpose simulation exercises using open-source software solutions.
Are practical exercises involved?
There are several practical exercises in Jupyter Notebooks using openDARTS (https://darts.citg.tudelft.nl/). The exercises will allow participants to learn how various physical and numerical parameters affect geothermal systems.
Summarise why participants might attend
Are you missing reservoir engineering experience in your work? Do you want to understand how geothermal systems perform and what are the most important properties affecting energy production? Are you interested to learn how to model geothermal reservoirs with an open-source simulator? Join our course and feel yourself as a true reservoir engineer in the energy transition world.
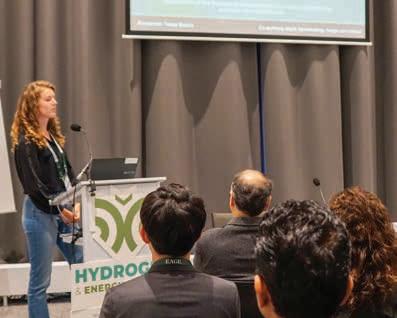
As the energy sector undergoes a profound transformation, the next generation of geoscientists and engineers must be ready to lead. This is what the upcoming Energy Transition Student Days is all about.
As part of the EAGE Global Energy Transition Conference (GET 2025) in Rotterdam, students will be able to join a three-day programme 28-30 October 2025 addressing geoscience-related project planning in a teambased environment.
The Geosciences and the Energy Transition challenge provides an opportunity to experience the building of a real-world case study set in NW Europe. Participants will be able to collaborate to assess the feasibility of developing either a carbon storage site, geothermal energy project, or hydrocarbon field, navigating technical, economic, and societal considerations along the way.
Adopting a problem-based learning approach, the programme is intended to push students beyond the classroom, from interpreting geological data to building production forecasts and cashflow models, The hands-on activities simulate the complexity of subsurface energy development in the context of the Paris climate goals. A highlight of the final day includes a stakeholder role-play to examine competing interests in energy planning.
Expert guidance will be provided by Drs Raymond Franssen, Manuel Willemse, and Eilard Hoogerduijn Strating, who bring extensive experience in geoscience and energy transition.
For a fee of €100, participants also gain full access to the GET 2025 conference, including technical sessions, field trips, networking events, and more. For students ready to explore real challenges and contribute to the energy future, this is an opportunity not to be missed.
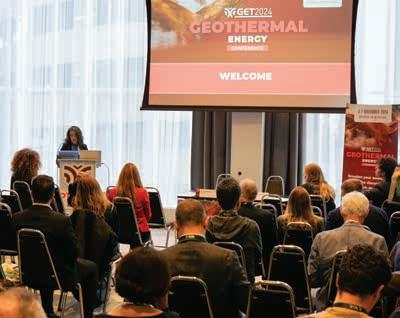
With just a month to go, anticipation is building as we prepare to welcome the global geoscience and engineering community to GET 2025, the 6th EAGE Global Energy Transition Conference and Exhibition from 27-31 October 2025 at the Convention Centre WTC in Rotterdam. Once again, the event brings together professional communities involved in carbon capture and storage, geothermal, hydrogen, energy storage, and offshore wind.
GET 2025 comes at a key moment when the need for innovation, collaboration and practical solutions has never been greater as the demand for both traditional and low-carbon energy continues to rise. Delegates can look forward to nine focused tracks, some 25 panel discussions, 350 presentations and over 400 expert speakers.
Whether you’re coming from industry, academia, government or a related sector, this is an opportunity to engage with leading voices shaping the future of energy. The event offers the chance to stay up to date on both technical advancements and policy developments, ensuring you remain ahead in a fast-moving landscape.
Beyond the sessions, GET 2025 is a place to connect with peers, build new relationships and collaborate across sectors. The exhibition floor will showcase the latest tools, technologies and solutions, offering hands-on insight into where the energy transition is heading.
Free visitor passes and early registration discounts are still available. Make sure to register by 1 October to secure reduced

rates. If you want the full GET experience, opt for an all-access pass, which includes workshops, field trips and short courses that dive deeper into key topics.
Visit eageget.org for the full programme, registration details and travel information.
‘This is an opportunity to explore the technologies enabling the energy transition, from seismic advancements to cost-effective monitoring and renewable integration. Collaboration across disciplines will spark new solutions to urgent challenges.’ –Mike Branston, new energy domain lead – EXD, SLB
‘We’re covering the full spectrum of geothermal innovation - from advanced geophysics and reservoir modelling to real-world applications like district heating and power. Both low- and high-temperature resources are in focus, reflecting geothermal’s expanding global role.’
– Ghazal Izadi, COO, XGS Energy
‘With strong momentum from both industry and academia, hydrogen is emerging as a key pillar in a secure, low-carbon energy future. Across nine sessions, around 40 experts will address storage in salt caverns, depleted reservoirs, and aquifers, along with microbial effects and natural hydrogen.’ –Bahman Bohloli, senior specialist, NGI
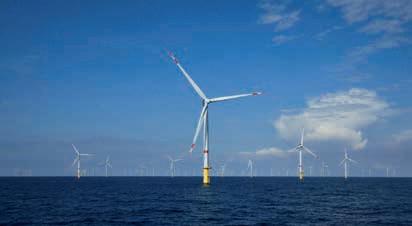
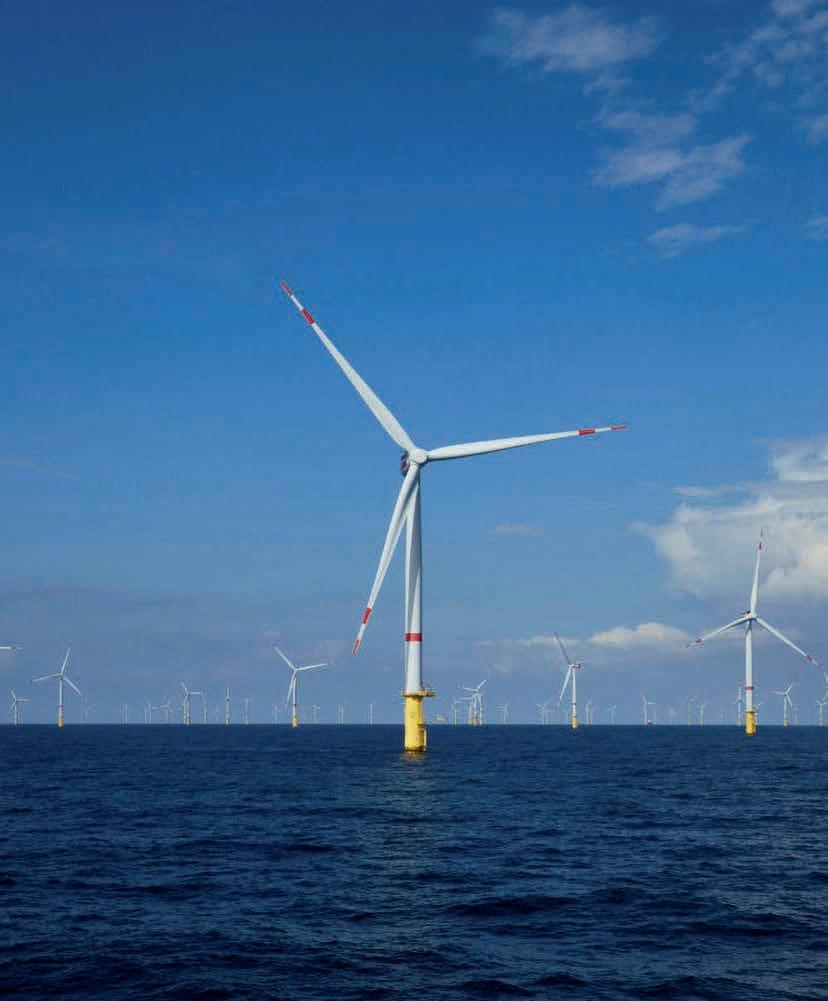
‘Our offshore wind sessions will span technical innovation in geophysics and ground modelling, frontier technologies like geohazards and seismic sources, and strategic synergies with CCS and hydrogen. This is where global experts shape what’s next in offshore renewables.’ –Maarten Vanneste, technical expert, NGI
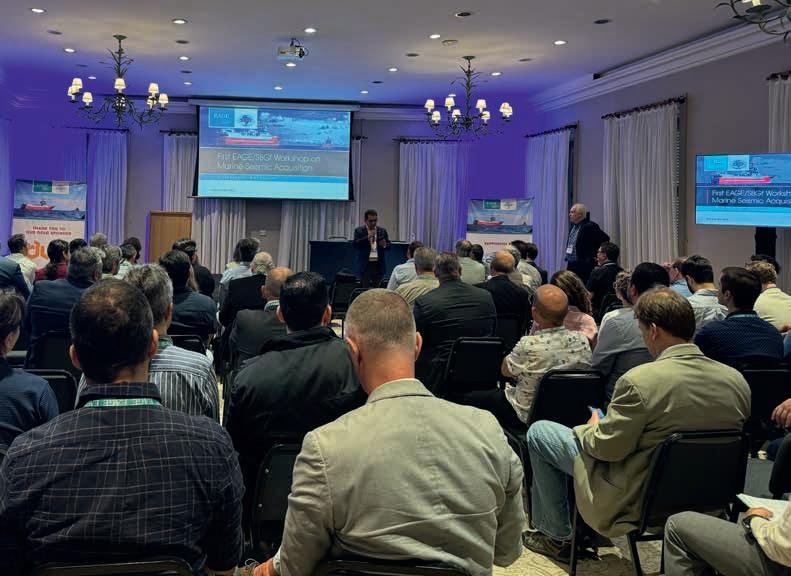
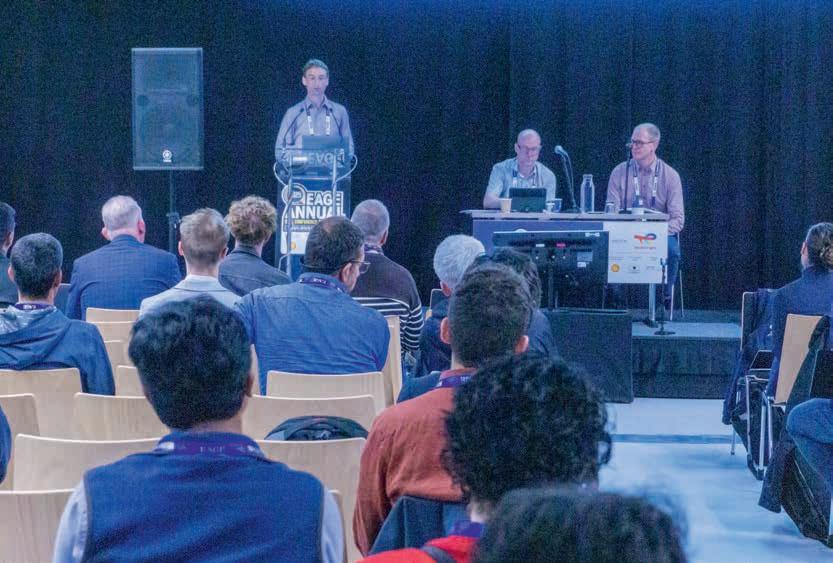
Here’s what was discussed at the successful 1st EAGE/SBGf workshop on marine seismic held on 21-22 May 2025 in Rio de Janeiro, Brazil.
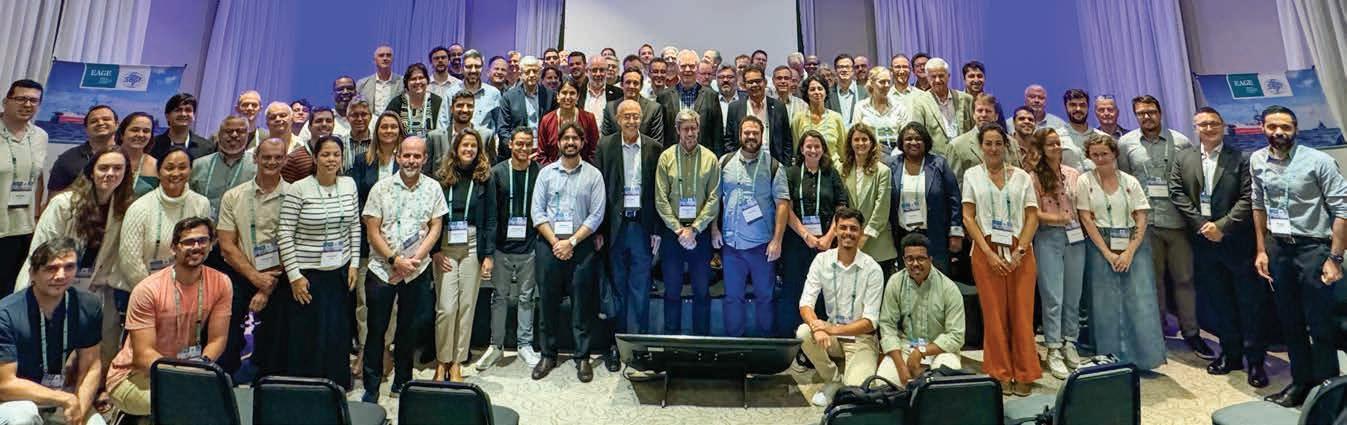
The event was inspired by the marine seismic acquisition workshops that have been taking place in Norway since 2018. Now Brazil is providing a complementary event as a hub for innovation and high-quality seismic data to image and monitor the prolific pre-salt reservoirs under strict environmental constraints.
Exceeding all expectations, the event attracted more than 110 participants, with a very strong representation from Petrobras as the main customer for the technologies under discussion, and proportional representation from other oil companies with operated or non-operated ventures in Brazil, including Equinor, Shell, TotalEnergies, Chevron and ExxonMobil.
There was also broad participation from service companies which support seismic acquisition, including TGS, Sercel, BGP, PXGEO, Shearwater, SAE, Alcatel, InApril, Ocean Infinity, Toveri, and Gaia. Also represented were seismic processing
companies, including DUG, SLB, Bluware, Searcher Seismic. Companies offering environmental and logistical services also participated, including Sonardyne, Seiche, Seisintel, GeoMain, and lesBrasil. Other organisations represented included research agencies funded by the Brazil R&D obligation, including UFRN, UFF, Aqualie, and UTFPR. Finally, there was important attendance by the environmental regulator IBAMA.
Topics spanned innovative seismic sources and sensors, case studies, and the latest technologies designed to enhance efficiency while minimising environmental impact. Key areas included advances in permanent reservoir monitoring systems, broadband and simultaneous source techniques, marine vibrators, and innovative ocean-bottom nodes, including the integration of fibre optics for data acquisition. Also on the agenda were AI-driven applications, drones, and satellite technology for wildlife monitoring, alongside sustainable approaches to seismic acquisition through real-world case studies and innovative survey designs.
The topics were organised into eight sessions, with 25 speakers, addressing advances in permanent reservoir monitoring (PRM), seismic sources, seismic sensors, and sustainable acquisition.
We were reminded of the four PRM systems in operation by Equinor in shallow waters in Norway, two older electrical systems and two newer fibre optic systems, and the efficiency of 4D processing delivering images in six weeks from surveys acquired every six months. Inspired by the Jubarte PRM pilot (2011-2013), a technological pioneer ultra deepwater and proofof-concept in Brazil, the newest fibre optic PRM deployment will be in deepwater Brazil in the Mero field, with one system monitoring two platforms starting in late 2025. A second system is planned for two other platforms from 2027. Considering a lifespan of 20 years or more, there was a debate about incorporating improvements in source technology over time, for improved
data quality or lower cost operations. Justification for such large upfront investments was discussed, bearing in mind the return on investment together with the remaining oil reserves and field development plans.
The upcoming technology of on-demand OBN (OD OBN) was discussed as a middle ground between OBN and PRM. The first deployment of such a system is planned in Brazil starting in Q4 2025. PRM systems open the door for testing innovative technology, like distributed acoustic sensing (DAS), where fibre optic cables are deployed along the PRM cables (surface DAS or S-DAS) and record seismic data. Also having a continuous stream of recorded data allows for using passive seismic records either for imaging or wildlife monitoring.
The various 4D OBN campaigns in execution in Brazil are being used to evaluate recent technologies and innovative monitoring concepts. For example, during the latest monitor survey over the Búzios field, Petrobras experimented with the concept of Focus 4D (also known as i4D) to determine the minimum time for 4D signals to be detectable (weeks or months) over an area with a fluid switchover during a water-alternating-gas (WAG) operation.
Continuing development of marine vibrators including field trials plus detailed processing by Shearwater and the MVJIP were discussed to demonstrate the benefits of the technology. Demands from the business and the path to commerciality remain less clear.
There was broad interest on lower-impact operations, including smaller airgun arrays, marine vibrators, and a variety of sources focused on low frequencies. The latter especially has targeted the needs of full waveform inversion (FWI). Lower footprint operations with denser node arrays (and sparser shot
grids), lean-crewed vessels and autonomous vessels were also discussed. An important context was provided by the UN Sustainable Development Goals (SDGs), particularly the item #14 Life Below Water.
A key perspective in the Brazilian seismic acquisition context was provided by the regulator IBAMA. One key point was its concern that the emphasis on lower-frequency sources needed a proactive approach to investigate the impact that they may have
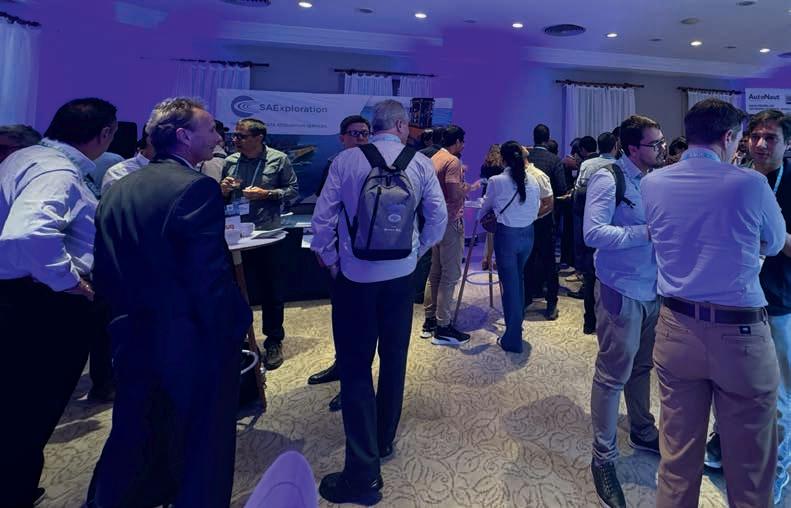
Informal exchange of views.
on marine life. Another specific concern related to the speculative seismic market, which inundated their analysts with numerous environmental licensing requests, frequently in overlapping areas, and which were often discontinued or not used if granted. These requests consume a lot of time and should be addressed by the seismic operators, the agency said.
31 OCT
•
ASSESSMENT OF CO2 STORAGE INTEGRITY BY UNDERSTANDING COUPLED THERMO-HYDRO-CHEMICAL-MECHANICAL PROCESSES, BY ANDREAS BUSCH
• BOREHOLE SEISMIC MONITORING FOR SUSTAINABLE ENERGY SOLUTIONS, BY SEBASTIEN SOULAS
• UNDERGROUND HYDROGEN STORAGE IN ROCKS: PORE-TO-CORE SCALE FLOW PROCESSES, X-RAY IMAGING AND MODELLING, BY KAMALJIT SINGH
• SEISMIC DATA PROCESSING FOR OFFSHORE WIND FARM DEVELOPMENT, BY SHAJI MATHEW
ROTTERDAM, THE NETHERLANDS DURING
ROTTERDAM, THE NETHERLANDS
DURING GET 2025

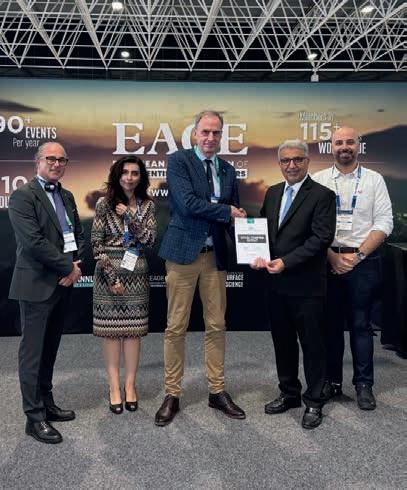
The journey of the EAGE Local Chapter of Kuwait has been nothing short of remarkable. Since its establishment, the Chapter has steadily grown into an active and inspiring platform that brings together geoscientists, engineers, and students from across the country. In just two years, we have already been honoured with the Best Local Chapter Newcomers award in 2024 and proudly secured the prestigious title of Best Local Chapter 2025. This global recognition serves as a testament to the commitment, energy, and vision shared by our members and leadership.
Since the beginning the Chapter has embraced a variety of initiatives aimed at engaging members and creating value for the geoscience and engineering communities in Kuwait. Some of the most notable trends we have observed among our local members include a strong interest in field trips, which continue to be one of the most anticipated activities. Additionally, our in-person technical sessions on cutting-edge topics in geoscience and engineering have witnessed high levels of attendance and interaction, reflecting the eagerness of our community to stay informed and connected. Complementing these activities, social events have played a key role in strengthening the sense of community among members, fostering collaboration beyond the professional realm.
Looking ahead, we have ambitious and thoughtful aspirations for the future. We aim to increase the level of involvement of engineers, as geologists currently form the majority of our membership base. Reaching out to a broader and more diverse audience
is also a priority, particularly through initiatives like our bilingual Geology Handbook of Kuwait, which is currently in preparation and designed for school students, non-geologists, and government entities. We believe that incorporating more social and environmental events will help attract a wider segment of society and contribute to the inclusive growth of our Chapter.
In addition, we seek to deepen our collaboration with governmental
sectors and local societies, supporting the expansion and sustainability of our initiatives. We also aspire to enhance diversity within our chapter by encouraging non-Kuwaiti professionals and students to take part in our activities. Recognising the importance of holistic development, we plan to introduce programmes focused on soft skills, career development, and community service, ensuring that our Chapter not only supports technical growth but also empowers individuals to make meaningful contributions to society.
We will soon be preparing for the first EAGE Offshore Workshop titled Seismic to simulation and organising an international geological field trip to Tuwaiq Mountain in Saudi Arabia in collaboration with Aramco. We will also be organising the second edition of the Advances in Carbonate Reservoirs Workshop, building on the success of the inaugural event. These efforts aim to elevate our Chapter’s impact and create opportunities for our members to engage in transformative learning experiences.
To celebrate the journey that led to winning the Best Local Chapter award for 2025 board members gathered over dinner, reflecting this is not just a title but represents the dedication, creativity, and teamwork that have shaped us into a vibrant, engaging, and forward-thinking community.


Every month we highlight some of the key upcoming conferences, workshops, etc. in the EAGE’s calendar of events. We cover separately our four flagship events – the EAGE Annual, Digitalization, Near Surface Geoscience (NSG), and Global Energy Transition (GET).

EAGE Workshop on Enhancing Subsurface Practices using AI/ML 10-11 November 2025 – Perth, Australia
Innovate and inspire! This workshop is your platform to showcase how you’re tackling one of humanity’s greatest challenges: understanding the hidden structure of the Earth. AI/ML has evolved from a concept to a powerful tool for geoscientific inquiry. From delineating faults to refining seismic images, these technologies allow us to infer, classify, and quantify uncertainty in ways never before possible. We want to hear how you’re using ML across the vast spectrum of geophysical data – from classification to interpretation and beyond. Join the conversation, and help shape the future of sub surface exploration and recovery by registering for the event.
Early fee until 30 September

EAGE Rock Physics Workshop 10-12 November 2025 – Cape Town, South Africa
Hosted in a city renowned for its stunning geological setting, the workshop begins with a field trip (included in delegate fee) on 9 November covering The Geology of Cape Town & Cape Peninsula offering a hands-on look at the region’s remarkable rock formations. A core display will also be featured during the event.


Third EAGE Workshop on Geothermal Energy in Latin America
12-14 November 2025 – Guancaste, Costa Rica
As Latin America moves toward greener and more sustainable economies, geothermal energy emerges as a key alternative – offering high resource potential, exceptional reliability with capacity factors above 80%, and resilience to climate variability. However, harnessing this resource requires a deeper understanding of complex geological environments. The third edition of the workshop will serve as a dynamic forum to exchange knowledge, share lessons learned, and explore strategies for reducing development risks. The programme will also feature a field trip to ICE’s geothermal

The workshop will explore how cutting-edge advancements, such as full waveform inversion (FWI), extended FWI (EFWI), and deep learning, are being synergistically integrated with rock physics principles. This integration is now playing a critical role in enhanced reservoir characterisation.
Early bird fee until 1 October (50% discount for African residents)
Early bird fee until 20 September
EAGE/FESM Conference on Petrophysics
Meets Geoscience: Unlocking Reservoir Potential in a Dynamic Energy Landscape 18-20 November 2025 – Kuala Lumpur, Malaysia
The conference brings together global experts to advance integrated reservoir characterisation by aligning petrophysics, geology, and geophysics to explore multi-scale workflows – from nano-pore rock-fluid interactions to basin-scale reservoir development. Technical discussions will cover quantitative interpretation (QI), 4D time-lapse techniques, AI-driven analysis, advanced logging-while-drilling (LWD), and high-resolution data acquisition. With the energy landscape shifting toward decarbonisation, key themes also include carbon capture and storage (CCS), net-zero strategies, and cross-disciplinary innovations supporting the energy transition.
Early fee until 17 October
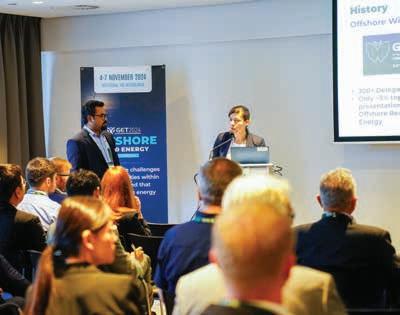
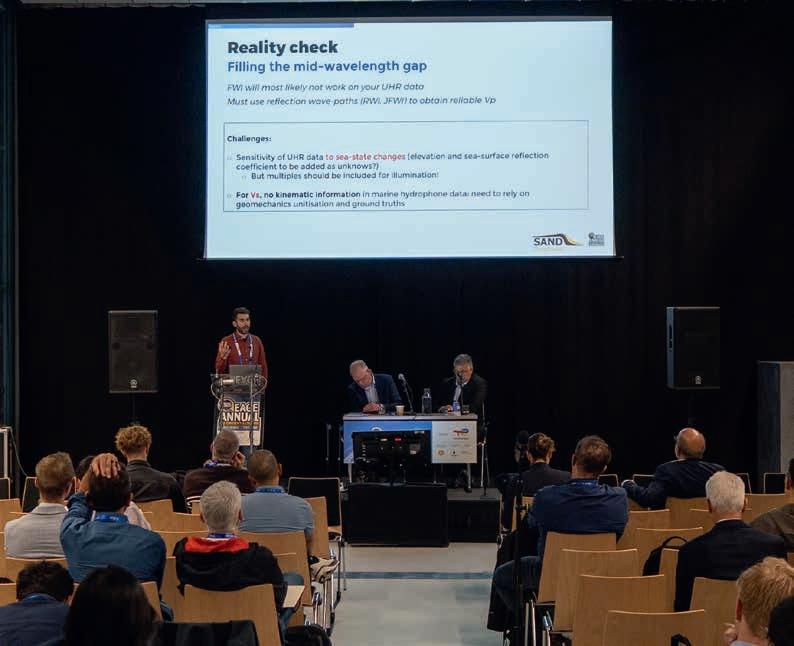
Dong Zhang (Fugro), Eric Verschuur (TU Delft), Eric Cauquil (TotalEnergies) and Gwenaëlle Salaün (Independent consultant, formerly Ørsted) report on EAGE Annual 2025 workshop on Elastic inversion of 2D/3D UHR/EHR seismic data for offshore wind.
The workshop was a resounding success with over 60 participants from across the global offshore wind industry and beyond fostering vibrant discussions and knowledge exchange.
The objective was to gain insights and explore current practice and innovative workflows related to UHR seismic elastic inversion, and its application to offshore renewables as part of the energy transition. This was done by identifying best practices, potential pitfalls and causes of uncertainties in the required input data from hands-on experience and lessons learned throughout the industry and academia.
The workshop was structured around three key themes (organised in three presentation sessions), being: (1) the stateof-the-art UHR seismic acquisition and processing; (2) borehole geophysics and seismic CPT; (3) seismic inversion techniques, ending with a thought-provoking panel discussion.
From the first session it became clear that pre-processing of UHR seismic data – compared to the more traditional deep seismic data – has some extra challenges regarding extreme feathering and other positional limitations like source and streamer depth variations, requiring advanced regularisation methods. In addition, the sources – typically sparker sources – give less predictable source signatures with strong angle-dependent variations. In addition, the variations of the water waves are in the wavelength range as the subsurface resolution. This requires extra effort in removing ghost effects and multiples. Tidal variations and spatially varying water speed are additional complicating factors. Altogether, data pre-processing needs to be done very carefully to make the data useful for elastic inversion.
For the second session two methods used to acquire in situ Vp and Vs were discussed, i.e., seismic CPT and PSSL. As demonstrated during the workshop, each method has its own strengths and limitations, but they can also be complementary – especially in the unconsolidated layers of the shallow subsurface. The use of (seismic) CPTs is considered as a ground truth experiment to calibrate the seismic inversion. However, traditional cone-penetration tests (CPTs) do not always provide reliable results and the connection with the elastic parameters coming from seismic inversion is not obvious and based on some a priori models. Furthermore, the so-called seismic CPTs, where shear wave speeds are measured during a CPT survey with an acoustic logging tool, cannot be considered ground truth, as they have quite a bit of inaccuracy in them, especially in the unconsolidated part of the shallow subsurface. The only alternative would be to directly measure surface waves and derive the shear velocities from dispersion-curve analysis. However, this needs a multi-channel seismic set-up with sources emitting much lower frequencies than the ones used for the UHR data.
In the third session the actual elastic inversion of the seismic reflection data was considered. From described cases studies it was shown that success was not guaranteed: low quality data did not allow to access shear wave velocities from the AVO information. Furthermore, typical streamer lengths of 100 m are not considered long enough to access the S-wave velocity information via AVO inversion. Therefore, calibration with reliable ground truth measurements is indispensable, while going to larger offsets seems a must for future data acquisition projects. Also, more advanced inversion methodologies like elastic FWI, combining both kinematic and dynamic information from seismic data, seems a way forward for more accurate inversion results.
For the panel discussion Gwenaëlle Salaün (independent consultant), Eric Cauquil (TotalEnergies), Alistair Robertshaw (bp) and Joek Peuchen (Fugro) were invited to the stage enabling the complete wind farm site characterisation process to be reviewed from a larger perspective. The aim of geophysical data, like seismic surveys is to limit, but not eliminate, the use of hard measurements such as (seismic) CPTs. At the same time a typical wind farm site investigation project takes about 30% of the total costs for windfarm development, where a balance between costs and payback, e.g., leading to the use of more cost-effective monopiles, should be found. At the same time regulators play a role in their requirements for site investigation, which may limit the freedom of geophysical acquisition. An additional factor is that relationships between elastic parameters (seismic P-wave and S-wave velocities and densities) and the required geotechnical soil properties are largely unknown and also unexplored. A lot of work is still to be done, in which machine learning could play a role.
At the end of the workshop the key takeaways were summarised as follows: 1) Stronger integration between UHR/EHR
seismic acquisition and processing is essential. Questions such as how processing can inform acquisition design, the optimal streamer length for AVO analysis, and the necessity of near-field hydrophones and sparker source characterisation were raised as critical areas for collaboration; 2) Borehole geophysics and CPTs are often considered the ground truth, but the workshop highlighted significant uncertainties and limitations in borehole measurements, which may not always reflect true subsurface conditions; 3) Improved inter-disciplinary understanding is needed between geophysicists and geotechnical engineers. A notable disconnect exists regarding resolution expectations: while geophysicists aim for ultra-high resolution (~0.5 m), geotechnical engineers typically focus on averaged soil stiffness over areas of approximately 20 m x 20 m. This raises questions about the practical value of UHR data for seismic inversion, though it may still be valuable for boulder detection; and 4) Enhanced communication among operators, engineers, and geophysicists is crucial for the success of offshore wind projects. Bridging these gaps will lead to more effective project planning and execution.
Time to start planning for the EAGE Near Surface Geoscience Conference and Exhibition 2026 set to take place in Thessaloniki, Greece on 20-24 September 2026.
Thessaloniki’s rich archaeological history provides the perfect meeting place for professionals, researchers, academics and industry experts from around the world to come together and discuss the latest developments, trends, and innovations in the near surface geoscience and engineering sector.
Four parallel conferences will be held at the event. These include the 32nd Meeting on Environmental and Engineering Geophysics exploring near surface challenges the world is currently facing and how they are being tackled. The 7th Conference on Mineral Exploration and Mining will focus on recent advances, trending topics, and novel geophysical methods in mineral exploration and mining. The 2nd Conference on Geohazards Assessment and Risk Mitigation will address the growing impact of geohazards, such as earthquakes, landslides, volcanic eruptions, floods, and coastal erosion, risks that have become more frequent and severe with climate change and rapid
urbanisation. Lastly, the 3rd Conference on Hydrogeophysics will explore the structure and processes of the subsurface environment to identify key properties and variables related to water flow and solute transport, particularly in a rapidly changing climate.
The conferences will offer attendees a unique opportunity to explore a
wider range of topics and innovative methods, encouraging cross-disciplinary collaboration and knowledge exchange to expand the boundaries of geoscience.
Stay tuned on www.eagensg.org for further updates, as more detailed information about the conference and exhibition will be announced soon.

EAGE welcomes the opportunity to recognise outstanding young professionals who have become recipients of the Petroleum Geoscience and Basin Research Early Career Awards 2024. These accolades are presented annually for the best papers published in the two journals in the past year by authors in the early stages of their careers.
The Petroleum Geoscience Early Career Award is for a paper that offers a novel approach or interpretation of a compelling and widely relevant topic in petroleum geoscience. This year, we congratulate André Gondim Brandão, research geologist at Laboratory of Sedimentary Geology (Lagesed), Department of Geology, Institute of Geosciences, Federal University of Rio de Janeiro. His winning paper ‘Fracture analysis in borehole images from BM-C-33 area, outer Campos Basin, Brazil’ is published in Petroleum Geoscience, volume 30, issue 2.
André Gondim Brandão says: ‘Carried out as part of my master’s research, the study investigates the characteristics of natural fractures and how they have influenced reservoir properties in the Raia area, offshore Brazil. The research crowns years of dedication and collaboration between Lagesed and Equinor, and the Early Career Award represents a key achievement in my career. I am deeply honoured by this recognition and excited to use it as motivation to contribute to future projects in the energy industry.’
The reservoirs in the BM-C-33 area, located within the Raia Manta and Raia Pintada development zones, are pre-salt
limestones situated on volcanic sequences. These reservoirs have a complex geological history, including post-depositional silicification that altered mineral composition and led to intense fracturing.
Brandão’s study using borehole image logs, wireline data, and seismic surveys analysed the acoustic and resistivity properties of these fractures. The pre-salt section was divided into three informal stratigraphic units, and it was found that major fracturing was caused by regional tectonic stress, with local positioning also playing a role. A direct relationship was identified between fracturing and silicification.
The analysis further indicated that the distribution of fracture density, vug volumes, and dissolution features, which were limited to specific units, suggests a stratigraphic control on fluid percolation. Brandão’s study concluded by highlighting how the unique structural features of the BM-C-33 area likely influenced the intensity and extent of these diagenetic alterations.
Early Career Award 2024
The Basin Research Early Career Award recognises research published in the journal that marks a significant step forward in our understanding of sedimentary basins and published within three years of thesis completion. We congratulate Ziqiang Zhou (PhD researcher, Department of Earth Science and Engineering, Imperial College London) on winning the 2024 award for his paper ‘Unravelling tectonic and lithological effects on transient landscapes in the Gulf of Corinth, Greece’, published in Basin Research, volume 36, issue 5.
Ziqiang Zhou explains the approach of his study: ‘Our paper is motivated by the fact that although many tectonic active areas have heterogenous bedrock, the effect of lithology is often not considered in tectono-geomorphologic analysis. This matters as spurious tectonic interpreta-
tions can emerge if the effect of lithology is not accounted for. Focusing on the Gulf of Corinth, one of the best-studied rifts in Europe, we constrain the erodibility of multiple contrasting lithologies. In particular, we show that lithology-calibrated topographic metrics provide tectonic constraints consistent with independent geological evidences. These calibrated metrics also extend previously scattered constraints on the timing and magnitude of tectonic events to the entire region, allowing us to refine the fault growth and linkage history of the Gulf of Corinth. By doing so, this work demonstrates tectonic and lithological effects on topography can be reasonably isolated through our relatively simple topographic analyses. Excitingly, our approach can be readily applied to many other regions as long as digital elevation models and geological maps are available.’
Zhou adds: ‘I’m truly honoured to receive the Early Career Award for this work – something I couldn’t have achieved without the incredible guidance and support from my supervisors every step of the way. Seeing the many hours we poured into this research recognised by the community means a lot to me. It feels like an important milestone in my PhD journey, and has given me a big boost of confidence and motivation to dive into even more exciting research ahead.’


With 2 award categories for students and young professionals, EAGE champions talent from the start - fostering excellence, innovation, and shaping the future of geoscience and engineering.


MYRTO PAPADOPOULOU

Arie van Weelden


Award recipient 2025


Receiving the EAGE van Weelden Award for my work in reflection seismic and surface-wave methods marked a personal journey of collaborations, research and industry partnerships, and active community engagement. To young professionals, I say: stay curious, be fearless and let your passion, curiosity, and collaboration guide you. Near-surface geoscience is a catalyst for building a sustainable future, and you are an essential part of making that future a reality.


6 CELEBRATING EXCELLENCE SINCE 1955


UNLOCK OPPORTUNITIES FOR GROWTH


STUDENTS CAN APPLY FOR THEIR FIRST YEAR OF MEMBERSHIP FOR FREE (RE)ACTIVATE YOUR MEMBERSHIP TODAY!


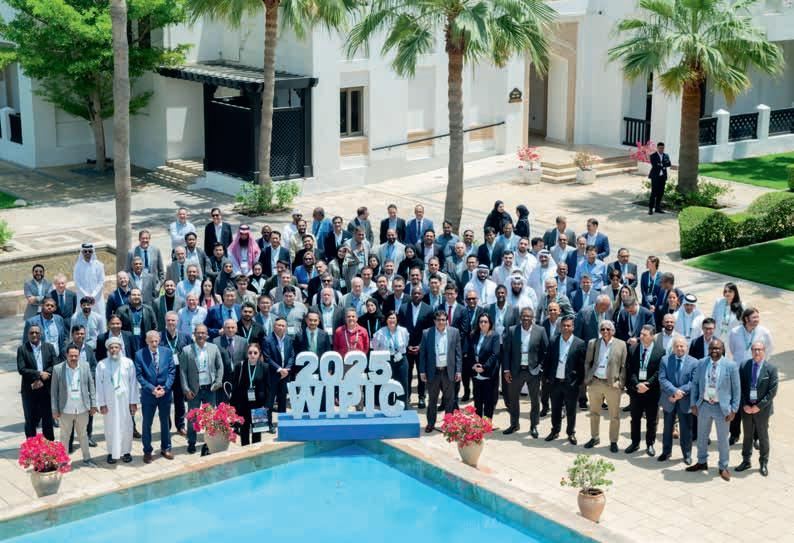
Over 200 participants attended the fifth edition of the EAGE workshop on well injectivity and productivity in carbonates (WIPIC 2025), held in April in Doha, Qatar. This is the report.
Under the theme Innovative Technology for Reservoir Optimisation, the four-day workshop served as a robust platform to bridge theory and practice, facilitating knowledge exchange between academia and industry, and offering an arena for discussing novel technologies, field applications, and future-forward strategies.
A recurring narrative throughout WIPIC 2025 was the intersection of digital innovation and human expertise. The integration of artificial intelligence (AI), machine learning (ML), and digital transformation into reservoir management was widely discussed, revealing a sector increasingly reliant on data-driven tools without losing sight of the critical role of human judgment.
Several sessions emphasised cross-disciplinary approaches, integrating geomechanics, geophysics, and digital rock physics.
A standout example was the QASR simulator, a Qatar-initiated innovation that successfully transitioned from academic research to commercial deployment underscoring the workshop’s focus on regional contributions and applied innovation.
Sustainability and energy transition also emerged as dominant themes. Topics such as CO2 storage, fault reactivation, and water control were explored from both technical and environmental lenses.
Audience engagement was notably high, with active participation during short courses, panel discussions, and poster sessions. Day One’s hands-on short courses attracted professionals eager to sharpen their skills in machine learning, reservoir simulation, and uncertainty quantification.
Attendees showed particular interest in AI/ML applications, not only in technical modelling but also in their broader implications for workforce development and digital workflows. The 10th anniversary celebration of the event added a human dimension, reinforcing the workshop’s sense of community and continuity.
WIPIC 2025 highlighted the evolving identity of the energy sector, a field actively shaping, not just responding to, technological shifts. The workshop confirmed a collective move toward data-augmented decision-making, where models and algorithms complement, but do not replace, professional insight.
Panel discussions brought forth debates on the role of AI in empowering versus replacing human expertise, maintaining production performance while aligning with sustainability goals, and the value of regional innovations like the QASR simulator. Education, upskilling, and inter-disciplinary cooperation were highlighted as crucial to harnessing these innovations.
As the curtain closed on this fifth edition, the message was clear: technology and talent will continue to shape the future of energy.
The EAGE Student Fund supports student activities that help students bridge the gap between university and professional environments. This is only possible with the support from the EAGE community. If you want to support the next generation of geoscientists and engineers, go to donate.eagestudentfund.org or simply scan the QR code. Many thanks for your donation in advance!
We have now published over 50 Personal Record interviews , allowing us a glimpse into the varied careers and private lives of professionals working in our geoscience and engineering community. Here is just a brief selection of some memorable quotes from the archive.

Advice for young geoscientists
Give, expect, and demand respect. If you ever witness or experience something drastic as discrimination or sexual harassment, seek help and speak out. Don’t shy away from the larger challenges. Be curious and follow your passions. Explore the idea of being paid for what could be your hobby.
- Adriana Citali Ramirez, chief geophyscisit, TGS and artist/poet
Personal inspiration
On my first night in hospital, blinded with shrapnel, a nurse read the following passage to me from The Greatest Salesman in the World by Og Mandino: ‘I will persist until I succeed. I was not delivered unto this world in defeat, nor does failure course in my veins. I am not a sheep, waiting to be prodded by my shepherd. I am a lion and I refuse to talk, to walk, to sleep with the sheep ….’
- Andrew Long, PGS (now TGS) on recovering from survey accident
Lifetime conclusion
After years of exhausting effort, I have reached a conclusion .... My message is that the idealism of the young age has surrendered to the realism of the old age.
- Oz Yilmaz, CTO, GeoTomo, author of seismic processing reference works
Challenging beginnings
I was born and raised in Ndwedwe, one of the poor rural villages in South Africa. I had a tough early childhood. My father died when I was two years old, leaving my mother to raise me and my five siblings from her low income as a domestic worker. Though my mother did not have an opportunity to go to school she worked hard to instil discipline and the importance
of education in my life. So she was my greatest strength and true inspiration.
- Musa Manzi, associate professor in geophysics, University of Witswatersrand
Invention(s) most proud of?
It’s hard to pick one of my children …
- Doug Crice, owner, Geostuff
Working in oil industry
It did take me almost 10 years to feel good about what I do. As a biologist, I felt like I was working for the dark side! What changed was understanding how energy access is essential to pull people out of extreme poverty and feeling like I was able to make a real change …
- Daniella Bordon, global ESG manager, BGP Offshore
Lessons from sport for geoscience
To be successful in sport you need to work hard, and be dedicated and persistent over long periods of time with no instant gratification. You should never be content with past glory but always strive for improvement. Another lesson is that no matter how talented and hard-working you are, you will never succeed alone.
- Vetle Vinje, CGG (now Viridien) and Olympic rowing silver medallist
Everyday life in Kyiv
I witnessed the aftermath of an attack drone just 200 metres from my home. Eleven flats were damaged serving as a stark reminder of the proximity of danger. From our shelters, we hear the reverberations of hundreds of explosions in various parts of the city.
- Dmitry Bobheza, EAGE office, Kyiv
Prospects for students
I always encourage students to study what they think is fun. What they actually will work with will sort itself out eventually. Doing what you think is exciting will take you there.
- Johan Robertsson, professor applied geophysics, ETH-Zurich
Can activism affect change?
It is the only thing that can affect change.
- Richard Pancost, professor of biochemistry, University of Bristol
Advice to young entrepreneurs
Gain experience, do a job, work for a boss. From a practical perspective, not everyone can drop out of college and be Mark Zuckerberg, as we often have family and financial responsibilities that have to be balanced with entrepreneurship.
- Nina Hernandez, Iraya Energies
Do geology and music relate?
I’ll spare you the obvious plays on the word ‘rock’. But really, I don’t separate them in my mind. Both require creativity and imagination…
- Tony Dore, Ex-Equinor and professional musician
Pole position
To me pole (dance) is a sport that challenges my body every day just like petrophysics challenges my brain every day. In my job interview the pole was behind me and I think I introduced myself as ‘I’m, Zoë, I love rocks and pole’. Don’t knock it until you’ve tried it – life is better upside down.
- Zoë Cumberpatch, petrophysicist, Equinor
BY ANDREW
There’s little more perplexing than trying to assess exactly where the world is going with energy transition, so much so that sometimes it feels as though we have set sail on a journey in which even the destination is unclear. Best we can do is judge which way the wind is blowing.
This may not be a conclusion that delegates to our flagship Global Energy Transition (GET 2025) next month in Rotterdam will want to contemplate. Nor, one suspects, will this community of geoscientists dedicated to energy transition and the ultimate goal of a decarbonised world be entirely happy with the progress of needed technology subject to a world buffeted by political and economic crosswinds.
Undeniably there has been a shift in the conversation post-Covid and the advent of two wars. In summary, energy security, industrial/commmercial considerations, near stalemate of COP-type meetings, and a rising tide of populist/anti-regulation movements in many countries have all taken a toll on the priority being accorded to climate change (even in a summer of raging fires around the world).
It is becoming the orthodoxy to talk about energy addition rather than energy transition, which is indeed the theme of EAGE’s Annual Conference & Exhibition next year in Aberdeen. It was also a feature of future energy scenarios offered by Dr Scott Tinker in his Opening Session presentation at this year’s meeting in Toulouse.
The mindset now is that energy addition is about meeting the unavoidable growth in demand factoring in rapid industrialisation and population increases in the developing world. Substantial oil and gas production for the foreseeable future is going to be needed, while at the same time we somehow do not lose sight of climate change mitigation/decarbonisation in whatever form that might take, e.g. building renewable capacity, cleaner energy production, carbon capture and storage, etc.
For some naysayers, even this strategy is too great a concession to the energy transition. From day one in office the Trump Administration proclaimed its hostility, notably withdrawing

the US from the 2015 Paris Climate Agreement, rolling back clean energy provisions in the Biden Inflation Reduction Act, and waging war on wind power whilst enacting measures to boost US domestic oil and gas production. It remains to be seen exactly how much impact these policies have, given the US is second only to China in its energy transition investments (World Econmic Forum). Whether the US can afford to overlook some green energy sources may be an issue. For example, the Energy Information Administration (IEA) forecasts US electricity sales to the commercial sector to rise by 3% in 2025 and 4.5% in 2026, driven largely by demand from data centres, while electricity sales to industrial consumers are expected to rise by 2% in 2025 and 3.5% in 2026.
We may wonder whether following the energy addition credo is putting off some hard choices on cooling the planet. We can all agree that the whole process was never likely to be a straightforward switch and is going to be much slower than optimists anticipated. In a recent Foreign Affairs essay on ‘The troubled energy transition’, Daniel Yergin reminded readers of the historical precedents from the moment in January 1709 that Abraham Darby, a village foundryman and ironmaster in England, hastened the transition from wood to coal and helped to initiate the subsequent Industrial Revolution by pioneering the use of coke as the fuel to smelt iron (instead of charcoal). Astonishingly it was not until the beginning of the 20th century that coal overtook wood as the world’s number one energy source. Similarly oil discovered in the mid-19th century did not overtake coal as the world’s number one energy source until the 1960s, and even today the world is using three times as much coal as it did in the 1960s.
Yergin makes the point on energy addition: ‘In 2024, the world used more wind and solar energy than ever before. But it also used more oil and coal than ever before’. He also cautions on the sheer scale of the decarbonising project in a $115 trillion-plus world economy that continues to grow making 2050 Net Zero increasingly unrealistic. He cites the Energy Institute’s Statistical Review of World Energy finding that between 2022 and 2023 the
world’s dependence on conventional energy – oil, natural gas and coal – declined by less than 0.5% from 81.9% to 81.5%.
Yet, for all the negativity, the commitment to energy transition worldwide is gigantic and obviously unstoppable, as the numbers show. One headline figure from the International Energy Agency’s 2025 annual World Energy Investment report suggests that global energy investment is set to increase this year to a record $3.3 trillion of which the share of clean technologies – renewables, nuclear, grids, storage, low-emissions fuels, efficiency and electrification – is on course to hit a record $2.2 trillion with oil, natural gas and coal reaching $1.1 trillion.
There are some concerning portents. Earlier this year Energy Transition Investment Trends 2025 compiled by research provider Bloomberg New Energy Finance found low-carbon energy transition worldwide grew 11% to hit a record $2.1 trillion in 2024 (close to the IEA figures). Growth was driven by electrified transport, renewable energy, and power grids, which all reached new highs last year, along with energy storage investment. However, the pace of growth was slower than the previous three years, when investment jumped by 24-29% annually.
Electrified transport remained the largest investment driver, reaching $757 billion in 2024, according to BNEF when spending on passenger EVs, electric two- and three-wheelers, commercial electric vehicles, public charging infrastructure and fuel cell vehicles is taken into account. Renewable energy hit $728 billion, including on and offshore wind, solar, biofuels, biomass and waste, marine, geothermal and small hydro. Investment in power grids totalled $390 billion, which includes investment in transmission and distribution lines, substation equipment, and the digitalization of the grid. Not specifically mentioned is IEA modelling that projects data centres will use 945 terawatt-hours (TWh) in 2030, roughly equivalent to the current annual electricity consumption of Japan. By comparison, data centres consumed 415 TWh in 2024, roughly 1.5% of the world’s total electricity consumption.
BNEF’s report also reveals a marked difference between investment in mature and emerging sectors of the clean energy economy. Technologies that are proven, commercially scalable and have established business models, like renewables, energy storage, electric vehicles, and power grids, accounted for the vast majority of investment in 2024. These sectors drew $1.93 trillion, growing 14.7%, despite perceived hindrance from policy decisions, higher interest rates and expected slower consumer purchasing.
In contrast, investment in emerging technologies, like electrified heat, hydrogen, carbon capture and storage (CCS), nuclear, clean industry and clean shipping, reached only $155 billion, for an overall drop of 23% year-on-year. Factors that discourage investment in these sectors include affordability, technology maturity, and commercial scalability. ‘In order to scale these industries, the public and private sectors need to do more to
de-risk these technologies, otherwise, they are not likely to have any meaningful impact on emissions by the end of the decade’, BNEF concludes.
Regionally the largest market for investment was China, which alone accounted for $818 billion of investment, up 20% from 2023. China’s investment growth was equivalent to twothirds of the total global increase in the year.
The EU, US, and UK, which drove growth in 2023, saw different results in 2024. Investment was stagnant in the US, reaching $338 billion, and down in both the EU and UK, hitting $375 billion and $65.3 billion, respectively. This made China’s total investment last year greater than the combined investment of the US, EU and UK.
A similar story is told by analyst company Bridgewater Associates in its March publication. Is the green energy transition dead? The short answer is no, it is not. However there are caveats. ‘To compete on costs and economics … companies can no longer rely on a “policy backstop” to make overambitious investments’. The company has previously estimated that about 40-50% of global emissions reductions required to achieve net-zero goals can come from scaling technologies that are already mature but the technology is not yet there to address the remaining 50-60% of emissions. The rollback of subsidies and other policy supports is likely to make the path more challenging. Already more than 90% of climate investment flows go to mature technologies, which are cost-competitive with fossil fuel-based options and thus likely to continue growing. The remaining 5-10% goes toward emerging or immature technologies that are unlikely to be profitable in the absence of subsidies and whose share has already been shrinking.
None of these observations should come as a surprise to those intending to attend GET 2025. The geoscience and engineering community is focused on technology solutions, many of which are extraordinary. But, technology advance is constrained by the investment imperatives of the market economy, political will and community acceptance.
Carbon capture and storage (CCS), due to garner a lot of attention at GET, illustrates the point. The trajectory of CCS deployment remains a long way off where it must be to deliver net zero by 2050, according to DNV’s Pathway to Net Zero study published in June. CCS will progress, growing from 41 MtCO2/ yr captured and stored today to an estimated 1,300 MtCO2/yr in 2050, 6% of global emissions, but six times less that what is said to be. ‘Economic headwinds have put pressure on this capital-intensive technology and corrective action will need to be taken by government and industry if we are to close the gap between ambition and reality’, DNV warns.
This is just one of many mammoth challenges ahead. The ever quotable Albert Einstein once noted: ‘A ship is always safe at shore but that is not what it’s built for’. At least the energy transiton ship has set sail.
Views expressed in Crosstalk are solely those of the author, who can be contacted at andrew@andrewmcbarnet.com.


WWW.EAGE. ORG


10-12 NOVEMBER 2025 • CAPE TOWN, SOUTH AFRICA
Register for the Seventh EAGE Rock Physics Workshop before 2 October to enjoy the early bird rate, which includes full access to both the workshop and field trip! Plus, we’re excited to offer a 50% discount on registration fees for African residents — don’t miss this opportunity to connect, explore, and learn at a great value!


Early bird Deadline: 2 October 2025

RPW25 V3H.indd 1 13/06/2025 08:11


SEABED SEISMIC: EVOLUTION THROUGH INNOVATION
24-26 NOVEMBER 2025 • MANAMA, BAHRAIN
Dive into the future of marine geophysics — register now for the Third EAGE Seabed Seismic Today Workshop and short courses , and join us in vibrant Manama for cutting-edge insights and collaboration !
WWW.EAGE. ORG Register now!

TGS has reported a second quarter net loss of $60 million on operating revenues of $334 million, compared to a net profit of $35 million on revenues of $224 million in the second quarter of 2024. It reported a second quarter operating loss of $18 million compared to an operating profit of $55 million in Q2 2024.
The company said that its results were ‘negatively impacted by several factors’, with several data licensing deals being postponed and ‘low client commitment to ongoing projects’.
To reduce operating expenses TGS has announced it is in the process of selling the vessels Ramform Explorer and the Ramform Valiant, and stacking the Ramform Vanguard
Challenging operational conditions for large contract projects and lower than expected JV partner participation for certain multi-client programmes further negatively affected contract revenues, TGS said.
Order inflow was a disappointing $133 million during Q2 2025, with total order backlog of $425 million, compared with an order inflow of $368 million and a total order backlog of $600 million in Q2 2024.
Organic multi-client investments were $115 million compared with $52 million in Q2 2024. The multi-client investment level was higher than expected due to ‘lower than expected joint venture partner participation for certain projects’.
Multi-client sales were $136 million compared with $115 million in Q2 2024. Contract sales were $172 million compared with $100 million in Q2 2024.
Net cash flow of $11 million in Q2 2025, compared with -$13 million in Q2 2024.
Gross operating costs for 2025 are expected to be approximately $950 million compared to previous guidance of approximately $1 billion – a reduction driven by further efficiency gains and vessel scheduling. Another piece of good news is that TGS’ external Imaging revenues were $19.4 million compared to $5.5 million in Q2 2024, as a result of TGS
strengthening its focus on data imaging on behalf of third party clients.
Kristian Johansen, CEO of TGS, said: ‘The Q2 2025 results were negatively impacted by several factors. End-of-quarter data licensing came in below expectations, Further, we encountered challenging operational conditions on one of our streamer projects, negatively impacting revenue recognition. Finally, lower-than-expected partner participation in certain multi-client projects resulted in lower recognition of contract revenues and higher multi-client investments.
‘Although significant macroeconomic uncertainty and high oil price volatility during Q2 caused our clients to be more cautious in the short term, the long-term need for more exploration remains intact. With falling remaining reserve life, many large E&P companies will face declining production rates unless more reserves are added and brought on stream. As a result, we remain optimistic for the long-term opportunities for TGS.’
In its outlook TGS said that ‘global energy demand is expected to increase over the coming decades, and we believe oil and gas will continue to play a vital role in the global energy mix. At the same time, the rapid decline of existing production, combined with rising costs, environmental concerns, and political and regulatory challenges underscore the need for more exploration in both mature and frontier basins. High-quality subsurface data is critical for optimising production from existing assets and enabling effective exploration in both well-known and underexplored areas.
‘During Q2 2025, macroeconomic uncertainty and OPEC’s accelerated production reversion of the production cuts implemented in Q4 2023 have contributed to significant oil price volatility. Although most of our key customers have reiterated their capex plans for 2025, the increased uncertainty has prompted a more cautious approach to data purchases in the short term.’
President Trump has moved to limit wind energy projects in America as a series of orders come into force.
The US Bureau of Ocean Energy Management (BOEM) has rescinded regulations that required the Secretary of the Interior to publish a five-year schedule of anticipated offshore renewable energy lease sales at least every two years.
‘After reviewing this regulation, the Department of the Interior has determined this provision is not mandated under the Outer Continental Shelf Lands Act and unnecessarily limits the Secretary’s discretion over scheduling renewable lease sales.’
Meanwhile, the US Department of the Interior is launching a full review of offshore wind energy regulations to ensure alignment with the Outer Continental Shelf Lands Act and America’s energy priorities under President Trump.
This effort includes reviewing the Renewable Energy Modernization Rule, as well as financial assurance requirements and decommissioning cost estimates for offshore wind projects, ‘to ensure federal regulations do not provide preferential treatment to unreliable, foreign-controlled
energy sources over dependable, American-made energy’.
The review, led by the Bureau of Ocean Energy Management and the Bureau of Safety and Environmental Enforcement will support Secretary’s Order 3437, ‘Ending Preferential Treatment for Unreliable, Foreign-Controlled Energy Sources in Department Decision-Making,’ and President Trump’s memorandum on wind energy signed on 20 January 2025.
‘The Department is fully committed to making sure that offshore energy development reflects President Trump’s America First Energy Dominance agenda and the real-world demands of today’s global energy landscape,’ said Secretary of the Interior Doug Burgum. ‘We’re taking a results-driven approach that prioritises reliability, strengthens national security and upholds both scientific integrity and responsible environmental stewardship.’
The Department has paused new approvals for offshore wind projects— including leases, permits, rights-of-way and loans — in compliance with the Presidential Memorandum on wind energy, while it conducts a review of offshore wind energy projects and their impact on
the environment, national security and the economy.
In support of these presidential directives, BOEM rescinded all Designated Wind Energy Areas on the Outer Continental Shelf on 30 July 2025.
Meanwhile, the US Department of the Interior has reversed the Biden administration’s approval of the Lava Ridge Wind Project, a 1000-megawatt wind facility in southern Idaho.
STRYDE has sold its Mini and Nimble seismic systems to the National Observatory of Brazil to support its geophysical research and exploration activities across Brazil.
The first deployment will focus on a pioneering natural hydrogen exploration project. ‘The National Observatory’s project will leverage STRYDE’s lightweight and agile seismic acquisition technology to acquire high-density seismic data to gain unprecedented insight into Brazil’s subsurface structures,’ said STRYDE in a statement.
‘This acquisition reflects STRYDE’s continued expansion into the Latin American market and underscores the growing global recognition of the company’s innovative approach to seismic acquisition for energy transition applications,’ the company added.
Sergio Luiz Fontes, senior researcher at the National Observatory of Brazil, said: ‘The use of STRYDE’s seismic systems will enable the Observatory to conduct advanced geophysical surveys with minimal logistical footprint and lower operational costs.’
The National Observatory of Brazil is one of Brazil’s oldest scientific research institutions. Founded in 1827, it operates under the Ministry of Science, Technology, and Innovation, based in Rio de Janeiro, is actively involved in monitoring seismic activity across Brazil, and partnering with national and international organisations on natural hydrogen, geothermal energy, and carbon capture and storage (CCUS).
‘This campaign will be the first of several research initiatives,’ added Fontes.
Viridien reported second quarter net profit of $6 million on segment revenues of $274 million, compared with 2024 Q2 net profit of $35 million on segment revenues of $258 million.
Operating profit was $52 million compared to $15 million in Q2 2024. Net cash flow of $30 million compared to a net cash deficit of $6 million in Q2 2024.
The company’s net debt has increased to $997 million from $941 million at the end of Q2 2024.
Data, Digital and Energy Transition revenue was $181 million, up 3% year on year, driven by a 10% increase in Geoscience revenue to $115 million.
‘For the past few years, Viridien has seen growing demand for advanced, high-quality, high-end subsurface imaging, especially in the US Gulf, Middle East, North Africa, and South America,’ said Viridien.
Earth Data revenue of $66 million was down 8%, but OBN projects started in Norway and the US Gulf segment.
Sensing and Monitoring revenue of $93 million was up 14% year-on-year. ‘Activity is mostly driven by the Land segment, with strong deliveries of nodal
system in South America and cabled systems in the MENA region, in particular. The Marine segment remains subdued. In New Businesses, Infrastructure monitoring is showing double-digit growth, while our Marlin Offshore Logistics solution achieved encouraging initial commercial success, with a contract signed with ONGC,’ said the results statement.
Sophie Zurquiyah, chief executive officer of Viridien, said: ‘Viridien delivered a solid performance in the second quarter of 2025. Despite a volatile environment, the group demonstrated resilience, driven by its primary focus on offshore markets and on leading oil companies. Combined with ongoing internal performance improvements, this resulted in robust year-on-year growth in both segment revenue and margins. From a cash perspective, Viridien generated a solid $30 million in net cash flow during the quarter, reinforcing our confidence in reaching our full-year target of $100 million. The combination of a healthy Geoscience backlog and expected licensing activity toward year-end supports our confidence in maintaining momentum on our deleveraging path.’
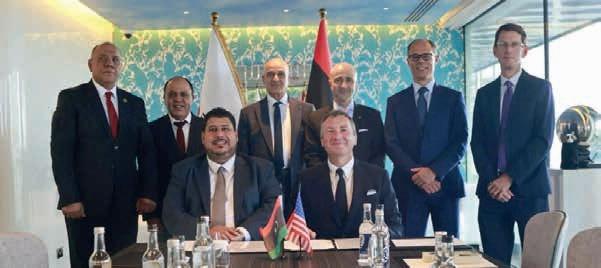
ExxonMobil has signed an agreement with Libya’s National Oil Corporation (NOC) to explore four blocks offshore Libya. A memorandum of understanding states that ExxonMobil will conduct a detailed technical study of four offshore blocks near the northwest coast and the Sirte Basin.
This MoU establishes a geological and geophysical study to identify the hydrocarbon resources in these blocks. It also paves the way for the resumption of the partnership between NOC and ExxonMobil, which aims to restart its activities in Libya after a decade-long hiatus.
The NOC said it was committed to ‘expanding partnerships with major American energy companies, particularly ExxonMobil’ and that contract terms are more favourable than in the past, reflecting global changes in the energy sector.
ExxonMobil has expressed interest in participating in the public bidding round initiated by the NOC, which includes 22 offshore and onshore blocks.
TotalEnergies has sold its 45% operated interest in two unconventional oil and gas blocks in Argentina, Rincon La Ceniza and La Escalonada, to YPF for $500 million. Total’s partners in these concessions are Gas y Petroleo de Neuquen (10%) and Shell (45%).
Tullow Oil has completed the sale of its assets in Gabon to the Gabon Oil Company (GOC) for $307 million. The sale of its Gabon assets marks Tullow’s exit from its licences in Gabon after 21 years. Tullow has also sold its assets in Kenya to Auron Energy Limited for $120 million. The transaction proceeds will be used to strengthen Tullow’s balance sheet by materially reducing Tullow’s net debt.
The US Bureau of Land Management New Mexico State Office has leased 16 parcels totalling 7501.76 acres for $58,260,939 in total receipts for its quarterly oil and gas lease sale. This is the third highest value for highest bid/ acre for a parcel for BLM. The lease sale is the first conducted under the One Big Beautiful Bill Act, which reset the royalty rate for new federal onshore oil and gas production to a minimum of 12.5%, reversing the 16.67% rate set by the Biden administration.
Norway’s preliminary production figures for June 2025 show an average daily production of 1,854,000 barrels of oil, NGL and condensate. Total gas sales were 8.8 billion Sm3 (GSm3), which is 0.5 (GSm3) less than the previous month. Average daily liquids production in June was 1,675,000 barrels of oil, 174,000 barrels of NGL and 5000 barrels of condensate.
Stone Ridge Energy has signed a deal to acquire ConocoPhillips’ Anadarko Assets for $1.3 billion. The agreement was for ConocoPhillips’ Lower 48 assets in the Anadarko Basin, Oklahoma, US, and the transaction is expected to close at the beginning of the fourth quarter.
TGS has completed of the Dawson Phase III 3D multi-client seismic survey in the Western Canadian Sedimentary Basin, covering 141 km2 and merged with the existing Dawson Phase II 3D to the north and west.
The project has utilised TGS’ Phase and AVO-compliant processing flow to enable precise subsurface imaging and valuable insights for operators developing Montney resources.
‘The Dawson III 3D survey marks an important step as our first new multi-client seismic project in British Columbia since 2019,’ said David Hajovsky, executive vice-president of multi-client at TGS. ‘Through the application of modern seismic imaging techniques and close collaboration with First Nations to minimise
environmental impact, we continue our commitment in delivering high-quality data that supports informed decision-making in one of Canada’s most active formations.’
The Dawson III 3D seismic survey has been integrated with existing TGS data to offer greater subsurface understanding in the region. The project incorporates 291 wells and 191 LAS logs, further refining the dataset and offering valuable insights for operators in the Montney Formation.
Meanwhile, TGS has won a streamer acquisition contract in the East Mediterranean. Acquisition is scheduled to commence in Q3 this year and the contract has a duration of approx. 30 days.
Germany’s current tender for the 10.1 gigawatt offshore wind farms N-10.2 and N-2,5 have failed to attract any bids.
As a result, the German Offshore Wind Energy Association (BWO) has called on the German government to fundamentally reform the auction design.
Stefan Thimm, managing director of the German Offshore Wind Energy Association, said: ‘The industry has been warning for years against burdening companies with too many risks. The current auction design forces developers to bear risks beyond their control without any protection.’
North Sea sites N-10.1 and N-10.2, with a total area of approx. 182 km2, were scheduled to go into operation in 2030 and 2031. Following a tender process that failed to produce any bids and thus failed to award contracts, the Federal Network
Agency is obligated to conduct a new tender process for the same site.
Thimm said that legislators must ensure better conditions for the new tenders. ‘The federal government must finally pave the way for a reliable Contracts for Differences (CfD) system alongside long-term electricity supply contracts. CfDs lead to a reduction in electricity generation costs of up to 30%. Without this reform, further auctions could fail –and with them the energy transition.’
Fugro has won a contract for the 700 MW Youde offshore wind farm by Shinfox Energy in Taiwan’s Round 3.2 offshore wind tender. It will deliver comprehensive geotechnical services to support the development of the Youde project, located off the west coast of Taiwan.
Fugro’s Taiwan-flagged vessel, Pacific Hornbill , an IOVTEC-managed DP2 vessel, is equipped with an advanced C30 marine geotechnical drilling rig and Fugro’s proprietary specialist WISONMkV EcoDrive downhole in situ testing and
sampling system. It also features specialised seabed geotechnical equipment, including the SEACALF MkV Deep Drive, enabling the acquisition of high-quality geotechnical data in both seabed and downhole mode throughout the project.
The geotechnical fieldwork campaign has started and is expected to be completed in the fourth quarter of 2025. ‘By leveraging our ISO-accredited local laboratory, we will deliver integrated high-quality services’, said Vincent Tsai, chairman of Fugro IOVTEC.
Floating liquefied natural gas (FLNG) capacity is expected to triple by 2030 according to research from Rystad Energy.
Once hindered by technical and operational challenges, FLNG projects are now achieving utilisation rates comparable to onshore terminals. With LNG demand rising alongside the growing viability of smaller gas fields, FLNG is emerging as a faster, more flexible and cost-effective solution capable of adapting to shifting market dynamics while unlocking previously stranded reserves.
Rystad Energy estimates global FLNG capacity will reach 42 million tonnes per annum (Mtpa) by 2030, climbing to 55 Mtpa by 2035, almost four times the 14.1 Mtpa recorded in 2024. Terminals commissioned before 2024 achieved an average utilisation rate of 86.5% in 2024 and 76% to date in 2025, figures comparable to global onshore LNG facilities.
‘FLNG has come a long way in less than a decade. The only real roadblocks were early teething issues that come with any new technology, as seen with projects like Shell’s Prelude, which faced cost overruns and unstable output. Since then, the industry has matured significantly, including Prelude itself. Utilisation rates are improving, the technology is proving reliable across a range of environments, and the economics are starting to make more sense,’ said Kaushal Ramesh, vice-president, gas & LNG research, Rystad Energy.
Early FLNG projects, such as Shell’s Prelude, built in South Korea by the Technip–Samsung consortium, exemplified FLNG’s early limitations. Costs ballooned to $2114 per tonne for liquefaction alone. However, as the industry gained operational and construction experience, capital expenditure per tonne has declined significantly, bringing costs in line with onshore LNG projects.
Proposed developments along the US Gulf Coast now average around $1054 per tonne. Delfin FLNG, a proposed project in the US, sits just above that average at $1134 per tonne, while Coral South FLNG in Mozambique, which is similar in scale, reports a comparable liquefaction cost of $1062 per tonne.
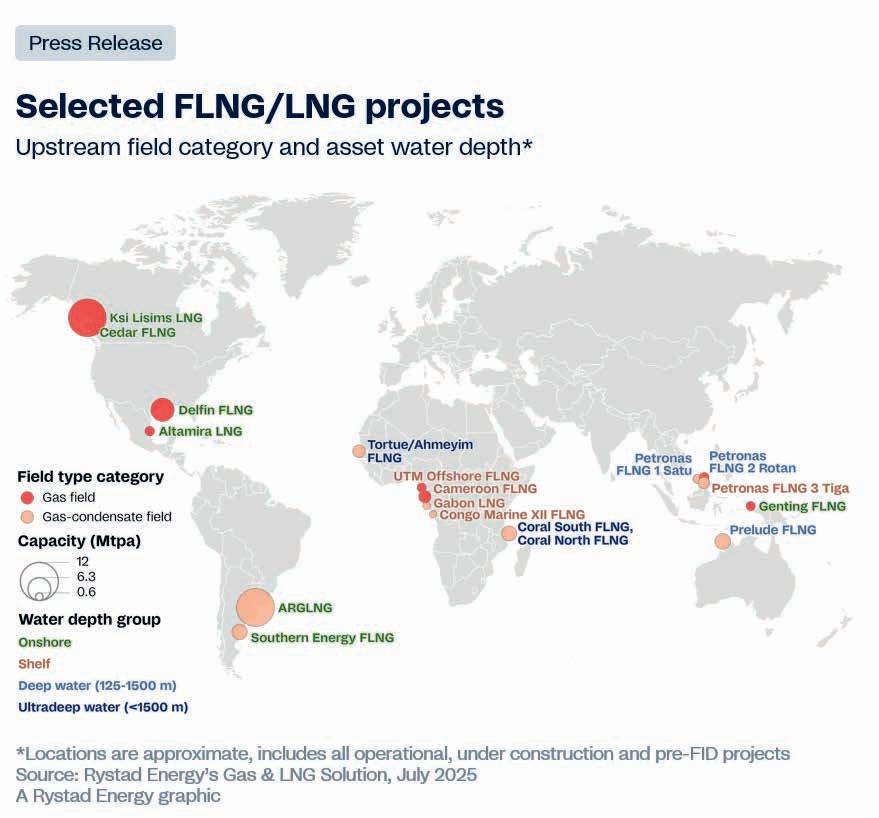
In parallel, FLNG developers are increasingly turning to vessel conversions as a cost-efficient alternative to newbuild facilities. Projects such as Tortue/Ahmeyim FLNG, Cameroon FLNG and Southern Energy’s FLNG MK II have achieved notably lower capex levels of $640, $500 and $630 per tonne, by repurposing Moss-type LNG carriers. With several Moss-type LNG tankers expected to retire in the coming years, more could be repurposed, expanding the pipeline of lower-cost FLNG solutions, said Rystad.
Rystad Energy data also shows that FLNG units can be delivered significantly faster than onshore liquefaction facilities, enabling quicker final investment decisions and more agile execution. On average, newbuild FLNG projects are completed in approximately three years, compared to about 4.5 years (capacity-weighted) for operational onshore plants. For FLNG vessels currently under construction, the average projected build time is even lower at 2.85 years.
Mosman Oil and Gas has contracted Sproule to provide an independent estimate of helium resources at the Sagebrush helium project in Colorado, US. The company’s internal assessments recently estimated 205 million cubic feet (mmcf) of net helium contingent resources, and 1.683 billion cubic feet (bcf) of net hydrocarbon contingent resources (based on an initial gas in place of 18.4 bcf and recoverable gas of 11 bcf).
Sproule will review geological and engineering data, including historic gas sample analyses from the Sagebrush-1 well, which indicated a gas composition of 2.76% helium, 19.5% methane, and other gases.
The company will shoot a 3D seismic survey over the Sagebrush project area this quarter. This seismic program, which is expected to cover approximately 16 square miles, will provide detailed subsurface mapping, enabling Mosman
to better define high-potential drilling targets.
Mosman interim CEO Howard Mclaughlin, said: ‘Engaging Sproule, acquiring the 3D seismic survey, and advancing the extended production test at Sagebrush-1 are pivotal steps in our helium strategy. These initiatives are designed to validate our resource estimates, derisk the project, and provide the data needed to advance towards commercialisation.’
JERA and bp have launched JERA Nex bp, a 50:50-owned joint venture global offshore wind developer, owner and operator. The company’s portfolio of operating assets and development projects has a net potential generating capacity of 13GW. This includes around 1GW of installed net generating capacity, a 7.5GW development pipeline and an additional 4.5GW of secured leases.
The Scottish Government has granted consent for SSE’s 4.1GW Berwick Bank offshore wind farm located 38 km east of the Scottish Borders coastline. If fully delivered, Berwick Bank would become the world’s largest offshore wind farm, capable of generating enough clean energy to power more than six million homes annually.
The UK government has confirmed that 10 projects from the first phase of its flagship green hydrogen programme – Hydrogen Allocation Round (HAR1) – can begin construction after long-term contracts were signed to fuel heavy industry with clean energy in South Wales, Bradford (North West), North Scotland and Teesside (North East).
Offshore wind developers Flotation Energy and Cobra have been granted planning approval for the Celtic Sea offshore wind project White Cross. The White Cross Offshore Windfarm project applied to North Devon Council and the Marine Management Organisation (MMO) in 2023 to construct and operate a 100MW floating offshore windfarm 52 km off the Devon coast, UK.
SLB has won a technologies and services contract for carbon storage site development in the North Sea from the Northern Endurance Partnership (NEP) of bp, Equinor and TotalEnergies. SLB will deploy its Sequestri carbon storage solutions portfolio to construct six carbon storage wells. The project scope includes drilling, measurement, cementing, fluids, completions, wireline and pumping services. NEP will store upto to 1 billion metric tons of CO2. ENERGY TRANSITION BRIEFS
Operators in New Zealand will be able to apply for new petroleum exploration permits this month under the country’s Crown Minerals Amendment Bill. The bill removes the ban on oil and gas exploration beyond onshore Taranaki and signals the coalition government’s intent to reinvigorate investment in Crown-owned minerals.
‘This Government is pragmatic about the vital role natural gas will play in our
energy mix in the decades ahead and we have set a course for greater energy security backed by our own indigenous reserves,’ said resources minister Shane Jones.
‘The ill-fated exploration ban in 2018 has exacerbated shortages in our domestic gas supply by obliterating new investment in the exploration and development needed to meet our future gas needs. Reserves are also falling faster than anticipated
TGS and offshore wind technology developer Entrion Wind have released the results of a joint market study confirming the commercial viability of Entrion Wind’s Fully Restrained Platform (FRP) monopile foundation for offshore wind farms in water depths of 60 to 120 m.
TGS used its 4C Offshore market intelligence database, the world’s largest offshore wind project dataset, covering more than 3400 projects globally, to assess the pipeline of projects planned in deeper waters. The analysis identified more than 44GW of capacity under development through to 2040 where deepwater monopile-based foundations could be feasible. Site characteristics such as water depth, seabed conditions and turbine configurations were evaluated to determine the technical suitability of the FRP monopile.
The study indicates that the FRP monopile design offers a ‘technically and economically competitive solution in transitional depth ranges where conventional monopiles are no longer feasible and jackets or floating foundations have traditionally been required,’ said TGS in a statement. ‘TGS research suggests the FRP’s ability to simplify installation processes and reduce foundation capital costs could support broader project viability in deeper waters.’
Bjørnar Eide, CFO of Entrion Wind, added: ‘Working with TGS allowed us to ground our innovation in real-world data. The breadth of insight from the 4C Offshore database provided clarity on where the FRP monopile can have the greatest impact globally. By analysing the global project pipeline, policy conditions, and cost trends, Entrion Wind sees an opportunity for this technology to fill a critical gap in the foundation market.’
‘As the offshore wind sector moves into deeper waters, solutions like the FRP monopile, supported by detailed market analysis, could streamline project design, reduce costs and expand development opportunities,’ said TGS. ‘The study highlights how collaborative research like this helps to reduce uncertainty around new technologies and supports the continued growth of offshore wind globally.’
After a few years of increasing offshore rig activity, the market began experiencing a dip in demand in 2024, according to research by Westwood. The dip is not the start of a new down cycle, but rather a mid-cycle correction in a longer-term upcycle, the company added.
Demand for jackups, semisubs and drillships combined stands at 520 units as of mid-2025, with the marketed committed utilisation rate at 86%.
In 2023, while demand was still rising, only two units – one semisub and one drillship – were retired from the global offshore rig fleet. Both were converted for use outside the industry. In 2024, the number of retirements rose to seven, all of which were semisubs sold for recycling.
The focus on removing semisub supply is the result of this segment taking the hardest hit in terms of a drop in demand. Semisub demand finished 2024 at about 62 units, a drop from 68 at the end of the previous year, and as of mid-2025, semisub demand has fallen to about 58 units. Only one new rig order was made last year – ARO Drilling jackup Kingdom 3.
As a result of the aforementioned attrition and no new supply, the global supply of jackups, semisubs and drillships finished 2024 at 717 units, down from 724 at the end of 2023. This count includes 26 units deemed under
Globally, the number of working rigs at the end of 2024 was 2% lower than at the end of 2023. However, the number of working rigs managed by the top 10 contractors at the end of 2024 was up 3% over the previous year. Looking ahead to the end
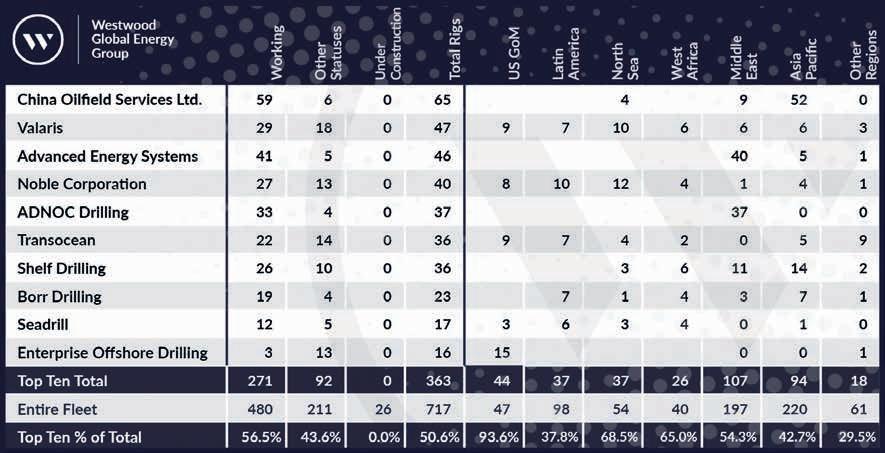
construction. By rig type, there were 512 jackups, 94 semisubs and 111 drillships in the global fleet at the end of 2024. For comparison, at the end of 2023, the count was 512 jackups, 101 semisubs and 111 drillships.

ExxonMobil Corporation has announced second-quarter 2025 earnings of $7.1 billion. Cash flow from operating activities was $11.5 billion and free cash flow was $5.4 billion.
Equinor has reported adjusted operating income $6.53 billion and $1.74 billion after tax in the second quarter of 2025. The company reported a net operating
income of $5.72 billion and a net income of $1.32 billion.
Shell has reported adjusted earnings of $4.3 billion despite lower trading contribution in a weaker margin environment. Cash capex outlook was unchanged at $20-22 billion. The company also achieved $0.8 billion of structural cost reductions in the first half of 2025; cumulative reductions
of 2025, Westwood anticipates a decrease in the global working count and in the total offshore rig supply ahead of demand picking up once again for long-term work starting in the second half of 2026 and beyond.
since 2022 are $3.9 billion, against CMD25 target of $5-7 billion by end of 2028.
ConocoPhillips reported cash provided by operating activities of $3.5 billion and cash from operations of $4.7 billion in the second quarter.
TotalEnergies reported second quarter adjusted net income of $3.6 billion and cashflow of $6.6 million.
bp has reported second quarter underlying replacement cost profit of $2.4 billion, compared with $1.4 billion for the previous quarter. Reported profit for the quarter was $1.6 billion, compared with $0.7 billion for the first quarter 2025.
Geoscience modelling and interpretation techniques are vital for finding the hydrocarbons that the world still needs but also for modelling reservoirs for carbon capture and storage and other renewable energy sites.
Artificial intelligence and machine learning are leading to advances. The latest high-performance computing and algorithmic innovations, aimed at increasing the quality and quantity of modelling and interpretation are presented here –demonstrating how plays can be opened up for explorers.
Michael S. Zhdanov et al present an approach based on the contraction integral equation (CIE) method of numerical electromagnetic modelling and adaptive regularised inversion.
Chris Gravestock et al present the exploration potential of six play fairways in the Middle East, which span the Paleozoic and earliest Mesozoic.
Vita Kalashnikova et al demonstrate the seismic-driven identification of possible sandstone distribution within the Rogaland Group of the Norwegian North Sea.
Julien Razza et al introduce an interactive framework that directly addresses both through an innovative three-step workflow.
Karyna Rodriguez et al present the geoscience evidence that suggests there is huge potential in blocks that are currently in the 2025-26 Nova Scotia licensing round.
Sonny Winardhi et al integrate extrapolated low-frequency data into a sourceindependent FWI workflow, significantly improving the resulting velocity model and enabling reliable inversion without requiring accurate source waveform estimates.
David Little presents datasets matched and merged into a single interpretable volume, called 2Dcubed[VA1], and used to gain a regional overview enabling structural framework and consistent regional interpretation that was calibrated to 86 exploration and appraisal wells.
First Break Special Topics are covered by a mix of original articles dealing with case studies and the latest technology. Contributions to a Special Topic in First Break can be sent directly to the editorial office (firstbreak@eage.org). Submissions will be considered for publication by the editor.
It is also possible to submit a Technical Article to First Break. Technical Articles are subject to a peer review process and should be submitted via EAGE’s ScholarOne website: http://mc.manuscriptcentral.com/fb
You can find the First Break author guidelines online at www.firstbreak.org/guidelines.
January Land Seismic
February Digitalization / Machine Learning
March Reservoir Monitoring
April Underground Storage and Passive Seismic
May Global Exploration
June Navigating Change: Geosciences Shaping a Sustainable Transition
July Reservoir Engineering & Geoscience
August Environment, Minerals and Infrastructure
September Modelling / Interpretation
October Energy Transition
November Marine Acquisition
December Data Management and Processing
More Special Topics may be added during the course of the year.


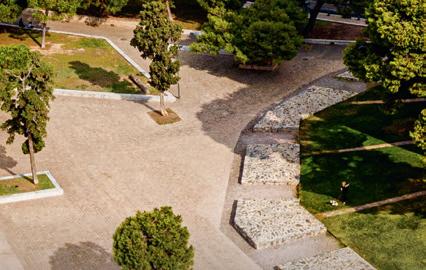


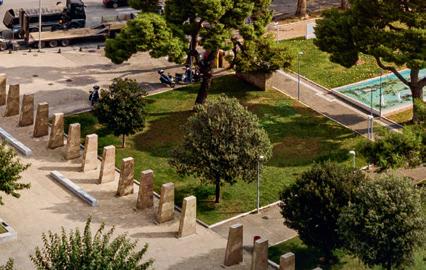


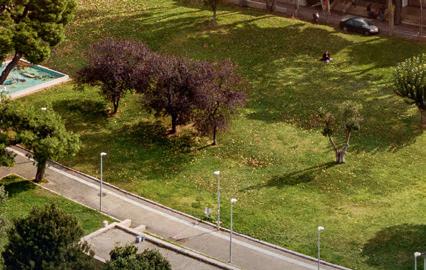


September 2025
9-11 Sep Second EAGE Conference and Exhibition on Guyana-Suriname Basin www.eage.org
14-18 Sep Seventh International Conference on Fault and Top Seals www.eage.org
15-17 Sep Fifth EAGE Workshop on Assessment of Landslide Hazards and Impact on Communities www.eage.org
15-18 Sep AOW Energy 2025 www.aowenergy.com
16-18 Sep The Middle East Oil, Gas and Geosciences Show (MEOS GEO) www.meos-geo.com
17-18 Sep First EAGE Workshop on Energy Transition in Latin America’s Southern Cone www.eage.org
21-24 Sep Sixth EAGE Borehole Geology Workshop www.eage.org
29 Sep1 Oct Second AAPG/ EAGE Mediterranean and North African Conference (MEDiNA) medinace.aapg.org
29 Sep1 Oct Eighth EAGE Borehole Geophysics Workshop www.eage.org
October 2025
6-8 Oct Second EAGE Data Processing Workshop www.eage.org
6-8 Oct Empowering the Energy Shift - The Role of HPC in Sustainable Innovation: Ninth EAGE High Performance Computing Workshop www.eage.org
6-9 Oct GEOTERRACE-2025: International Conference of Young Professionals www.eage.org
14-16 Oct First EAGE Conference on the Future of Mineral Exploration: Challenges and Opportunities www.eage.org
15-16 Oct 3 rd EAGE/SUT Workshop on Integrated Site Characterization for Offshore Renewable Energy www.eage.org
21-22 Oct First EAGE Workshop on Geophysical Techniques for Monitoring CO2 Storage www.eage.org
21-23 Oct First EAGE/ AAPG/ SEG Carbon Capture Utilisation and Storage Workshop (CCUS) www.eage.org
27-31 Oct 6th EAGE Global Energy Transition Conference & Exhibition (GET 2025) - EAGE Carbon Capture and Storage Conference - EAGE Geothermal Energy Conference - EAGE Hydrogen and Energy Storage Conference - EAGE Offshore Wind Energy Conference www.eageget.org
28-30 Oct 2 nd Edition AAPG/EAGE Petroleum Systems of the Middle East GTW www.eage.org
30-31 Oct GEOSCIENCE International Symposium www.geosymposium.org
November 2025
2-5 Nov EAGE/AAPG Workshop on Tectonostratigraphy of the Arabian Plate: Structural Evolution of the Arabian Basins www.eage.org
10-11 Nov EAGE Workshop on Enhancing Subsurface Practices using AI/ML www.eage.org
10-12 Nov Seventh EAGE Rock Physics Workshop www.eage.org
12-14 Nov First EAGE Workshop on Surface Logging www.eage.org
12-14 Nov Third EAGE Workshop on Geothermal Energy in Latin America www.eage.org
12-14 Nov EAGE/Aqua Foundation Third Indian Near Surface Geophysics Conference & Exhibition www.eage.org
Santiago de Chile Chile
Melbourne Australia
Toronto Canada
Al Khobar Saudi Arabia
Rotterdam The Netherlands
Kuwait City Kuwait
Bucharest Romania
Riyadh Saudi Arabia
Perth Australia
Cape Town South Africa
Paris France
Guanacaste Costa Rica
New Delhi India


500+ ATTENDEES


100+ TECHNICAL PRESENTATIONS


80+ STRATEGIC SPEAKERS

20+ EXHIBITORS