SPECIAL TOPIC

SPECIAL TOPIC
EAGE NEWS Geoscientists walk tall in Ukraine
CROSSTALK Where now for towed-streamer surveys?
TECHNICAL ARTICLE DAS-VSP datasets for a CCUS field in Japan


FIRST BREAK ®
An EAGE Publication www.firstbreak.org
ISSN 0263-5046 (print) / ISSN 1365-2397 (online)
CHAIR EDITORIAL BOARD
Clément Kostov (cvkostov@icloud.com)
EDITOR Damian Arnold (arnolddamian@googlemail.com)
MEMBERS, EDITORIAL BOARD
• Philippe Caprioli, SLB (caprioli0@slb.com) Satinder Chopra, SamiGeo (satinder.chopra@samigeo.com) Anthony Day, NORSAR (anthony.day@norsar.no)
• Peter Dromgoole, Retired Geophysicist (peterdromgoole@gmail.com)
• Kara English, University College Dublin (kara.english@ucd.ie)
• Hamidreza Hamdi, University of Calgary (hhamdi@ucalgary.ca)
• Fabio Marco Miotti, Baker Hughes (fabiomarco.miotti@bakerhughes.com)
• Roderick Perez Altamar, OMV (roderick.perezaltamar@omv.com)
• Susanne Rentsch-Smith, Shearwater (srentsch@shearwatergeo.com)
Martin Riviere, Retired Geophysicist (martinriviere@btinternet.com)
• Angelika-Maria Wulff, Consultant (gp.awulff@gmail.com)
EAGE EDITOR EMERITUS Andrew McBarnet (andrew@andrewmcbarnet.com)
PUBLICATIONS MANAGER Hang Pham (publications@eage.org)
MEDIA PRODUCTION
Saskia Nota (firstbreakproduction@eage.org) Ivana Geurts (firstbreakproduction@eage.org)
ADVERTISING INQUIRIES corporaterelations@eage.org
EAGE EUROPE OFFICE
Kosterijland 48
3981 AJ Bunnik
The Netherlands
• +31 88 995 5055 eage@eage.org
• www.eage.org
EAGE MIDDLE EAST OFFICE
EAGE Middle East FZ-LLC Dubai Knowledge Village PO Box 501711 Dubai, United Arab Emirates
• +971 4 369 3897
• middle_east@eage.org
• www.eage.org
EAGE ASIA PACIFIC OFFICE
EAGE Asia Pacific Sdn. Bhd. UOA Centre Office Suite 19-15-3A No. 19, Jalan Pinang 50450 Kuala Lumpur
Malaysia
• +60 3 272 201 40
• asiapacific@eage.org www.eage.org
EAGE LATIN AMERICA OFFICE
EAGE Americas SAS Av Cra 19 #114-65 - Office 205 Bogotá, Colombia
• +57 310 8610709 americas@eage.org
• www.eage.org
EAGE MEMBERS’ CHANGE OF ADDRESS
Update via your MyEAGE account, or contact the EAGE Membership Dept at membership@eage.org
COPYRIGHT & PHOTOCOPYING © 2025 EAGE
All rights reserved. First Break or any part thereof may not be reproduced, stored in a retrieval system, or transcribed in any form or by any means, electronically or mechanically, including photocopying and recording, without the prior written permission of the publisher.
PAPER
The publisher’s policy is to use acid-free permanent paper (TCF), to the draft standard ISO/DIS/9706, made from sustainable forests using chlorine-free pulp (Nordic-Swan standard).

Lithium: A source to sink story
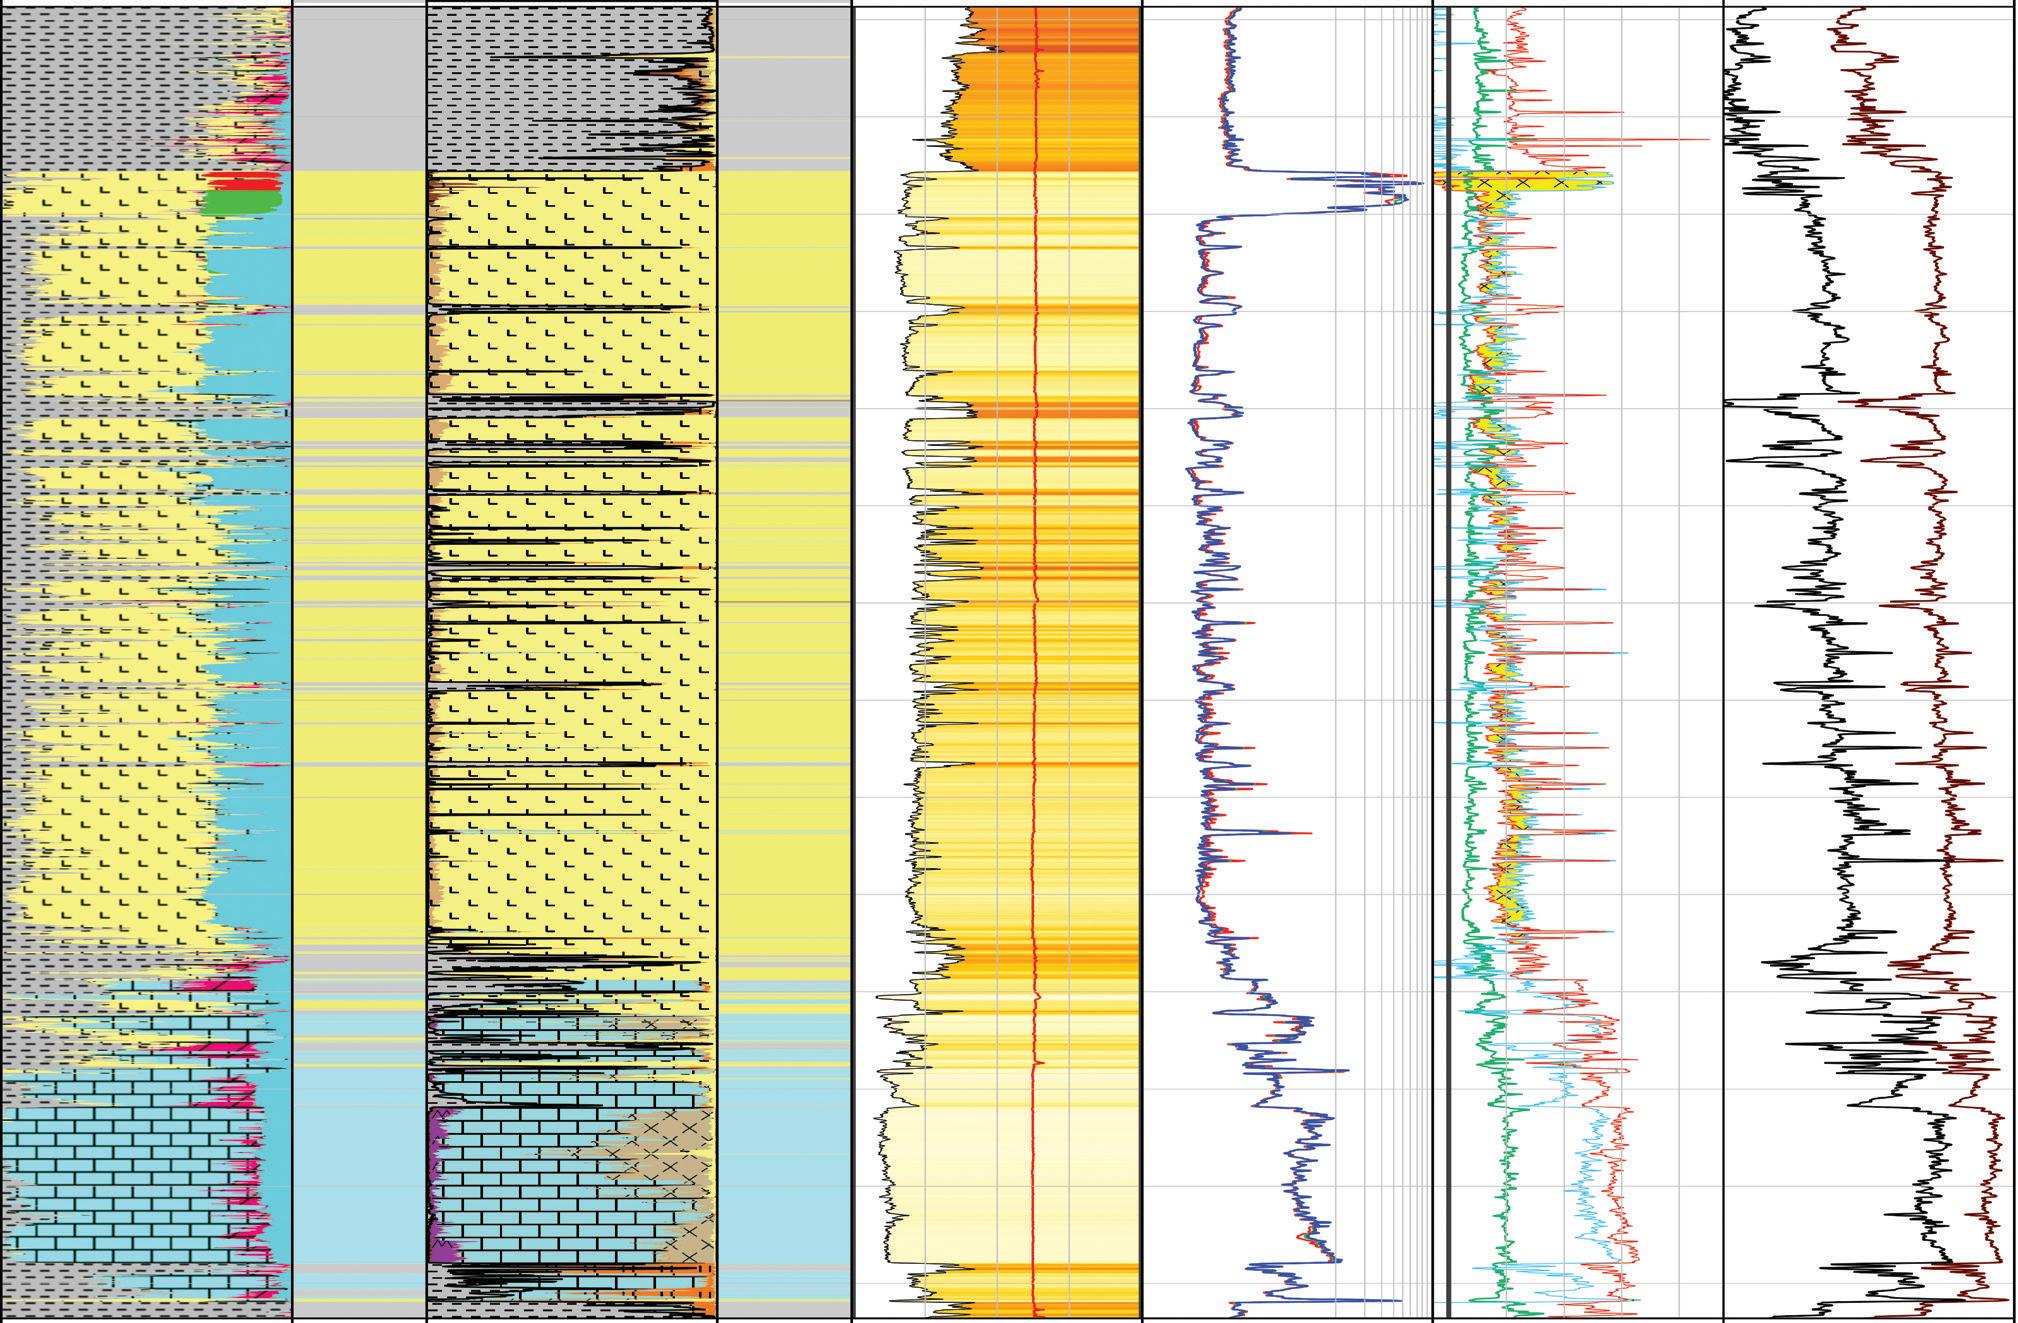
29 Advanced acquisition and processing schemes for multi-well and multi-fibre walkaway DAS-VSP datasets from a CCUS pilot field onshore Japan
Shotaro Nakayama, Kotaro Fujita, Yuji Yamada, Takuji Mouri, Yusuke Watanabe, Philip Armstrong, Olga Podgornova, Yuki Maehara, Manish Lal Khaitan, Pierre Bettinelli, Joel Le Calvez and Masaru Ichikawa
39 Seismic time-lapse CO2 storage monitoring: opportunities and risks with non-optimal data
Anne-Kari Furre, Sondre Torset, Yulia Biryaltseva, Roya Dehghan-Niri, Harald Westerdahl and Per Atle Olsen
49 Optimising subsurface investigations for offshore wind: Lessons from oil and gas and emerging strategies
Barbara Cox, Tim Beal, Jack Finch, Gerhard Diephuis, Jeroen Godtschalk and Nikitas Stefopoulos
57 Unlocking advanced E&P applications for offshore wind using Python R. Head, T.B. Grant, V. Rotar, R. Dam Pedersen and N. Coles
63 Accelerating offshore wind site characterisation with integrated 3D UHR geophysical and hydrographic surveys
Allan McKay, Luca Limonta, Roberto Ruiz, Bertrand Caselitz, Bent Kjølhamar, Christine Roche, Enda O’Doherty and Toby Harrison
71 Lithium: A source to sink story
Dr Graeme Nicoll and Dr Paul Helps
77 Cost-effective geophysical monitoring using fibre-optic cable deployed horizontally at the surface
Mike Branston, James Butt, Ran Bachrach, Mathieu Chapelle, Rob Campbell, Robin Fletcher, Konstantin Galybin, David Halliday, Sarah Harrington and Simone Re
87 To image or not to image? Trigger seismic CCS surveillance
Habib Al Khatib and Elodie Morgan
93 Coaxial deep geothermal heat well technology: A game-changer for 5th Generation district heating and cooling networks Rami Niemi, Harun Bitlis, Erika Salmenvaara and Valtteri Viitala
98 Calendar
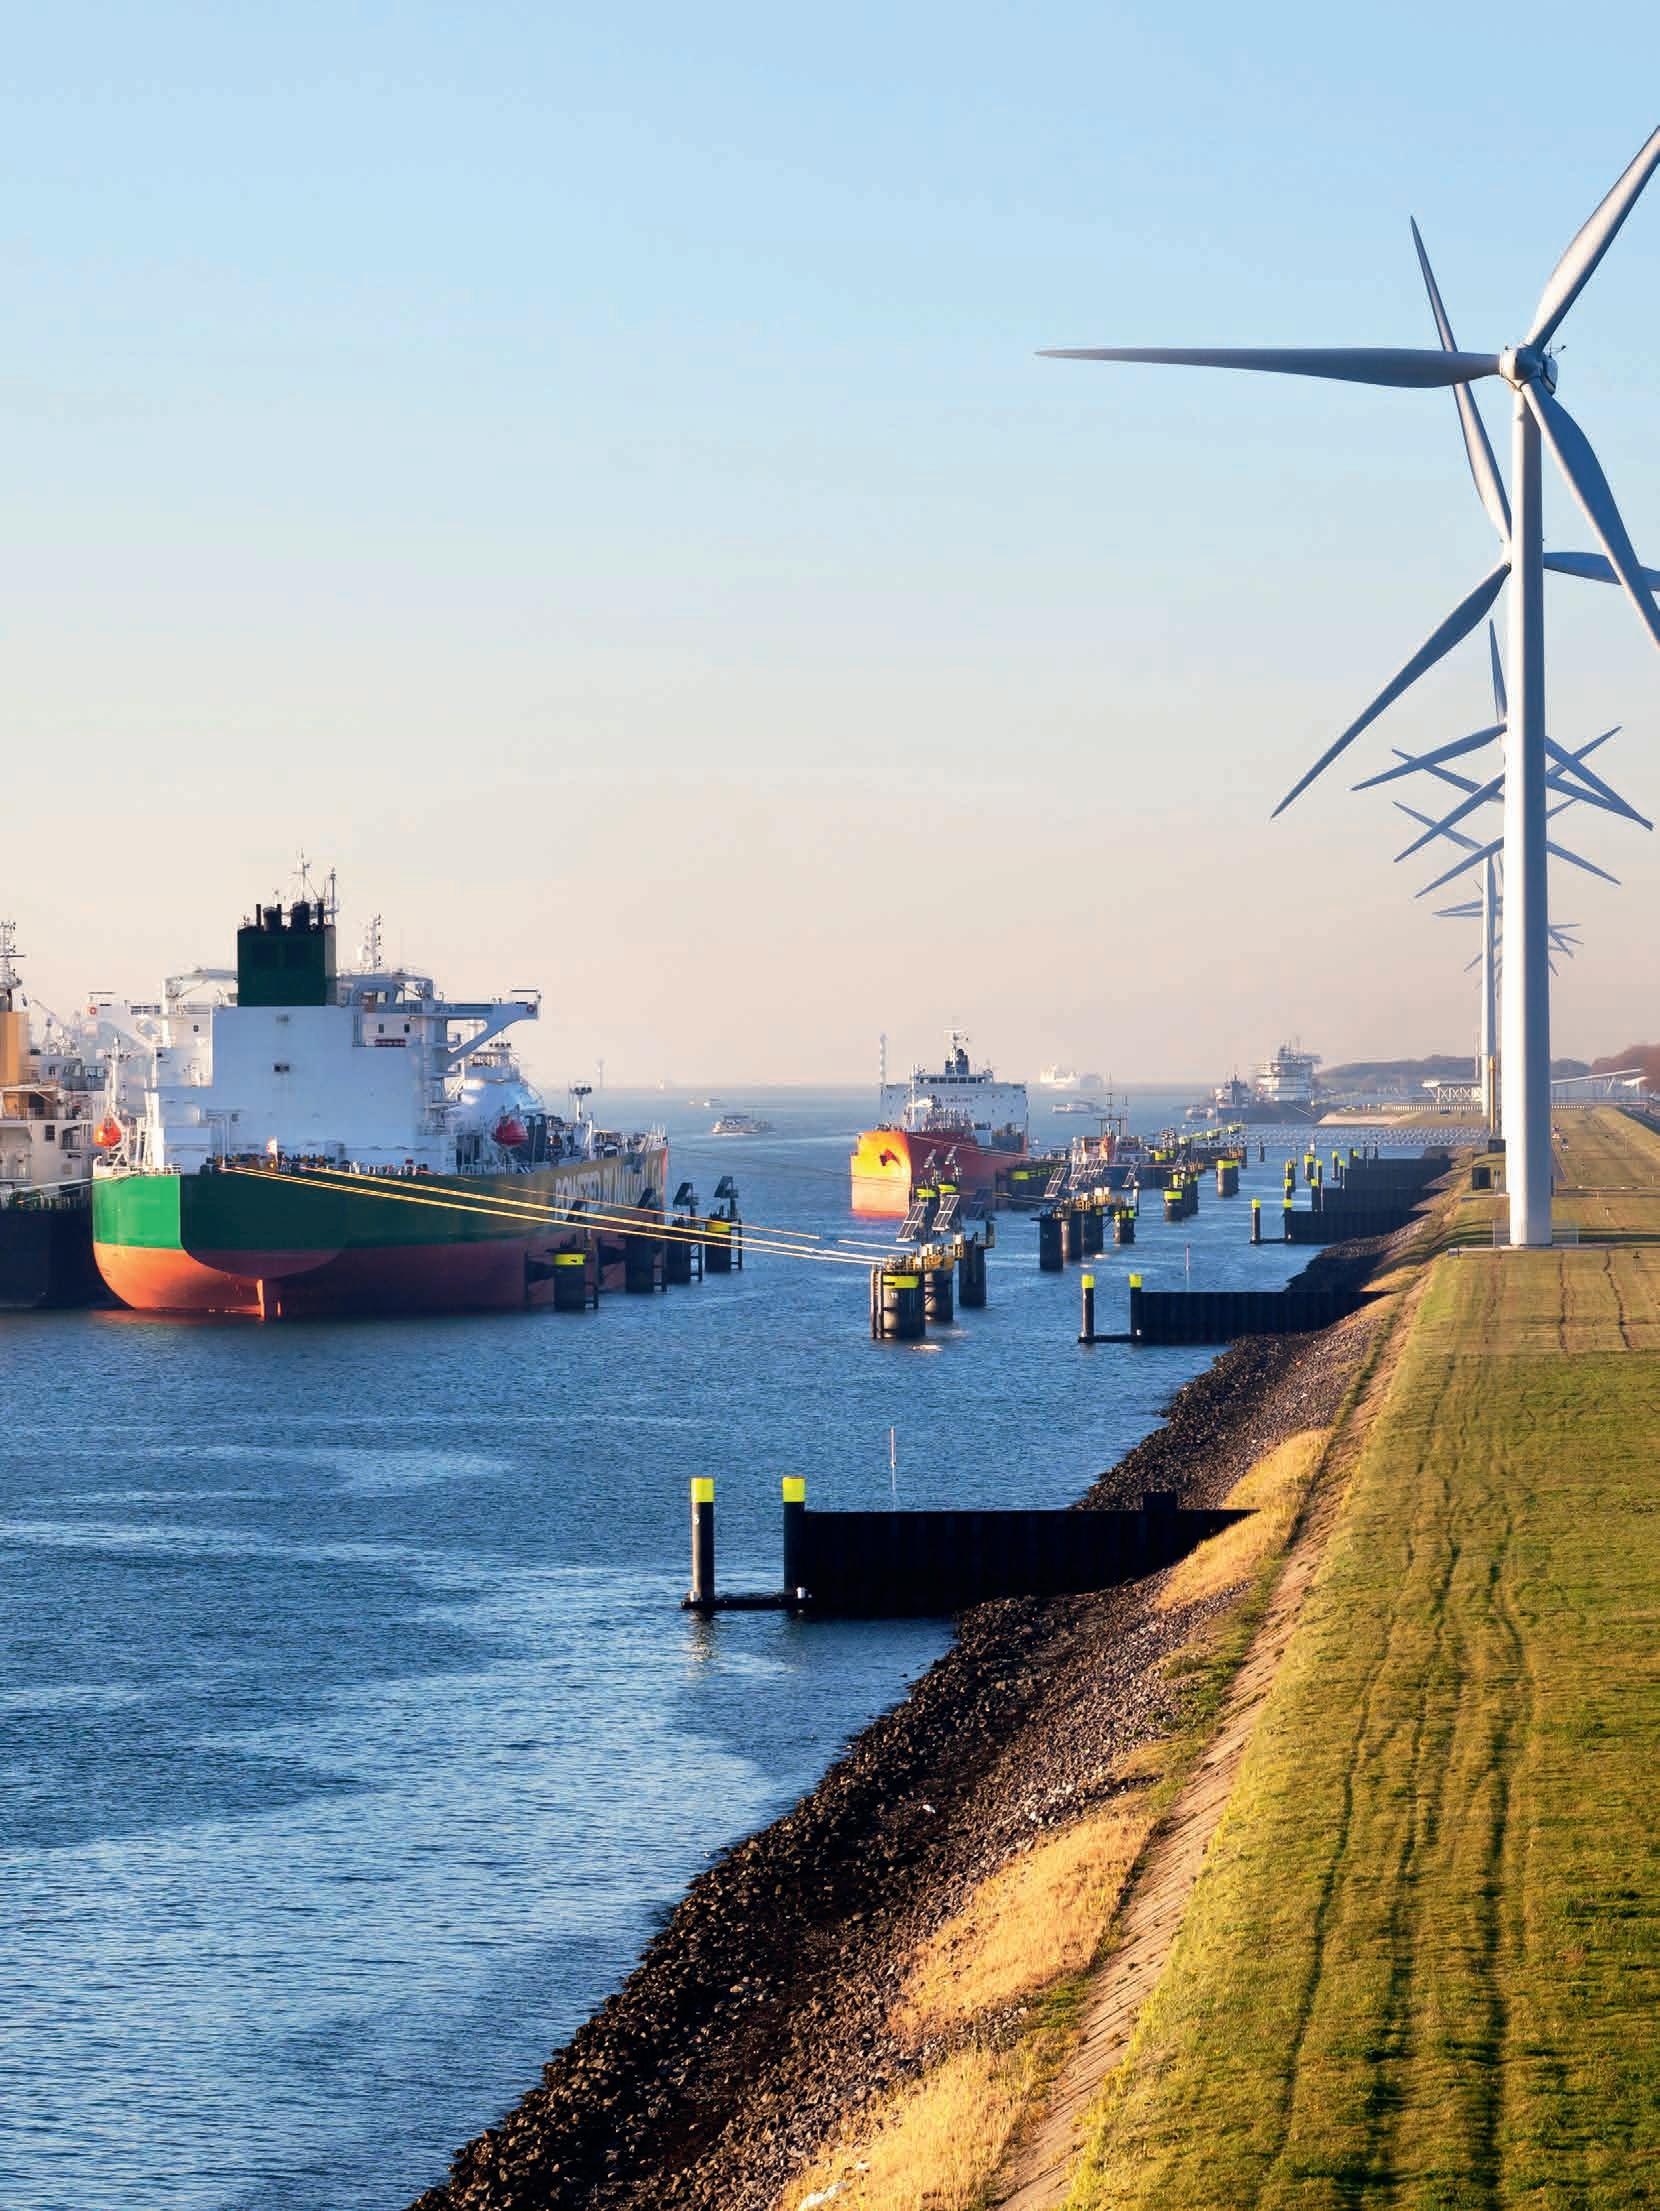
cover: Wind turbines help to power the Port of Rotterdam.


Environment, Minerals & Infrastructure Circle
Andreas Aspmo Pfaffhuber Chair
Florina Tuluca Vice-Chair
Esther Bloem Immediate Past Chair
Micki Allen Liaison EEGS
Martin Brook Liaison Asia Pacific
Ruth Chigbo Liaison Young Professionals Community
Deyan Draganov Technical Programme Representative
Madeline Lee Liaison Women in Geoscience and Engineering Community
Gaud Pouliquen Liaison Industry and Critical Minerals Community
Eduardo Rodrigues Liaison First Break
Mark Vardy Editor-in-Chief Near Surface Geophysics
Oil & Gas Geoscience Circle
Johannes Wendebourg Chair
Timothy Tylor-Jones Vice-Chair
Yohaney Gomez Galarza Immediate Past Chair
Wiebke Athmer Member
Alireza Malehmir Editor-in-Chief Geophysical Prospecting
Adeline Parent Member
Jonathan Redfern Editor-in-Chief Petroleum Geoscience
Robert Tugume Member
Anke Wendt Member
Martin Widmaier Technical Programme Officer
Sustainable Energy Circle
Giovanni Sosio Chair
Benjamin Bellwald Vice-Chair
Carla Martín-Clavé Immediate Past Chair
Emer Caslin Liaison Technical Communities
Sebastian Geiger Editor-in-Chief Geoenergy
Maximilian Haas Publications Assistant
Dan Hemingway Technical Programme Representative
Carrie Holloway Liaison Young Professionals Community
Adeline Parent Liaison Education Committee
Longying Xiao Liaison Women in Geoscience and Engineering Community
Martin Widmaier Technical Programme Officer
SUBSCRIPTIONS
First Break is published monthly. It is free to EAGE members. The membership fee of EAGE is € 85.00 a year including First Break, EarthDoc (EAGE’s geoscience database), Learning Geoscience (EAGE’s Education website) and online access to a scientific journal.
Companies can subscribe to First Break via an institutional subscription. Every subscription includes a monthly hard copy and online access to the full First Break archive for the requested number of online users.
Orders for current subscriptions and back issues should be sent to First Break B.V., Journal Subscriptions, Kosterijland 48, 3981 AJ Bunnik, The Netherlands. Tel: +31 (0)88 9955055, E-mail: subscriptions@eage.org, www.firstbreak.org.
First Break is published by First Break B.V., The Netherlands. However, responsibility for the opinions given and the statements made rests with the authors.
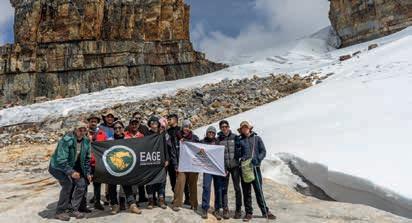
An unreported and increasingly costly consequence of the war in Ukraine is the challenge facing its geoscience community. EAGE’s CIO, Peter Verweij, reports on a recent visit to our Kyiv service point.
Remarkably Dmytro Bozhezha continues to manage EAGE services for Ukrainian geoscientists from his office in Kyiv. Despite the massive disruption of Russia’s continuing military assault, he tries to organise three local scientific events per year. At the same time he works to preserve a vital link to the outside world for the local geoscience community which has been effectively cut off from normal communications with international scientific colleagues.
As an example of the gravity of the situation, Sergii Vyzhva, director of the Institute of Geology at Taras Shevchenko National University, reports that student numbers have dropped by 70% compared to pre-invasion levels. This decline will have long-term consequences for Ukraine. In addition, male scientists (especially those of military service age) are unable to leave the country to attend EAGE events, despite our hardship programme to enable travel by Ukrainian members. Unfortunately some Ukrainian geoscience specialists work dangerously close to the frontlines, resulting in casualties among their ranks.
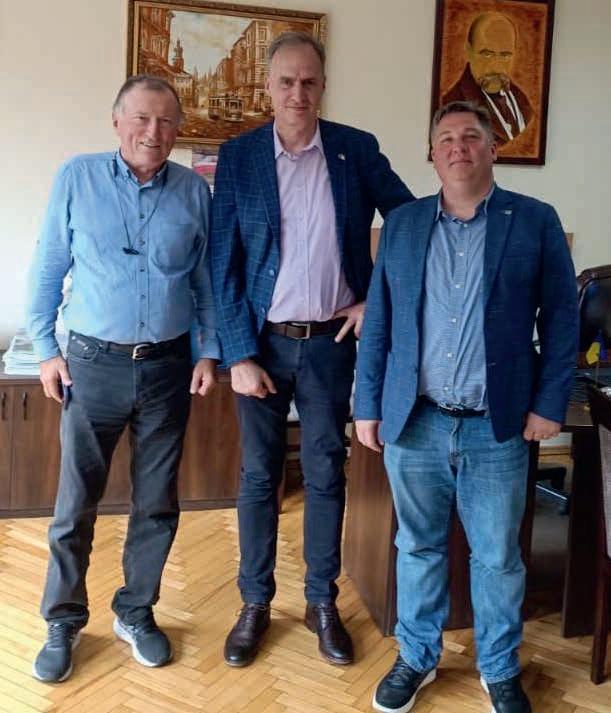
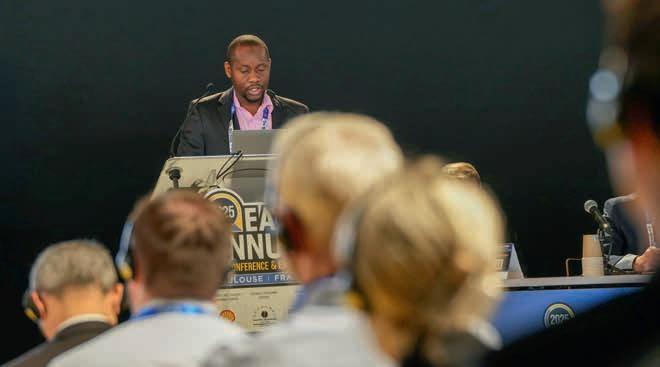
During my visit, Dmytro took me to the headquarters of three companies in Kyiv: UkrGasVydobuvannya (UGV), UkrNafta, and DTEK. These companies are actively working to strengthen their connections with European counterparts, something EAGE works to facilitate. In fact, UGV’s manager, Maxim Vytik, delivered a compelling presentation this year at the Annual Conference in Toulouse about exploration under the chal-
lenging conditions imposed by wartime, while UkrNafta has participated twice at EAGE’s Annual Conference with a large exhibition stand. We are also exploring possibilities for closer cooperation with DTEK.
These major Ukranian corporations can offer significant benefits to the wider geoscience community, providing opportunities for co-operation with European companies and independent professionals. Their focus is access to emerging fields such as artificial intelligence and the energy transition in order to develop their own innovative solutions. UkrNafta in Poland and DTEK in the Netherlands have already established regional offices reflecting a clear strategic vision.
Although my visit was short, you could not fail to be impressed by the inhabitants of Kyiv. They refuse to be intimidated by their grim circumstances in which their safety and independence are under threat every day. For EAGE’s part, we are committed to supporting the local geoscience community for as long as necessary.
With less than nine months to go before next June’s 87th EAGE Annual Conference & Exhibition in Aberdeen it is already time to consider making a contribution to the Technical Programme. The Call for Abstracts is now open, providing you with the unrivalled opportunity to showcase your research to a global audience of geoscientists and engineers.
For guidance of intending presenters, our comprehensive Technical Programme in 2026 is being organised around seven broad themes, each reflecting the latest challenges and opportunities facing our profession.
Geophysics remains at the core of subsurface characterisation, from seismic acquisition and imaging to non-seismic methods such as electromagnetic and potential fields. We welcome abstracts that demonstrate advances in theory, acquisition, processing, quantitative interpretation, rock physics, and practical applications that push imaging quality and broaden geophysical insight for exploration, production, and new energy projects.
Understanding the subsurface requires a strong geological foundation. Contributions are invited on sedimentology, stratigraphy, structural geology, basin analysis, and petroleum systems. Case studies linking outcrop and subsurface analogues are especially encouraged, along with work that highlights how geology underpins exploration, field development, and energy transition projects.
Geoscience and engineering expertise are vital for CCUS, geothermal, hydrogen storage, and offshore wind development. Abstracts should highlight practical advances, case studies, and research that accelerate the deployment of these low-carbon technologies and demonstrate their contribution to a sustainable energy future.
This theme focuses on the wider role of geoscience in supporting society. Topics include environmental monitoring, natural hazards, subsurface use, and the sustainable supply of critical raw materials. Submissions are also welcome on geotechnical and infrastructure-related studies, illustrating how geoscience contributes to safe, sustainable development beyond traditional energy applications.
Digitalisation and advanced computing are transforming the way we work, while robust data standards and effective information management are essential to maximise their impact. We invite contributions on artificial intelligence, machine learning, high-performance computing, data integration, and modelling techniques, as well as best practices and case studies in data management. Submissions should demonstrate how digital technologies and sound information management improve interpretation, efficiency, collaboration, and decision-making across geoscience and engineering workflows.
The integrated subsurface theme focuses on connecting disciplines to better understand and manage the full subsurface system. We
Submit your abstracts by 15 January 2026!
By contributing to the Technical Programme, you’ll be part of shaping discussions on the most pressing challenges and innovations in our field at a world class event packed with technical sessions, strategic programme, workshops, networking, and an international exhibition. Don’t pass up the opportunity.
invite abstracts covering exploration case studies, field development and production strategies, unconventional resources, and multidisciplinary approaches that bring together geology, geophysics, engineering, and data science. Contributions on geomechanics and pore pressure are also encouraged, particularly where they demonstrate practical applications for safe and efficient subsurface development. Submissions should highlight how integrated workflows deliver deeper insight, reduce uncertainty, and add value across the life cycle of energy projects.
The reservoir engineering theme highlights advances in understanding, modelling, and managing reservoirs throughout their lifecycle. Abstracts are invited on dynamic reservoir characterisation and modelling, flow simulation for both oil and gas and carbon capture and storage, and the integration of history matching with 4D seismic. We also welcome contributions on production optimisation, enhanced oil recovery, and well construction, performance, and workovers. Submissions on the use of machine learning and artificial intelligence for production optimisation and forecasting are particularly encouraged. Presentations should emphasise how reservoir engineering innovations support efficient resource development and contribute to energy transition solutions.
DUG Insight 6.1 now available!
Rapidly unlock subsurface knowledge with DUG Insight’s new AI-powered lithology prediction It delivers consistent geological interpretations efficiently and reliably, directly from raw well logs. It’s just one of many intelligent features that make DUG Insight a powerhouse for seismic interpretation and visualisation. Visit dug.com/dug-insight to discover more.
info@dug.com
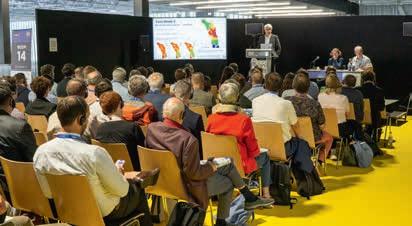
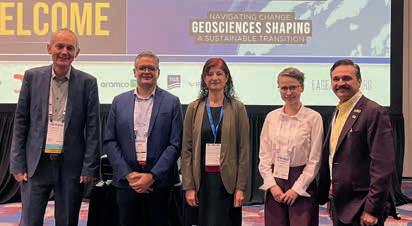
Later this October Rotterdam will once again host the global geoscience and engineering community for the 6th EAGE Global Energy Transition Conference and Exhibition (GET 2025). On 27-31 October, the Convention Centre WTC will welcome experts, innovators, and decision makers from across the carbon capture, geothermal, hydrogen, energy storage, and offshore wind sectors working across the energy transition.
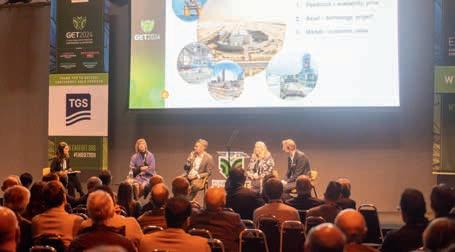


The conference will begin with a keynote address from Diederik Samsom, Dutch environmentalist and retired politician, setting the tone for a week of discussion on the future of energy. The opening session will also feature debate on policy and geopolitics, recognition of emerging talent, and presentations that highlight innovation and leadership in the Energy Transition.
The Technical Programme will be at the heart of GET 2025 offering hundreds of presentations and discussions across multiple disciplines. From advances in carbon capture and hydrogen storage to the evolving role of geothermal and offshore wind, the sessions are designed to connect research, operations and policy in a meaningful way. This year also introduces cross-conference sessions, reflecting the growing inter-dependence of technologies in achieving climate goals.
Alongside the technical tracks, the Strategic Programme will bring together senior leaders from industry, government and academia to explore the wider forces shaping the energy transition. With panels covering economics, regulation, technology, and talent, these discussions provide the broader context in which innovation takes place.
Workshops, short courses and field trips will give participants the chance to deepen their knowledge and gain hands-on expe-

rience. Covering both technical practices and social dimensions, these sessions complement the main programme and ensure a well-rounded learning experience.
The Exhibition serves as a meeting point for companies, universities and innovators showcasing the latest technologies and solutions. With established industry players and a dedicated start-up zone, it offers opportunities to explore new ideas and forge valuable connections.
The Student Programme remains a cornerstone of GET offering a tailored programme designed to inspire the next generation of energy professionals. Through lectures, teamwork and practical exercises, students will engage directly with the challenges and opportunities of the transition.
From the Icebreaker Reception on the opening night to the Conference Evening later in the week, the social programme ensures plenty of opportunities to connect with colleagues and peers. These events are designed to strengthen the community and create lasting networks.
For anyone engaged in the Energy Transition, this is the place to share ideas, discover solutions and help shape the future.
Get your pass and join us!
Every month we highlight some of the key upcoming conferences, workshops, etc. in the EAGE’s calendar of events. We cover separately our four flagship events – the EAGE Annual, Digitalization, Near Surface Geoscience (NSG), and Global Energy Transition (GET).

EAGE/AAPG Workshop on Tectonostratigraphy of the Arabian Plate: Structural Evolution of the Arabian Basins
2-5 November 2025 – Riyadh, Saudi Arabia
This is an exceptional opportunity to explore the scientific and practical aspects of the Arabian Plate’s geolo gy.The workshop will begin with a two-day field trip providing participants with first-hand exposure to key outcrops that reveal the tectonic and stratigraphic framework of the region. Two days of technical oral and poster presentations follow covering a wide range of topics, including tectonostratigraphy of the Arabian Plate, structural evolution of the Arabian basins, key petroleum systems and plays, as well as applied case studies that highlight exploration and development opportunities.
Registration is open

First EAGE Workshop on Surface Logging
12-14 November 2025 – Paris, France


EAGE/FESM Conference on Petrophysics
Meets Geoscience: Unlocking Reservoir Potential in a Dynamic Energy Landscape 18-20 November 2025 – Kuala Lumpur, Malaysia
The event’s objective is to align petrophysics, geology, and geophysics in developing multi-scale workflows, from nano-pore rock-fluid interactions to basinscale reservoir strategies. Technical discussions will address emerging innovations such as AI-driven analysis, advanced logging-while-drilling (LWD), high-resolution data acquisition, quantitative interpretation (QI), and 4D time-lapse methodologies. The conference will also focus on carbon capture and storage (CCS), net-zero pathways and cross-disciplinary solutions to complex reservoir challenges. By connecting global expertise with regional perspectives, the event seeks to drive innovation, create value, and support sustainable energy development.
Early fee until 17 October
The workshop will highlight the growing importance of surface logging in the energy industry, driven by digitalisation, innovation, and sustainability goals. Designed for geoscientists, engineers, mud loggers, and professionals involved in well planning and execution, it offers both theoretical insight and practical knowledge. The programme expects to explore how surface logging enhances subsurface understanding, improves well placement, and reduces operational risks by integrating geological, petrophysical and drilling data. It will discuss tools to improve safety, efficiency and performance, supporting broader adoption across disciplines and advancing energy transition efforts.
Regular fee until 20 October

Second EAGE/SBGf Conference on Deepwater Brazil Equatorial Margin 26-28 May 2026 – Rio de Janeiro, Brazil
The Equatorial Margin is entering a new chapter. Recent ultra-deepwater discoveries have reignited global interest in this frontier, confirming its potential and sparking critical technical and strategic dialogue.
Building on the momentum of the inaugural event, this second edition returning in May 2026 promises deeper insights, more dynamic discussions and stronger collaboration across disciplines.
More details coming soon
Daniel Leonardo Linares Acero, president, provides an insight into the achievements and aspirations of the UNAL Bogotá Student Chapter, the winner of this year’s Best Student Chapter.

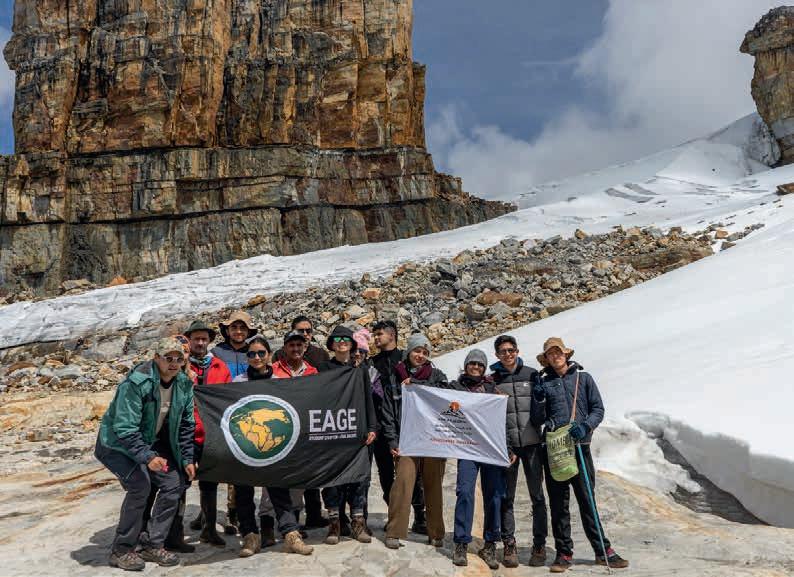
At the heart of the Universidad Nacional de Colombia, Bogotá campus, a group of students has transformed their passion for geosciences into a collaborative initiative that integrates research, academic training, and scientific outreach. This is the story of the EAGE UNAL Bogotá Student Chapter, a community that demonstrates how knowledge gains greater significance when it is shared and applied to the realities of the Colombian environment.
Student Chapters EAGE operate globally as meeting platforms for students interested in Earth sciences. At UNAL, our Chapter not only organises academic activities, workshops, and courses, but also promotes applied research projects contextualized in Colombia. Since its foundation, it has participated in high-level international events such as the Annual
2023 and 2024 in Vienna and Oslo respectively, in addition to leading local initiatives like the Energy Transition Week and our customary UNAL Bogotá Geoquiz.
The continuous work of our members has earned international recognition on two occasions: the chapter was first awarded Best Student Chapter in 2022 and reaffirmed this title in the 2024-2025 period. This double recognition reflects not only academic excellence, but also perseverance and commitment to innovation in the geosciences. Hopefully it consolidates our chapter as a benchmark in EAGE’s global network and reinforces its mission of projecting geoscientific knowledge from Colombia to the global community.
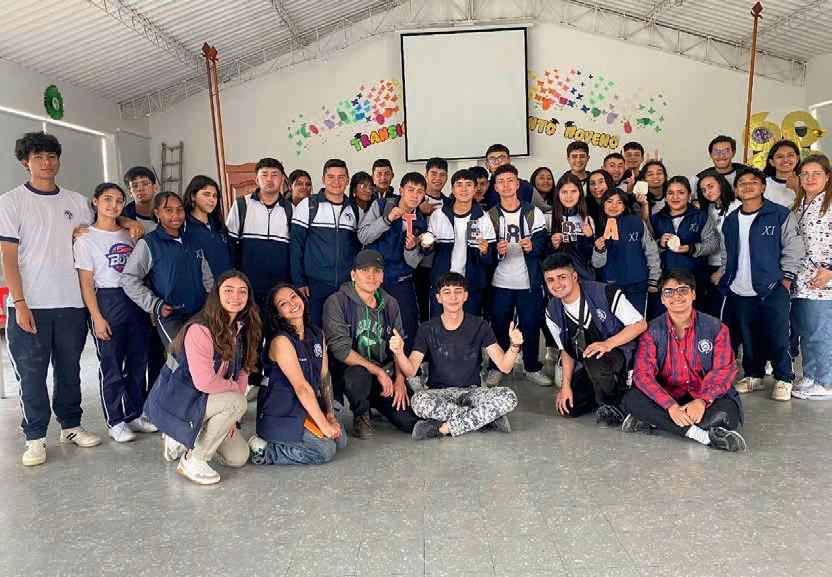
The Chapter’s structure is made up of five research groups, each focused on a strategic area. Geophysics and Seismology develops projects to understand Earth’s internal processes and seismic behaviour in a country with complex geodynamics, contributing to risk management. Climatology and Glaciology investigates atmospheric dynamics and glacier retreat, generating relevant evidence on climate variability and its impacts on the Andean region. Petrography and Petrology focuses on the genesis, composition, and evolution of rocks, with research conducted in areas such as Nevado del Ruiz, Tolima, and Caldas which provide insights into regional-scale geological processes. Volcanology and Geothermal Energy dedicates its efforts to monitoring volcanic activity and exploring geothermal energy as a sustainable alternative. Finally, the Energy Transition group has become a space for reflection and action on the country’s energy future, promoting initiatives such as TERRA (Energy Transition, Regional Resources, and Geological Analysis) in several communities in Boyacá, where students collaborate with local populations in the search for sustainable solutions.
This year has been envisioned as a period of expansion. The Chapter aims to extend its projects to at least ten Colombian departments, consolidating a national strategy that integrates research and outreach under the principle of social appropriation of natural resources as the bridge between science, academia and society. The project is complemented by talks, courses, open panels, and a mentorship programme involving early-semester students ensuring continuous training and generational renewal within the academic community.
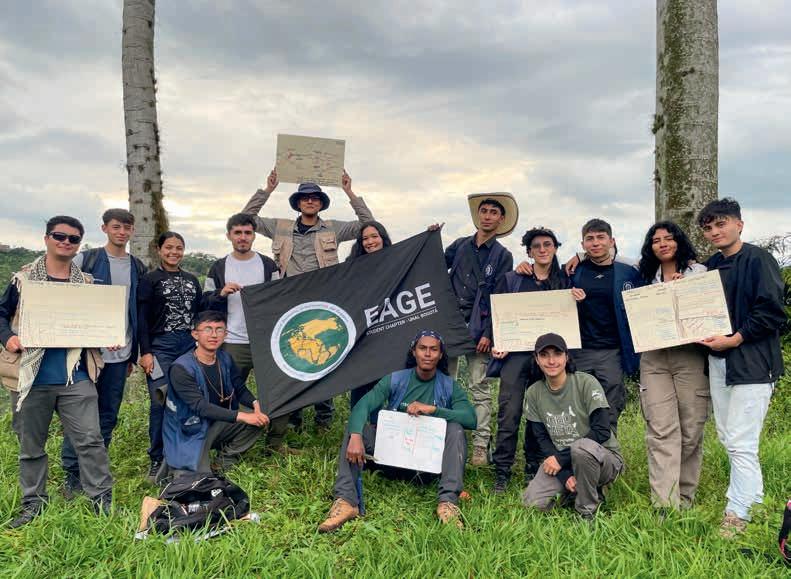
Fieldwork is one of the central pillars of the group’s identity. Expeditions to the glaciers of El Cocuy, surveys of active volcanoes such as Nevado del Ruiz, and projects in regions such as Boyacá and Santander have not only enriched students’ training but also fostered meaningful connections with local communities. These experiences reaffirm that geoscientific research achieves its full meaning when it inspires, educates
and engages in dialogue with those who inhabit and coexist with the natural phenomena under study.
We have also sought to be represented in high-visibility academic arenas. Participation in the XX Colombian Geological Congress, the organisation of the Energy Transition Week and attendance at international conferences in Europe demonstrate our mission to bring the student voice to spaces of cooperation and scientific dissemination. All our activities materialise into tangible products – presentations, articles and posters that strengthen the group’s visibility and broaden its collaborative networks with both national and international institutions.
With more than 50 activities carried out in recent years, a growing portfolio of alliances, and committed student leadership, we hope the UNAL Bogotá Student Chapter stands as an example of how new generations of geoscientists can play a leading role in building a sustainable future. From the public university, and through rigorous work in the field, laboratory, and community, this collective demonstrates that science must transcend books and lecture halls to reach mountains, moorland and rural classrooms to build lasting bridges between specialised knowledge and society.
31 OCT
WANG
• GEOTHERMAL ENERGY SYSTEMS AND THEIR ROLE IN ENERGY TRANSITION, BY ANDREA MOSCARIELLO
• RISK ASSESSMENT OF CO2 STORAGE INTEGRITY BY UNDERSTANDING COUPLED THERMO-HYDRO-CHEMICAL-MECHANICAL PROCESSES, BY ANDREAS BUSCH
• BOREHOLE SEISMIC MONITORING FOR SUSTAINABLE ENERGY SOLUTIONS, BY SEBASTIEN SOULAS
• UNDERGROUND HYDROGEN STORAGE IN ROCKS: PORE-TO-CORE SCALE FLOW PROCESSES, X-RAY IMAGING AND MODELLING, BY KAMALJIT SINGH
• SEISMIC DATA PROCESSING FOR OFFSHORE WIND FARM DEVELOPMENT, BY SHAJI MATHEW
17-18 NOV GEOTHERMAL ENERGY SYSTEMS AND THEIR ROLE IN ENERGY TRANSITION,
IN BOREHOLE GEOPHYSICS FOR GEOTHERMAL EXPLORATION AND DEVELOPMENT, BY SEBASTIEN SOULAS
ROTTERDAM, THE NETHERLANDS DURING GET 2025
THE NETHERLANDS

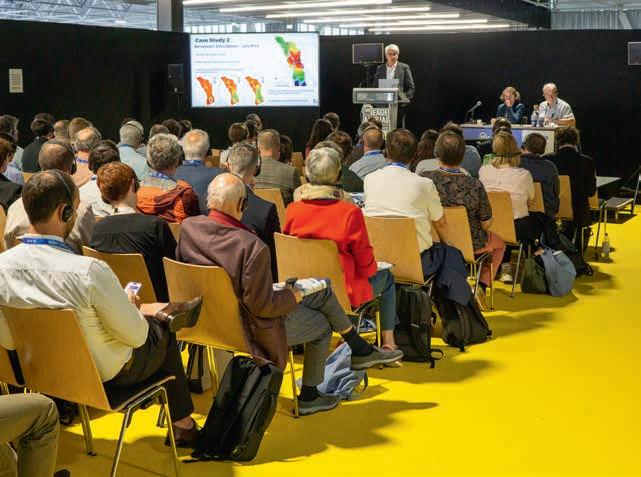
CCS Committee members Audrey Ougier-Simonin (BGS), Francesca Oggioni (Viridien) and Matthias Imhof (ExxonMobil) report on the Dedicated Session Opportunities and challenges for onshore CCS held last June at the Annual in Toulouse.
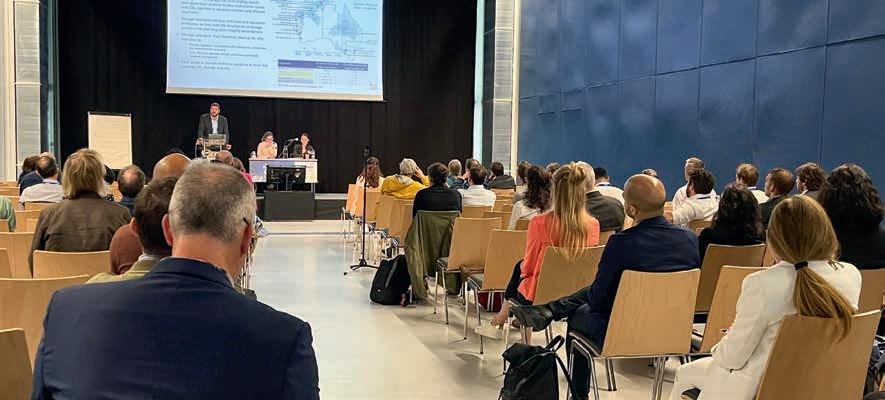
The session featured case studies from Europe, Australia and North America and highlighted innovations in reservoir simulation, monitoring technologies, site characterisation, and regulatory frameworks. Recurring themes within the session included the importance of digital collaboration, robust monitoring and regional adaptation to scale CCS solutions globally.
Carbon capture and storage is a cornerstone technology in the global effort to mitigate climate change. As nations strive to meet decarbonisation targets, the development of reliable, scalable and publicly accepted CCS infrastructure has become increasingly urgent. Offshore storage has the advantage of being out of sight, but at increased cost and complexity. Onshore projects can be more bespoke and cost efficient but are also more visible. This session brought together diverse projects and perspectives, offering a comprehensive view of the current state and future direction of onshore CCS deployment.
N. Andrianov introduced a web-based platform that facilitates collaborative reservoir modelling and simulation. The system allows stakeholders – including operators, regulators and service providers – to co-develop and refine models, run dynamic simulations and visualise results in real time. Built entirely on open-source tools, their platform has the potential of enhancing transparency and iterative validation in storage planning.
C.W. Cavalieri Rodriguez and colleagues compared six offshore and onshore CCS projects, analysing their respective technical, economic and environmental trade-offs. The study emphasised the evolution of monitoring technologies including AI-driven analytics and satellite imaging. They also highlighted the greater ease of onshore long-term monitoring to ensure storage integrity.
M. Watson presented findings from the Otway Test Centre, a globally recognised hub for onshore CCS research. The Otway Stage 3 programme demonstrated cost-effective monitoring techniques such as pressure tomography and downhole seismic imaging. They highlighted the importance of building public trust through the integration and active involvement of local communities. The ongoing Stage 4 programme focuses on optimising reservoir management and reducing storage costs.
S. Thibeau detailed TotalEnergies’ Lacq pilot project, which between 2010 and 2013 captured 51,000 tonnes of CO2 using oxycombustion technology and stored them in a depleted gas reservoir. The project included a three-year post-injection monitoring phase and provided valuable lessons in site characterisation, modelling and public engagement (showing samples was deemed a key communication tool).
A. Bordenave and collaborators described the on-going PilotSTRATEGY project, a multi-disciplinary initiative assessing the feasibility of CO2 storage in the Dogger carbonate reservoir of the Paris Basin. The project integrates geoscience, engineering, and social science to inform regulatory and technical documentation for future pilot sites.
C. Holloway and team presented Slovakia’s first CCS initiative, which repurposes the depleted Golianovo gas field for CO2 storage. The project has completed its initial geological evaluation and licensing phase, marking a significant step for CCS development in Eastern Europe.
Lastly, B. Kolkman-Quinn and colleagues conducted a gap analysis for large-scale CCS in Alberta. The study identified seven key barriers, including regulatory uncertainty, monitoring technology gaps, baseline groundwater, and public acceptance issues. The findings offer a framework for addressing similar challenges in other jurisdictions.
Across these diverse projects and presentations, several unifying themes emerged: Digitalisation and collaboration: The adoption of web-based platforms and AI-enhanced monitoring tools is transforming how CCS stakeholders can collaborate and make decisions. These technologies have the potential to enable real-time data sharing, model validation and scenario testing.
Onshore vs. offshore dynamics: While offshore storage offers scalability, often bespoke onshore projects demonstrate cost-effectiveness and both greater opportunity and need for community engagement. Both environments require tailored approaches to monitoring and risk management.
Monitoring, measuring and verification (MMV): Robust MMV systems are
essential for regulatory compliance and public trust. Innovations such as pressure tomography, satellite imaging and real-time sensors are enhancing the precision and reliability of CO2 plume tracking. Some technologies do require surface access. Repurposing and site characterisa tion: The reuse of depleted hydrocarbon reservoirs (e.g., Lacq, Golianovo) pre sents a practical pathway for rapid CCS deployment. However, comprehensive site characterisation including geological and socio-economic assessments is critical for project success.
Regional strategies and policy read iness: Projects reflect regional priorities and regulatory landscapes. From pilot development in France and Slovakia to scalability in Canada and innovation in Australia, the session highlighted the need for context-specific strategies and strong policy support.
Conclusion


An ever-expanding set of courses, publications and communities enriches your member benefits for 2026, next to an exciting agenda of events and opportunities to connect.
This session showcased the global momentum behind CCS and the diverse strategies being employed to overcome technical, regulatory and societal challenges. As CCS continues to evolve, the integration of digital tools, stakeholder collaboration and adaptive policy frameworks will be key to unlocking its full potential.
Furthermore, the high session attendance and strong audience participation demonstrated the need and desire for collaboration and community. Find out more by checking out the session’s proceedings in EarthDoc.
CCS!
As we enter the final quarter of the year, it’s time to think about renewing your EAGE membership for 2026.
Early renewal ensures uninterrupted access to the benefits that keep you connected to the geoscience and energy community with services including access to worldwide events, publications, education and skills, plus unrivalled networking opportunities. Whatever stage in your career, membership provides professional support.
We understand that circumstances can change. For members who are facing difficult circumstance, for example between jobs, the EAGE Hardship Economic Programme provides the option to apply for a full membership waiver. Other forms of support are also available, ensuring that all members can

remain connected to our professional community.
Finally, as you renew, we invite you to consider contributing to securing the future of geoscience and its professionals by donating to the EAGE Student Fund and/or Green Fund, which support activities for the next generation of scientists, with student grants and chapters support. Since 2022, we have also been raising funds to support the continuous professional development of students and the academic community in Ukraine. Donations to the EAGE Ukraine Professional Development Fund can be made through the EAGE Student Fund.
Stay ahead and renew now!

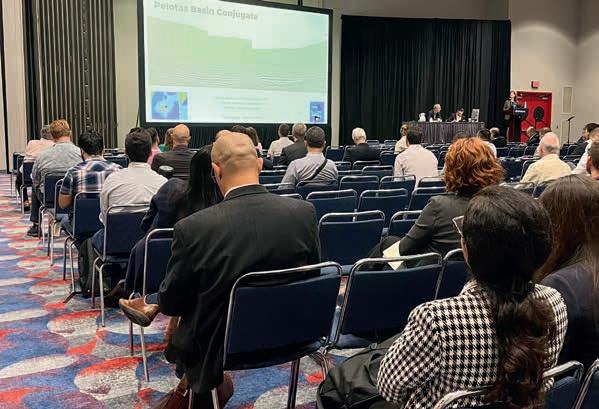
Geological systems modelling was the topic of two dedicated sessions at this year’s EAGE Annual. Convenors Bjorn Wygrala (Geological adviser), Johannes Wendebourg (TotalEnergies) and Thomas Hantschel (Terranta) present some of its highlights.
Modelling basin-scale geological processes has been evolving for nearly 50 years, following the recognition that temperature and time control the geochemical processes that lead to the formation and occurrence of petroleum. While its applications to petroleum systems analysis are widely used in the industry, concepts and simulators are now also being adapted to model the processes that control new subsurface energy resources such as critical minerals and natural hydrogen.
These topics were addressed in two Dedicated Sessions hosted by the EAGE Technical Community on Basin and Petroleum Systems Analysis in Toulouse: The role of basin modelling in opening new plays and Modelling subsurface systems: critical minerals, geothermal and hydrogen. Basin modelling has an important role in opening new oil and gas plays, both in proven and unproven basins, chasing ever-more subtle traps with higher risks where fluid properties are key to economic success.
Kornpihl et al from SLB presented a typical example of an application of basin modelling in an early-stage exploration. The study area covers the entire Algerian offshore, with only a single DSDP and three exploration wells drilled in the 1970s. Seismic reprocessing allowed recognition of new play types of clastic and carbonate reservoirs which were utilised in a petroleum systems modelling (PSM) study of five 2D sections. The expulsion potential of four postulated pre-Messinian source rocks was assessed, including relevant uncertainties. Modelling results indicate the potential for a working petroleum system but requiring additional analysis of charge vs trap timing. This study is a useful reference for the use of PSM to develop, test and constrain exploration concepts and key risks in frontier areas with sparse seismic and well data.
Fillon et al from TotalEnergies presented a review of the history of basin modelling of the highly prolific and well explored Lower Congo Basin offshore West Africa. Modelling has accompanied 20 years of successful exploration and is essential to understand the link between basin geodynamics and the evolution of petroleum systems through time. An in-house model developed in 2012 was a major milestone for regional understanding but was limited by modelling capabilities and data availability, resulting in large uncertainties in the results. Recent advances in modelling techniques to represent the lithosphere evolution of rifted margins, constrained by thermomechanical models, have resulted in significantly improved predictions, even in poorly resolved areas. Of special importance is the ability to assess and rank key controlling factors on regional scale prospectivity within a complex basin such as the Lower Congo. The paper is an excellent reference for the application of state-of-the-art basin modelling capabilities and their impact on effective exploration strategies.
An important aspect of basin modelling in oil and gas exploration is the role of source rock kinetics in estimating phase type and gas-liquid (GLR) ratio. Hartwig and Mahlstedt from GeoS4 presented their recent work to translate thermal histories into petroleum generation histories including GLR. They compared applications of widely used 30+ year old reference source rock kinetics with newly developed source-specific kinetics which they applied to multi-source rock petroleum systems of the midNorth Sea area on the Norwegian Continental Shelf (NCS). The authors conclude with ‘best-practice’ advice for regional vs local predictive modelling using specific source rock types. Their work is essential reading for all petroleum systems analysts interested in improving petroleum property predictions.
Modelling subsurface systems for energy transition topics is a relatively new field but is easily adapted from PSM. Palmowski et al from Terranta presented such adaptations to the exploration of critical minerals and natural hydrogen. The authors emphasise the importance of reactive flow modelling and the spatial and temporal scalability of simulators. Subsurface water flow models must be able to handle complex convection systems to transport
Participants discussed the continued role of petroleum systems modelling in oil and gas exploration, as well as its application to new subsurface energy resources.
metals, hydrogen or other fluids such as CO2 where density and salinity contrasts are drivers in addition to advective and diffusive transport. Additionally, anorganic geochemical models for water chemistry and rock-water interaction must be integrated. Two case studies were shown: one was a model of metal exchange reactions and transport from the Permian Kupferschiefer in Northern Germany and Poland demonstrating exploration applications to mineral systems modelling for sedimentary copper deposits; the other showed hydrogen systems modelling in the northern Pyrenees based on published geological interpretations. The presenters provided an excellent introduction to new technical developments in subsurface systems modelling for the energy transition.
Hartwig from GeoS4 introduced a rapid regional modelling approach to support exploration for natural hydrogen resources. Using a simple set of global parameters such as depth, temper-
ature, pressure and water salinity, areas can be identified where hydrogen could be generated and occur as a free gas phase or in aqueous solution. Migration and trapping scenarios can then be calibrated to known occurrences of natural hydrogen in the subsurface. The workflow is analogous to top-down petroleum systems analysis used to understand basin-scale hydrocarbon migration and phase behaviour. The onshore Cooper Basin in Australia was shown as a case study where a fully calibrated PSM and a hydrogeologic atlas are publicly available and where occurrences of natural hydrogen have been documented. Continuous generation of hydrogen from coals in the basin is also possible. As a result, hydrogen resource densities and aqueous vs free-phase hydrogen conditions in aquifers can be mapped. The approach can be a useful starting point to understand favourable conditions for natural hydrogen generation and entrapment.
Abdullahi et al from Geosciences Montpellier investigate the potential for the generation of natural hydrogen by radiolytic processes using a petroleum systems model from the Taranaki Basin in New Zealand. A radiolytic production rate in the altered/ fractured granitic basement is determined and migration modelling is performed using a range of petroleum migration modelling approaches (Darcy, diffusion, flowpath, invasion percolation, coupled methods). Results are compared with hydrogen shows in conventional reservoir intervals in two wells. Sensitivity analyses for a wide range of processes and properties are included in the study, resulting in a useful reference for the study of radiolytic contributions in natural hydrogen systems.
Serpentinisation of ophiolitic rocks is considered to be one of the most important sourcing processes for natural hydrogen. Tierney et al from Getech presented a workflow for the investigation of natural hydrogen potential in Vardar Zone ophiolites of the Balkans. Gravity and magnetic data are used to map prospective source bodies and their spatial relationship to fluid flow networks. The regional geological framework is given by a 3D model of magnetisation amplitudes and orientations which help to interpret distributions, properties and possible differences of serpentinisation in the target ultramafic rocks. Data from the World Stress Map is used to indicate regions where structures could be favourable to influence serpentinisation reactions and/or likely migration routes. Hydrogen concentrations have been mapped in several areas in the Vardar Zone and can be attributed to the serpentinisation of ultramafic rocks in the ophiolitic suites, with hydrogen isotopes indicating serpentinisation at depths of approximately 2 km. Such regional screening assessments provide the framework for further refinements of regional ophiolite studies to more focused targets for natural hydrogen exploration.
These two dedicated sessions on geological systems modelling clearly demonstrated not only the continued role of petroleum systems modelling in oil and gas exploration, but also applications to geological systems relevant to the energy transition and to new energies. Presenters delivered a set of very useful reference papers that can be consulted in EarthDoc.
Join the Basin and Petroleum Systems Analysis Community!
Seventy years ago, the first issue of Geophysical Prospecting set out with a bold ambition: to be more than a repository of equations and field results. It aimed to tell the story of how humans listen to the Earth, mapping what lies beneath without ever lifting a spade. Since then, the journal has become a stage where ideas, methods and discoveries converge shaping the very way we explore our planet.

What makes Geophysical Prospecting unique is not only its history but also its spirit. Each article is a conversation between theory and practice, between scientists pushing the limits of algorithms and engineers testing them in the field. Readers encounter rigorous science alongside the spark of imagination, discovering new ways to model the unseen, clever uses of waves and fields, and creative approaches to long-standing challenges in exploration.
The journal thrives at crossroads. It connects academia and industry, experienced experts and early-career researchers, established methods and bold innovations. Papers published here often take on a second life, shaping courses at universities, guiding surveys in frontier regions and inspiring collaborations across continents.
As the energy landscape evolves and geoscientists address sustainability, Geophysical Prospecting continues to adapt. It champions not only oil and gas exploration but also the search for geothermal resources, carbon storage and critical minerals, all grounded in the principles of listening to the Earth.
We invite you to explore the latest Editorial Choice article in this issue Bayesian seismic–petrophysical inversion for rock and fluid properties by Francesco Brandolin, Matteo Ravasi and Tariq Alkhalifah (2025). This standout contribution delves into advanced inversion techniques that integrate seismic data with petrophysical models, offering new insights into subsurface characterisation.
Open the pages of Geophysical Prospecting and join a conversation that has been unfolding for decades. Curiosity meets creativity, theory meets practice, and every discovery sparks imagination. Share your work, read and explore. Together, we can continue listening to the Earth in ever more inventive ways.

EAGE has signed a co-operation agreement with EVOLEN, the French trade association serving energy industry companies and their members. It is one of a number of ongoing initiatives in our mission to extend our network of professional organisations worldwide.
Through this latest partnership, we aim to provide our members with new possibilities for addressing the challenges and opportunities of energy transition. Committed to the goal of carbon neutrality by 2050, EVOLEN connects key players of the energy industry to discuss innovative, sustainable and environmen-
tally responsible solutions to accelerate decarbonisation. It showcased some of its current and planned projects at our Annual in Toulouse in June.
We have also renewed our associated society agreement with the European Association of Geochemistry (EAG) aiming to further promote the dissemination of geochemical knowledge, notably with exchanges of educational content, such as Distinguished Lecturer Programme webinars, short courses and plenaries.
‘This renewed co-operation between EAGE and EAG strengthens the collaboration between both societies and
allows their respective members to have access to meetings at preferential rates as well as to a wide range of learning opportunities in geochemistry and related fields. In addition, the joint Technical Community on Geochemistry provides a forum for members to access timely information, share resources and connect with one another,’ explains Marie-Aude Hulshoff, EAG Executive Director.
Our Association was also present at the IMAGE 2025 conference, organised by AAPG, SEG and SEPM. We had a booth dedicated to promoting our latest initiatives, and three of the top presentations from our annual conference were featured at the session ‘Best of EAGE 2025’: Magdalena Gawron (Viridien) presented ‘ 4D PS-wave processing and imaging with trenched sensors at the Snorre field’; Karina Rodriguez (Searcher), ‘ Orange and Pelotas Basins 3D seismic expression and prospectivity of Turbiditic-Contouritic depositional systems’ ; and Inti Rodriguez (Vaulted Deep), ‘ Exploring the geothermal recirculation well concept for reusing wells to be abandoned ’.
The EAGE Student Fund supports student activities that help students bridge the gap between university and professional environments. This is only possible with the support from the EAGE community. If you want to support the next generation of geoscientists and engineers, go to donate.eagestudentfund.org or simply scan the QR code. Many thanks for your donation in advance!
Clairet Guerra ’s studies and early career have taken her from Venezuela, to Colombia, Germany and the UK where she now works for SLB as the geomechanics product analyst. However, her lifetime preoccupation with space exploration endures, getting one step closer by completion of a space resources programme.

Venezuela beginnings
I grew up near the beach in Venezuela. My parents held positions in the national oil company until their roles were systematically taken over by regime supporters. Political loyalty mattered more than qualifications. We left Venezuela one day before I turned 21, leaving my civil engineering studies and my parents’ decades-long careers for an uncertain future in Colombia. The decision was about dignity, not just economics. My parents and sister have consistently shown discipline and courage throughout my life, teaching me that principles matter more than comfort and that you can rebuild anything with determination.
Bogota experience
Bogota was my first lesson in being a migrant. Universidad Javeriana gave me my first real shot. I earned a degree in civil engineering and later a master’s in geotechnical engineering. What made the difference were people who believed in me. Friends helped me navigate the social landscape, professors provided guidance on moving forward in life.
Move to Germany
Germany represented engineering excellence, but my first interview was a harsh introduction to racism and migrant shame. Instead of fighting to prove myself in unwelcoming spaces, I found TU Darmstadt and Prof Andreas Henk. I learned to appreciate the discipline and structure of the German system. Under this framework, I did two internships with SLB and completed my doctoral studies in applied geosciences.
Wintershall was a significant reality check as industry demands translating results into effective action items that drive business decisions. Getting accepted into the company SPEAD programme was a major milestone that exposed me to the broader energy landscape and opened unexpected doors. It helped me understand the industry is as much about problem-solving and innovation as geology and engineering and taught me the skill of communicating findings in ways that lead to actionable outcomes.
My SLB internships during university showed me the service side of the industry operates at a completely different pace. When the opportunity came to return full-time, I was ready for the challenge. The learning curve has been incredibly steep; you must absorb complex technical concepts quickly while understanding how they translate into customers solutions. Geomechanics is one of the most integrative domains in the field. Now, I have a role that serves as a bridge between multiple domains, customer needs and technology development. It’s exactly the kind of environment where rapid professional growth happens.
My ‘activism’ comes from lived experience. When I got involved with EAGE Student Affairs Committee, it was to ensure other students didn’t face the same barriers I experienced. GeoLatinas is particularly close to my heart because it addresses
gender diversity in geosciences and Latino representation in STEM. While I’m not actively contributing, I maintain a solid network of mentors and friends through it, which is exactly the purpose of the organisation. I firmly believe in mentoring and the importance of a good network. I’ve been fortunate to have mentors who saw and still see potential in me. Now it’s my responsibility to contribute for others.
I’ve been obsessed with space since I can remember. Space exploration represents humanity at its best: collaborative, curious, pushing boundaries we didn’t even know existed.
The Colorado School of Mines Space resources programme was a natural progression of this interest. The skills required for space exploration, systems thinking, risk management, working in extreme environments, align beautifully with oil and gas work. Both industries deal with hostile environments, require precise engineering, and demand respect for the power of natural forces. Do I have astronaut ambitions? Honestly, yes. Even when I am so pleased with my current context, if I could contribute to a mission while bringing my geoscience expertise to understanding other worlds, that would be a dream come true.
I’m a strong advocate for burnout prevention and mental health awareness. I try to take time off work and focus on working out or dancing. Balance is key for progress.
BY ANDREW M c BARNET

You could never apply to the seismic business the old saw, much favoured by those who have been successful in some activity or other, that ‘you make your own luck’. There is an implication that hard work is crucial, hence the wisdom shared by US founding father Benjamin Franklin (1707-90) that ‘diligence is the mother of good luck’ and going back further, Roman stoic philosopher Senecca wrote that ‘Luck is what happens when preparation meets opportunity’.
If we give credence to these immortal sayings, then we must conclude that, in several decades of doing business, seismic service companies have endured a run of unjustly deserved bad luck with very little respite. For surely it has not been for the want of dedication in providing superlative technology for the oil and gas E&P companies dating back to at least the 2D seismic era and everything that has followed. Yet, the business is a shadow of its former days. It is effectively down to two main marine geophysical contractors, neither of which was even operating vessels ten years ago. Last month at the end of the summer season high, only nine or ten of their streamer vessels were in operation worldwide. Ocean bottom seismic, now worth almost as much as towed streamer, is not on a scale to compensate for the overall market decline.”
2008 financial crisis, 2014-16 oil price slump, and 2019 Covid outbreak. Each has been a major setback in the demand for the service sector, often just when recovering from the last hit, the pandemic being the recent example.
‘A run of unjustly deserved bad luck with very little respite’
You could contend that today’s leading marine seismic protagonists are experiencing another streak of particularly frustrating bad luck affecting their business prospects beyone any economic cycle. The leaders of TGS and Shearwater GeoServices continue to report a struggle with towed-streamer activity and seemingly a temporary stalling of the growth in demand for ocean bottom seismic (OBN), as oil companies exercise ‘discipline’ in their budgets. As it happens they seem relatively sanguine that 2026 is expected to be another flat year reassuring their stakeholders that a change in their fortunes is in prospect, also they have pared down their operations to meet soft demand.
Of course bad luck can also be associated with bad judgement from which no business is immune. The marine seismic history features its quota of poor decision-making, notably stemming from consistent over-supply of vessel capacity and lack of price discipline. Arguably, its fortunes have always been largely dependent on factors beyond its control, with no solution to surviving the cycles of oil and gas company E&P spending and the price of oil, the latter the key consideration for exploration budgets.
Even so, seismic companies have had to contend with some massive disruptions that can certainly be put down to bad luck, i.e., the consequences of circumstances which they could not have predicted or prepared for. The crises have become with deadly regularity – 1986 oil glut, 1999-2000 oil company consolidations,
Their logic (with plenty of supply and demand charts to prove the point) is that oil companies cannot go on for ever without further exploration to top up their reserves, which are being depleted faster that they are being replaced. ‘With falling remaining reserve life, many large E&P companies will face declining production rates unless more reserves are added and brought on stream. As a result, we remain optimistic for the long-term opportunities for TGS,’ said CEO Kristian Johansen at the company’s 2nd quarter results Echoing this sentiment, Irene Waage Basili, Shearwater’s CEO, at her company’s latest presentation stated that ‘Longer-term, the oil and gas industry needs to rebuild reserves to sustain output and support energy security. This will require increased investments in marine seismic data acquisition and imaging.’
Long term is of course the kicker. It is the seismic service companies’ bad luck that their customers are caught up a maelstrom of geopolitical, economic and energy strategy (security of supplies v. decarbonisation) pressures that call for caution and keeping the brakes on E&P spending. There is no obvious end in sight.
Many factors are forcing the hand of oil companies, which make it all the more difficult to predict when the economic climate will change. Global uncertainty exacerbated by US tariff manoeuvres is reflected everywhere with investment, consumption and employment apparently at risk (although weirdly the US stock market seems immune, constantly hitting new highs). Impact of two high profile wars with no obvious resolution is another. More directly concerning for oil companies’ immediate bottom line, as well as the viability of future investment plans, is the expected continuing decline in the price of oil as OPEC+ relaxes its production quotas when supply was in equilibrium or maybe already outstripping demand.
All this negativity is having its effect. Major oil companies are being more circumspect about energy transition investments and refocusing on the efficiency of their core business. For the time being stakeholders continue to be rewarded with dividends and buybacks to increase share value. Merger and activity (M&A) in the past year or two has been seen as an option for adding to reserve portfolios (rather than costly, speculative seismic exploration), admittedly mainly in the North American shale sector, according to Rystad Energy. But, despite a softening in the first quarter, the analyst reports international deal value for the first half of 2025 reached $39.5 billion, a 37% year-on-year increase thanks to a strong recovery in 2Q. Major transactions included ADNOC subsidiary XRG’s bid for Santos, the merger of Repsol and Nego Energy’s UK North Sea upstream businesses, Eni’s divestment of upstream assets in Cote d’Ivoire and Congo-Brazzaville to Vitol and DNO’s acquisition of Norway-focused Sval Energi. Rystad notes wryly that a potential Shell-BP merger remains the wildcard and could singlehandedly push annual deal value past $200 billion for a third straight year.
has been in serious decline. Predictions of its total demise are doubtless exaggerated. However, it is not impossible to envisage the day when some form of seabed seismic technology becomes sufficiently flexible and cost-effective to carry out the exploration role once the sole preserve of towed-streamer seismic.
‘Era of the towed streamer has been in serious decline’
Among other things, towed streamer will surely continue to be partly sustained by offshore licensing round activity worldwide and the demand for seismic that it generates. Major offshore oil and gas producers like Brazil, the US (offshore Alaska as well as the renamed Gulf of America), and Norway are all in the process. Offshore South America, Suriname is due to announce a licensing round. Offshore West Africa, Namibia, Angola, Nigeria, Sierra Leone, Liberia and Mauritania are all exciting varied degrees of interest with their licensing initiatives. The eastern Mediterranean remains a hotspot with Egypt, Libya, Lebanon and Cyprus at different stages of licensing. Offshore East Africa, Kenya and Tanzania are the countries of interest. Meanwhile India has launched its most ambitious offshore oil and gas exploration initiative to date. Innovative technology offering more cost effective operations has always been part of the tookit to capture oil company attention and spending. For towed-streamers, though not insignificant no recent advances have been game-changing. Headline improvements feature wide-tow multi-source geometries, long-offset streamers, and advanced fibre-optic towed streamers using distributed acoustic sensing (DAS) technology.
Unfortunately workforce layoffs across the industry are part of the current precarious scenario. Shell, bp, ExxonMobil, Equinor, Harbour Energy, OMV, Petronas, and APA (holding company of Apache) have all announced cuts. In the case of ConocoPhillips and Chevron, adjustment after their recent major mergers (Marathon Oil and Hess respectively) may account for some of their staff reductions, still personnel losses in the region of 20% are high.
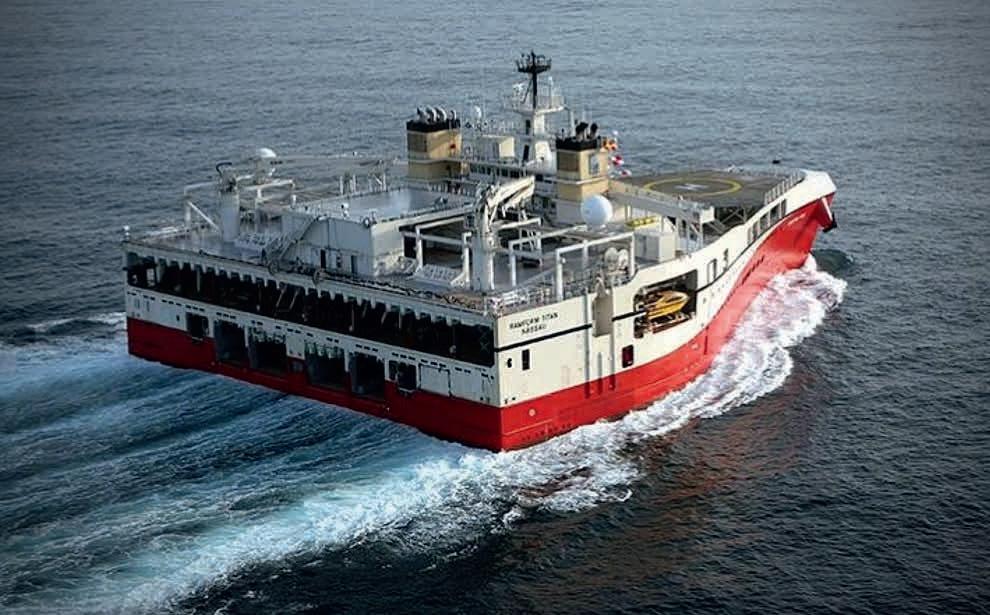
For the seismic business, the obvious strategy is to focus on what it can control and what it can realistically anticipate is going to happen in the market without their luck running out any further. Not that this makes decisions any easier. For example, following the completion of the purchase of PGS in July 2024, TGS is already selling the Ramform Explorer and Ramform Valiant ships, and stacking the Ramform Vanguard. Likewise rival Shearwater in the last few years has recycled a number of vessels acquired when building the company and expects to sell more from a fleet at one time of 29 vessels (towed streamer, multi-purpose, source, etc).
These changes in inventory are part of some necessary housekeeping but also recognition that the era of the towed streamer
OBN has been a very different technology story with extraordinary growth against all the prevailing winds. From a very low commercial presence 10 years ago, the OBN market is on the point of exceeding the towed streamer market in 2025. If there is a downside, it is the danger of commoditisation. Currently there is no clear leading technology offered by the five key players TGS, Shearwater, PXGEO, SAExploration and BGP. There is a steady flow of contracts but the competition is intense in a tight market, and may become more so more so as BGP steps up its intention to seek more international work outside the Middle East (where its massive contracts are beginning to wind down). Clearly there is scope for OBN to reach another level in every area – vessel operations, node design including battery life, node deployment and retrieval (ROVs) not to mention ‘drone’ and other futuristic applications. Changes are likely to be incremental rather than dramatic, but enough to maintain OBN’s upward trajectory.
Finally, possible good news for multi-client companies like Viridien and TGS with the data to process, we should not ignore growing interest in how full wave form inversion (FWI) could stimulate a resurgence in reprocessing legacy 3D data based on FWI’s improved high fidelity velocity model building capabilities. If the compute resources and other challenges can be overcome, this could become a very attractive proposition for oil companies, worldwideThat would constitute good luck well earned.
Views expressed in Crosstalk are solely those of the author, who can be contacted at andrew@andrewmcbarnet.com.


The slowdown in the seismic acquisition industry has been reflected in Shearwater reporting a second quarter net loss of $38 million on revenues of $134 million compared to a net profit of $25 million on revenues of $214 million in Q2 2024. Second quarter operating loss was $24 million compared to an operating profit of $46 million in Q2 2024.
Limited contracts awarded for the northern hemisphere summer season led to a decrease in marine seismic acquisition activity in Q2 of 2025, said the company.
At quarter end, backlog was $319 million, compared to $400 million at the end of the previous quarter. This compares to $325.5 million on 30 June 2024.
Shearwater operated an average of 8.1 active vessels compared to 9.0 active vessels in the first quarter of 2025 and 10.0 in Q2 of 2024. The sequential decline reflects the stacking of SW Thuridur early in the period. Utilisation of the active fleet was 78% compared to 94% in the previous quarter and 83% in the year earlier period.
Seven Shearwater vessels worked on contract acquisition in Q2. This included three vessels operating in streamer acquisition, one ROV OBN deployment vessel and three vessels operating in source mode on dual vessel contracts, the latter supporting utilisation while delivering incremental returns. The eighth vessel was on multi-client. ‘Significant multi-client revenue recognition is expected over the coming quarters,’ said Shearwater.
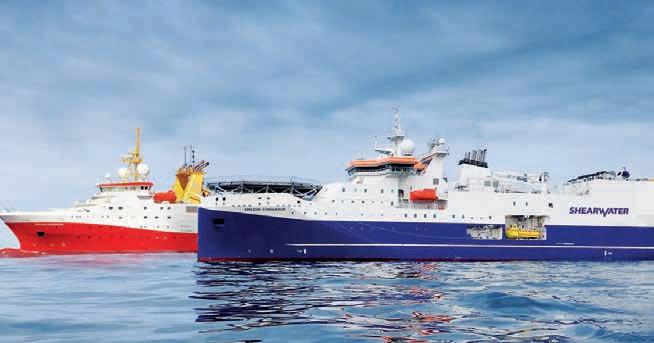
At quarter-end, Shearwater started the reactivation of the vessel Amazon Conqueror with Isometrix streamers for deployment on the one-month Tyrihans 4D survey for Equinor in the Norwegian Sea.
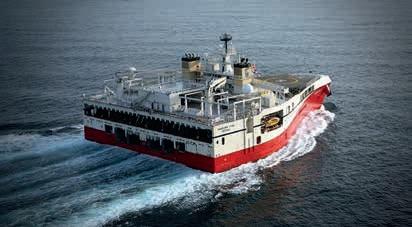
Irene Waage Basili, CEO of Shearwater, said: ‘Marine seismic activity declined during the second quarter. Still, we delivered robust fleet utilisation of 78%, supported by projects starting in earlier periods with vessels rolling off contract towards quarter-end. We completed multi-client data
acquisition for the second season in Brazil’s Pelotas Basin, which is rapidly emerging as one of the world’s most promising exploration regions. Recent client contracts awarded in the third quarter are encouraging, confirming the market positioning Shearwater has achieved in the competitive OBN (ocean bottom node) market. Still, year-to-date order intake has been muted. We continue to experience low visibility as clients remain cautious, affecting fleet scheduling. There are no clear indications of a step change in the marine seismic market, and we expect the flattish trend seen over the past three years
to continue into next year, with quarterly variations. In the quarter, we have proactively taken steps to conserve capital and adapt the organisation to the expected activity level. Combined, these measures are expected to improve free liquidity by more than $60 million over the next 12 months. Longer-term, the oil and gas industry needs to rebuild reserves to sustain output and support energy security. This will require increased investments in marine seismic data acquisition and imaging. Our active role as industry consolidator has strategically positioned us to scale with demand as clients’ investments in seismic data increases, owning a fully invested fleet of high-end seismic acquisition vessels capable of serving all market segments.’
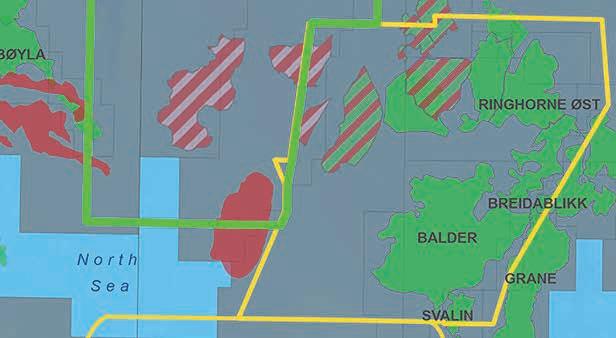
Viridien and joint-venture partner TGS have launched the Megabar Extension Phase I survey in the Barreirinhas Basin offshore Northern Brazil. The 5300 km2 multi-client 3D seismic survey will be acquired by TGS and imaged by Viridien.
data acquisition. Acquisition is scheduled to commence in early September and conclude by late November.
Imaging of the Megabar Extension survey will leverage Viridien’s proprietary time-lag full-waveform inversion (TL-FWI) and reverse time migration
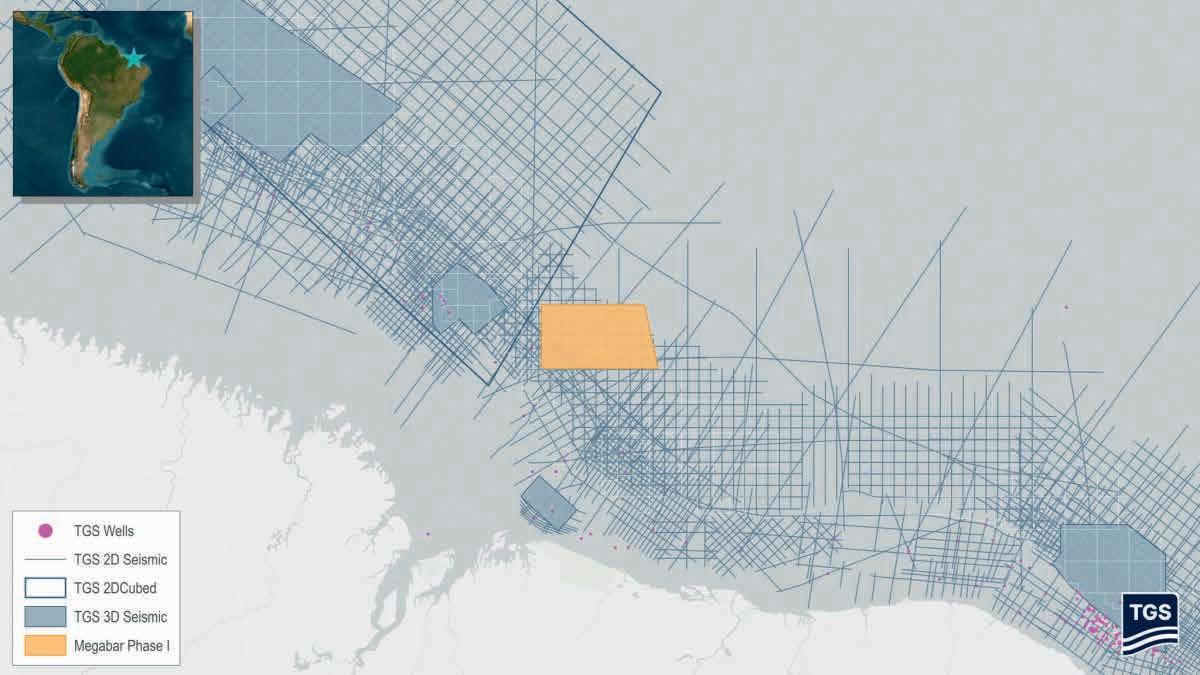
Building on Viridien’s existing Megabar survey coverage, Megabar Extension Phase I will be acquired in a promising area with proven geological potential but no existing 3D data. TGS will deploy the purpose-built streamer vessel Ramform Tethys, equipped with its proprietary GeoStreamer technology, for high-quality 3D
(RTM) imaging technologies to provide enhanced geological understanding. This will help to reveal new play potential, improve prospect evaluation and de-risk exploration, said the partners.
The Barreirinhas Basin features proven petroleum systems and giant discoveries in adjacent Guyana and Suriname basins
that demonstrate analogous deepwater plays. ‘Recent licensing activity by IOCs along the equatorial margin, coupled with the success of Brazil’s 5th Cycle Permanent Concession Offer, supports growing momentum for the region,’ according to the partners.
Kristian Johansen, CEO of TGS, said: ‘Geology in these basins share characteristics with discoveries in Guyana and Suriname, and Megabar Extension Phase I will represent a significant step forward in understanding geology in the Barreirinhas Basin.’
Sophie Zurquiyah, CEO of Viridien, said: ‘The Megabar Extension survey is part of our long-term commitment to unlocking high-potential frontier areas for exploration opportunities in Brazil. Megabar Extension will give our clients an unmatched advantage in a strategic area of the underexplored Barreirinhas Basin in one of South America’s most promising exploration plays. With exclusive access to the first ultramodern 3D seismic data set in this area, explorers will be able to identify opportunities faster, make more confident decisions, and position themselves ahead of the competition for upcoming bid rounds.’
Initial imaging products are expected by Q3 2026, and final data expected to be available in Q1 2027.
PXGEO has won its first contract in Malaysia to deliver offshore seismic data acquisition services. The two-year deal includes a minimum commitment of 365 days of acquisition activity over the contract term utilising the PXGEO 2 seismic vessel.
The campaign will play a key role in supporting Malaysia’s drive to unlock new hydrocarbon resources and accelerate upstream exploration aligning with the Malaysia Petroleum Management (MPM) aspiration, said PXGEO.
Around 50 multi-disciplinary PXGEO personnel will support the project, delivering multiple surveys using 2D
and 3D towed-streamer technology, with the flexibility to incorporate ocean bottom node solutions if required.
Charles ‘Chuck’ Davison Jr, CEO and executive chairman of PXGEO, said: ‘Winning work in a new geography with a new client is an exciting development for our business.’
PXGEO employs a 400-strong workforce across strategic global locations, including its Dubai headquarters and offices in Paris, Houston, Linköping, Oslo and Rio de Janeiro, along with offshore personnel.
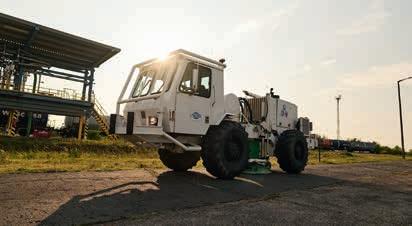
MOL Group is conducting 3D seismic surveys in and around the Danube Refinery to assess the potential for geothermal energy utilisation.
The purpose of surveys is to examine whether the surroundings of the Danube Refinery possess geothermal character-
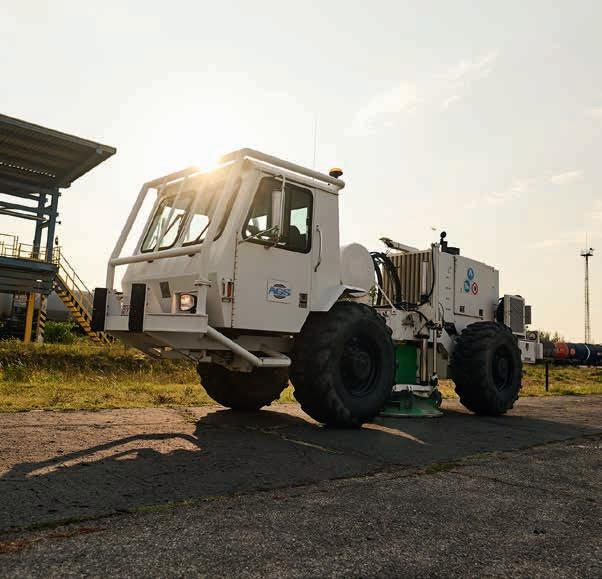
istics that could contribute to improving the refinery’s energy efficiency. If sufficient quantities of thermal water with the right temperature can be identified at the appropriate location and depth, it could significantly support the refinery’s energy needs.
The results of the analyses are expected to be available in about six months. If the findings are promising, further feasibility studies will follow.
‘The geothermal exploration area granted to MOL includes Százhalombatta and the Danube Refinery. Therefore, in addition to mapping the entire area, it is logical to specifically examine the geothermal potential of the refinery’s surroundings,’ said Dávid Kapes, head of group E&P low carbon and new energies.
Krisztián Pulay, Group DS production and development SVP, said: ‘After building a solar park and commissioning the green hydrogen plant at the Danube Refinery, we are now experimenting with utilising the Earth’s heat.’
The Norwegian Offshore Directorate is inviting the companies on the Norwegian Continental Shelf (NCS) to nominate blocks for the 26th licensing round on the NCS. The deadline for nominating blocks was 1 October.
‘Norway will remain a long-term supplier of oil and gas to Europe. To deliver on this commitment, we must make more discoveries - and to make more discoveries, we must explore,’ said Minister of Energy Terje Aasland.
A large share of the expected remaining oil and gas resources on the continental shelf has yet to be proven, he added. ‘Europe will need oil and gas for a long time to come. Our goal is to ensure that we can supply oil and gas produced with
low emissions for as long as there is a demand,’ said Aasland.
The Norwegian Offshore Directorate is conducting a nomination process, allowing companies to propose which areas they would like to see announced in the 26th licensing round. All acreage that is open and available for awarding production licenses on the continental shelf and is not part of the APA area may be nominated.
Companies’ input, together with the Offshore Directorate’s own subsurface assessments, will form the basis for the Directorate’s petroleum-related recommendation to the Ministry on which acreage should be announced in the 26th licensing round.
BRIEFS
ConocoPhillips will cut 20-25% of its workforce as part of a broad restructuring, according to Reuters.
Equinor and Shell have appointed Neil McCulloch as chief executive officer and Nicoletta Giadrossi as chair of their offshore UK incorporated North Sea joint venture, Adura. McCulloch is currently CEO of Spirit Energy. Giadross has led four boards and is currently chairing MSX International, a global company providing technical services to the mobility sector. She is also a director of Vopak NV, the global storage infrastructure company and Renew Global in India. Equinor and Shell announced their plan to combine their UK offshore oil and gas assets into a new incorporated joint venture in December 2024.
Equinor has assessed the proposal put forward by the board of the Danish energy company Ørsted for a rights Issue with pre-emptive rights for existing shareholders. As a long-term industrial shareholder, Equinor intends to participate in the rights issue and maintain its 10% ownership share in Ørsted. Equinor will subscribe for new shares at a consideration of up to $939 million.
Staatsolie is launching a licensing round next month for open acreage offshore Suriname. Investors can select an area and to opt for either a Joint Study Agreement (JSA)/Technical Evaluation Agreement (TEA), or Production Sharing Contract (PSC). Full details on the ‘Open-door Offering’ will be published with the launch on 24 November 2025.
Sonatrach and the National Oil Company of Kenya have signed an agreement to explore for oil and gas projects in Kenya.
Brazil’s National Agency of Petroleum, Natural Gas, and Biofuels (ANP) has released the list of blocks that will be offered in the public session of the 3rd Cycle of the Open Acreage of Production Sharing. Seven blocks will be offered: Jaspe, Citrino, Larimar, Ônix, Itaimbezinho, Ametista, and Esmeralda.
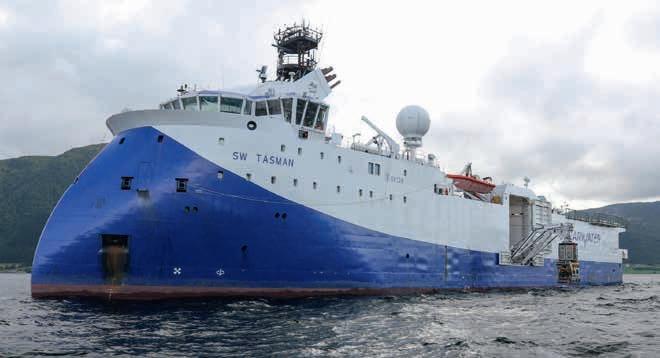
Shearwater has won a contract for a deepwater ocean bottom node (OBN) seismic survey offshore Angola from ExxonMobil. The two-month project is scheduled to commence in the third quarter.
The project will be delivered using Shearwater’s OBN platform, with the vessel SW Tasman deploying the Pearl node system, with SW Gallien deployed as source vessel.
‘Being selected by ExxonMobil to perform this OBN survey in Angola is a real testament to Shearwater’s OBN platform,’
says Irene Waage Basili, CEO of Shearwater. ‘With this award, Shearwater continues to deploy the industry’s leading geophysical toolbox to support West Africa’s energy sector.’
Meanwhile, Shearwater has won a contract for a deepwater ocean bottom node (OBN) seismic survey in Ghana’s Jubilee and TEN fields, operated by Tullow and its partners.
It will be the first deepwater OBN project offshore Ghana, following Shearwater’s successful recent deployment of the SW Tasman vessel and Pearl node OBN platform in Côte d’Ivoire and Angola. The two-month survey is scheduled to begin in the last quarter of 2025.
SW Tasman and the Pearl node platform have been continuously deployed offshore West Africa since late 2024, first executing the inaugural OBN survey offshore Côte d’Ivoire before mobilising to consecutive surveys offshore Angola.
This first OBN survey is expected to further enhance reservoir imaging, helping to unlock deeper insights to inform field development and production strategies, said Shearwater. It follows a streamer survey executed by Shearwater over the Jubilee and TEN fields in early 2025.
Viridien has taken ownership of seismic field data from the Momentum survey in the Gulf of America, which will be incorporated into the Laconia database, Viridien’s sparse ocean bottom node (OBN) programme.
The new coverage will extend Viridien’s OBN footprint by 143 Outer Continental Shelf blocks (around 3343 km2) and be integrated with Laconia Phases I
and II to enhance subsalt imaging in the northern Garden Banks protraction area.
‘Leveraging Sercel’s Tuned Pulse Source (TPS), which enables deeper diving-wave penetration, and Viridien’s proprietary elastic full-waveform inversion (E-FWI), the expanded Laconia dataset will offer a step change in resolving complex salt geometries and deformed shale,
unveiling new exploration opportunities in the Paleogene trend,’ said the company in its statement.
Joe Zhou, SVP Americas, Earth Data, Viridien, said: ‘Incorporating Momentum data bolsters Viridien’s deepwater OBN coverage and advances our ability to illuminate complex Paleogene geology as Gulf exploration evolves.’
TGS has won a large streamer contract offshore Indonesia, covering approximately 10,000 km2
Much of the project will focus on acquiring 3D seismic data for exploration purposes, with the final phase of approximately one month dedicated to 4D seismic data acquisition for production monitoring. The survey is scheduled to commence in Q4 2025 and will take around eight months.
Kristian Johansen, CEO of TGS, said: ‘We will acquire the survey with a purpose-built Ramform vessel, equipped with our proprietary GeoStreamer technology, ensuring delivery of high-quality data to the client. With an acquisition period of approximately eight months, this contract secures utilisation well into Q3 2026.’
The UK’s offshore oil and gas industry’s production emissions were down by 7% in 2024, a fifth consecutive year of reductions.
This contributed to a 34% drop since 2018, according to the Emissions Monitoring Report from the UK North Sea Transition Authority (NSTA). Flaring activity, which is the second largest source of production emissions, dropped 4.8% in 2024 to the lowest level on record, and was 51% lower than in 2018.
However, the report also shows projected reductions are lagging behind ambitions in the longer term unless there is ‘significant new action’. ‘The target of halving emissions by 2030, agreed by industry and government in the North Sea Transition Deal, is now well within reach,’ said the NSTA in a statement. ‘However, without serious investment in large-scale active emissions abatement projects, industry will not meet the 2040 target of lowering emissions by 90% or achieve net zero by 2050.’
About half of the offshore emissions reductions achieved between 2018 and 2024 were from online assets, says the report. Since early 2021, NSTA interventions have contributed to preventing the emission of 4.5 million tonnes of lifetime carbon dioxide equivalent, the same as taking 2.5 million cars off the road for a year.
During that period, operators have invested in flaring reduction equipment and improved the efficiency of existing kit, such as gas export compressors and power generation turbines. Onshore gas compression for the Breagh field has been electrically driven since October 2024. Furthermore, multiple normally unattended
platforms now have low-carbon power supplies, for example, small wind turbines, solar panels and batteries, said the report.
The OGA Plan, launched in 2024, sets out clear requirements for operators on electrification and low-carbon power as power generation accounts for 80% of the current total.
investment decisions in the near-term,’ said the report. ‘Unnecessary delays will diminish the case for electrification by reducing the volume of emissions which could be prevented.’
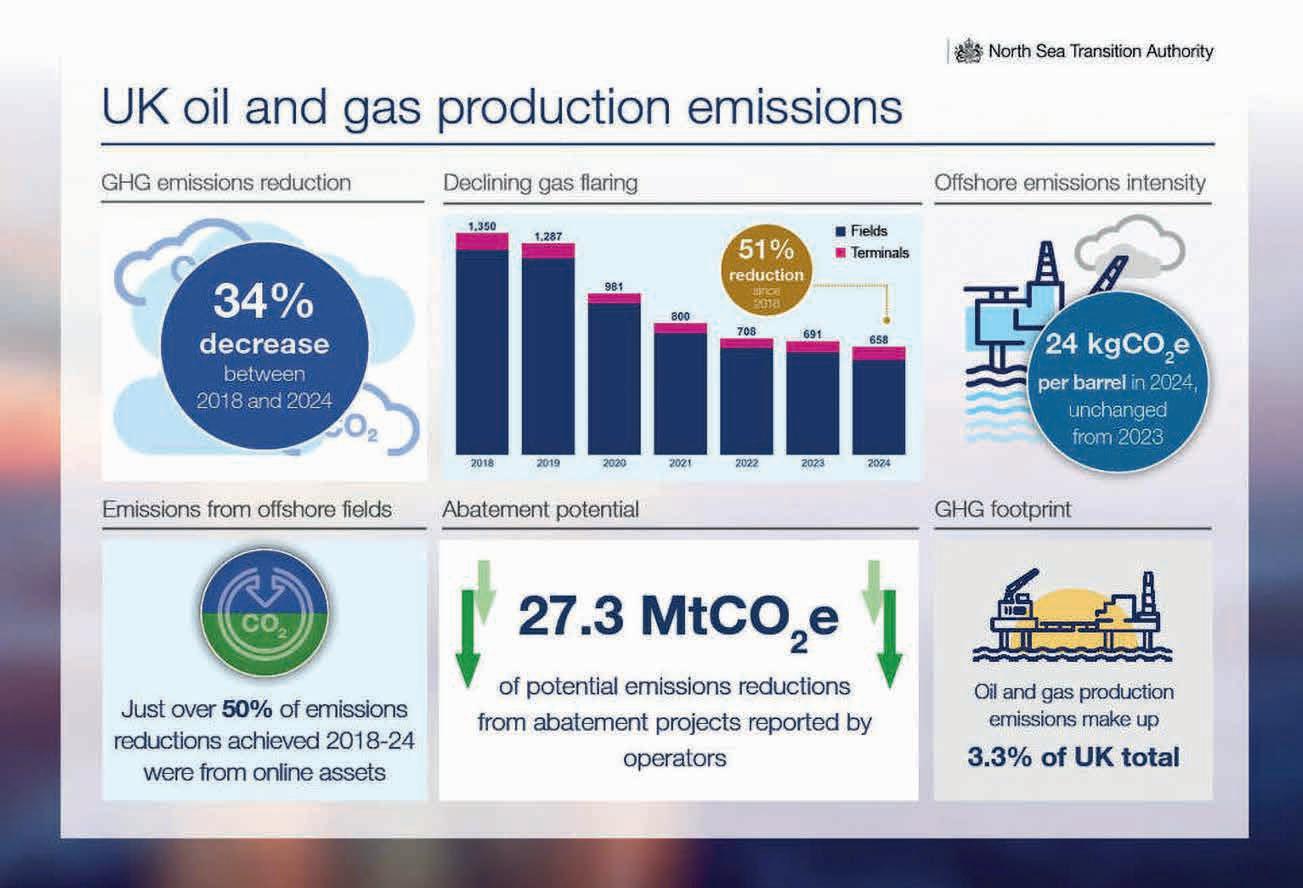
Work is ongoing to integrate a floating offshore wind turbine to partially power the Culzean platform, while the planned Green Volt floating wind farm has secured price guarantees from the government and could power several large oil and gas platforms.
‘It is vital that more electrification and low-carbon power projects reach final
Projects are contributing towards the UK’s target to achieve zero routine flaring and venting by the end of 2030. A flare gas recovery unit was recently activated on the Mariner platform and similar systems will be activated on the Clair and Elgin-Franklin installations. More such projects are in early planning. The regulator has also cracked down on flaring and venting breaches, imposing fines totalling £975,000 since the beginning of 2021.
The US government has withdrawn a total of $679 million in funding for 12 offshore wind projects across America.
US’ Secretary Sean P. Duffy said that federal dollars will be prioritised towards shipbuilding and maritime infrastructure projects.
‘Wind projects are using resources that could otherwise go towards revitalising America’s maritime industry,’ said Duffy. ‘Joe Biden and Pete Buttigieg bent over backwards to use transportation dollars for their Green New Scam agenda while
ignoring the dire needs of our shipbuilding industry. Thanks to President Trump, we are prioritising real infrastructure improvements over fantasy wind projects that cost much and offer little.’
The Trump Administration has refocused the Department of Transportation (USDOT) and its Maritime Administration (MARAD) on rebuilding America’s shipbuilding capacity. Funding from offshore wind projects will be also redeployed to address critical port upgrades and other core infrastructure needs of the US, Duffy added.
ENERGY TRANSITION BRIEFS
PTTEP has reached a final investment decision on Thailand’s carbon capture and storage (CCS) project at the Arthit gas field. The project is designed to capture and store up to 1 million tonnes of carbon dioxide per year.
Baker Hughes has announced an award from Fervo Energy Company to design and deliver equipment for five Organic Rankine Cycle (ORC) power plants at Fervo’s Cape Station power generation project near Milford, Utah, United States. Once operational, the five Cape Phase II ORC plants will generate approximately 300 megawatts of clean power to the grid. The Cape Station project includes Cape Station Phase I, which is poised to deliver 100 megawatts (MW) of baseload clean power to the grid beginning in 2026, as well as Cape Station Phase II, which will generate an additional 400 MW and come online by 2028.
Block Energy has completed its initial injection of CO2 as part of the carbon capture storage project in the eastern European country of Georgia. Liquid CO2 was delivered to the wellsite by Block’s partner on the pilot study, Indorama Corporation, and injected in solution with water. No CO2 leakage on the surface was detected after the injection. A comprehensive monitoring and verification programme is in place with the aim of proving mineralisation of CO2 in the reservoir.
Fidra Energy has secured up to £445 million of investment from EIG and the National Wealth Fund (the NWF) as it reaches financial close on the UK’s largest Battery Energy Storage System (BESS) project at its Thorpe Marsh site in Doncaster, South Yorkshire. Construction will begin immediately and will be funded by a £594 million loan from international lenders. The 1400 MW / 3100 MWh project, which is expected to be operational starting in mid-2027, will have the potential to export more than 2 million MWh annually.
The first CO2 volumes have been injected and successfully stored at the Northern Lights carbon capture and utilisation project in the North Sea.
The reservoir 2600 m under the seabed, the world’s first third party CO2 transport and storage facility, began operation when CO2 was transported via ships from Heidelberg Materials’ cement factory in Brevik. The CO2 is then offloaded and transported through a 100 km pipeline
customers. With Northern Lights in operation, we have proven that this is possible,’ said Irene Rummelhoff, executive vice-president of MMP in Equinor.
The commenced injection of CO2 completes phase 1 of the development, which has a total capacity of 1.5 million tonnes of CO2 per year (mtpa). The capacity of this phase is fully booked.
In March, the owners of Northern Lights made the final investment decision
and injected into the Aurora reservoir under the seabed of the North Sea.
‘With CO2 safely stored below the seabed, we mark a major milestone. This demonstrates the viability of carbon capture, transport and storage as a scalable industry,’ said CEO of Equinor, Anders Opedal.
The Northern Lights joint venture is equally owned by Equinor, Shell and TotalEnergies. Equinor, as the technical service provider (TSP), has overseen construction of the Øygarden facility and the offshore facilities on behalf of the Northern Lights JV, and will also have operational responsibility of the CO2 plant.
‘Lifting new value chains like CO2 capture, transport and storage requires collaboration and effort across the value chain - from governments, industry and
for phase 2, which will increase transport and storage capacity to a minimum of 5 million tonnes of CO2 per year. This decision was made possible after signing of an agreement to transport and store up to 900,000 tonnes CO2 annually from Stockholm Exergi. The expansion is enabled by a grant from the Connecting Europe Facility for Energy (CEF Energy) funding scheme.
The expansion of Northern Lights builds on existing infrastructure and includes additional onshore storage tanks, a new jetty, and additional injection wells. The development of phase 2 with Equinor as TSP is well underway, with the delivery of nine new CO2 storage tanks at the Øygarden site over the summer.
Equinor has an ambition of having 30-50 million tonnes per annum of CO2 transported and stored.
TGS has launched Basin Insight Reports to provide the industry with advanced, data-driven perspectives on the factors shaping basin performance and development.
Each report delivers a basin insight drawn from TGS’ multi-client library, integrating geological, geophysical, and well data to deliver nuanced analysis that goes beyond surface-level trends. ‘By combining subsurface insight with production performance, drilling economics, and operator strategies, the reports offer a comprehensive view of what’s driving basin development,’ said TGS.
The first Basin Insight Report examines the Legacy Haynesville versus the emerging Western Haynesville, also known as the ‘Waynesville’ (encompassing Robertson, Limestone, Freestone, and Leon Counties in Texas). This report highlights the contrast between the established production strength of Legacy Haynesville and the competitive well performance and growth
potential of the Western region. The study also underscores the role of midstream infrastructure in unlocking that potential, given the high-pressure, deep reservoirs characteristic of the Western area.
legacy economics, but the infrastructure bottleneck means timing is everything,’ said David Hajovsky, EVP of multi-client at TGS. ‘Our Basin Insights Reports provide the integrated view needed to
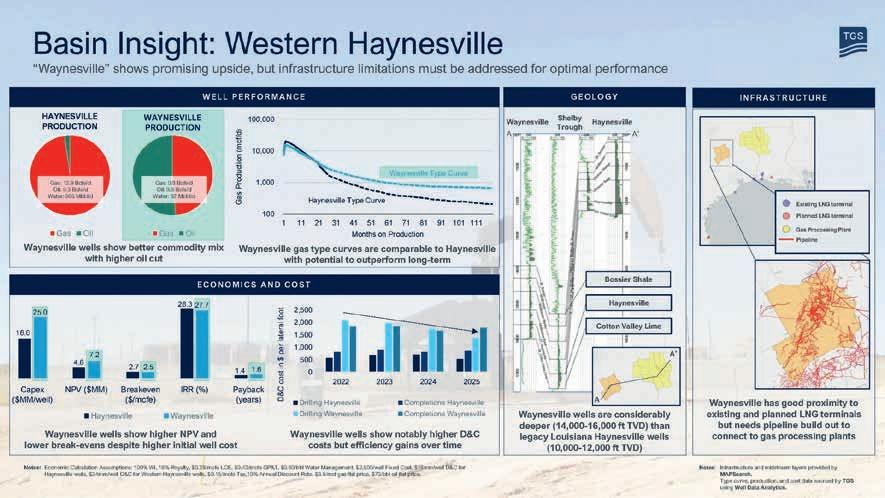
‘What we’re seeing in the Western Haynesville is a play rapidly approaching
navigate both the geological potential and the logistical realities.’
Viridien and French geoscience company Mantle8 have formed a strategic partnership to accelerate hydrogen exploration across the Europe, Middle East, Africa (EMEA) region.
The partnership, which is underpinned by Viridien making an investment in the company, gives Mantle8 access to GeoVerse, Viridien’s geological database to support natural hydrogen exploration in EMEA. In addition, Mantle8 has selected Sercel, Viridien’s sensing and monitoring business, to provide its Wing DFU-3C passive seismic sensors to image subsurface hydrogen-generating systems with greater precision and efficiency.
‘Europe is blessed with abundant, low-emission natural hydrogen, and the drive to map these resources and start drilling is stronger than ever. This partnership gives us the ability to reach that goal much faster,’ said Emmanuel Masini, founder and CEO of Mantle8. ‘Access to Viridien’s GeoVerse database gives us the scale of data needed to fuel our prospect generation and sharpen our targeting of promising zones in line with Mantle8’s thesis. Building on that foundation, deployment of Sercel WiNG DFU-3C sensors provides the capability to image entire hydrogen systems and de-risk drilling programs.’
‘Natural hydrogen is one area, alongside geothermal energy, critical mineral exploration and carbon storage, where our advanced geoscience and data science technology can support the global effort to meet net-zero targets,’ said Chris Page, EVP, new business development, Viridien ‘We see value in collaborating with Mantle8 to combine Viridien’s unrivalled subsurface data, our Sercel sensing solutions and Mantle8’s innovative exploration technologies. Together, we are enabling faster, more accurate identification of promising natural hydrogen zones.’
Having raised €3.4 million seed capital from Kiko Ventures and Breakthrough Energy Europe earlier this year, GeoVerse then confirmed some of the highest-recorded hydrogen concentrations at its Comminges prospect in the French Pyrenees. Utilising Sercel WiNG DFU-3C sensors, combined with Mantle8’s HOREX multi-physics imaging technology, the first-ever images of an entire active hydrogen system have been produced. ‘These results validate Mantle8’s proprietary exploration technology and reinforce the commercial case for natural hydrogen as a low-cost, low-carbon energy source,’ said Viridien.
The US Department of the Interior is rolling out a long-term schedule for offshore oil and gas lease sales in the Gulf of America and Alaska’s Cook Inlet, as directed by the One Big Beautiful Bill Act.
Some 30 lease sales are in the Gulf of America, which accounts for roughly 14-15% of US crude oil production. ‘These scheduled sales offer the oil and gas sector much-needed clarity and stability, encouraging continued investment in deepwater infrastructure, which is foundational to national energy resilience,’ said the Department in a statement.
At least six lease sales will take place at Cook Inlet, along Alaska’s south-central coast near Anchorage, up to 2032. ‘Alaska’s unique position as both a strategic energy hub and a gateway to the Arctic makes it essential to US energy security. Responsible development in Cook Inlet will help to reduce reliance on foreign imports while supporting the state’s decades-long tradition of powering America with reliable, homegrown energy.’
The first sale under the new law is set for 10 Dec. 2025. The Bureau of Ocean Energy Management will publish the final notice at least 30 days before the sale.
Viridien has launched the processing and imaging phase of the Utsira North multi-client ocean bottom node (OBN) project in the Norwegian North Sea, after the completion of acquisition this summer.
The 513 km2 Utsira North OBN survey is to the east of the Alvheim Field in the Southern Viking Graben and ‘will bring crucial insights into one of Norway’s most strategically important offshore areas, unlocking opportunities for near-field exploration and more efficient extraction of
existing reserves in mature basins’, said Viridien.
Viridien’s imaging teams are applying their seismic imaging workflows, including the latest proprietary time-lag full-wave inversion (TLFWI) technology, to deliver seismic images of the region. As a result, Utsira North OBN will enhance resolution of the region’s complex geological intervals, illuminating how deep-seated faults help to dictate sediment distribution and, in turn, clarifying the presence of reservoir facies and prospective new targets.
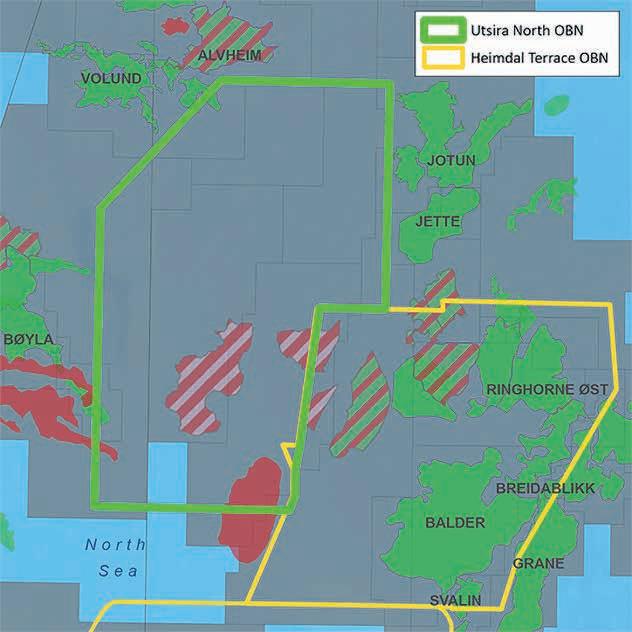
Final imaging results are scheduled for delivery for industry licensing in the third quarter of 2026.
Fugro has completed a site investigation for Ørsted at an offshore wind farm landing site along Victoria’s eastern coastline in Australia. The project featured the first onshore deployment of Fugro’s patented Heat Flow Module (HFM) CPT probe, which measures in-situ thermal properties of the soil alongside traditional CPT data.
The HFM CPT probe was used as part of a wider ground investi-
gation carried out using Fugro’s patented GroundIQ solution, accompanied by various geophysical and geotechnical techniques, which will enable better-informed decisions while planning transmission routes for the future offshore wind development.
Michael Campbell, senior site investigation project manager, EPC from Ørsted, said: ‘Fugro’s
in situ thermal testing solution has cut months off the acquisition time of critical data that otherwise would require extensive testing in a laboratory.
‘The feedback loops have been a game changer enabling extremely efficient progress and ensuring the highest-quality data possible between Fugro remote field teams and our engineers.’
SAExploration has acquired Terrex Seismic, Australia’s leading seismic contractor.
The deal will ‘return SAE to the Australian land market and gives Terrex deep global support to continue its four-decade tradition of innovation and quality in seismic exploration,’ said SAExploration in a statement.
SAExploration added that the deal would give it expanded geographic reach, with a stronger presence in Australia and access to Asia-Pacific growth markets, and complementary expertise, combining SAE’s global marine, land, and transition zone capabilities with Terrex’s specialised onshore experience.
SAE chairman Ken Tubman added that following on from the company’s January 2025 acquisition and integration of inApril, a Norwegian seismic equipment technology company, ‘the addition of Terrex to the SAE family further strengthens SAE’s role as a unique provider in the global market.’
Forrest Burkholder, chief executive officer of SAE, said: ‘This acquisition is a milestone in our continued growth and strengthens our position as a global leader in seismic solutions.’
Rick Dunlop, chief executive officer of Terrex, said: ‘SAE is a seismic acquisition company with industry-leading land, marine, and transition zone operations. We share a very similar culture and values.’
SAE is an oilfield services company offering seismic data acquisition and support services in every part of the world. In addition to the acquisition of 2D, 3D, time-lapse 4D, and multi-component seismic data on land, in transition zones and offshore in depths reaching 3000 m, SAE also provides logistical support services, such as programme design, planning and permitting, camp services and infrastructure, surveying, drilling, environmental assessment and reclamation, and community relations.
Headquartered in Houston, Texas, SAE operates crews around the world for IOCs, NOCs and large independent oil and gas exploration companies.
Founded in 1981, Terrex will continue to operate under its existing name. Headquartered in Brisbane, Australia, Terrex Seismic specialises in onshore seismic data acquisition and is known for its pioneering work in environmentally sensitive areas and challenging terrain.
The number of people working in the US oil and gas extraction industry has dropped by 4000 since the start of the year, according to the US Bureau of Labor Statistics (BLS).
The number of employees in the sector has dropped from 123,100 in January to 119,100 in August. Figures have recorded a month-on-month drop on four occasions so far this year, the data reveals.
The BLS data, which spans from January 1972 to August 2025, showed that the highest oil and gas extraction industry employee figure was in March 1982, at 267,000. By December 2003, this figure had declined to 118,400, then climbed back up above 200,000 to 200,800 in October
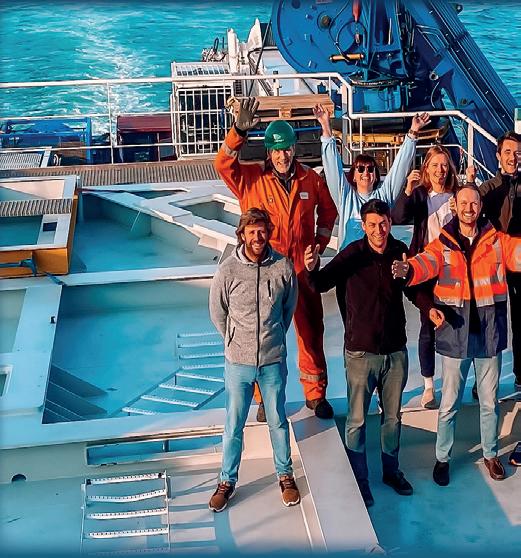
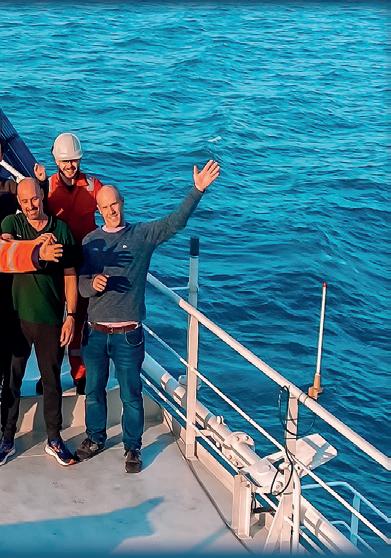
2014. The lowest figure in the data set was seen in January 2022, at 110,800.
The BLS data is taken from the national Current Employment Statistics survey. Each month, the organisation surveys approximately 121,000 businesses and government agencies, representing approximately 631,000 individual worksites, said the BLS.
For the purposes of the survey, the oil and gas extraction sector is comprised of ‘industries in the oil and gas extraction subsector that operate and/or develop oil and gas field properties. Such activities may include exploration for crude petroleum and natural gas; drilling, as well as completing, and equipping wells.’
Aker BP has discovered oil after its Omega Alfa exploration campaign in the area around Yggdrasil in the North Sea, about 180 km from Bergen. Discoveries were made in a total of four wellbores. The overall discovery volume is estimated to between 96 and 134 million barrels of oil equivalent. The objective of the wellbores was to prove and delineate remaining petroleum deposits in five prospects in the Frigg Formation.
The Democratic Republic of the Congo and Chinese oil and gas company Wing Wah have signed a $23 billion hydrocarbon agreement for the integrated development of the Banga Kayo, Holmoni and Cayo permits. It targets increasing output to 200,000 barrels per day (bpd) by 2030. Congo is looking to ramp up cumulative production across the three permits to more than 1.3 billion barrels by 2050.
TotalEnergies (80%, operator) and partner South Atlantic Petroleum (20%), have signed the Production Sharing Contract (PSC) for the PPL 2000 and PPL 2001 exploration licences offshore Nigeria, which were awarded after the 2024 Exploration Round. PPL 2000 and 2001, covering an area of approx. 2000 km2, are located in the prolific West Delta basin. The work program includes drilling one firm exploration well. Equinor has proven more petroleum in the Norwegian Sea. A recent well tested the ‘Smørbukk Midt’ prospect, located between Smørbukk and Smørbukk Sør about 250 km southwest of Brønnøysund. The discovery is estimated to between 6.3 and 18.9 million barrels of recoverable oil equivalent. The well’s primary exploration target was to prove petroleum in Middle Jurassic reservoir rocks in the Ile and Garn formations (the Fangst Group). The secondary target was to collect data in reservoir rocks from the Late Cretaceous (the Lysing Formation). The well encountered a 54 m condensate/light oil column in the Garn Formation in sandstone with moderate-to-good reservoir properties. The reservoir was about 94 m thick. Sixty six metres of gas/ condensate were also proven in the Ile Formation in a sandstone reservoir with moderate-to-good reservoir properties. The reservoir was about 75 m thick. The well was drilled to respective measured and vertical depths of 4991 and 4218 m
below sea level, and was terminated in the Ror Formation in the Middle Jurassic.
bp has signed an agreement to evaluate opportunities for a five-well programme at water depth ranging from 300 to 1500 m in the Mediterranean Sea offshore Egypt. The programme is designed to accelerate the development and production of national gas reserves, with the intent of extending the use of existing production facilities in the West Nile Delta. Drilling operations are expected to start in 2026, with possible tie-back options following evaluation of the drilling campaign and resource potential.
Equinor has struck oil and gas in the Fram area, 9 km north of the Troll field in the North Sea. One exploration well has encountered petroleum in two reservoirs. One of the discoveries consists of both oil and gas, while the other one is just gas. In total, the resources are estimated at between 0.1 and 1.1 million standard cubic metres. The reservoir properties are assessed as moderate-to-very-good. The preliminary name of the discovery is F-South. Licensees are: Equinor (45%), Vår Energi (40%), INPEX Idemitsu (15%).
OKEA has made an oil discovery near the Brage field in the North Sea estimated at 2-7 million barrels in the Cook Formation and 14-26 million barrels in the Statfjord group in the Talisker area. The objective of the well was to prove petroleum in Lower Jurassic reservoir rocks in the Cook Formation and the Statfjord group. The well encountered 25 m of oil in the Cook Formation, in sandstone layers totalling 52.4 m, with moderate reservoir properties. In the Statfjord group, the wellbore encountered 63 m of oil in a total of 171 m of sandstone with moderate-to-good reservoir properties. The oil/water contact was encountered at 2616 m below the sea level. The wellbore was drilled to respective measured and vertical depths of 10,223 m and 2759 m below the sea level. It was terminated in the Lunde Formation in the Upper Triassic.
MOL and O&GD have discovered an oil field at a depth of approximately 2400 m near Galgahévíz, Hungary. The well is capable of producing approximately 1000 barrels of crude oil per day.
Norway had received applications from 20 companies in the Awards in Predefined Areas (APA) 2025 licensing round by the 2 September deadline for applications.
‘It is encouraging to see that there is still significant interest in exploring new acreage in mature areas of the Norwegian Continental Shelf. The interest spans all sea regions, which demonstrates that there
are many opportunities to make profitable discoveries from the south to the north of the shelf’, said Kalmar Ildstad, director of regulations, licence and area management in the Norwegian Offshore Directorate (NOD).
NOD noted that most of the companies active on the Norwegian Continental Shelf (NCS) have submitted applications
for APA 2025, with ‘considerable interest’ in exploration near existing fields and infrastructure.
NOD is evaluating applications, with emphasis on geological comprehension and plans for exploration of the areas. The country aims to award new production licences in the announced areas in early 2026.
Shotaro Nakayama1*, Kotaro Fujita1, Yuji Yamada1, Takuji Mouri2, Yusuke Watanabe2, Philip Armstrong3, Olga Podgornova3, Yuki Maehara3, Manish Lal Khaitan3, Pierre Bettinelli3, Joel Le Calvez3 and Masaru Ichikawa 4
Abstract
As a part of a pilot CCUS project, we acquired walkaway DAS-VSP datasets in a depleted onshore oil field in Japan. Multiple fibre-optic cables were permanently installed in two deviated wells, CCUS-1 and CCUS-2, to enable detailed subsurface delineation and reservoir monitoring during CCUS operations. Despite logistical challenges that resulted in limited and irregular source coverage, the multi-fibre and multi-well walkaway DAS-VSP datasets provided significant insights into the subsurface contexts in the area of interest, aligning with well data and regional geology.
We introduced simultaneous source acquisition to our DAS-VSP survey, which doubled operation productivity and delivered repeatable records comparable to conventional single-fleet acquisition. Data processing involved a joint imaging scheme using multi-well and multi-fibre DAS-VSP datasets, including velocity and anisotropy estimation. For further estimating detailed subsurface properties, elastic full waveform inversion was applied. These acquisition and processing strategies successfully handled the complexities inherent in the recorded datasets.
This study demonstrates that DAS-VSP technology, when combined with modern acquisition and processing techniques, can significantly enhance the understanding of subsurface contexts in the area of interest. This integration offers a promising avenue for effectively managing production and injection activities, thereby advancing CCUS projects even under operational and budgetary constraints.
Introduction
INPEX, jointly with JOGMEC, conducted the carbon capture utilisation and storage (CCUS) pilot project in the depleted oil field, called Minami-aga field, located in Niigata Prefecture, onshore Japan. The main reservoir is comprised of a sequence of tuffaceous sandstone layers with a tilted structure towards the east. The reservoir becomes thinner towards the crest part and pinches out in the western flank. The field has produced oil through a total of 32 producers since 1964; nevertheless, in 2020, production ceased entirely.
We acquired walkaway Vertical Seismic Profiling (VSP) datasets over the Minami-aga field to obtain high resolution borehole seismic images around the injection area for detailed subsurface delineation and to serve as baseline datasets for capturing dynamic behaviours during CCUS operations (Nakayama et al., 2024a). Multiple fibre-optic cables were permanently installed behind casing strings of two deviated wells, called CCUS-1 and CCUS-2, which were used as receivers of walkaway VSP based on the Distributed Acoustic Sensing (DAS) technology.
Although DAS-VSP has been well recognised as an effective reservoir monitoring tool, the acquisition of time-lapse datasets remains costly and operationally demanding. To improve survey efficiency, we implemented simultaneous source acquisition to walkaway DAS-VSP. However, due to logistical and operational constraints imposed by a large river, infrastructures, and paddy fields in the survey area, sources were inevitably distributed along the pseudo-2D walkaway geometry involving substantial gaps and irregularities. These factors complicated the suppression of seismic interference, i.e., the deblending process. Hence, to deal with this situation, predefined temporal and spatial separations among vibrator sweeps, specifically the slip-sweep technique (Rozemond, 1996), were adapted. We then conducted comparative analysis of data from simultaneous source acquisition and conventional single-fleet acquisition in terms of data quality and operation efficiency.
The logistical and operational constraints in the area led to suboptimal source coverage in the recorded DAS-VSP data. As the datasets from the two wells can illuminate the subsurface
* Corresponding author, E-mail: shotaro.nakayama@inpex.co.jp DOI: 10.3997/1365-2397.fb2025073
complementarity, we applied a joint imaging scheme to address deficiencies in the recorded data (Nakayama et al., 2024b). Furthermore, surface seismic data acquired together with DAS-VSP were integrated for velocity modelling and anisotropy estimation. To further estimate detailed subsurface properties, the DAS-VSP datasets were processed with elastic full waveform inversion (eFWI), providing high resolution compressional and shear velocities (Vp and Vs) as well as associated reflectivity images.
In this paper, we first outline the applied configuration for acquiring multi-well and multi-fibre walkaway DAS-VSP datasets followed by detailing the implementation of the simultaneous source technique to walkaway DAS-VSP. We subsequently elaborate the joint processing scheme to derive a single subsurface image from multiple DAS-VSP datasets. We further focus on the application of eFWI to show its ability to delineate the detailed subsurface properties. We demonstrate that the application of several advancements to acquire and process multi-well and multi-fibre walkaway DAS-VSP datasets provided valuable insights into our CCUS project.
CCUS-1 and CCUS-2 were drilled specifically for this pilot CCUS project. Their trajectories are nearly vertical from the surface to shallow intervals, and then deviate westward reaching a maximum inclination of approximately 30 degrees within the reservoir intervals. At the bottom hole depth, the lateral separation between the two wells is approximately 400 m.
To maximise quality and repeatability of DAS-VSP data, fibre-optic cables were permanently installed behind the inter-
mediate and production casing strings in CCUS-1, and only behind the production casing string in CCUS-2 (Figure 1). The two fibre-optic cables in CCUS-1 were connected to a single acquisition unit, while the fibre in CCUS-2 was connected to another acquisition unit. This means that two DAS interrogator units were mobilised to the well site, enabling the simultaneous acquisition of three independent DAS-VSP datasets. In our case, single mode fibres were utilised.
For both CCUS-1 and CCUS-2, careful planning in the well design was undertaken to allow fibre-optic cables behind production casing strings to cover from the overburden, through the reservoir, and even into the underburden. Additionally, trajectories of the two wells are projected onto the same 2D plane as shown in Figure 2. In the completion phase, we adopted the oriented perforation technology, i.e., mapping the cable orientation using a magnetic tool followed by perforating at a specific angle to prevent any damage to the fibre-optic cable. A receiver spacing of 6.3 m along the fibre-optic cables and a gauge length of 17.55 m were selected to balance signal-to-noise ratio (SNR) and vertical resolution. The sampling rate of 0.001 s was selected. The interrogator system used in this project operates with a laser wavelength of 1550 nm and a frequency rate of 20 kHz. Figure 2 shows vibrator points and well trajectories for CCUS-1 and CCUS-2. The two wells lie near the middle of a 7000 m walkaway VSP source line with a nominal vibrator point interval of 20 m. Despite efforts to make the source line parallel to the well trajectories, operational constraints, such as the presence of a large river, infrastructures, and paddy fields, introduced gaps and irregularities in the recorded data (Figure 2).
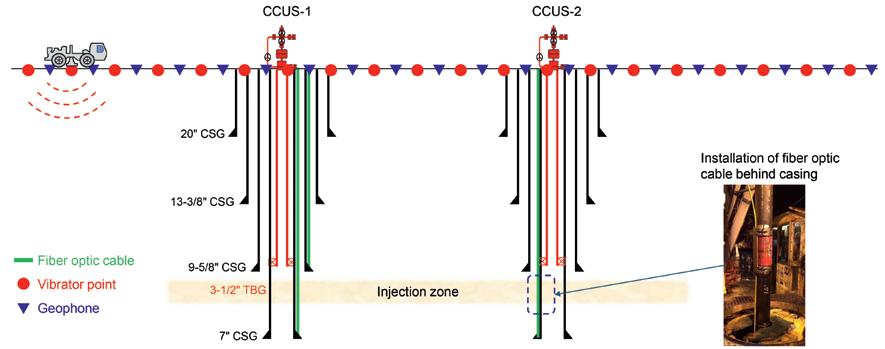
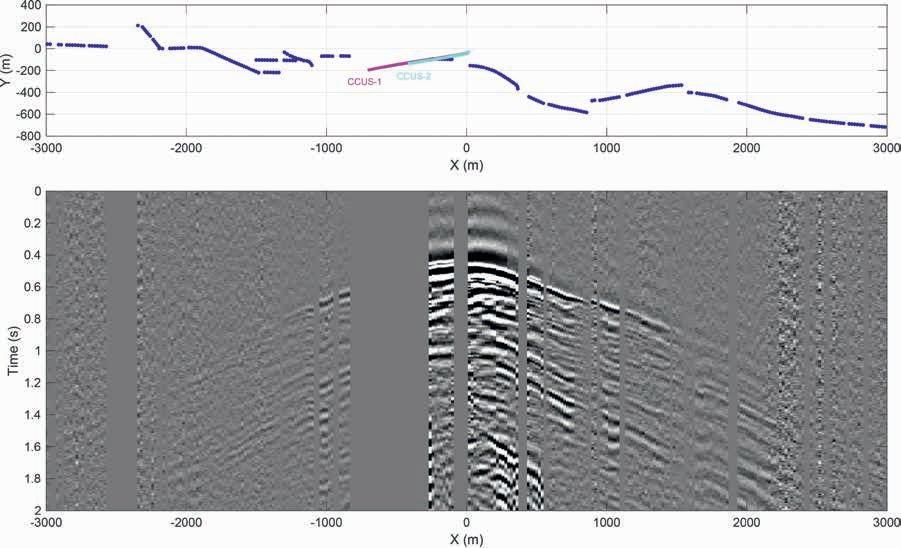
Figure 1 Acquisition setup. Fibre-optic cables are permanently installed behind intermediate and production casing strings in CCUS-1 and behind production casing string in CCUS-2. Three fibre-optic cables were used to acquire walkaway DAS-VSP and jointly used in data processing.
Figure 2 Walkaway VSP geometry and well trajectories (top) and a common receiver gather from CCUS-1 (bottom).
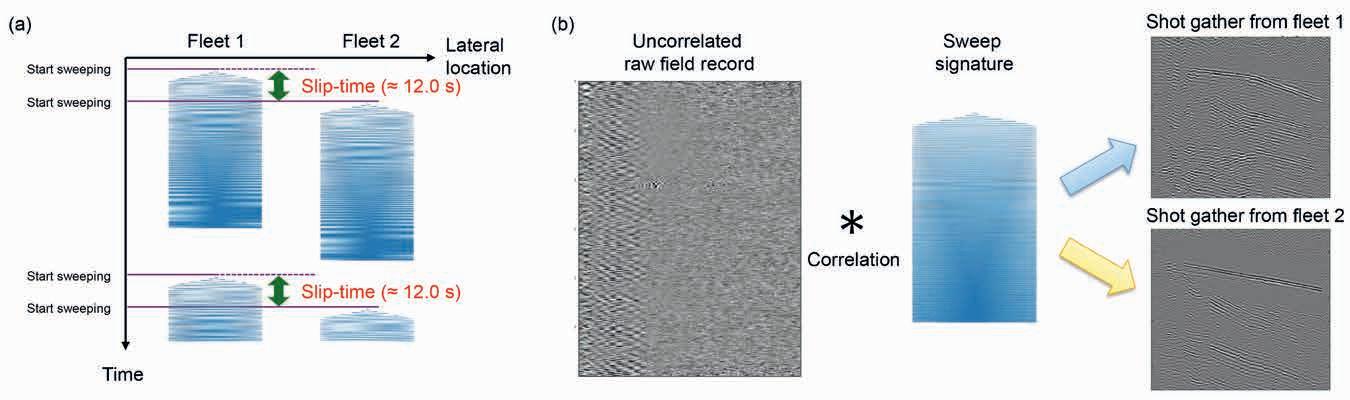
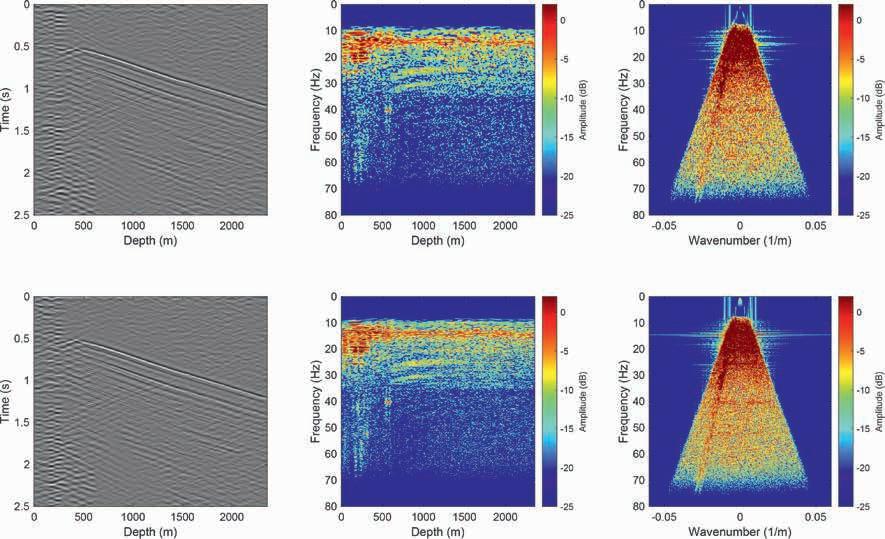
To ensure sufficient source energy penetration through highly heterogenous and unconsolidated near-surface sediments, the survey employed large source efforts, such as vibrator arrays of up to four units, long sweep length, and multiple vertical stacks at each vibrator point. In this survey, we applied a linear-up sweep covering from 6 to 80 Hz with a sweep length of 43 s and a nominal seven vertical stacks. In addition, vibrators with two different sizes, referred to as small vibrator and large vibrator, were used to improve source coverage in spatially variable surface conditions. Under conventional single-fleet acquisition, some vibrators are idle while the others are in operation. Additionally, daily operation hours were further constrained to prevent any conflicts with local communities in the survey area. These factors inevitably make data acquisition time-consuming and costly. Therefore, optimisation of operation efficiency was essential to apply DAS-VSP as a monitoring program in this CCUS project.
Beyond the conventional single-fleet approach, we adopted simultaneous source acquisition using the slip-sweep method (Rozemond, 1996) where multiple fleets sweep concurrently at different locations with pre-determined temporal separation, called slip-time. In our case, two fleets simultaneously operated with a 12.0 s slip-time (Figure 3a). One fleet comprised four
4 DAS-VSP shot gathers from single-fleet acquisition (top) and slip-sweep acquisition (bottom) in the time-depth domain (left), frequency-depth domain, and frequency wavenumber domain (right). These two shot gathers were acquired at the same vibrator point, yet at different times.
small vibrators whereas the other comprised four large vibrators. This configuration kept all vibrators active throughout the slip-sweep acquisition. Simultaneous source acquisition allowed multiple shot gathers to be extracted from a single raw field record (Figure 3b). Although the two sweeps interfered in the raw data, the slip-sweep technique prevents overlap of the source wavefields in the frequency domain. Consequently, no significant interference is observable after correlation and vertical stacking. To maintain the pre-determined slip-time, multiple vibrator fleets need to be synchronised in slip-sweep acquisition. This then ensures no seismic interference among sweeps. One way to avoid this operational burden is to let each source operate independently, accepting that source wavefields overlap in time and frequency, and then to suppress the interference during the subsequent processing step with an inversion-based deblending algorithm. Li et al. (2023), for example, applied this strategy in an offshore 3D DAS-VSP survey. In a 3D geometry, blending noise can be easily made incoherent in at least one of the sorting domains, while the signal of interest still remains coherent, making the inversion process effectively estimate deblended data. For a walkaway geometry, the situation becomes challenging and intricate. In our DAS-VSP survey, the vibrator points lie along a 2D line and contain significant irregularities and gaps imposed by several surface obstructions as shown in Figure 2. This situation certainly hampers the performance of inversion-based
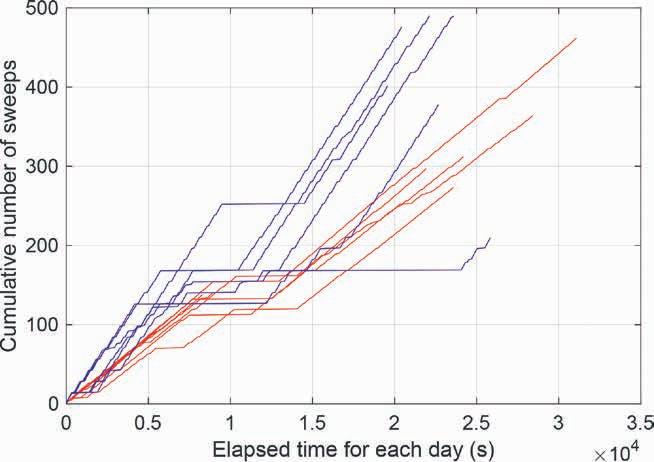
deblending. Krupovnickas et al. (2012) further pointed out that even minor deblending errors may distort time-lapse responses whose amplitudes are generally much weaker than those of primary reflections. In certain cases, slip-sweep acquisition therefore remains attractive as it delivers interference-free records in the field, and its final quality relies far less on the acquisition geometry or on the deblending performance.
Figure 4 compares DAS-VSP shot gathers acquired with conventional single-fleet acquisition and with slip-sweep acquisition, displayed in the time-depth domain, frequency-depth domain, and frequency-wavenumber domain, respectively. Although these two records were acquired at different times during the survey and show some minor variations in background noise level, no discernible differences attributable to the acquisition methods are evident. We examined various shot locations and reached the same conclusion where both conventional and slip-sweep techniques deliver equivalent data quality and repeatability and satisfy our CCUS monitoring objectives. It should be noted that the reduced data quality in the shallow section is primarily attributable to the presence of poorly cemented intervals and multiple casings. Additionally, both coherent and incoherent surface noise further degrade SNR in this zone. Nevertheless, below these sections, the data quality is adequate for imaging the target intervals.
Figure 5 presents daily survey statistics for the single-fleet mode (red curves) and the slip-sweep mode (blue curves). The vertical axis shows the cumulative number of sweeps, while
the horizontal axis shows the elapsed acquisition time for each operating day. The slope of each line is indicative of a direct measure of operational efficiency. The blue curves from slipsweep acquisition are roughly twice as steep as the red curves from the single-fleet acquisition, confirming that the slip-sweep technique doubled DAS-VSP productivity without degrading data quality. Flat segments on both curves indicate intervals when no sweeping occurred due to crew change, equipment maintenance, etc. Nevertheless, these non-operational periods were unrelated to applying the slip-sweep technique. Overall, the demonstrated efficiency gain makes slip-sweep acquisition a compelling option for future monitor surveys.
The quality of recorded DAS-VSP datasets varied from well to well and, within wells, from interval to interval (Figure 6). The dominant noise was fibre ringing caused presumably by suboptimal cable coupling. This noise was less apparent on the production-casing fibre in CCUS-1, and most apparent on the production-casing fibre in CCUS-2. Coupling-related noise was most pronounced at near offsets. Furthermore, as described previously, the presence of unconsolidated and soft near-surface sediments in this region affects the propagation of high-frequency components. For both wells, SNR decreased rapidly with increasing source offset and two-way-time. Figure 7 shows the processing flow comprising the following key steps. Incoherent noise was suppressed in the shot domain such as removal of low-velocity energy in the slowness-time domain followed by median filtering for residual random noise attenuation in the frequency-space domain. Predictive deconvolution further reduced fibre ringing and short period multiple reflections. Prior to imaging, DAS directivity correction (Sayed et al., 2022) was also applied. Each shot gather recorded in strain was converted to particle velocity by scaling with the apparent Vp along the well, estimated through a sparse linear Radon transform. This step relies on the assumption that the effect of gauge length is negligible compared to the P-wave wavelength.
As far offset data show relatively low SNR and the reduced sensitivity to large angle arrivals, first-breaks were picked with confidence on a subset of the records. These high-quality picks were then utilised both to calibrate the velocity model and to estimate vertical transverse-isotropic (VTI) anisotropy at different
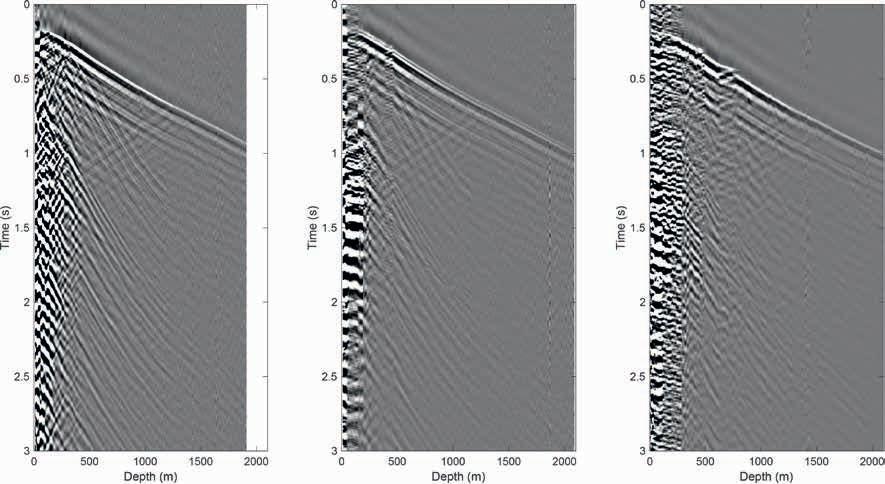
6 Shot gathers after correlation and a vertical stack fold of seven from intermediate-casing fibre
production-casing fibre in CCUS-1 (middle), and production-casing fibre in CCUS-2 (right).
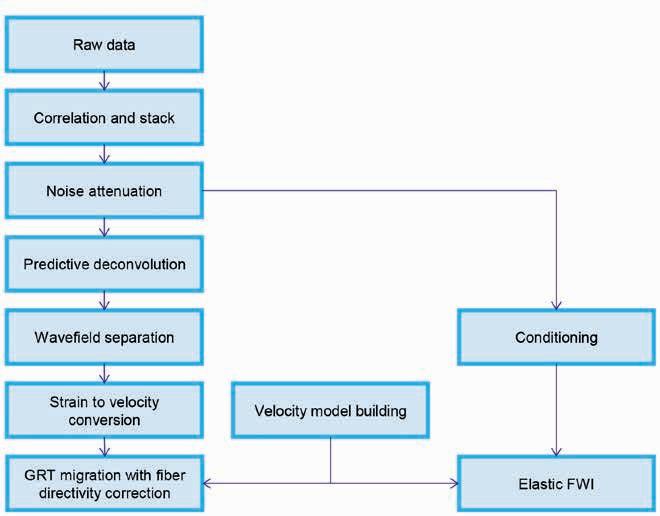
depth levels through the phase-slowness inversion (Miller et al., 1994). Based on fitting to a plot of vertical and horizontal slowness (Figure 8), a Markov Chain Monte Carlo algorithm provides the likelihood of corresponding anisotropy parameters (Horne et al., 2008). Finally, models were updated using a joint tomographic inversion that combined walkaway DAS-VSP datasets with surface seismic data, while honouring subsurface constraints. The applied scheme inverted for Vp and Epsilon to minimise travel time residuals across DAS-VSP datasets acquired in multiple wells and multiple fibres while improving the flatness of surface seismic events (Figure 9). In our case, Delta was assumed to be constant. Final images were produced with ray-based Generalised Radon Transform (GRT) migration (Miller et al. 1987). A
key benefit of the GRT migration is its ability to preserve the incidence angle of every reconstructed P-wave ray at the receiver locations in addition to propagation time. As the arrival angle becomes available from these ray parameters, taking its dot product with a unit vector along the borehole gives the angle, θ, between the incoming wavefront and the fibre axis. This then allows us to derive a 1/cosθ factor and then to incorporate the directivity correction within the migration process. Figure 10 compares a migrated section derived from a single well (CCUS-1 and CCUS-2), with one produced by jointly utilising datasets from three different fibre-optic cables. Although the individual datasets differ in quality, and significant gaps and irregularities are present in the source geometry, the applied joint imaging successfully balanced their amplitudes and coherency. The combined image leads to sharper and more continuous reflectors, a wider imaging area, and improved ties to both wells, demonstrating the value of integrating all available DAS-VSP datasets in a single imaging scheme.
We further conducted a trial of eFWI based on Podgornova et al. (2022). As the forward solver directly simulates DAS responses, i.e., the averaged strain field along the fibre-optic cables, the field records can be fed into the inversion without first converting them to particle velocity. Depending on sensitivity, it updates as many as five 2D medium properties, i.e., Vp, Vs, density, plus two VTI anisotropy coefficients. Several complications arose when applying eFWI to our datasets (Nakayama et al., 2025). Complex surface and near-surface conditions in the area led to spatially
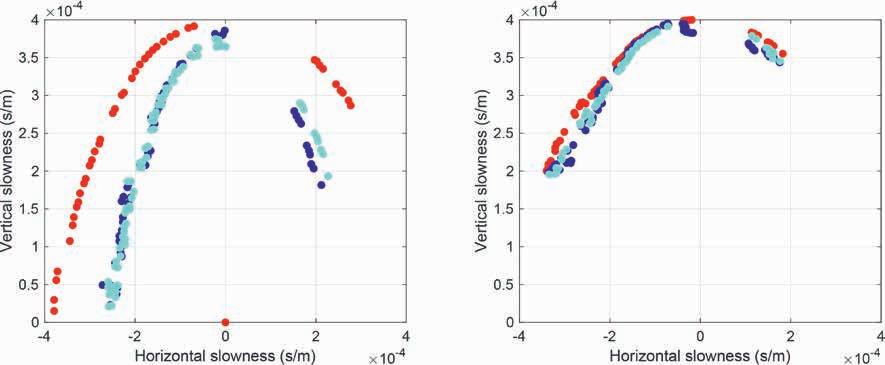
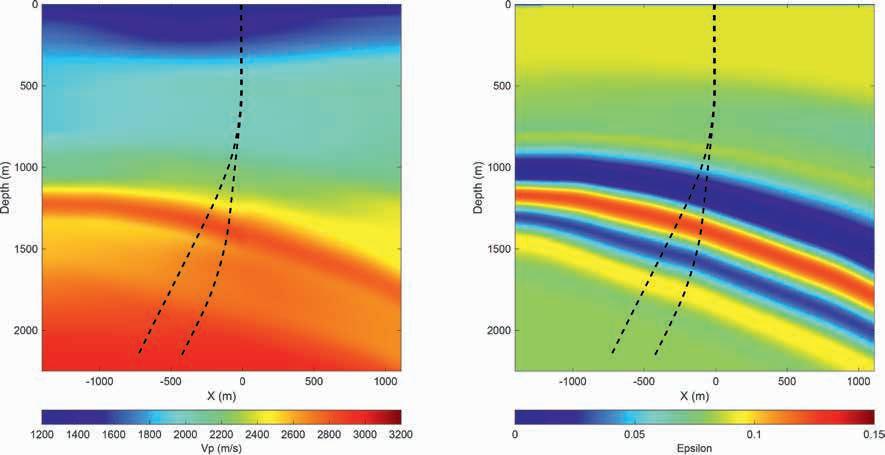
Figure 8 Phase slowness inversion results for two representative depth levels: strong anisotropy at approximately 1340 m depth (left) and weak anisotropy at approximately 1465 m depth (right). Blue, cyan, and red plots represent the picked data, the fit with estimated VTI parameters, and the isotropic case, respectively.
Figure 9 Vp (left) and Epsilon (right) obtained from joint tomography. Two black dashed lines in each figure indicate trajectories of CCUS-1 (left) and CCUS2 (right).
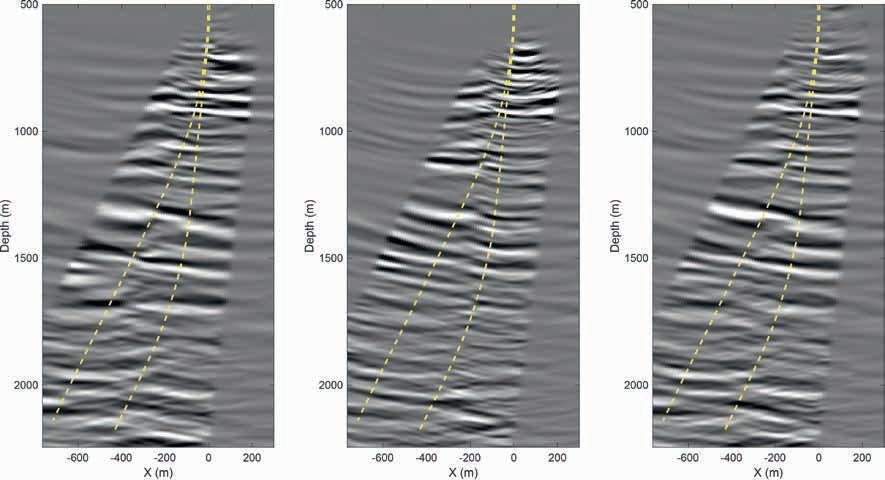
Figure 10 Migrated sections using data from CCUS1(left) and CCUS-2 (middle) and using data from three fibre-optic cables (right). Two yellow dashed lines in each figure indicate trajectories of CCUS-1 (left) and CCUS-2 (right).
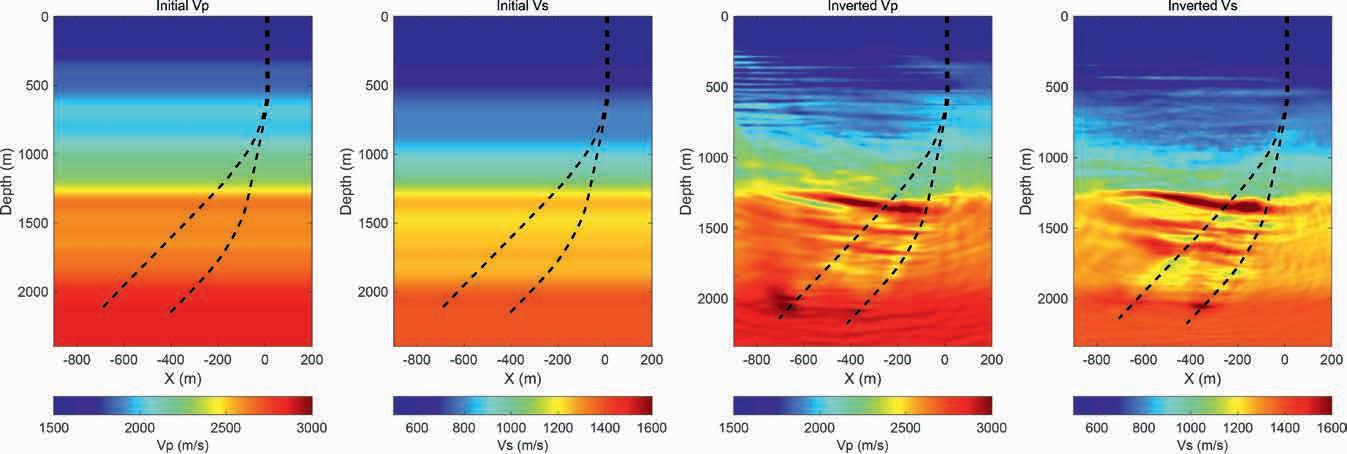
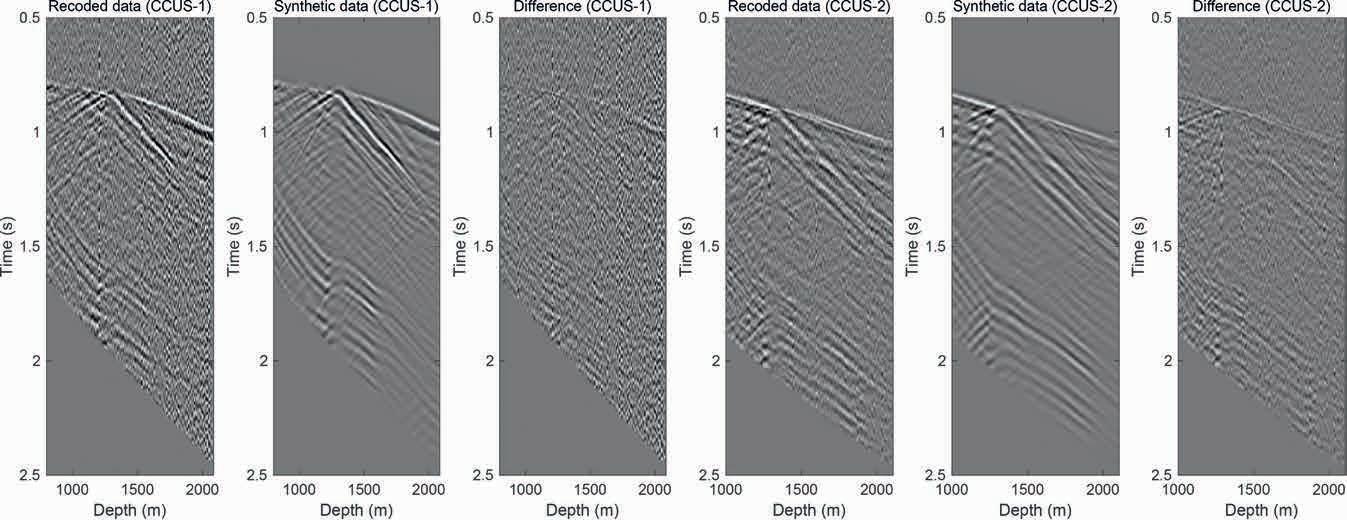
portions and late times for stable inversion.
changing source parameters and coupling. The source wavelet, modelled as a point vertical force, was inverted separately for each vibrator point. As shown in Figure 2, the source line and the two wells do not exactly lie in a single vertical plane. Although the applied eFWI can deal with some out-of-plane effects, we confined the inversion to the western half line and projected the data onto its own 2D plane to ensure the optimum convergence.
Initial models consisted of 1D profiles obtained from heavily smoothed sonic and density logs (Figure 11). This indicates that we let the inversion recover structural and stratigraphic details. eFWI was performed in a multi-scale fashion moving from low to high frequencies, up to 25 Hz. Additionally, only far offset data were used at the early stage to construct the velocity and structure trend. Furthermore, to impose a correlation between Vp and
Vs, parameterising Vp/Vs ratio was also introduced in the early update. Figure 11 shows the final eFWI results obtained by jointly inverting DAS-VSP datasets from CCUS-1 and CCUS-2. The applied algorithm successfully resolved monoclinal structures around our target zone, i.e., the area between the two wells. Although P-wave reflectivity is relatively weak at deeper portions in depth imaging (Figure 10), velocity structures derived from eFWI provided clearer insights. Figure 12 compares observed and synthetic gathers, demonstrating that both P- and S-wavefields were reasonably explained. As a consequence, the residuals were well minimised in both wells. Consistency between the inverted velocities and the well logs confirms the robustness of the inversion results (Figure 13).
After the simultaneous recovery of Vp, Vs, and density, pseudo-reflectivity was derived by computing the point-wise products of velocity and density followed by their vertical derivatives (Figure 14). Although derived entirely from the eFWI models, these sections resemble conventional migrated images and thus facilitate subsurface interpretation. They provided subtle structural and stratigraphic variations around two wells. Because of higher data sensitivity, reflectivity calculated from Vs contains clearer, more stable events than that obtained from Vp. We also conducted eFWI with different setups, such as the use of single
well and shots from the east side, yielding similar outcomes and observations. This confirms the stability of the solution while providing a basis for qualitative uncertainty assessment.
As described previously, this DAS-VSP survey was conducted to serve as a baseline dataset, making time-lapse eFWI a promising future direction. By leveraging the sensitivity of DAS-VSP to both Vp and Vs fields, along with its repeatability, particularly at the receiver side, time-lapse eFWI can provide detailed insights into both static and dynamic subsurface properties in a quantitative manner. Consequently, this approach holds significant potential for enhancing the reliability and applicability of DAS-VSP as an effective monitoring tool in CCUS projects.
As a part of the CCUS pilot project onshore Japan, multi-well and multi-fibre walkaway DAS-VSP datasets were acquired. The slip-sweep technique, a form of simultaneous source acquisition, enabled the acquisition of interference-free DAS-VSP records by imposing a pre-defined temporal separation among vibrator sweeps. Despite pronounced gaps and irregularities in the pseudo-2D source line, this method preserved data fidelity and essentially doubled survey productivity relative to the conventional single-fleet mode. Comparative analyses revealed no discernible
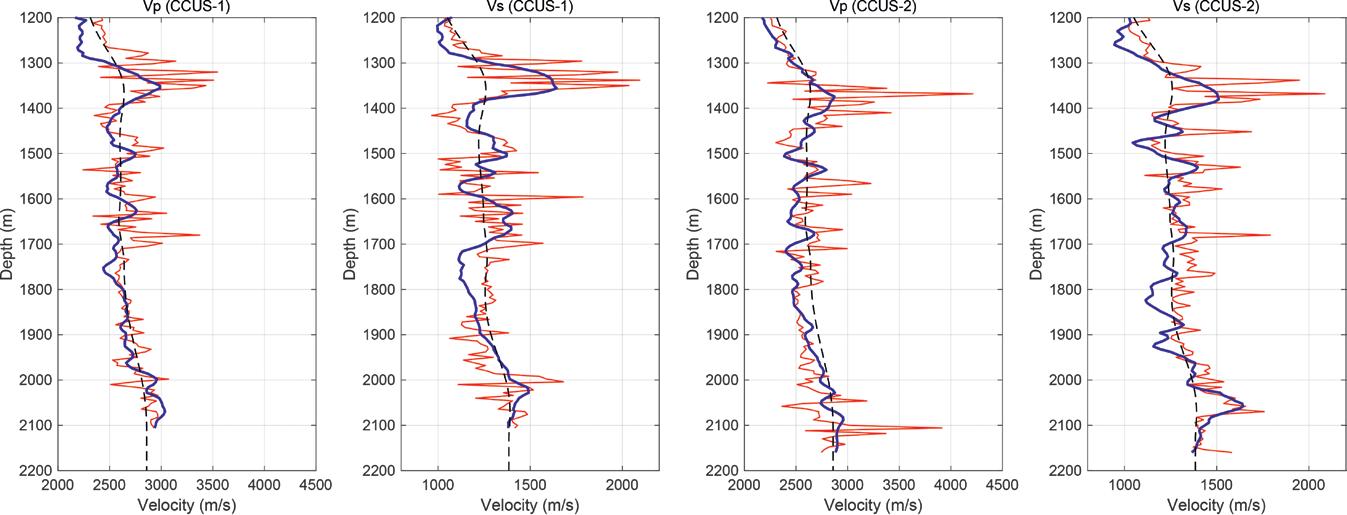
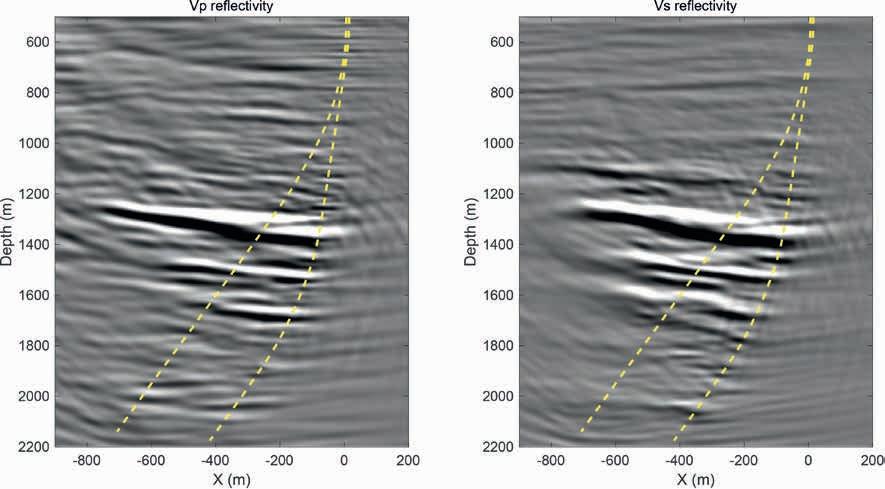
deterioration in signal quality or repeatability attributable to the use of the slip-sweep technique, which is essential for seismic monitoring. Logistical constraints, including a large river, extensive paddy fields, and infrastructure, resulted in suboptimal source coverage in the recorded DAS-VSP datasets. As each well illuminates the subsurface differently, combining datasets from the two wells led to complementary illumination that compensated for deficiencies in the recorded data. Vp and Epsilon models were built through joint tomography that combined both borehole and surface seismic data. Consequently, the final joint imaging attained improved event continuity with balanced amplitudes as compared to the single-well result. Despite various challenges such as simplified 1D initial models, noisy input data, angle-dependent DAS responses, complex survey geometry, and nonlinearity of the inverse problem, eFWI further delineated the subsurface contexts by simultaneously recovering high resolution Vp and Vs fields. The resulting pseudo-reflectivity images, generated through vertical derivatives of velocity-density products, closely resemble conventional migrated sections while providing subtle structural and stratigraphic features. The adopted acquisition and processing schemes can further promote DAS-VSP as an attractive pathway for seismic monitoring by enhancing survey efficiency while attaining high fidelity subsurface imaging. These aspects are crucial for practical applications, particularly for projects with budgetary and operational constraints as well as demanding geophysical requirements.
We would like to express our sincere appreciation to the managements of INPEX Corporation and JOGMEC for their support and permission to publish this work. Special acknowledgement goes to field crews from SLB and JGI for their effort in acquiring the DAS-VSP datasets under highly demanding operational situations.
References
Horne, S., Borland, B., Ali, S., Mercado, G. and Ikawa, H. [2008]. Anisotropic slowness inversion using 3D VSP data. 78th SEG Annual Meeting, Extended Abstracts, 2947-2951. https://library.seg.org/doi/ pdf/10.1190/1.3063958.
Krupovnickas, T., Matson, K., Corcoran, C. and Pascual, R. [2012]. Marine simultaneous source OBS survey suitability for 4D anal-
ysis. 82nd SEG Annual Meeting, Extended Abstracts. https://doi. org/10.1190/segam2012-0815.1.
Li, F., Yu, G., Liu, H., Song, J., Zhang, Y., Chen, Y. and Li, Q. [2023]. The deblending processing of multi-well 3D DAS-VSP data from offshore Abu Dhabi. 84th EAGE Annual Conference & Exhibition, Extended Abstract. https://doi.org/10.3997/2214-4609.2023101431.
Miller, D., Oristaglio, M. and Beylkin, G. [1987]. New slant on seismic imaging: migration and integral geometry. Geophysics, 52(7), 943964. https://doi.org/10.1190/1.1442364.
Miller, D.E., Leaney, S. and Borland, W.H. [1994]. An in-situ estimation of anisotropic elastic moduli for a submarine shale. Journal of Geophysical Research, 99(B11), 21659-21665. https://doi.org/10.1029/ 94JB01849.
Nakayama, S., Fujita, K., Yamada, Y., Mouri, T., Armstrong, P. and Ichikawa, M. [2024a]. Simultaneous Source Acquisition for Multi-Well Walkaway DAS-VSP in a CCUS Demonstration Project Onshore Japan. 85th EAGE Annual Conference & Exhibition, Extended Abstracts. https://doi.org/10.3997/2214-4609. 202410576.
Nakayama, S., Yamada, Y., Mouri, T., Khaitan, M. L. and Armstrong, P. [2024b]. Joint Processing of Multi-Well and Multi-Fiber Walkaway DAS-VSP Datasets from a CCUS Pilot Field Onshore Japan. 85th EAGE Annual Conference & Exhibition, Extended Abstracts. https:// doi.org/10.3997/2214-4609.202410575.
Nakayama, S., Mouri, T., Podgornova, O., Armstrong, P., Khaitan, M.L., Bettinelli, P., Calvez, J.L., Liang, L. and Zeroug, S. [2025]. Elastic Anisotropic FWI for Multi-Well Walk-Away DAS-VSP Datasets in a CCUS Pilot Field Onshore Japan. International Petroleum Technology Conference, Extended Abstracts. https://doi.org/10.2523/ IPTC-24966-EA.
Podgornova, O., Bettinelli, P., Liang, L., Le Calvez, J., Leaney, S., Perez, M. and Soliman, A. [2022]. Full-waveform inversion of fiber-optic VSP data from deviated wells. SPWLA 63rd Annual Logging Symposium. https://doi.org/10.30632/SPWLA-2022-0012.
Rozemond, H.J. [1996]. Slip-sweep acquisition. 66th SEG Annual Meeting, Extended Abstracts, 64-67. https://doi.org/10.1190/1.1826730.
Sayed, A., Khaitan, M.L. and Martinez, A. [2022]. Conditioning Distributed Acoustic Sensing Measurements for Borehole Seismic Imaging. International Petroleum Technology Conference. https:// doi.org/10.2523/IPTC-21944-MS.


EAGE is at the forefront of the energy transitionempowering geoscientists and engineers to drive innovation, share knowledge, and create sustainable solutions for the future of energy.


CARRIE HOLLOWAY


YP and GET CCS Committee member


Being on the committee and presenting each year at the GET conference, as well as representing the EAGE YP Committee, has boosted my confidence and voice in energy transition discussions. As a CCS professional, it has connected me with global experts, inspired collaborations, and strengthened my impact on a sustainable future.


UNLOCK OPPORTUNITIES FOR GROWTH STUDENTS CAN APPLY FOR THEIR FIRST YEAR OF MEMBERSHIP FOR FREE (RE)ACTIVATE YOUR MEMBERSHIP TODAY! SPECIALIZED COMMUNITIES 5 EXPERT-LED COURSES 100 +


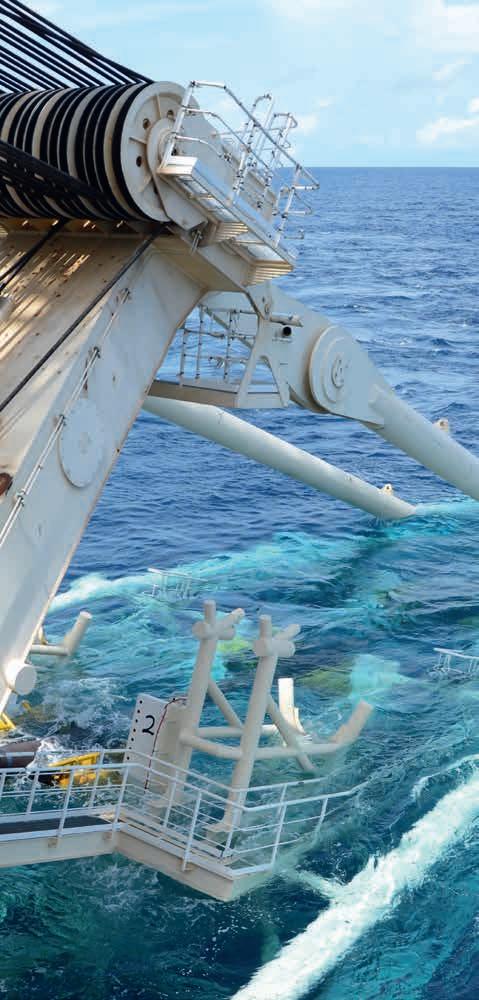
Geoscientists are at the forefront of the developing Energy Transition in areas such as carbon capture, wind projects and geothermal energy.
Anne-Kari Furre et al present field examples (both from CO2 storage and hydrocarbon production monitoring) to illustrate how acquisitions with reduced repeatability can still provide sufficient information if certain requirements are met.
Barbara Cox et al describe the similarities and differences in subsurface investigation technology and strategy between offshore wind and oil and gas projects and present new developments in offshore wind subsurface investigation.
R. Head et al demonstrate a Python interface to consume cone penetration test (CPT) data in Petrel, enabling superior data handling and complex subsurface interpretation to be applied to ground modelling for offshore wind.
Allan McKay et al outline how use of an integrated 3D survey is a viable way to both improve the offshore wind site characterisation process and reduce the overall duration and cost.
Dr Graeme Nicoll et al present an application of geological subsurface screening methods for the exploration of lithium, a critical mineral required for the Energy Transition.
Mike Branston et al review the insights gained from the Net Zero Technical Centre’s Open Innovation project.
Habib Al Khatib et al introduce a seismic surveillance strategy designed to integrate flow model outputs and risk assessment with targeted seismic measurements, shifting the focus from imaging everything to imaging what matters and when it matters.
Rami Niemi et al present a coaxial geothermal system that will contribute to a paradigm shift towards future-proof urban energy systems.
First Break Special Topics are covered by a mix of original articles dealing with case studies and the latest technology. Contributions to a Special Topic in First Break can be sent directly to the editorial office (firstbreak@eage.org). Submissions will be considered for publication by the editor.
It is also possible to submit a Technical Article to First Break. Technical Articles are subject to a peer review process and should be submitted via EAGE’s ScholarOne website: http://mc.manuscriptcentral.com/fb
You can find the First Break author guidelines online at www.firstbreak.org/guidelines.
January Land Seismic
February Digitalization / Machine Learning
March Reservoir Monitoring
April Underground Storage and Passive Seismic
May Global Exploration
June Navigating Change: Geosciences Shaping a Sustainable Transition
July Reservoir Engineering & Geoscience
August Environment, Minerals and Infrastructure
September Modelling / Interpretation
October Energy Transition
November Marine Acquisition
December Data Management and Processing
More Special Topics may be added during the course of the year.
Anne-Kari Furre1*, Sondre Torset1, Yulia Biryaltseva1, Roya Dehghan-Niri1, Harald Westerdahl1 and Per Atle Olsen1 present field examples (both from CO2 storage and hydrocarbon production monitoring) to illustrate how acquisitions with reduced repeatability can still provide sufficient information if certain pre-requirements are met.
Abstract
CO2 monitoring is an important factor in obtaining a licence to explore for and operate commercial-scale CO2 injection projects, and there is presently a drive to identify cost-efficient monitoring strategies to optimise the value of information from the monitoring. In the past, and both for offshore and onshore settings, repeated seismic time-lapse monitoring has typically been used for many CO2 injection projects. However, the cost and complexity of acquiring such data mean that there is a hunt for more cost-efficient solutions. Such seismic solutions might include deploying sparser acquisition geometries, fewer repeat surveys, and relaxing repeatability requirements. In this paper we use field examples (both from CO2 storage and hydrocarbon production monitoring) to illustrate how acquisitions with reduced repeatability can still provide sufficient information if certain pre-requirements are met. We discuss the risks associated with selecting monitoring solutions that are less consistent or less frequent, along with the corresponding consequences, focusing primarily on aspects of sparseness (spatial as well as temporal) and repeatability.
Introduction
CCS (Carbon Capture and Storage) is regarded as an important tool for mitigating climate change, both because switching to renewable energy sources is not adequate to reach international goals of atmospheric CO2 reduction, and because of the need to reduce the carbon footprint from hard to abate industries (IPCC 2023). However, because CCS is a marginal business there is strong focus on cost efficiency. Monitoring of the injected CO2 to assure that it stays safely stored in the subsurface is an important prerequisite for obtaining a licence to operate and constitutes a non-negligible part of both capital investment costs and (in particular) the operational costs of CO2 storage projects.
The developing legislation around the world usually includes dedicated requirements to storage site monitoring, where operators typically are required to monitor both the migration of the CO2 within the storage complex (conformance and containment monitoring), but also to detect potential leakages out of the storage complex (monitoring potential non-containment), and
1 Equinor ASA
* Corresponding author, E-mail: akafu@equinor.com
DOI: 10.3997/1365-2397.fb2025074
finally, if necessary, the effect of mitigating measures (contingency monitoring). In addition to the above, monitoring is also important for adding value to a project, through identifying potential new opportunities within the storage site and optimising injection management. Operators are generally free to select the monitoring strategy they find most adequate, in agreement with the regulators.
In this paper we will focus on seismic monitoring, which can come in many forms with corresponding costs and benefits. We will discuss how choices made for the monitoring programme will influence the value of information coming out of it and identify the potential risks that an operator needs to accept if going for sparser monitoring systems, and how this might influence repeatability.
Risk is defined as the probability of an event to happen multiplied with the consequences of the event. Storage sites are selected with the aim of minimising risk of leakage. Sparser monitoring, or less frequent repeats, might mean that in the unlikely case of a leakage, the migration of CO2 might go undetected for some time. In contrast, a denser monitoring programme would likely identify leakage more quickly, allowing for mitigating measures preventing CO2 from migrating out of the storage complex. These risks should be addressed in relation to the overall risks that need to be assessed for CO2 storage projects (European Commission 2024): 1) the risk of local impacts of potential CO2 leakage to human health and the environment, which will generally have small environmental consequences (Torsæter et al. 2024) and 2) the global risks of releasing CO2 into the atmosphere, which among others has consequences for climate-related illnesses, involuntary migration and violent conflict (IPCC 2023). Note that status quo in the world today (with minimal CO2 storage) is that the latter risk is dominating.
There is also a risk related to over-designing monitoring projects. If storage projects need to plan for monitoring for any situation with risk for containment and conformance breaches, however insignificant that risk may be, this will significantly impact the economics of some projects. Consequently, we will see some storage resources not being utilised, and, in time, corresponding lack of reduction of CO2 emissions.
We will especially discuss two factors affecting seismic interpretation confidence, namely monitoring sparseness (spatial and temporal) and seismic repeatability.
CO2 storage projects come with a wide variety of geological settings and risk profiles. As of today, the main storage settings are sedimentary formations, either saline aquifers or depleted hydrocarbon reservoirs, or mafic rock formations, such as basalts. Additionally, projects using CO2 injection for enhanced oil recovery involve the permanent storage of a portion of the injected CO2. The monitoring strategy should be risk-based and tailored to the specific site in question.
Seismic is regarded as an excellent tool both for conformance and containment monitoring for saline aquifers and depleted oil reservoirs. It is less suited for conformance monitoring of depleted gas reservoirs, because the contrast between in-situ hydrocarbon gas and CO2 will often be too small to be detectable. However, for containment monitoring, seismic would still be a useful tool also for depleted gas fields, proving that there is no leakage of CO2 or natural gas from the storage site (or detecting such leakage if necessary). Seismic monitoring is also not regarded useful for basalt storage monitoring, because the mineralisation process is not expected to give detectable changes in seismic properties.
As for most monitoring systems, seismic monitoring offers flexibility in terms of what technology to use, how often to use it, and how densely it is deployed. Tests have been conducted for both seismic sources and receivers being installed permanently in the ground or in wells, or deployed on a temporary basis. Seismic sensors might be covering the storage site densely (typically with 3D acquisitions), or sparsely (e.g. 2D, DAS-VSP, spot configurations). A sparse monitor configuration typically would have to focus on pre-identified areas where the operator needs more information for optimising the injection programme, or areas where there is a pre-conceived risk of leakage, ground water contamination, or structural instability.
In most existing and planned CO2 storage projects, timelapse seismic monitoring has been a crucial component because seismic monitoring can identify subsurface changes with a higher degree of confidence than alternative methods (eg, gravity and resistivity). Offshore, and occasionally onshore, 4D time-lapse seismic acquisitions have often been employed (Hansen et al. 2013, Wipki et al. 2016, Roach et al. 2017, Tanase et al. 2021, Furre et al. 2024).
The advantage of 4D time-lapse seismic is the usually good coverage of the subsurface, whereas major drawbacks are cost, and the fact that these are temporal and not continuous measurements. Although repeated 3D monitoring has in the past often been considered the gold standard for monitoring CO2 storage sites, it will not always be proportional to the benefit of the information gained.
We are seeing lighter, more nimble systems being proposed, both onshore and offshore (Harvey et al. 2022, Ollivier et al. 2023, Zhao and Curtis 2025). These lighter systems typically focus on near-well monitoring for the early injection phase (when the CO2 plume is still relatively confined), and sparse monitoring layouts based on modelled CO2 plume migration, focusing on proving conformance at a later stage (Pevzner et al 2021, Shimizu et al 2023).
One of the most important factors influencing the choice of monitoring system (seismic and elsewise) is whether the injection site is located onshore or offshore. There are usually stricter limitations on area access onshore, due to denser population patterns, more pre-existing infrastructure and limitations related to protected areas. Offshore seismic acquisitions on the other hand often require large-scale mobilisations with complex logistics, and might likewise face limitations related to protected areas, such as fishing, marine traffic and surface obstructions.
Already prior to injection start, choices will need to be made with respect to the seismic baseline. Operators might be faced with determining whether a legacy seismic survey is good enough for both reservoir characterisation (3D) and as a baseline for timelapse monitoring, or whether a dedicated new seismic survey will need to be acquired. They will need to make this choice based on a site-specific assessment of risk and potential consequences of leakage, and of whether such leakage could be detected. In addition to monitoring consideration a new seismic acquisition might also be necessary for pre-injection reservoir characterisation for optimising storage strategy and well placement.
When acquiring a repeat survey, we traditionally aim to replicate the original seismic experiment as closely to the original baseline as possible. This approach helps to minimise noise and ensure more accurate comparisons. Achieving good repeatability might, however, not always be possible. Both changed land use (especially onshore), or the development of more cost-effective acquisition technologies are examples of where the seismic experiment might not be perfectly repeated. This raises an important discussion about the necessity of good repeatability and the implications of its absence. It is important that operators and regulators fully understand the risks and consequences of using non-optimal data.
In this paper we will use subsets of comprehensive seismic time-lapse datasets from both CO2 and hydrocarbon monitoring to demonstrate the consequences of using sparser or non-optimal seismic repeats for CO2 injection monitoring.
Equinor has experience with seismic monitoring of CO2 injection at both the Sleipner and Snøhvit fields. While both fields are located offshore, their settings are quite different and nicely illustrate different aspects of requirements to repeated surveys. Table 1 shows important facts about both fields.
At the Sleipner field we have access to a series of repeated seismic surveys. The original seismic baseline was acquired
for exploration purposes of deeper targets. It was therefore not optimised for the Sleipner injection depth (800-1000 m). Ten of the repeats are conventional 3D seismic, albeit with slightly varying acquisition parameters (Furre et al. 2024). All the repeats have been matched to the baseline survey. In addition, several other seismic data acquisitions have been conducted over the area, such as high resolution 2D and 3D, and ocean bottom nodes (Dehghan-Niri et al. 2024, David et al. 2024).
It was in 2022 that an extended high resolution seismic mini-streamer dataset was acquired over the whole CO2 plume, and a repeatability test was conducted at the same time, with the repeated survey acquired only days after the main survey (Dehghan-Niri et al. 2024). The purpose behind this dataset was to investigate whether a lighter and simpler system would be sufficient for monitoring the CO2 at this depth.
The general seismic repeatability at the site is fairly poor (Figure 1). Nevertheless, because the injection site is located relatively shallow, and the reservoir properties are exceptionally good (Table 1), there has never been any problem with observing the injected CO2. Note that the repeatability of the mini-streamer tests (cable length 150 m) is comparable to the conventional streamers (cable length 3000 m and above) (Figure 1).
Figure 2 shows a comparison between interpreting the CO2 plume extent on a 4D difference volume (Figure 2b) and the 3D repeat volume (Figure 2c), respectively. When comparing to the baseline (Figure 2a), it is clear that the CO2 plume extent can be interpreted directly on the 3D repeat, without the need to create a 4D volume. This is confirmed by the corresponding map view extractions of the top CO2 plume layer (Figure 2e, 2f), in which the effects were automatically extracted, and then visualised, using seismic tiles (Skjæveland and Torset, 2023). Clearly, the interpreted CO2 plume extents are very similar between the two.
The impact of this is that the interpretation of the CO2 plume extent on Sleipner can be treated similarly to how gas anomalies are treated in exploration, where the strong 3D amplitude indicates the CO2 plume, and we do not technically need good repeatability, if the individual vintages are of sufficient quality to detect the CO2 response.
CO2 plume monitoring at Snøhvit
Figure 3a shows the baseline vintage from Snøhvit. The dedicated monitor survey is shown in Figure 3b, with the corresponding 4D difference in Figure 3c. These datasets have been matched through dedicated time-lapse processing. Notice how the imprint of the CO2 is much less obvious on the repeat section (Figure 3b) than on the Sleipner cubes, but still the lateral extent of the CO2 plume is visible on the 4D difference (Figure 3c).
To mimic poor repeatability, a monitor cube from a different processing sequence (not dedicated to high time-lapse repeatability) was instead taken as the monitor in Figure 3d. The strongest imprint of the CO2 plume close to the well (highlighted by the white arrow) is still visible on this monitor, however subtle. Looking at the 4D difference (Figure 3e) between this non-ideal monitor and the baseline, the strongest part of the CO2 plume is visible, but the image is influenced by noise, making the lateral extent much harder to interpret. On Snøhvit (in contrast
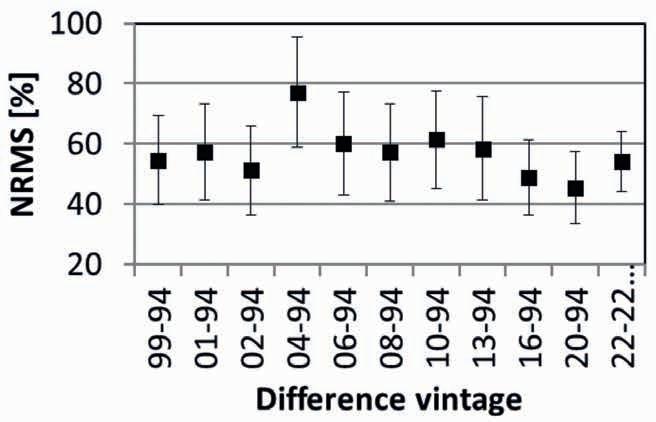
Figure 1 Normalised Root-Mean-Square (NRMS) as function of repeated acquisitions. The NRMS [squares with error bars representing one standard deviation) was calculated over an area covering a 300 ms interval in the overburden, unaffected by CO2.The ‘22-22’ difference corresponds to the ministreamer repeatability test.
to Sleipner), it is therefore clear that sufficient repeatability is a premise for interpreting the CO2 plume extent.
As discussed above, the conditions at the Sleipner injection site makes it a good example of a site where the requirements for high repeatability may be relaxed for conformance monitoring. Sleipner does, however, due to its complex overburden, also illustrate another important factor, namely the need for acquiring an adequate baseline. From seismic data, the overburden at Sleipner is populated with isolated strong amplitude anomalies. These have been mapped in abundance on seismic data acquired prior to injection start and have been interpreted as shallow gas pockets, potentially fed by palaeo-chimneys (Nicoll 2011, Karstens and Berndt 2015). There has been some debate as to whether fluid flow along such chimneys might represent a pressure transfer mechanism (Karstens and Berndt 2015).
The repeated seismic surveys at Sleipner have mostly been acquired to optimise repeatability. However, all surveys are to a smaller or larger degree non-optimal because the seismic baseline was acquired to map the deeper hydrocarbon reservoir. In particular the 2004 survey has considerably poorer repeatability than the others (Figure 1) because the acquisition direction of this survey was perpendicular to the baseline. This has obviously strongly affected the repeatability.
This poorer repeatability has an impact on how the overburden anomalies are illuminated. Figure 4 shows an example of a strong overburden anomaly (black arrows) illuminated by a series of seismic surveys. The anomaly was present already in the baseline and can be clearly observed in all subsequent surveys including the high frequency mini-streamer dataset from 2022 and the conventional repeats from 2004 and 2020 (Figure 4a, b, c, d). Note also how the datasets are contaminated with multiple noise below the strong overburden anomaly (white arrows), and how this to a certain degree obscures the underlying reflectors.
The two time-lapse differences also shown in the figure illustrate the problem with non-repeatable strong amplitude signals. The 2004-1994 difference (Figure 4e) is contaminated with remnant energy at the location of the amplitude anomaly,
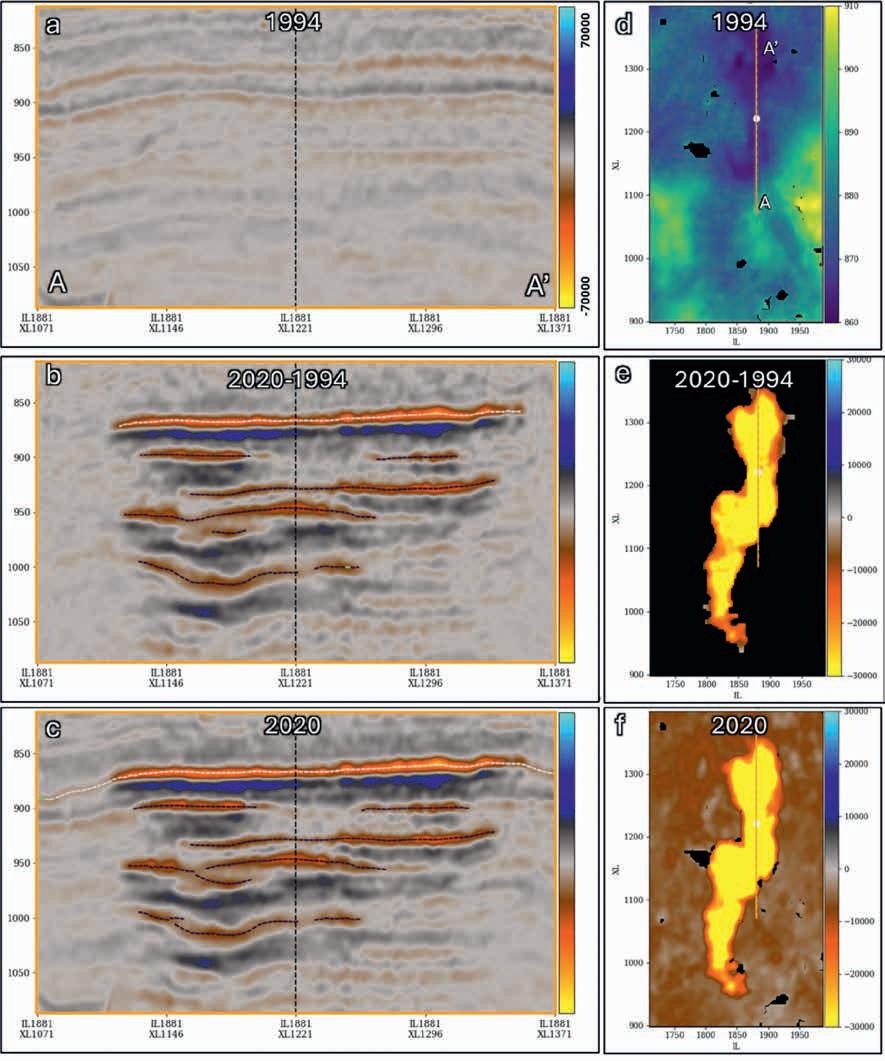
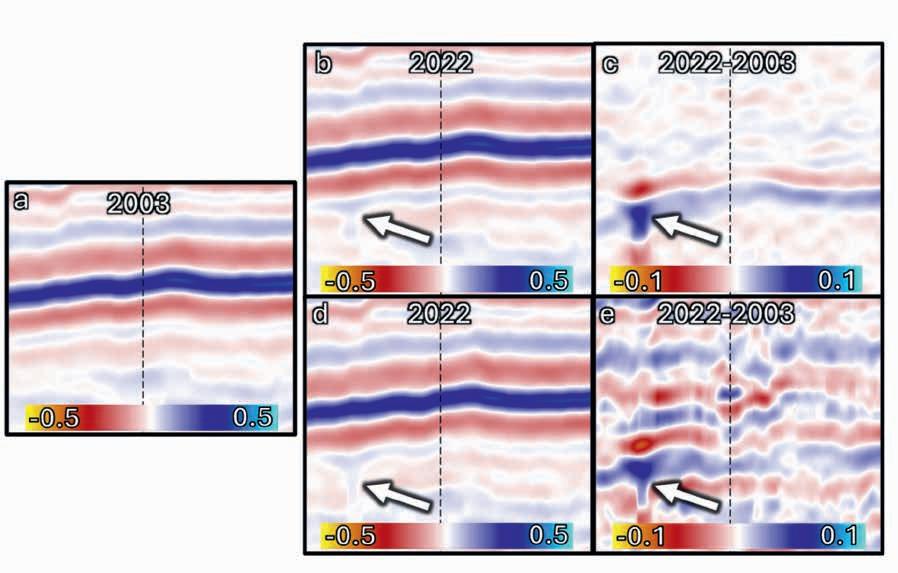
with a signal strength comparable to the primaries (black arrow). Without further context, such an observation could trigger concerns about storage integrity. However, due to the identification of the remnant energy on the baseline, the reduced repeatability impacting the 4D cube can be navigated during the interpretation step. The long series of repeated surveys at Sleipner are assurance that indeed there are no indications of CO2 migrating up into this location (as confirmed in Figure 4f). However, in a case with
Figure 2 Sleipner time-lapse seismic results. a: Seismic baseline section (1994), b: Difference section (2020-1994), with 19 Mt CO2 in the storage unit, c: Repeat section (2020), d: Map of top storage unit based on the 1994 seismic baseline e: Map extracted of the top of the CO2 plume from the 2020-1994 difference section (in b), f: Map extracted of the top of the CO2 plume from the 2020 repeat section (in c).
Figure 3 Snøhvit time-lapse seismic results. a: Seismic baseline section (2003), b: Time-lapse processed repeat section (2022), with approximately 2.4 Mt CO2 injected in this location, c: Time-lapse processed difference section between b and a, d: Non-time-lapse processed repeat section (2022), e: Non-dedicated difference section between e and a.
fewer acquisitions, this might not be the case, and such an observation might trigger other investigations. If the seismic baseline consisted of more limited data (e.g. a set of 2D lines), many of the overburden anomalies at Sleipner might either not be detected on the baseline or be wrongly migrated into the seismic sections. The high-resolution short cable mini-streamer data that were acquired in 2022 are doing a good job of identifying both the CO2 plume and the overburden anomaly. In the case of shallow
injection depths, or for overburden monitoring mini-streamer seismic acquisition could be a more cost-efficient alternative to acquiring a full conventional repeat.
As shown above, differences in acquisition will affect survey repeatability and could therefore subsequently decrease the reliability of detection of time-lapse changes and their interpretation. Understanding the associated risks and having a clear strategy for processing seismic data in advance, to produce the most accurate monitoring result is important. In the next example we focus on how acquisition differences can create a false 4D signal in the case of multi-vintage monitoring. One of the ways to mitigate this is during processing at the 4D binning stage; an important stage selecting the most repeatable traces between vintages.
This example is relevant for fields with more than two monitors, for example on previously depleted fields, with at least one survey having a different acquisition spread. Differences in acquisition spread width will result in near and outer cables from different surveys contributing to the same offset ranges and decreasing repeatability.
As with acquisition, processing for CCS often has strict budget constraints. Therefore, options for minimising scope of work and reutilising previously processed data from input to migration, instead of full reprocessing of vintage data, can be considered. The general recommendation is to always use a 4D specific processing workflow, including 4D binning, to select the most similar traces for comparisons. There are several approaches to 4D binning in case of the multi-vintage monitoring program, and in this article, we will focus on cascaded and simultaneous binning, as discussed
below. In some cases, the transfer function approach can also be considered, but will not be discussed further in this article.
The two approaches of the 4D binning processing step for a case of multiple vintages with varying acquisition geometry are cascaded binning and simultaneous binning, respectively (Figure 5). They have different goals, where cascaded binning provides best repeatability within selected similar geometries, and simultaneous binning equalises repeatability between all vintages. Cascaded binning focuses on producing the best repeatability for selected acquisition configurations – for example, the more comprehensive acquisition with wide and dense spread. In simultaneous binning all surveys are binned simultaneously, forcing selection of the more similarly placed traces along the whole comparison set, even if it means degrading more superior seismic surveys to sparser ones (Figure 5).
We show examples of both the above binning methods run on Gullfaks, a mature oil and gas field in the North Sea that has an established long-term time-lapse seismic monitoring program. The monitoring program has ten different vintages, with varying numbers of streamers in the spread, but for simplicity, in this paper we focus only on four vintages.
One survey (vintage 1) had a narrower receiver spread of 500 m with 100 m separation, while the three others (vintages 2-4) had a wider and denser spread of 800 m, with 50 m separation between cables (Figure 6). All surveys were acquired on the same (narrower) pre-plot, such that the surveys with a wider spread would have outer cables significantly overlapping between the neighbouring sail-lines. This might impact the 4D binning step such that during cascaded binning the outer cables are selected in step one for vintages 2-4 over the inner cables of vintage 1, thus, increasing the differences.
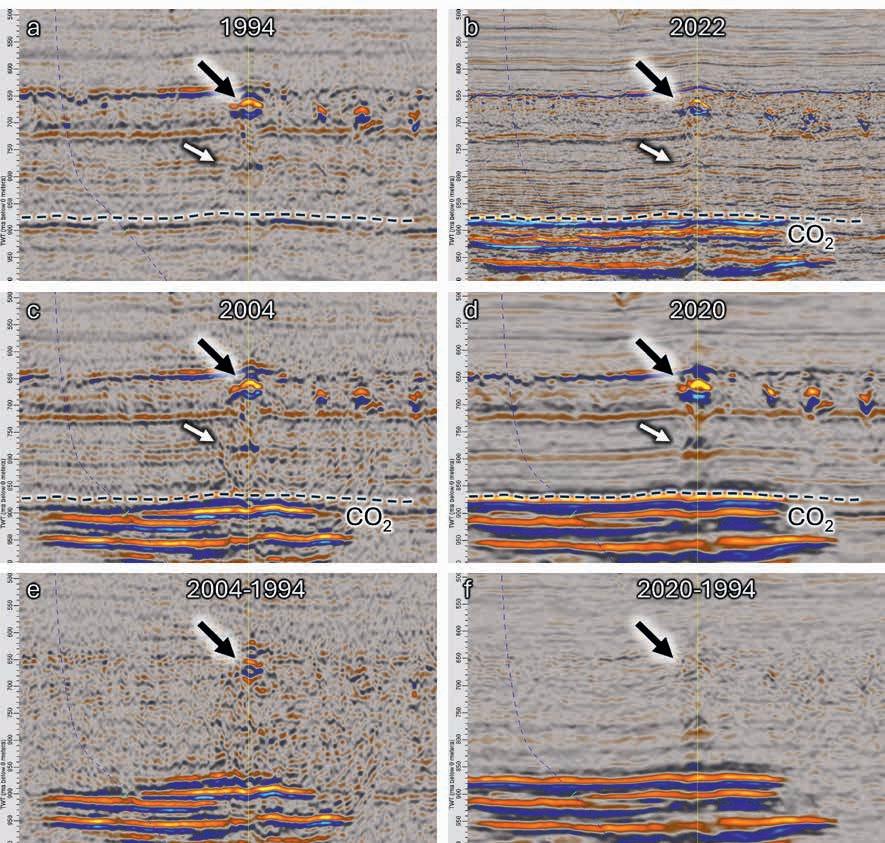
Figure 4 Sleipner overburden anomaly. a) 1994 baseline with Top Utsira reflection (dashed line), overburden anomaly (black arrow) with first seabed multiple (white arrow) b) High frequency ministreamer data acquired in 2022 with CO2 plume, c) 2004 repeat, d) 2020 repeat, e) 2004-1994 difference (Figure c-a), f) 2020-1994 difference (with time-lapse processed baseline not shown in this Figure).
The cascaded binning had two steps. In the first step it used vintages 2-4 with the wider spread and selected the closest shot-receiver pairs along these three surveys per bin. In the next step, the narrower survey (vintage 1) was added, and the best co-located traces were selected against the already binned, representative survey from step 1. This approach will preserve optimal illumination, imaging and repeatability (low NRMS, cleaner 4D difference) on the best repeated vintages (2-4), while increasing differences between those and vintage no 1. In some geological conditions this might lead to creating a false artificial signal. This is why it is recommended to instead run 4D binning with all surveys at the same time using simultaneous binning.
Simultaneous binning on the other hand will degrade repeatability between the wider spreads (vintages 2-4) compared to cascaded binning, while improving repeatability between vintage 1 and vintages 2-4. This approach is recommended if all surveys are included in the seismic processing for time-lapse monitoring, and both 4D comparisons using the vintage(s) with narrower and wider spreads are of interest. This would require full reprocessing of existing surveys together with the narrower spread and thus might potentially be a somewhat more costly processing alternative.
Figure 7 compares results for the two binning approaches using far stacks of vintages 1 and 2, respectively, for demonstration. Cascaded binning better preserves illumination and honours smaller details of the event within the yellow ellipse for vintage 2 (Figure 7a), while the same event becomes less resolved and more like the narrower acquisition of vintage 1 when using simultaneous
binning (Figure 7b). Note for vintage 1 how the same event looks quite similar for both cascaded (Figure 7c) and simultaneous (Figure 7d) binning. When taking time-lapse differences, this leads to creation of an artificial (non-real) 4D signal for the cascaded binning difference (Figure 7e), in contrast to the more correct simultaneous binning difference in Figure 7f. For CO2 monitoring, an outcome like the one in Figure 7e could create a ‘false alarm’ and reputational damage, and at the very least require extra effort to understand and analyse the false 4D signal. In such a case it might be worth it to employ the simultaneous binning approach; although somewhat more costly, processing has much lesser financial impact than acquisition choices typically have.
There are probably several reasons behind the difference between the time-lapse results for Sleipner and Snøhvit. Two important factors contributing are the difference in porosity and depth between the sites. The Utsira Fm. at Sleipner consists of a very unconsolidated sandstone with high porosity, whereas the Stø Fm. at Snøhvit is well consolidated and has lower porosity (Table 1). This means that fluid replacement will have a stronger effect at Sleipner than at Snøhvit. In addition, the depth difference between the sites leads to a strong difference in fluid properties. At Sleipner (800-1000 m depth) the CO2 is in a very light supercritical state, whereas at Snøhvit (2300-2700 m) it is much denser, leading to higher acoustic impedance, and a smaller contrast to the original, brine-saturated rock.
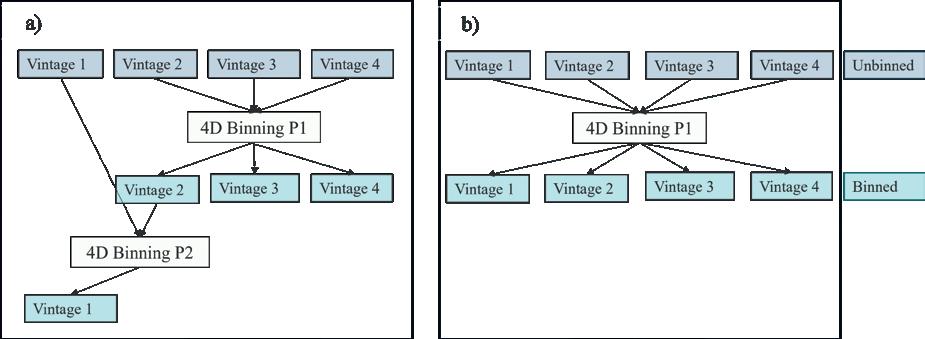
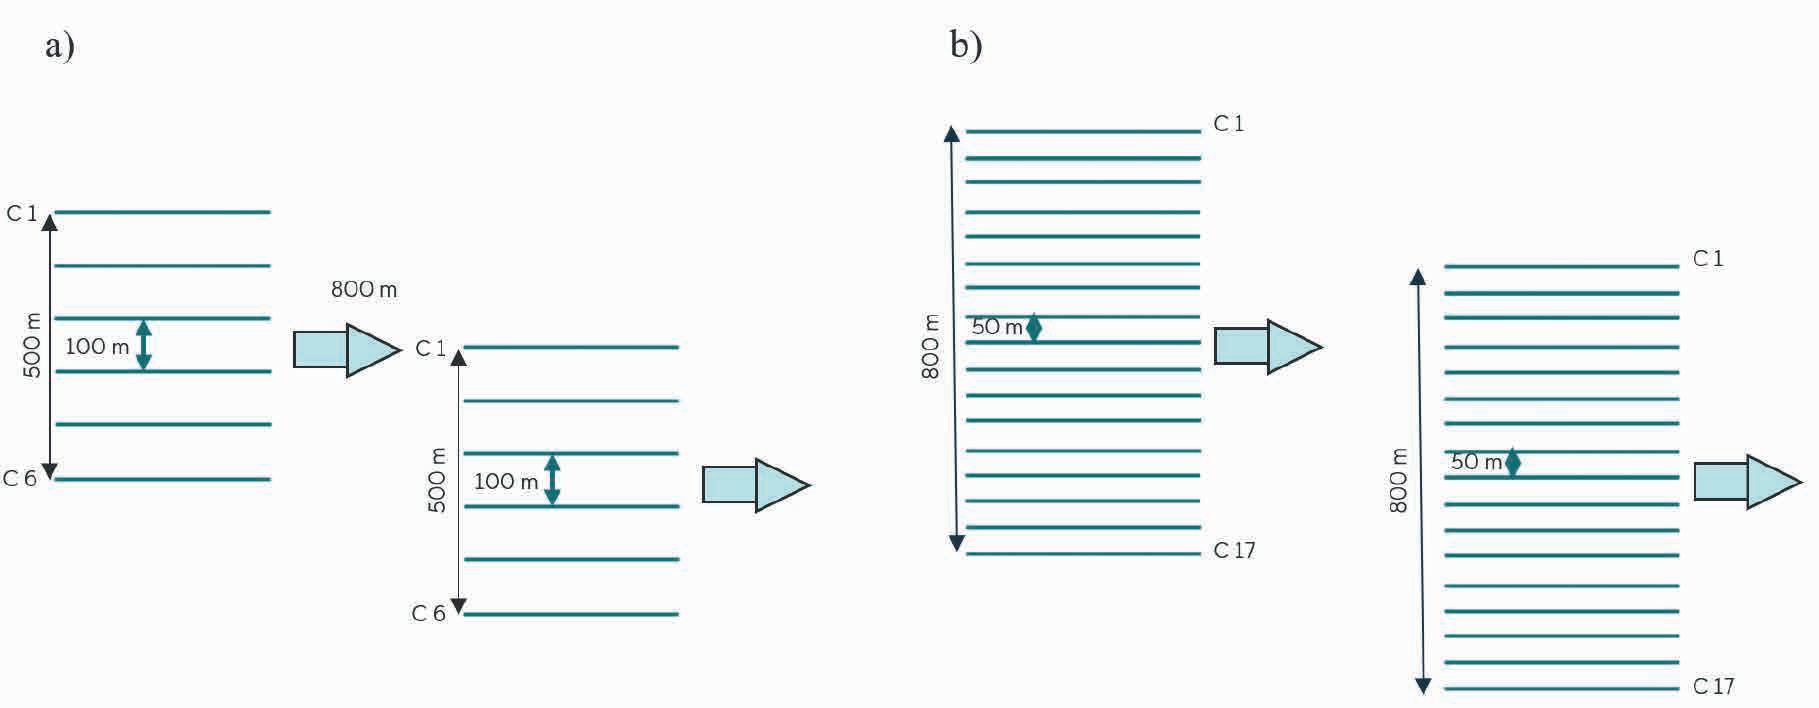
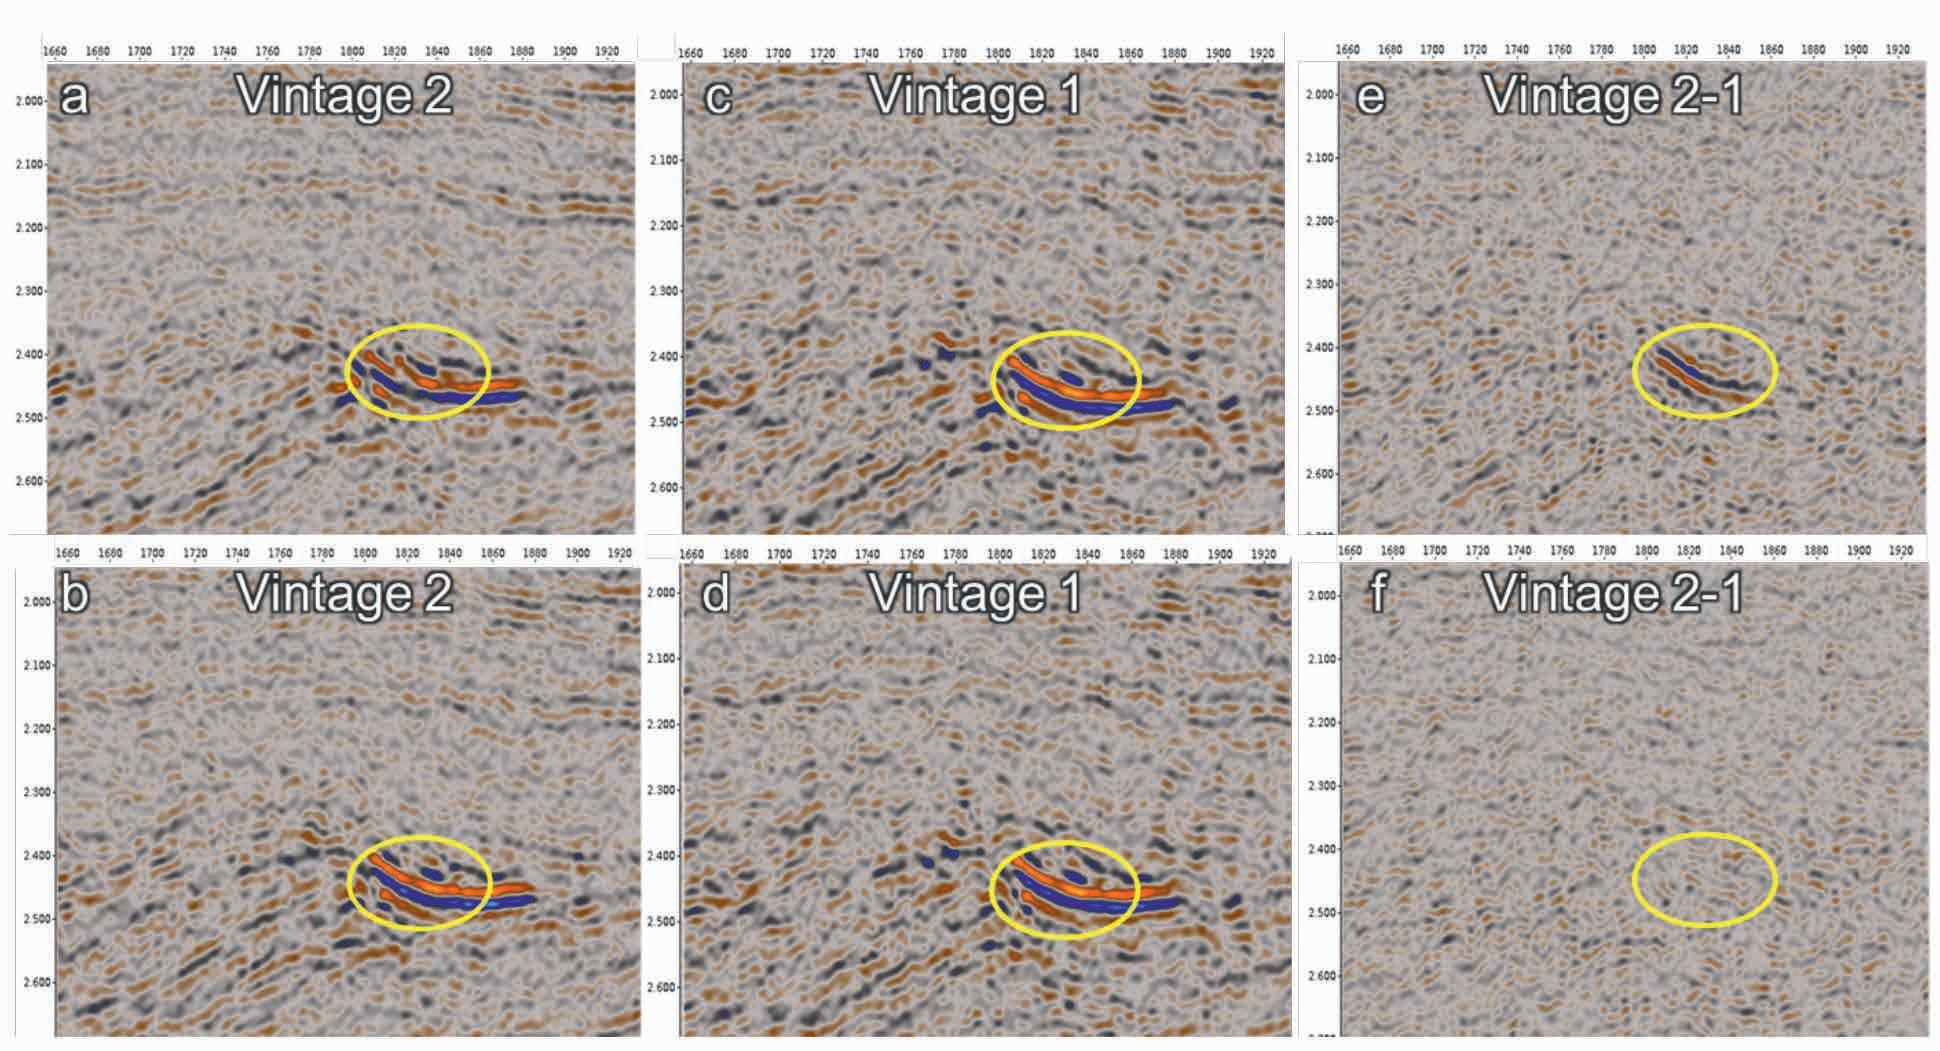
The value of high repeatability is intrinsically tied to the strength of the CO2 plume imprint. Prior to selecting the seismic monitoring programme, rock physics modelling (fluid substitution and forward seismic modelling) should be conducted to get an a priori indication of the level of repeatability needed for the survey. This again can feed into the formulation of the monitoring plan.
In the case where CO2 provides a very strong time-lapse response compared to background reflectivity, it is easier to detect the CO2, and by consequence the demand for repeatability, both for conformance and containment monitoring can be relaxed. This will also put more flexibility in the survey design and allow the monitoring strategy to be less rigid over time, improving the overall fiscal sustainability of the project. In projects where the CO2 plume effects are weaker and we depend on sufficiently repeatable surveys, there is less flexibility, and the projects need to ensure access to equipment and competence to achieve the desired repeatability, both during acquisition and processing. This does not exclude the adoption of new technologies but might
Correctly identifying CO2 where present
Useful for conformance and containment monitoring
Correctly identifying where there is no CO2
require a transition phase with overlap of both technologies to enable adequate information for optimal correlation between them.
When discussing sparser monitoring strategies, it is important to identify what might be the risks involved with less repeatability. Below we discuss the four potential outcomes in the frame of seismic monitoring of CO2 plume extent (summarised in Table 2):
• True positives: correctly detecting CO2 where present.
- Useful for conformance monitoring, and for detecting non-containment.
- A sparse system detects CO2 migration if it is deployed in the right location and at the right time. This highlights the reliance of sparse systems on an effective simulation model. The strength and continuity of the 4D response will be an indicator of whether sparse acquisition is recommended.
- Sufficient amounts of CO2 must be present before detection can occur, which may be delayed if the actual CO2 effects are obscured by noise, as illustrated in the Snøhvit example (Figure 3).
Misattributing seismic anomalies as CO2
Risk of noise being identified as CO2 leakage
Wrong basis for decision making NEGATIVE
Useful for conformance and containment monitoring and potentially identifying new injection opportunities
Not detecting CO2 where present
Risk of CO2 leakages going undetected
Wrong basis for decision making
Table 2 Summary of risks and consequences of seismic monitoring of CO2 plume.
• True negatives: correctly identifying where there is no CO2
- Useful both for containment and conformance assurance, and consequently for optimising injection management.
- Sparse systems might be deployed for this aim in dedicated locations identified as having higher risk elements. The systems need to be placed correctly to ensure effective coverage of important areas, thereby reducing uncertainty.
• False positives: misinterpreting either seismic noise or misattributing other seismic anomalies as CO2
- The most serious consequence of this might be that noise is misinterpreted as non-containment.
- Another consequence has bearing on conformance monitoring, as history matching will be performed based on incorrect assumptions, potentially impacting the overall operations of the site.
- False positives are an inherent risk if the repeat for some reason has better coverage or detectability than the baseline. The Sleipner overburden anomalies discussed above is an example of this. If such anomalies are not known prior to injection start, but first detected on a repeated survey, it would be challenging to identify whether these were already existing features or an indication of CO2 leaking into the overburden.
- Poor repeatability in general might also lead to strong amplitude anomalies not being properly differenced out between surveys, and could consequently indicate a leakage, as illustrated for the Sleipner overburden example (Figure 4). Differences in acquisition, not addressed in processing, can lead to similar result, as seen in the Gullfaks example (Figure 7).
- False positives might reduce public confidence with specific CO2 projects in particular, and with the CCS industry in general. Especially in the early phase of CO2 storage roll-out misinterpreting seismic anomalies as CO2 could seriously impend the future of the industry.
• False negatives: not detecting CO2 where it is present.
- As for false positives, this will have consequences for conformance monitoring, as history matching will not be performed with optimum data. This may lead to loss of opportunities for injection management (failing to adjust the injection strategy according to early signs of suboptimal injection or non-conformance).
- This may also affect containment monitoring. As for true positives, a sparse system might miss the false negatives, because the system is not deployed at the point where the CO2 resides. A potential CO2 leakage might go undetected for an unknown amount of time.
- There is a risk that with poor repeatability, the CO2 signal will be drowning in noise. Repeatability measures can be used to estimate upper thresholds of what might go undetected.
It is important to remember that even though we might relax the repeatability criteria, we should not compromise on the quality of the baseline, as identifying pre-existing anomalies in the subsurface is important for avoiding false positives in terms of unwanted CO2 migration. Also, having a high-quality baseline
gives a better basis for planning a potential sparse monitoring programme afterwards, and probably gives better confidence in monitoring interpretations.
Cost-efficient monitoring will be crucial in implementing CCS at large scale, and sparse monitoring might be one way to obtain this. Therefore, operators need to understand and accept the risks related to sparse monitoring systems, such as not detecting potential leakage or missing opportunities to optimise injection management. To deploy large-scale CO2 storage projects, the risk of not detecting minor local leakage (which might have limited environmental consequences) needs to be balanced with the global risk of continued release of CO2 to the atmosphere.
A sufficient seismic baseline is important because it provides the reference point for all later interpretations. Good seismic mapping of the subsurface is anyway needed for developing trustworthy simulation models and is usually required prior to injection operations. Combining the requirements for initial mapping and later monitoring into a robust seismic baseline is cost-efficient and will prove valuable at later stages of the project. There is large flexibility in designing the repeat programme. It will need to be developed based on site-specific risks and can be evolving over time having the effects for processing choices in mind. Forward modelling and injection experience will guide the need for repeatability and identify cases where seismic repeatability requirements might be relaxed. Similarly, site-specific containment risk assessment and dynamic forward modelling of CO2 plume and pressure field migration will need to guide the spatial and temporal elements of the monitoring programme.
The authors would like to acknowledge Equinor Energy AS (as operator for all fields) and all licence partners for approval to publish these results; Sleipner (ORLEN Upstream Norway AS and Vår Energi ASA), Snøhvit (Petoro AS, TotalEnergies EP Norge AS, Vår Energi ASA and Harbour Energy Norge AS), and Gullfaks (Petoro AS and OMV Norge). We are also grateful to Mona Hanekne Andersen, Anna Pontén and Therese Scheldt for helping to improve this manuscript.
Dehghan-Niri, R., Pedersen, Å. S., Thompson, M., Furre, A.-K., David, S., Westerdahl, H. and Holm-Trudeng, T. [2024]. Seismic mini-streamers as a potential method for CO2 storage monitoring. First Break, 42(11), 59-65. https://doi.org/10.3997/1365-2397.fb2024085. David, S., Ten Kroode, F., Cho, E., Zuberi, M. A. H., Stock, G., Baldock, S., Mispel, J., Westerdahl, H., Thompson, M. and Pedersen Å. S. [2024]. Short Streamers and Sparse OBN Acquisition: Potential for CCS Monitoring? First Break, 42(11), 49-57. https://doi. org/10.3997/1365-2397.fb2024094.
European Commission [2024]. Guidance document 1 – CO2 storage life cycle and risk management framework.
Furre, A.-K., Warchoł, M.J., Alnes, H. and Pontén, A.S.M. [2024]. Sleipner 26 Years: How Well-Established Subsurface Monitoring Work Processes Have Contributed to Successful Offshore CO2 Injection. Geoenergy, 2(1). https://doi.org/10.1144/geoenergy2024-015.
Hansen, O., Gilding, D., Nazarian, B., Osdal, B., Ringrose, P., Kristoffersen, J.-B., Eiken, O. and Hansen, H. [2013]. Snøhvit: The History of Injecting and Storing 1 Mt CO2 in the Fluvial Tubåen Fm. Energy Procedia, 37, 3565-3573. https://doi.org/10.1016/j. egypro.2013.06.249.
Harvey, S., Hopkins, J., Kuehl, H., O’Brien, S. and Mateeva, A. [2022]. Quest CCS facility: Time-lapse seismic campaigns. International Journal of Greenhouse Gas Control, 117. https://doi.org/10.1016/j. ijggc.2022.103665.
Intergovernmental Panel on Climate Change (IPCC). [2023]. Climate Change 2022: Impacts, Adaptation, and Vulnerability: Working Group II Contribution to the Sixth Assessment Report of the Intergovernmental Panel on Climate Change. Cambridge University Press. https://doi.org/10.1017/9781009325844.
Karstens, J. and Berndt, C. [2015]. Seismic Chimneys in the Southern Viking Graben – Implications for Palaeo Fluid Migration and Overpressure Evolution. Earth and Planetary Science Letters, 412, 88-100.
Nicoll, G.D. [2011]. Evaluation of the Nordland Group Overburden as an Effective Seal for the Sleipner CO2 Storage Site (Offshore Norway) Using Analytical and Stochastic Modelling Techniques. PhD thesis. University of Edinburgh.
Ollivier, L., Roth, T., Al Khatib, H., Morgan, E., Tang, C.D. and Szabados, A. [2023]. Breakthrough in operational model: testing offshore focused seismic for CS monitoring in Denmark. 84th EAGE Annual Conference & Exhibition, Extended Abstracts. https://doi. org/10.3997/2214-4609.2023101493.
Pevzner, R., Isaenkov, R., Yavuz, S., Yurikov, A., Tertyshnikov, K., Shashkin, P., Gurevich, B., Correa, J., Glubokovskikh, S., Wood, T., Freifeld, B. and Barraclough, P. [2021]. Seismic monitoring of a small CO2 injection using a multi-well DAS array: Operations and initial results of Stage 3 of the CO2CRC Otway project. International
Journal of Greenhouse Gas Control, 110(2021), 103437. https://doi. org/10.1016/j.ijggc.2021.103437.
Roach, L.A.N., White, D.J., Roberts, B. and Angus, D. [2017]. Initial 4D seismic results after CO2 injection start-up at the Aquistore storage site. Geophysics, 82(3), B95-B107. https://doi.org/10.1016/j. ijggc.2018.04.025.
Shimizu, H., Kitawaki, Y., Shimoda, N., Nakayama, Y., Tanaka, H., Konishu, Y., White, D. and Nickel, E. [2023]. Time-lapse monitoring using a permanent source ACROSS and surface-buried geophones at the Aquistore CO2 storage site. 84th EAGE Annual Conference & Exhibition, Extended Abstracts.
Skjæveland, Ø. M. and Torset, S. [2023]. Seismic Tiles, a data format to facilitate analytics on seismic reflectors. Geophysics, 88(3), IM29IM39.
Tanase, D., Saito, H., Niiro, R., Honda, T., Mori, A., Wada, Y., Higuchi, K. and Tanaka, J. [2021]. Progress of CO2 injection and monitoring of the Tomakomai CCS Demonstration Project. 15th International Conference on Greenhouse Gas Control Technologies, (GHGT-15) Abu Dhabi, UAE.
Torsæter, M., Bello-Palacios, A., Borgerud, L. K., Nygård, O.-K., Frost, T. K., Hofstad, K. H. and Andrews, J. S. [2024]. Evaluating Legacy Well Leakage Risk in CO2 Storage. 17th International Conference on Greenhouse Gas Control Technologies (GHGT-17). Calgary, Canada.
Wipki, M., Ivanova, A., Liebscher, A., Lüth, S., Möller, F., Szizybalski, A., Wiese, B. and Zimmer, M. [2016]. Monitoring Concept for CO2 Storage at the Ketzin Pilot Site, Germany – post-injection continuation towards transfer of liability. Energy Procedia, 97, 348-355.
Zhao, X. and Curtis, A. [2025]. On the design of ultra-sparse seismic surveys for monitoring subsurface CO2 storage sites using full waveform inversion. International Journal of Greenhouse Gas Control 146(2025), 104433.


To serve the interests of our members and the wider multidisciplinary geoscience and engineering community, EAGE publishes a range of books and scientific journals in-house. Our extensive, professional marketing network is used to ensure publications get the attention they deserve.
EAGE is continually seeking submissions for both book publishing and articles for our journals.
A dedicated and qualified publishing team is available to support your publication at EAGE.

Explore more

Carbon capture and storage is powering the energy transition, and seismic innovation is at its core. Working together to achieve your low-carbon energy goals, leveraging our industry-leading technology to fit your needs.
Let’s shape the future, one dataset at a time.
Barbara Cox1*, Tim Beal1, Jack Finch1, Gerhard Diephuis2, Jeroen Godtschalk1
and Nikitas Stefopoulos1 describe the similarities and differences in subsurface investigation technology and strategy between offshore wind and oil and gas projects and present new developments in offshore wind subsurface investigation.
Introduction
In the ongoing energy transition, the global energy system is shifting from hydrocarbon dependence towards renewable and low carbon sources. Offshore wind projects are an important
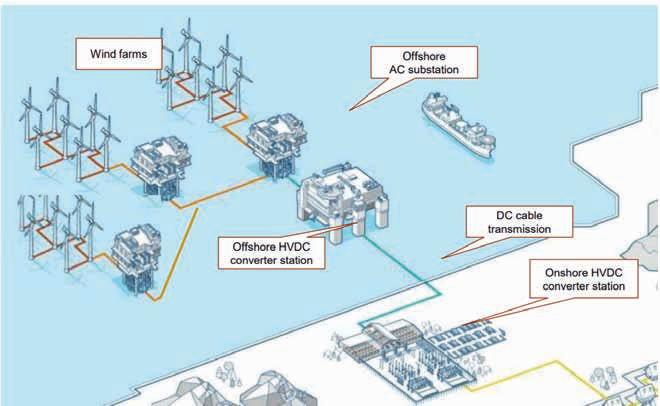
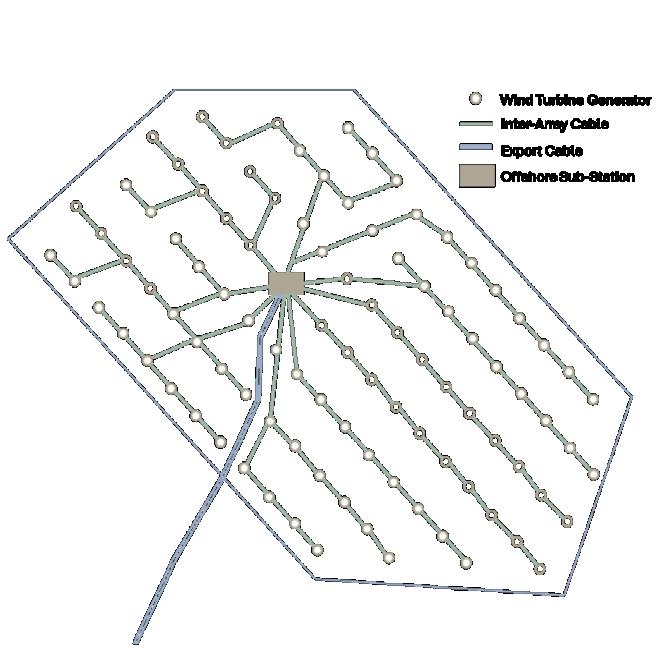
Figure 1 Top: Offshore wind project layout https://new.abb.com/processautomation/energy-industries/offshore-wind) Bottom: Offshore wind farm layout, including wind turbines, offshore substation, inter-array cables, and export cable.
1 AFRY | 2 Dgb Earth Sciences
* Corresponding author, E-mail: barbara.cox@afry.com
DOI: 10.3997/1365-2397.fb2025075
component in this transformation and geoscience is fundamental to the planning, development, and long-term sustainability of these projects.
The development of offshore hydrocarbon projects and offshore wind energy projects both rely heavily on accurate characterisation of the subsurface to ensure safe project execution and commercial success. The main goal for oil and gas investigations is to achieve a thorough geological understanding of hydrocarbon deposits in the deeper subsurface. Exploration efforts call for knowledge of reservoir properties and eventual field development and monitoring strategies. For offshore wind projects the goal is to determine the shallow soil properties such that structures like wind turbine generators, offshore sub-stations and cables can be optimally designed and safely located, installed, and operated.
In both cases, subsurface investigations comprise of geophysical, ground truthing, and geological/ground modelling methods to generate subsurface insights. Whereas the oil and gas industry has decades of experience deploying these methods, offshore wind projects pose unique challenges calling for different subsurface investigation strategies.
This paper describes the similarities and differences in subsurface investigation technology and strategy between offshore wind and oil and gas projects. In addition, new developments in offshore wind subsurface investigation will be discussed.
Offshore wind projects result in dense infrastructural developments, comprising wind turbine generators, offshore sub stations, and cables (Figure 1). This infrastructure is built within the marine environment, extending above the water surface, across the seabed, and into the subsurface. Therefore, in addition to subsurface investigations, evaluations of water and wind, the seabed, and other obstructions are required (Figure 2):
• Water and wind conditions will firstly be assessed in a desktop study. Next, a metocean survey will be conducted that
collects and analyses environmental data related to meteorology and oceanography. The main purpose of this study is to gain understanding of the combined effect of wind, waves, currents, and tides, such that predictions can be made;
• For the seabed evaluation, a seabed occupancy desktop study will be performed first. Next, seabed survey data, including geophysical seabed data like multibeam echo sounders (MBES), side scan sonar (SSS), and magnetometry (MAG) are used to identify objects and structures on or just below the seabed, as well as to evaluate seabed morphology;
• The evaluation of other obstructions, such as unexploded ordnance (UXO) and archaeological artefacts, will also start with a desktop study. Next, the geophysical data will be used to detect UXO and other artefacts. In addition, seabed samples and cores can be used for dating and to obtain insights into stratigraphy. This assessment allows the adjustment of the project layout to avoid impact on sensitive UXO and archaeological areas.
The results from these evaluations, together with the subsurface evaluation discussed below, inform the layout, design, and installation of the wind turbine generators, offshore sub stations, and connecting cables.
Gaining an accurate understanding of the subsurface is fundamental to both offshore wind and hydrocarbon developments. Both industries employ integrated workflows that combine geological, geophysical, and ground truthing data to characterise subsurface conditions for subsurface utilisation/exploitation. Generally speaking, these workflows share the following steps (Figure 2):
• Initially, Desktop Studies provide an early-stage analysis in which existing datasets are combined to produce a first pass evaluation of opportunities and risks. Based on this work, additional, site-specific geophysical and ground-truthing surveys can be considered and planned;
• Geophysical Surveying is conducted to provide indirect, non-intrusive, investigations of the project area to detect variations in physical properties. Initially, this data will be used to inform the ground-truthing survey design;
• Ground Truthing is then performed to provide direct investigation of the subsurface. This can be done by drilling boreholes, logging, coring or testing. This data will be used to calibrate the geophysical data with the physical properties of the soil/rock;
• The Integrated Geological/Ground Model combines the geophysical and ground-truthing data into a single comprehensive model which describes the structural and stratigraphic distribution of rock/soil units across the project area over the intervals of interest. This model is used to plan future data acquisition, such as highlighting where to acquire additional geophysical data, drill, or sample, and to optimise utilisation of the subsurface.
However, despite the overall workflow being similar, divergence in key areas such as project objectives, data resolution requirements, regulatory constraints, and risks, means there are differences in how each stage is carried out in practice. These differences are discussed in more detail below.
Objectives
• Offshore wind subsurface investigations facilitate the safe and successful installation of physical infrastructure for wind power generation and transmission to the grid.
• For offshore oil and gas subsurface investigations the objectives are different. As the hydrocarbon resources mostly reside deep in the subsurface, the main effort is to achieve a thorough geological understanding in an exploration phase and to obtain detailed knowledge of hydrocarbon reservoir characteristics for longer-term field development and monitoring.
Geophysical methodology
• Offshore wind site investigations focus on mapping not only the (shallow) subsurface, but also the seabed. For
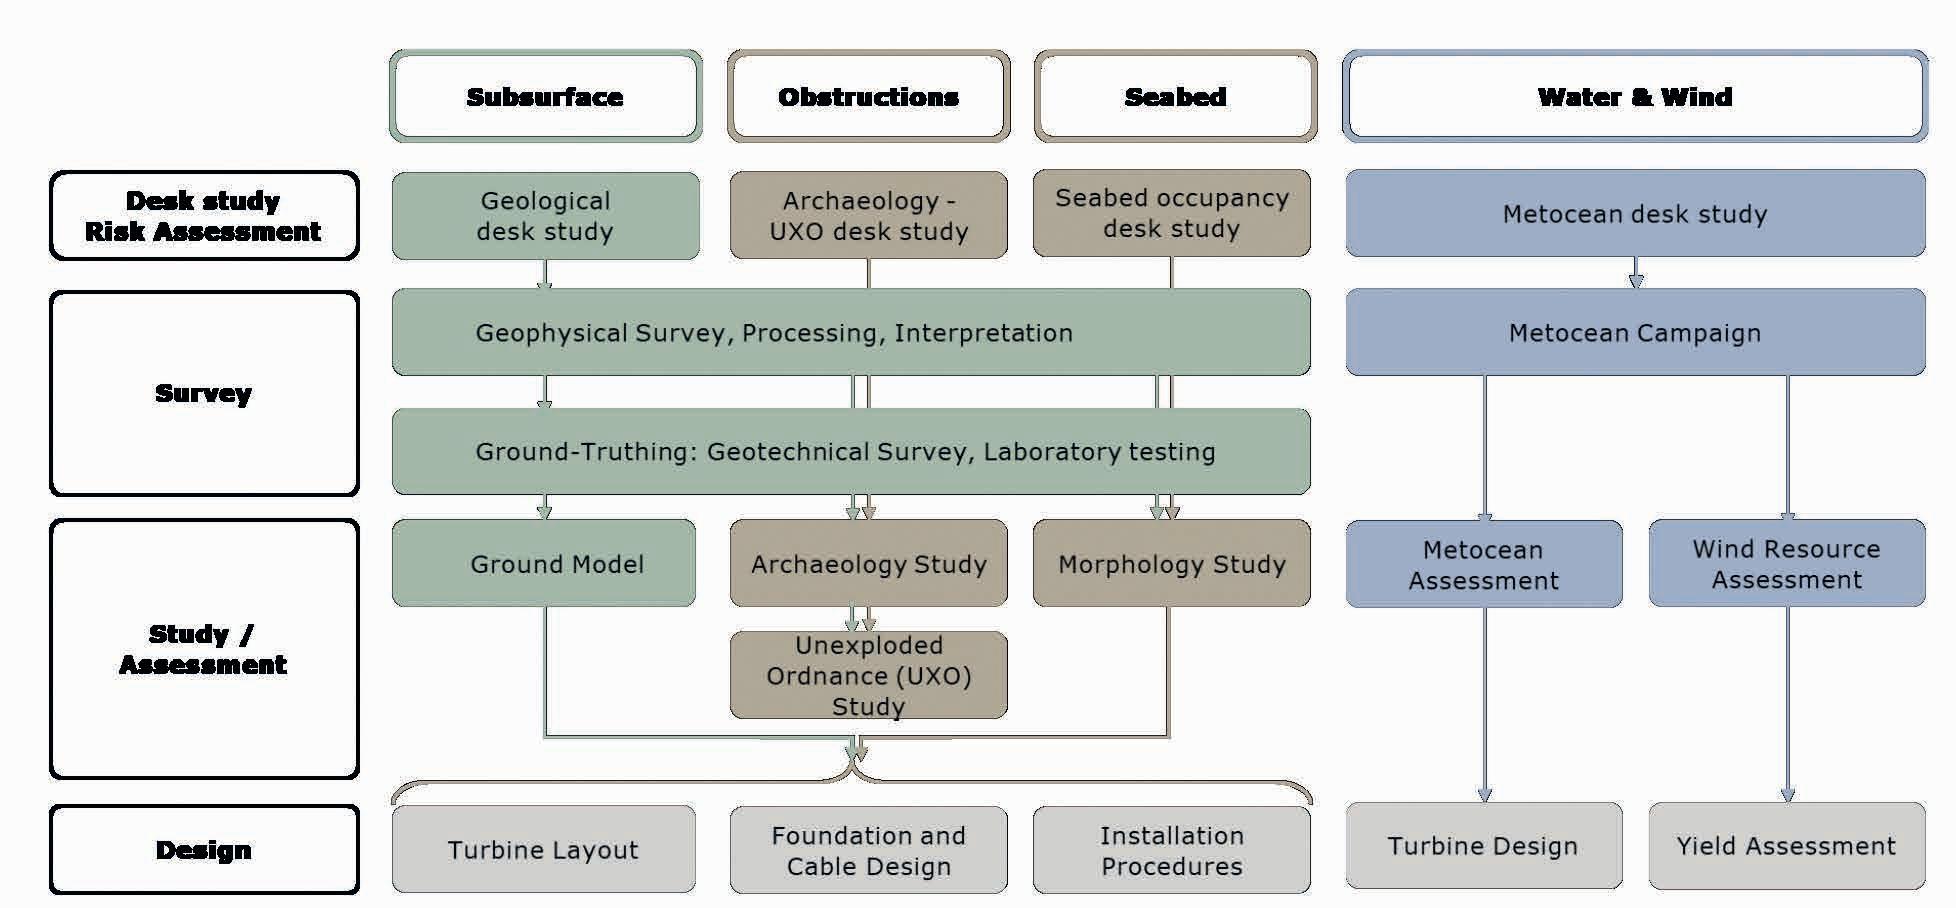
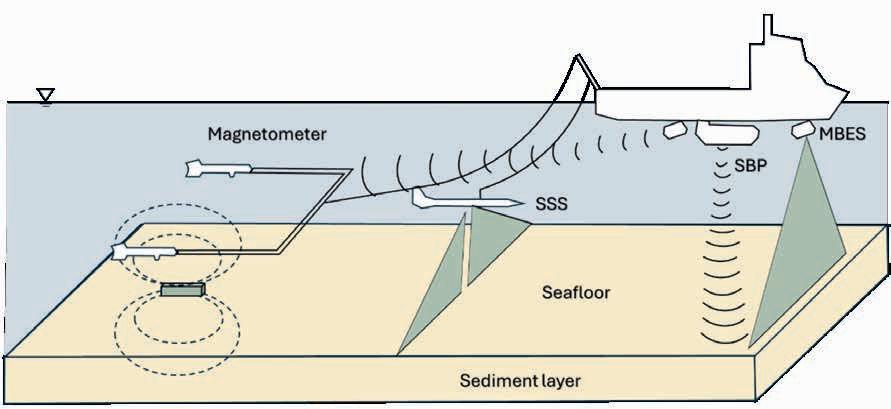
seabed mapping, high-resolution geophysical methods like MBES, SSS, and MAG are used. The shallow subsurface is investigated using Sub Bottom Profiler (SBP) and Ultra-High-Resolution Seismic (UHRS). SBP is used to achieve a detailed image of the first 5-15m depth below seabed, while the UHRS is used to image depths down to 100-150 m. For UHRS short streamers are being used, typically 50-100-m long. Sparkers and boomers are used, which are high-frequency sources with signal frequencies of up to 4000Hz. In most cases, 2D UHRS is acquired. However, 3D UHRS is becoming more common. Commonly, the vessels that acquire these data are multi-sensor platforms, gathering measurements for all geophysical methods simultaneously. This setup requires careful system design and integration to ensure robust, synchronised data streams while also avoiding interference between sensors. Because UHRS surveys rely on less powerful sources and operate within frequency ranges that overlap with vessel-generated noise, it is also essential that these acquisition vessels are operationally ‘quiet’ and that interactions with other vessels in the area (SIMOPS) are minimised.
• Offshore oil and gas subsurface investigations essentially comprise seismic methods, both 2D and 3D, of which 3D has been common for many decades now. Typically, long streamers up to several kilometres long and more powerful sources (airguns) are being deployed to image the objective reservoirs, often several kilometres beneath the seabed. The added value of 3D seismic data is high for offshore oil and gas applications due to high ground truthing costs (drilling boreholes/wells) and hence a lot of resources are put into processing seismic data. Vessels for acquiring oil and gas seismic are typically very specialised for that single task and vessel noise is less of a concern due to the much more powerful, lower frequency sources.
• Offshore wind subsurface investigations are often limited to the shallowest 100 m sediments below seabed, as wind turbine foundations (e.g., monopiles, jackets, or anchors), offshore sub stations, and cables mainly interact with these shallow layers.
• Offshore oil and gas subsurface investigations focus mainly down to the depth of the reservoir that needs to be characterised, often several kilometres beneath the seabed.
• Conventional seismic techniques are used for oil and gas subsurface investigations. The resolution of conventional seismic is relatively lower due to low frequency sources and greater depths of hydrocarbon objectives. The horizontal resolution is determined by receiver spacing in two horizontal dimensions and by the imaging method in the processing (Berkhout,1980, Claerbout,1985). The horizontal and vertical resolution is indicated in Table 1.
• In offshore wind subsurface investigations, the horizontal and vertical resolution that can be achieved by imaging the subsurface using 2D UHRS, 3D UHRS, and SBP methods is much higher than conventional seismic and is indicated in Table 1. The actual resolution achieved will depend on the acquisition setup and geological conditions, but the indicated values provide an insight into typical resolution and depth of penetration.
Ground truthing methodologies are vital for the calibration of geophysical measurements in any subsurface evaluation. For offshore oil and gas, ground truthing is done by drilling wells (boreholes) for exploration, appraisal, and development purposes. These deep wells are carefully planned based on the available geophysical data. The number of wells are minimised
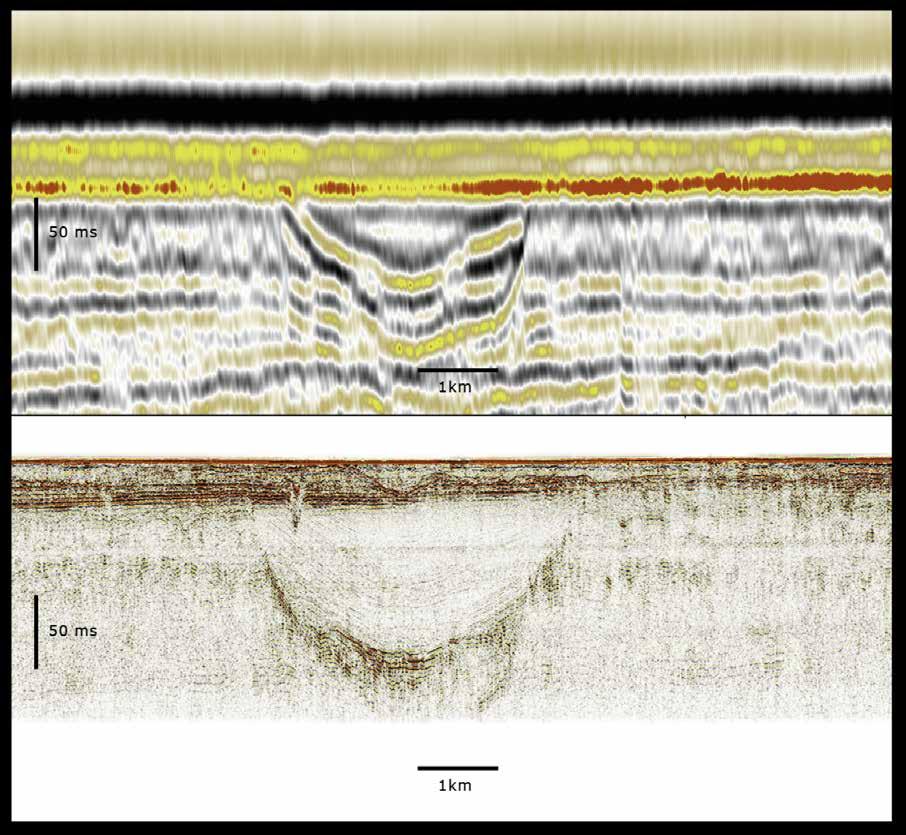
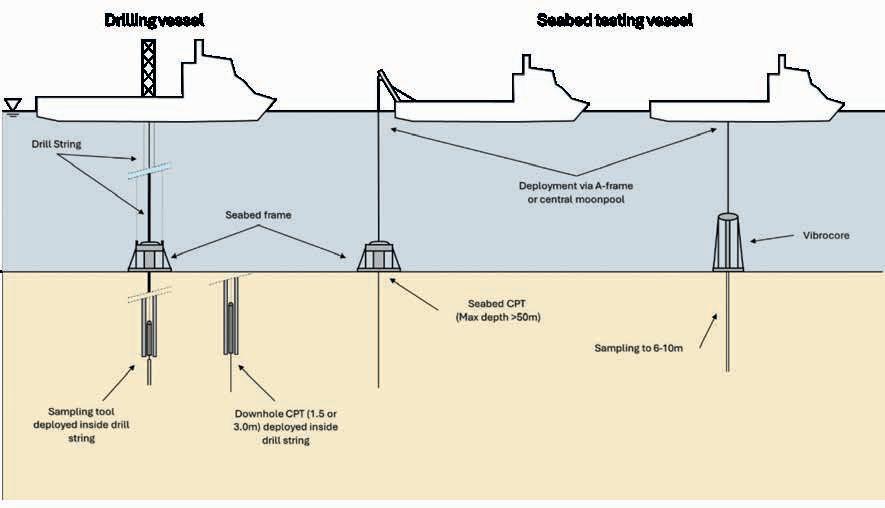
and optimised since they are costly. Logging can be performed within these wells to analyse the physical properties of the, mostly consolidated, subsurface and reservoir formations. Taking side-wall samples and cores from the wells is also customary.
For offshore wind development ground truthing is done through geotechnical investigations. Methods can be split into two categories: in-situ testing methods and sampling methods. These kinds of geotechnical data gathering methods are relatively cheap and extensively used and relied on to assess the (mostly unconsolidated) soil characteristics.
In-situ testing methods
Cone Penetration Tests (CPTs) consist of a cone on the end of a steel rod that is pushed into the soil at a consistent rate.
Figure 4 Seismic images showing the difference in resolution. Top: conventional seismic from NLOG. Bottom: 3DUHRS from Doordewind wind farm zone. Courtesy RVO/TNO/TGS. https://offshorewind.rvo.nl
Figure 5 Overview of vessels and geotechnical methods for offshore wind subsurface investigations.
As the test is conducted, continuous data like tip-resistance, sleeve-friction, and pore pressure are measured. Based on this CPT data it can be evaluated how the soil will behave during the installation of the foundation. For CPT cones there are several specialised options available, such as thermal CPTs (to determine the thermal properties of the soil) or seismic CPTs (to determine the shear wave velocity of the soil). These tests can be executed both at the seabed, but also within a borehole.
Borehole Geophysical Logging is an approach where geophysical tools are deployed on a wireline into a borehole to measure in-situ properties such as the shear wave velocity, magnetic resonance, and natural gamma emission of the soil. This approach is similar to the wireline logging performed within oil and gas boreholes.
Vibrocore (VC). This method involves vibrating a steel tube into the ground to a depth of ±6 m. This is typically undertaken for the inter-array and export cable route surveys as the final depth of burial is shallow. Since the cables generate heat, an important aspect of the VC is to test in-situ and in the laboratory the thermal resistivity of the soil.
Borehole sampling allows for sampling at larger depths. With this method samples are taken from boreholes at predetermined depths. These samples will be analysed in a laboratory to assess the soil properties. Care is taken to retrieve samples with minimal disturbance so as to provide the most representative results from the laboratory testing.
Two main different types of vessels – drilling vessels and seabed testing vessels – are used to conduct these geotechnical operations, as shown in Figure 5
Drilling vessels feature a centrally positioned moonpool and drill tower. This type of vessel is used to drill boreholes. Besides borehole data is acquired through borehole sampling, downhole CPTs, and borehole logging, downhole from the seabed to, typically, 80-100-m depth. This approach is relatively expensive but has the certainty of reaching the target depth of interest. This is achieved as between in-situ CPTs tests the borehole depth can be advanced by drilling. As maximum depth can be predefined, this approach is most common for foundation assessments.
The seabed testing vessel is smaller and utilises either a centrally positioned moonpool or an A-frame from which sampling and testing equipment is lowered to the seabed. Once on the seabed, (CPT) tests are conducted and (VC) samples are taken. Whilst this approach is cheaper than drilling it has the negative that the maximum depth achievable is constrained by how far the tool can be pushed into the ground, which can be impacted by dense sand layers, gravel/cobbles/boulders or the system’s maximum thrust (whereas with a drilling vessel these difficult layers can be drilled out). As the penetration can be limited, this approach is typically used for the cable survey as the depth of burial is shallow.
Survey scope
For offshore wind site investigations, there are two general scenarios. The first is where the government takes on the initial site investigation activities to derisk the project on behalf of developers. The second approach is where developers take on all site derisking.
Government-led investigations comprise broad, standardised, preliminary investigations and are aimed at derisking the whole proposed wind farm area. This information is provided to the developers, enabling them to create a preliminary design for the offshore wind farm and prepare a well-informed bid. In addition, this data can be released into the public domain to encourage investment and create a level-playing field for developers.
An example of a preliminary investigation layout is shown in Figure 6A in which 2D UHRS is acquired, together with evenly distributed geotechnical ground-truthing information, to characterise the overall site. The example in Figure 6B shows a similar, but more advanced, preliminary geophysical and
geotechnical investigation using 3D UHRS, which will result in a more detailed characterisation of the site. Although the use of 3D UHRS for site-wide investigations is not yet common, it is increasing.
Once a developer has been awarded a project, it will then carry out project-specific investigations focused on addressing design, certification and permitting needs. The amount of additional site investigation work required will depend on how much data is already available and on what specific risks and uncertainties need to be addressed.
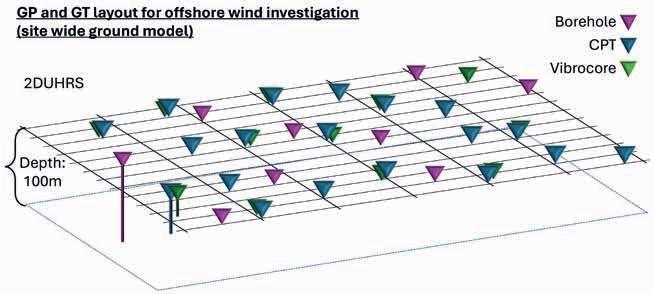
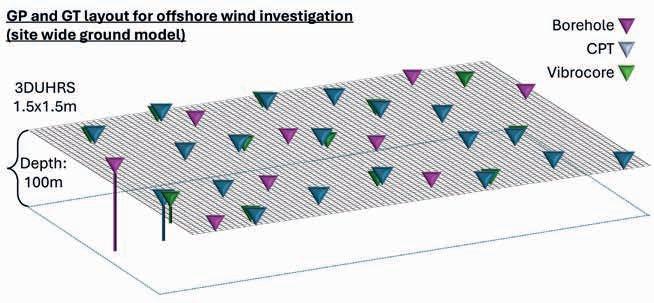
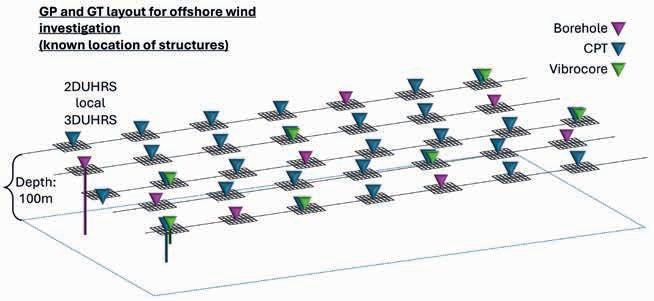
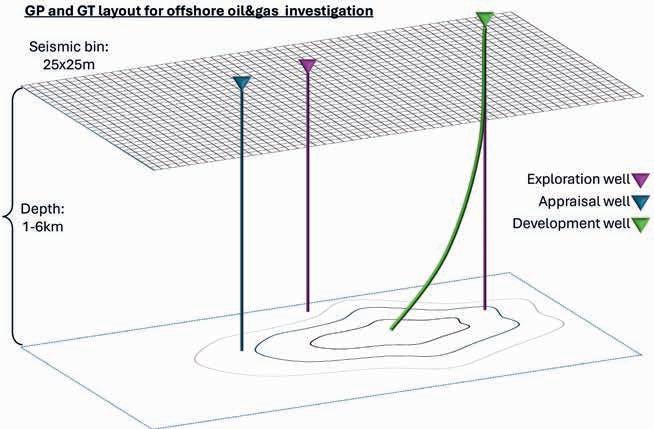
Figure 6 Different scenarios for geophysical and geotechnical survey layout: A) site-wide offshore wind investigation using 2D UHRS B) site wide offshore wind investigation using 3D UHRS C) offshore wind investigation targeted to known structure locations, using 2D UHRS and local 3D UHRS. D) Oil and gas reservoir investigation.
In terms of geophysical surveying, this could comprise the full process from preliminary surveying onwards (post-award site investigation) or the developer may only need to acquire datasets targeting specific project risks (building on pre-award site investigation data), for example acquiring 3D UHRS surveys around turbine and substation locations for micro-siting (to optimise the foundation locations) or additional MAG surveying for UXO risk management.
For geotechnical surveying, there are specific geotechnical survey requirements for detailed design, certification and permitting which will mean substantial new surveying will typically be required, regardless of how much pre-award data is available. For instance, investigations are always required at foundation locations and along cable routes, e.g., one per fixed turbine foundation, one for each substation foundation pile, and at frequent intervals along the cable route. This leads to significant volumes of ground-truthing information (i.e. Boreholes/CPTs/VCs) being acquired for a typical offshore wind project. An example of a detailed, project-specific investigation layout is presented in Figure 6C, which shows 3D UHRS around the planned turbine locations for micro-siting, and a borehole/CPT for each planned fixed turbine foundation.
This survey approach differs from the approach for offshore hydrocarbon projects. Nearly always developer- (operator-) led, typically a 3D seismic survey will be acquired covering the whole area to assess the potential hydrocarbon deposits, followed by the drilling of exploration and appraisal wells. If the discovery is made and deemed to be commercial, development wells will be drilled to produce hydrocarbons from the reservoir. During these stages, seismic data will be calibrated with borehole data as they become available. An example of an oil and gas subsurface investigation is presented in Figure 6D, which shows 3D seismic in combination with sparse ground-truthing information in the form of exploration, appraisal, and development wells.
Ultimately, the geophysical and ground-truthing (borehole/ geotechnical) information will be combined into a ground
model, which is a site-specific representation of the subsurface including physical soil/rock properties. Since the purpose and the requirements of the subsurface investigations for offshore hydrocarbon and offshore wind projects differ, the ground models also differ.
The geological model for hydrocarbon projects focuses on reservoir properties. The most basic models incorporate structural information from seismic data and rock property data from boreholes. More sophisticated models can also incorporate information inverted from seismic data using quantitative interpretation techniques, such as amplitude versus offset/angle analysis. Geo-cellular models, integrating the available information in 3D, are then typically constructed and first used for static reserves determination. In a later stage this model forms the basis for a dynamic reservoir model in which historical production behaviour is incorporated for forecasting and development optimisation purposes.
For offshore wind ground models, the shallow geophysical data (SBP/UHRS) and extensive geotechnical information, both from the field data and from the laboratory, are integrated. This ground model is mainly used for optimising placement, design, and risk assessment of wind turbines, sub stations and cable routes. The ground model for offshore wind projects typically consists of a geological ground model, a geotechnical interpretative report, and an integrated ground model:
• The Geological Ground Model combines the stratigraphic interpretation of seismic (UHRS/SBP) data with the geotechnical information to delineate soil units (Figure 7). The purpose is to determine vertical and lateral variations in subsurface;
• The Geotechnical Interpretative Report integrates all geotechnical data, like CPT results, borehole logs, and laboratory test data, to assess the geotechnical parameter profiles and the actual soil behaviour. This provides an important input to the foundation and cable design and installation plan;
• The Integrated Ground Model combines the Geological Ground Model and the Geotechnical Interpretative Report into a spatially coherent subsurface model. The soil units and the
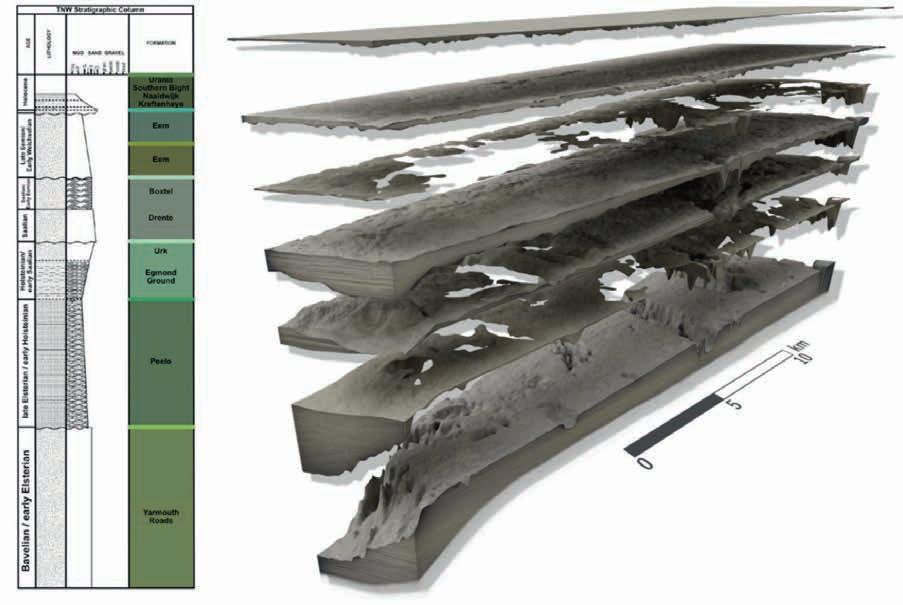
Figure 7 Example of a ground model. Courtesy RVO, NGI, Sand. (https://offshorewind.rvo.nl/files/ view/93ab4df9-a706-4354-80d0-3f8bdddcec61/ tnw_20220124_gm_ngi_visualisation-integratedground-model-f.mp4).
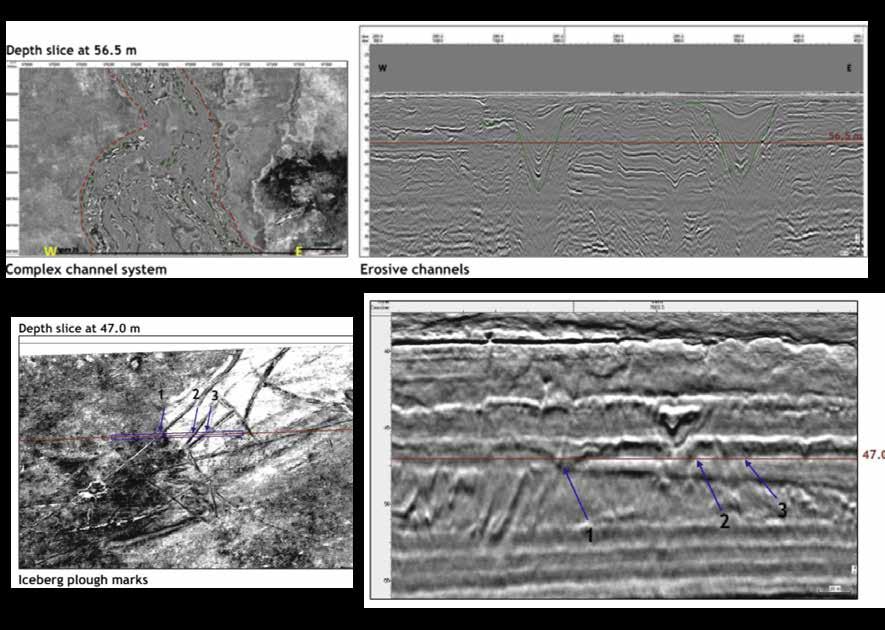
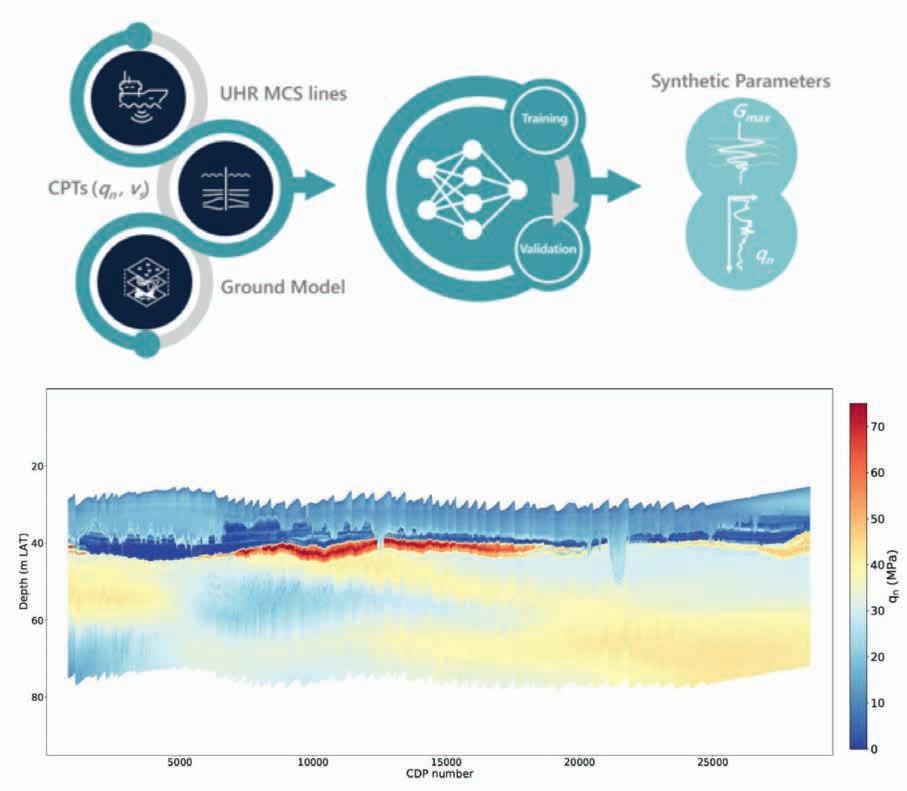
geotechnical parameter profiles are combined; based on this, soil province maps (grouping areas with similar soil behaviour) can be generated. In addition, parameter uncertainties can be quantified based on statistical and/or machine learning tools.
Many concepts and technologies in ground modelling have originated in the oil and gas sector and are increasingly being adapted for application in offshore wind. The latest innovations in geophysics and ground modelling for offshore wind soil investigations emphasise integrated approaches, advanced data acquisition and processing, and automation to meet the needs of offshore wind project sites. Some key developments are:
Figure 8 Example of 3D UHRS. Top: complex channel system with erosive channels. Bottom: Iceberg plough marks. Courtesy MMT Geosurveys. https:// offshorewind.rvo.nl.
Figure 9 Example Synthetic CPT. Top: the applied workflow, in which site-wide MSC (UHRS), 1D CPT data, and Ground Model information are combined into a Machine Learning algorithm to predict site-wide CPT parameters. Bottom: predicted CPT parameter (net cone resistance). Courtesy TNO / Fugro. https:// offshorewind.rvo.nl.
• Autonomous Underwater Vehicles (AUV) or Unmanned Surface Vessel (USV) For the geophysical scope unmanned vessels are increasingly being deployed. This approach offers significant advantages in terms of safety and environmental impact, which are considerably lower compared to traditional manned vessels. These vehicles are operated from remote operation centres, where data quality can be monitored online.
• 3D Ultra-High-Resolution Seismic (UHRS) technology: 3D seismic has a long history in the oil and gas industry. The application of 3D seismic/UHRS to offshore wind is relatively new due to the need for specialised technologies, cost-effective solutions, and optimised data acquisition and
processing techniques (Limonta et al, 2024). To meet these requirements, new large bandwidth, high frequency seismic sources are being developed. At the same time, enhanced processing workflows are developed to effectively manage the high-frequency, high-density dataset generated by these surveys. Figure 8 shows examples of the detailed results of 3D UHRS. It enables comprehensive mapping of soil units, identification of geohazards like boulders and shallow gas, and supports more flexible layout planning by allowing wind turbine locations to be adjusted if anomalies are found. The enhanced data also feeds directly into quantitative interpretation for accurate prediction of soil properties and optimised foundation design, reducing the reliance on intrusive coring or CPTs (discussed below).
Geotechnical innovations
• Semi-automated seabed testing systems: to reduce the need for offshore crew, various companies are developing Seabed CPT, drilling, or vibrocore systems that can be operated on a semi-automated basis.
• Additional sensors in either wireline logging systems or in the CPT cone: increasingly methods from oil and gas or new methods are being developed to increase the amount and detail of in-situ data that can be collected. Recent innovations include Thermal CPTs and PS Logging.
Ground modelling innovations
• Quantitative Interpretation (QI): Similar to the oil and gas sector, QI is now being used to guide extrapolation of geotechnical data across an entire site (Carpentier et al, 2021). Figure 9 shows an example of CPT prediction from seismic data based on a neural network approach. In this algorithm the site-wide seismic data is combined with information from 1D CPT data and the 3D ground model. The result is a site-wide prediction of CPT data, which can be used to improve ground model reliability, and potentially reduce the number and cost of intrusive geotechnical tests needed. Recent advances in UHRS data acquisition and processing are also now enabling AVO inversion techniques to be applied (Karkov et al, 2022). This physics-based approach (versus correlative, as with neural networks) can produce more robust outputs for improved understanding of ground conditions.
• Preliminary Ground Modelling and continuous updates: With new joint industry projects, such as the DNV Ground Investigation for Floating Wind (GIFT) project, the industry is moving away from position-specific investigations towards environmental class-based ground profiles. This enables site investigation data to be decoupled from final windfarm
layouts, allowing for later design changes and faster project delivery (DNV, 2025).
Subsurface investigations for oil and gas development and offshore wind farm projects share a common goal: to comprehensively understand the subsurface conditions to ensure safe and cost-effective resource development. Although their focus and challenges differ due to the scale and nature of the subsurface and projects, both sectors benefit from similar technologies and expertise. The offshore wind sector is building on valuable experience from the oil and gas industry, while further advancing towards more integrated, high-resolution, and cost-effective site investigation methodologies tailored to the specific needs of renewable energy.
The authors acknowledge the Netherlands Enterprise Agency (RVO) for authorising the publication of the data examples.
Berkhout, A.J. [1980]. Seismic Migration: Imaging of acoustic energy by wave field extrapolation. Developments in Solid Earth Geophysics, 12, ISBN 0-444-41904-7, Elsevier.
Carpentier, S., Peuchen, J., Paap, B., Boullenger, B., Meijninger, B., Vandeweijer, V., Van Kesteren, W. and Van Erp, F. [2021]. Generating synthetic CPTs from marine seismic reflection data using a neural network approach. EAGE Workshop on Machine Learning, Extended Abstracts. https://doi.org/10.3997/2214-4609. 202132008.
Claerbout, J.F. [1985]. Imaging the Earth’s Interior, ISBN 0-80542-3040, Blackwell Scientific Publications.
DNV [2025]. https://www.dnv.com/news/2025/dnv-launches-joint-industry-project-on-ground-investigations-for-offshore-wind-turbines/.
Karkov, K.H., Dalgaard, E., Diaz, A.T., Duarte, H.,Hansen, H.J., Hviid, S., Høegh van Gilse, N.C.,Krogh, L., Kuppens, S., Salaün, G. and Correia, F. [2022]. Case Study: AVO Inversion and Processing of Ultra-High Resolution Seismic for a Windfarm Application. 83rd EAGE Annual Conference & Exhibition, Extended Abstracts . https://doi.org/10.3997/2214-4609. 202210942.
Limonta, L., Caselitz, B., Oukili, J., Tegnander, J., Kittell, L. and Catterall, V. [2024]. Enhancing Offshore Wind Farm Site Characterization with 3D Ultra-High-Resolution Seismic Acquisition and Processing. EAGE GET Conference, Extended Abstracts. https://doi. org/10.3997/2214-4609.202421181.
Vardon, P.J. and Peuchen, J. [2020]. CPT correlations for thermal properties of soils. Acta Geotechnica, 16(2021)(2), 635-646. https://doi. org/10.1007/s11440-020-01027-2.
R. Head1, T.B. Grant1, V. Rotar1, R. Dam Pedersen1 and N. Coles1 demonstrate a Python interface to consume cone penetration test (CPT) data in Petrel, enabling superior data handling and complex subsurface interpretation to be applied to ground modelling for offshore wind.
As the offshore wind industry grows to meet demands for renewable energy, offshore wind farms are being built bigger, in deeper water, and in more challenging ground conditions. Increasingly complex and accurate ground models are needed to deal with these conditions, and the software traditionally used to build ground models does not always fulfil these advanced processing, analysis, and modelling needs.
The E&P industry has spent decades and millions of dollars innovating and refining subsurface interpretation and modelling software. We argue that the benefits of this research and development should be leveraged when building ground models for offshore wind.
A barrier to the use of popular E&P platforms is data ingestion. While the data used for building ground models is analogous to the data used in E&P there are important differences that can hinder integration. Cone penetration test (CPT) data used by the offshore wind industry are analogous to the well data used by the hydrocarbon exploration and production (E&P) industry. Despite their similarities, these data are typically stored in different file types, meaning that they cannot be loaded into software packages interchangeably. This limits the workflows and functionality available in ground modelling for offshore wind.
Using Python application programming interfaces (APIs), CPT data were successfully loaded into Petrel® E&P Platform* (Petrel), which does not natively support ingestion of these data. This enabled the advanced data visualisation, analysis, conditioning, interpretation and modelling functionalities of Petrel to be applied to CPT data. We demonstrate the value of this through a streamlined and partially-automated soil behaviour type classification workflow.
Many of the software applications traditionally used in ground modelling for offshore wind developments have common limitations. They have limited 3D visualisation capabilities, which can restrict the integration of geotechnical and geophysical datasets, thereby hampering subsurface interpretation. They have limited processing capabilities, which restrict them from handling large datasets. Furthermore, they are limited in their ability to integrate
1 Cegal
* Corresponding author, E-mail: rebecca.head@cegal.com
DOI: 10.3997/1365-2397.fb2025076
geophysical and geotechnical datasets, and they have limited tools for complex subsurface interpretation.
The hydrocarbon exploration and production (E&P) industry has invested in subsurface interpretation software for decades. The most common subsurface interpretation applications have excellent 3D visualisation and can handle and integrate large datasets. While cost could be seen as a barrier to wind energy companies adopting these technologies, the falling cost of compute power, the high cost of energy, and the increasing demand for wind energy, are likely to make them more economical.
We will show how we have successfully utilised a Python interface to consume cone penetration test (CPT) data in Petrel. This enabled the superior data handling and complex subsurface interpretation capabilities of Petrel and the Ocean Store platform to be applied to ground modelling for offshore wind. We will outline a case study in which soil type classification was carried out, followed by 3D soil modelling.
The offshore wind and E&P industries use different but analogous data types. CPT data used by the offshore wind industry is analogous to E&P well data. In contrast to CPT data, typical well log data is sampled over much larger intervals — 1000s rather than 10s of metres — and the file types used to store the data are different. A comparison of the file types used to store CPT and well data is given in the next section.
CPT is the preferred method of measuring and characterising soil properties as it is fast, economical and reliable. During a CPT, a cone-shaped penetrometer is pushed into the ground at a constant rate. Continuous measurements of the resistance of the soil, and other properties such as sleeve friction or pore pressure, are taken as the cone is pushed downwards. While a CPT does not typically involve direct sampling of the soils, key mechanical and physical properties of the soil can be calculated, which may include soil type and soil stratigraphy (Robertson, 2009), stiffness or shear modulus (Stuyts et al., 2024), or consolidation and compaction (deGast et al., 2019).
Prizm is a set of Python application programming interfaces (APIs) that enable data ingestion into Petrel, thereby facilitating
all workflows available on the platform, including data analysis, data conditioning, and interpretation of the ingested data.
CPT data and well data are analogous and both are typically recorded in similar, ASCII-based file formats. CPT data are predominantly recorded using the Geotechnical Exchange Format (GEF), while well data are typically recorded using the Log ASCII Standard (LAS).
Prizm was originally designed to be compatible with petrotechnical data types such as LAS. In this study, Prizm APIs were used along with Python to ingest GEF files. The two file types, GEF and LAS are compared below.
The GEF file format has a standardised structure, content, and keywords to ensure that CPT data are exchangeable and can be recorded and maintained. The format is also human-readable and can easily be manually inspected. While many fields and sections must be included for a GEF file to be valid, the format is still flexible to allowing further customisation depending on the requirements and data collected in the CPT.
GEF files are divided into two sections, the header and data. The header comprises:
• A summary of the original information sources for tracing of the file, such as the name of the executing company, date, and identification number of the CPT.
• A description of the CPT data including the number of columns and lines in the data block, and descriptions of the columns.
• A description of the CPT procedure including project information, apparatus and calculation procedures, location information, how the measurements were taken such as final depth of penetration test.
• Information about the structure of the file such as the GEF version number.
The data block is a table containing the measured data and any calculated information. Each column is linked to a physical quantity with a specific number and unit attached to that quantity. Two columns are reserved for mandatory measurement types: cone resistance and the penetration length. Penetration length has the standard unit of metres and quantity number of
1. Cone resistance (qc) has standard units of MPa and quantity number of 2. Further measurements such friction resistance, pore pressure and inclination are optional columns in the data block, and each have their own standard units and quantity numbers.
Log ASCII Standard (LAS) is a widely used file format for working with well log data in the E&P industry. The format is designed to standardise the storage and sharing of well log data between software as well as being human readable for manual inspection.
Like GEF files, LAS files are separated into the header and the data. The header comprises:
• The WELL section, containing metadata about the well, location, and logging company.
• The CURVES section, containing information about the log curves in the data section and the units of measurement.
• The PARAMETERS section, comprising details of the logging or measurement tools used, such as specific equipment and methods used to acquire the data in the data section.
• The OTHER INFORMATION section, for any additional notes or useful information for interpreting the data contained data section.
The data section follows the header and contains the log measurements, where each sample measurement corresponds to a depth or interval in the borehole.
While LAS files are supported import/export file types in most petrotechnical software, GEF files are not supported file types for Petrel. To be manipulated in Petrel, GEF files either need to be converted into an intermediate LAS file, or they can be loaded directly into Petrel using the Prizm APIs.
The Prizm APIs enable programmatic creation of new well and well log objects in Petrel, and data such as well log values and well properties to be written to them. As ASCII file formats are readable in Python, data can be extracted from a GEF file and written it to a Petrel project using Prizm.
Due to naming differences between LAS and GEF files, the first step was to map the GEF file structure to the Petrel data model and project structure (Table 1). The mapping shows that a GEF file contains all the concepts needed to create a complete
Cone Penetration Test Well
MEASUREMENTVAR (Header)
Data block column
Reference level (ZID)
Test location coordinates (XYID)
Global well log
Well log
Well datum
Well head coordinates
Penetration length and inclination recorded as columns in the data block Well survey
COLUMNINFO (Header)
Templates and units
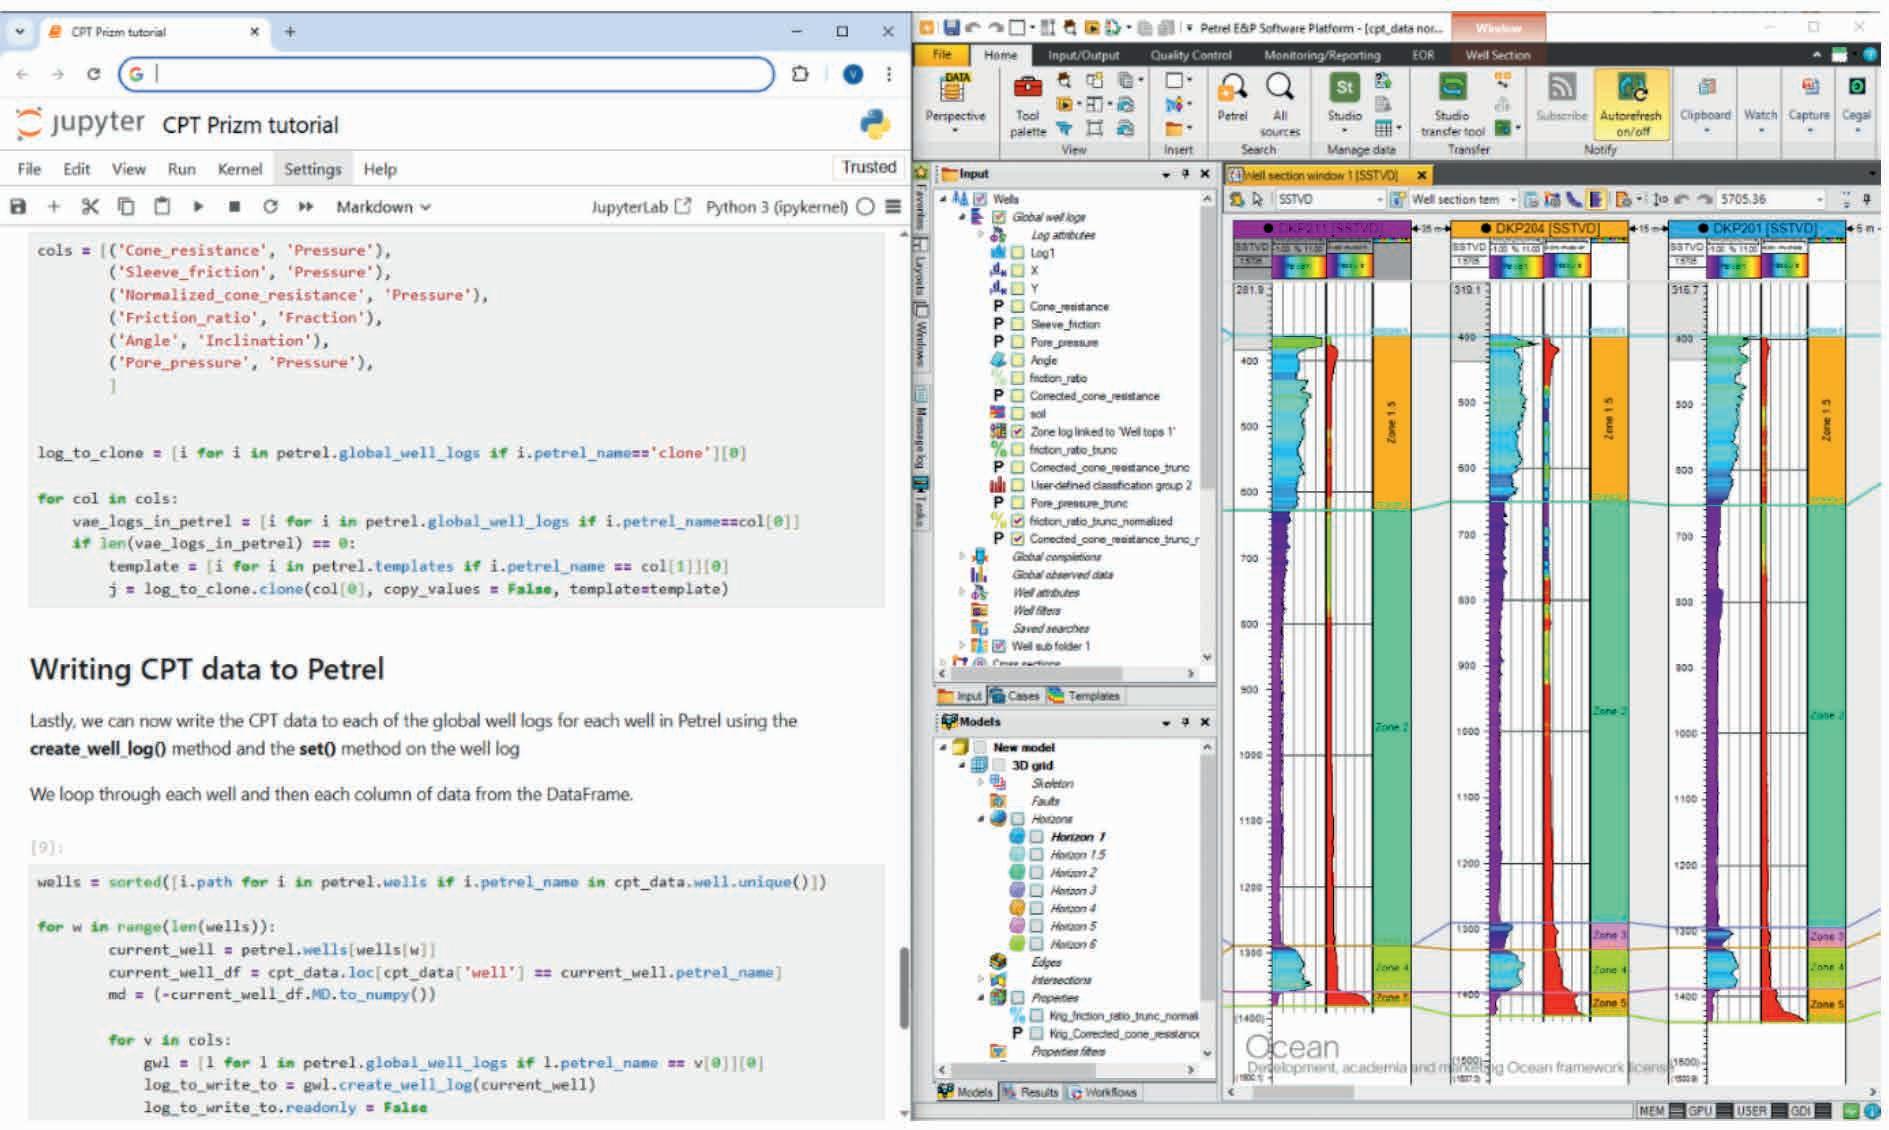
well object in Petrel with the corresponding measured data as well logs.
Using Python, we developed a script (or parser) that extracts the relevant data from the GEF header and data block in a structured and reliable way. GEF files have a regular structure with defined and standardised header contents, so the parser works for all valid GEF files. Once extracted to Python data formats such as arrays or DataFrames, it was possible to use the Prizm APIs to populate the Petrel project.
For each GEF file, a new well object was created inside Petrel, and the well header coordinates and well datum were set on the new well. Then, using the column information in the header, new global well logs were created with the necessary templates and units. Lastly the data block columns were set on new well log objects for the well, including cone resistance, sleeve friction, pore pressure, inclination, and friction ratio.
By enabling the ingestion of CPT data into Petrel, Prizm opened the functionality of this platform and its plugins to ground modelling workflows. We were able to apply advanced data analysis, data conditioning, interpretation and modelling tools to workflows needed in ground modelling for offshore wind. Here we demonstrate the value of these tools in carrying out soil behaviour type classification and 3D soil modelling. This project was undertaken in the following steps:
1. Loading CPT data into Petrel
2. Quality checking and conditioning data
3. Classifying soil behaviour type
4. Building 3D soil models
Loading CPT data into Petrel
100 GEF files from the Leendert de Boerspolder dyke (de Gast et al., 2017) were loaded into Petrel. Such man-made dyke structures, typical of the western Netherlands, are used as barriers to defend land against sea or for land reclamation. The CPT study included a grid of closely spaced CPT tests to investigate soil heterogeneity across the dyke. The results showed that the dyke is composed of sand, silt, clay and rubble. It has experienced compression of the softer layers (de Gast et al., 2019).
Using the Prizm APIs, we developed a Python script to load GEF files containing CPT data into a Petrel project. With this script, 100s of GEF files can be loaded to a Petrel project within minutes without requiring additional manual steps from the user (Figure 1). The prerequisite steps were setting up the project coordinate reference, and creating a well folder and an initial global well log.
Data quality checking and conditioning
Data quality checking was carried through multivariant statistics and extracting trends to identify outliers. Ingesting data into Petrel opened up the functionalities of many other applications that plugin to Petrel. For example, erroneous negative values were observed in Blueback Well Data Viewer (Figure 2, top). The logs with the observed negative values were plotted in Blueback Investigator to evaluate their significance (i.e., was this a serious issue or did it only apply to a few samples?) and determine any next steps (Figure 2, bottom). Speedy multivariant plotting enabled us to confirm that the erroneous values were relatively insignificant and did not pose a serious issue for the study.
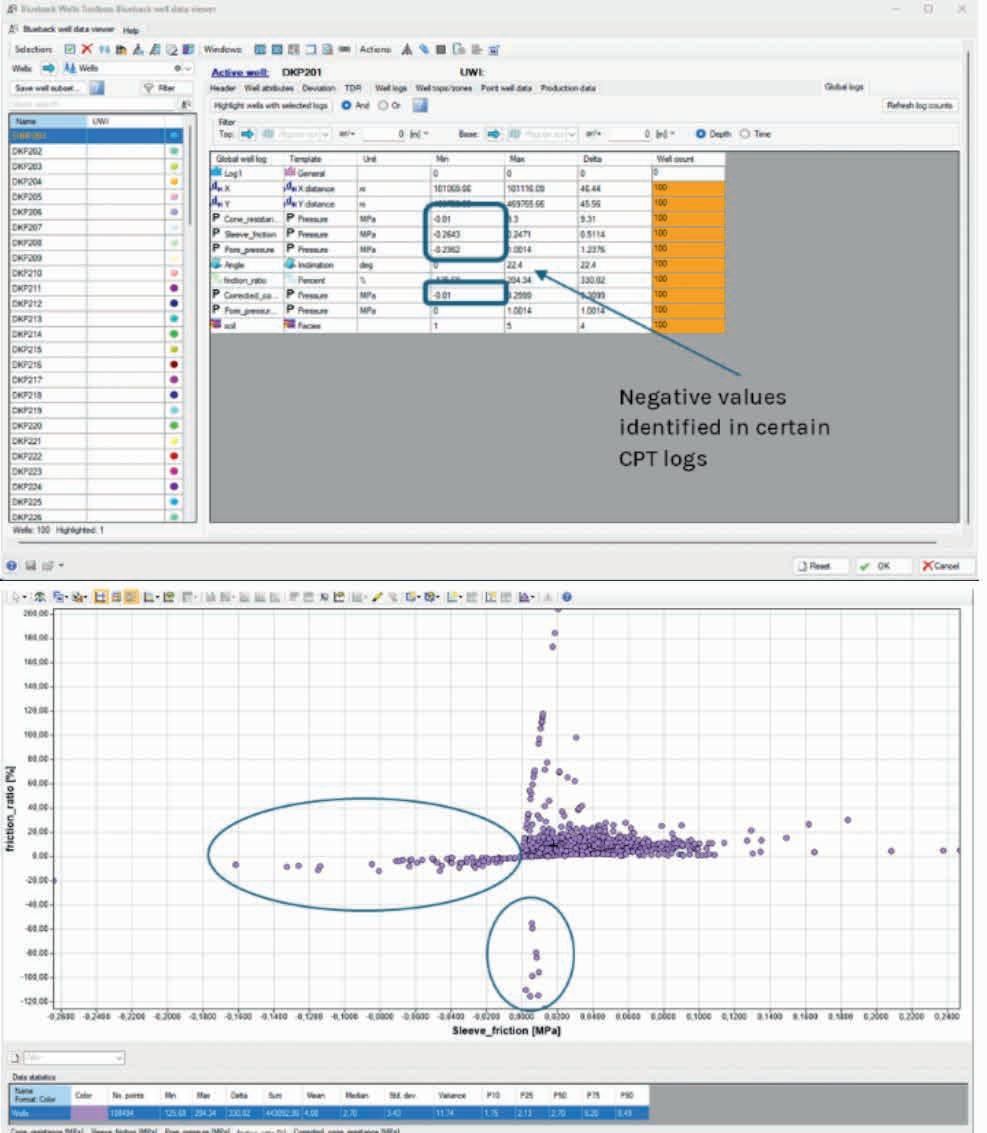
The data were conditioned to remove/correct erroneous values. For example, the logs with negative values were truncated at zero (values below zero set to zero) using the Petrel log calculator.
The final conditioning step was log normalisation. Normalised logs are a prerequisite to Robertson’s (1990) soil behaviour type classification, described in the next section. This classification is based on overburden normalised CPT logs, which were not present in the Leendert de Boerspolder dyke dataset. A simple min-max normalisation of the available logs was performed, to mimic the value ranges of the overburden-normalised CPT logs, so we could demonstrate the automated classification using Prizm and Blueback Investigator. The friction ratio was normalised between 0 and 10 and the corrected cone resistance was normalised between 0 and 1000.
Soil samples are not always obtained during CPT. Several methods have been developed to produce standard soil behaviour type classifications (Robertson 1990, Moss et al. 2006), using normalised and dimensionless cone penetration parameters calculated from the measured CPT data.
The classification scheme of Robertson (1990) and the soil type boundaries defined by Jeffries and Davies (1993), were converted to a Python function. Thus, the soil type classification could be applied immediately and automatically to the CPT data after the log conditioning in Petrel (Figures 3 and 4). The normalised cone resistance and normalised friction ratio was calculated from the CPT measurements using the equations in Robertson (2009).
The public Leendert de Boerspolder dyke dataset did not include formation tops to delineate the stratigraphy. Formation tops were
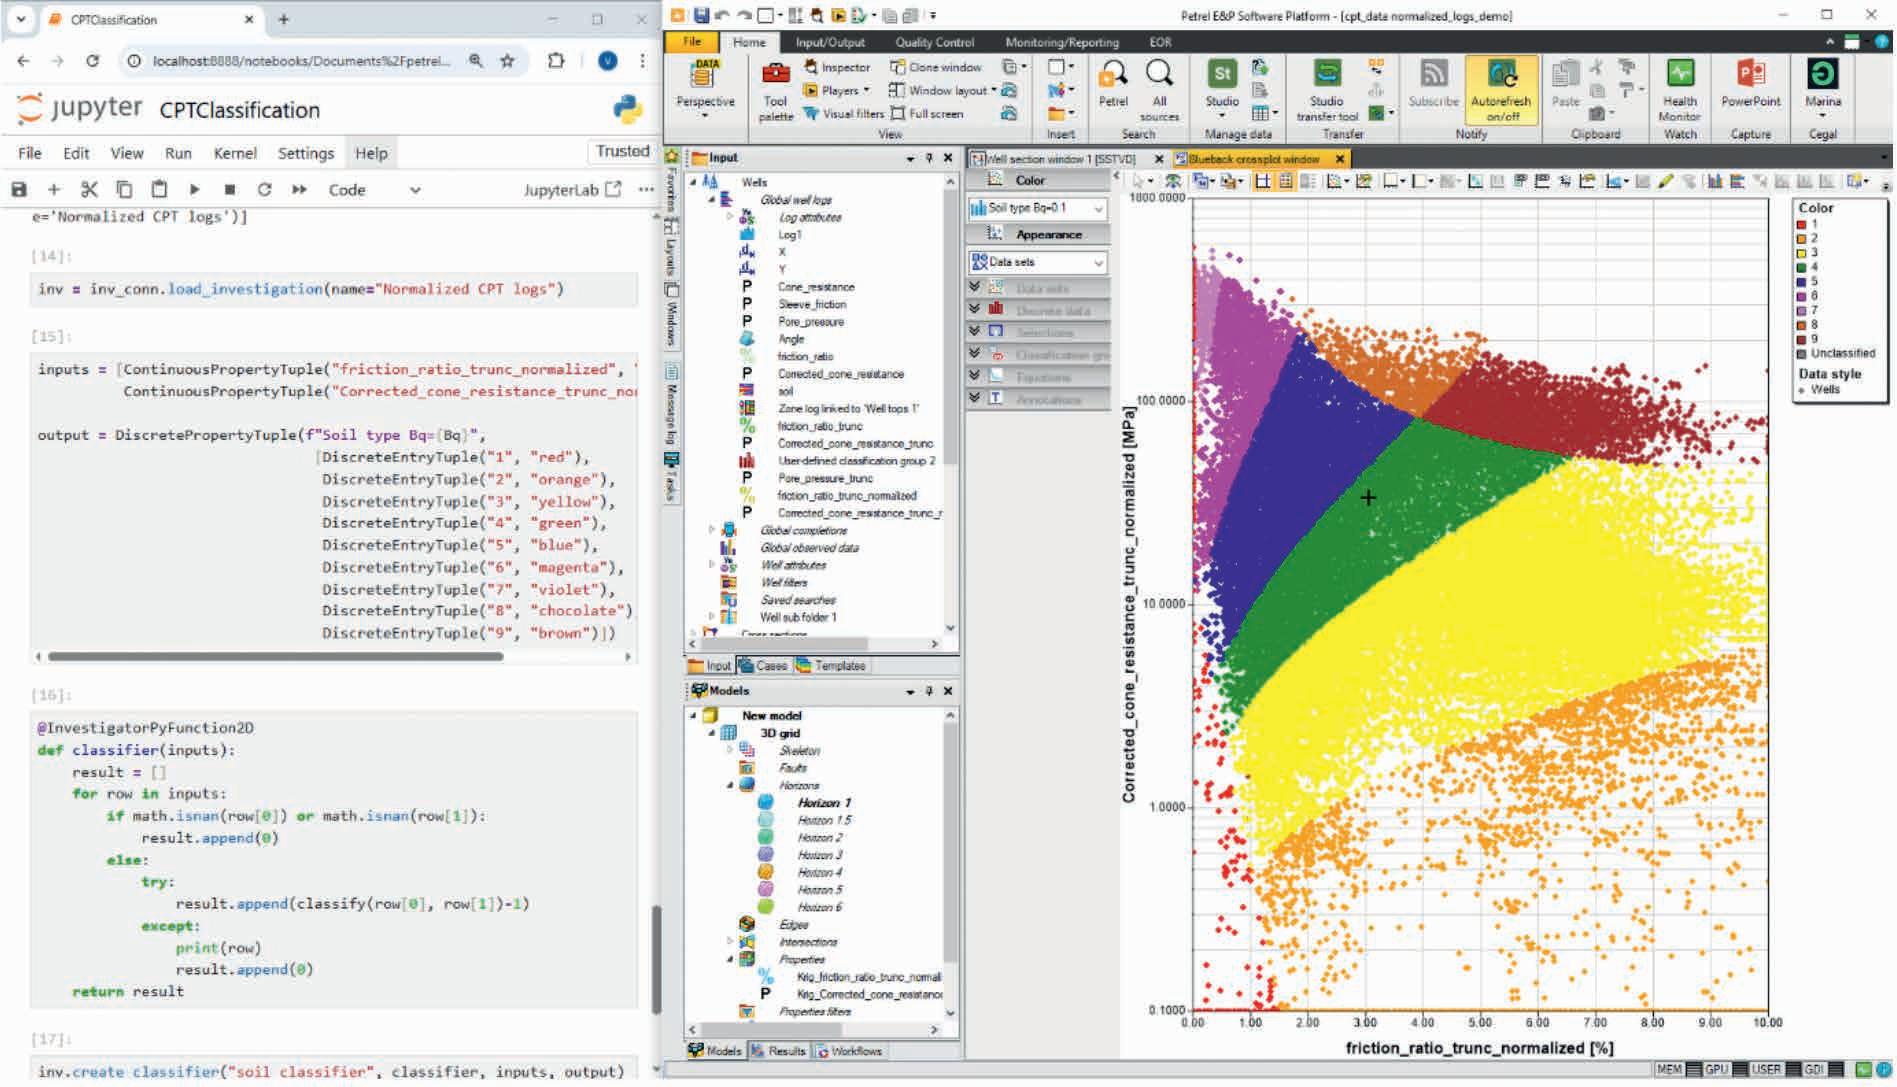
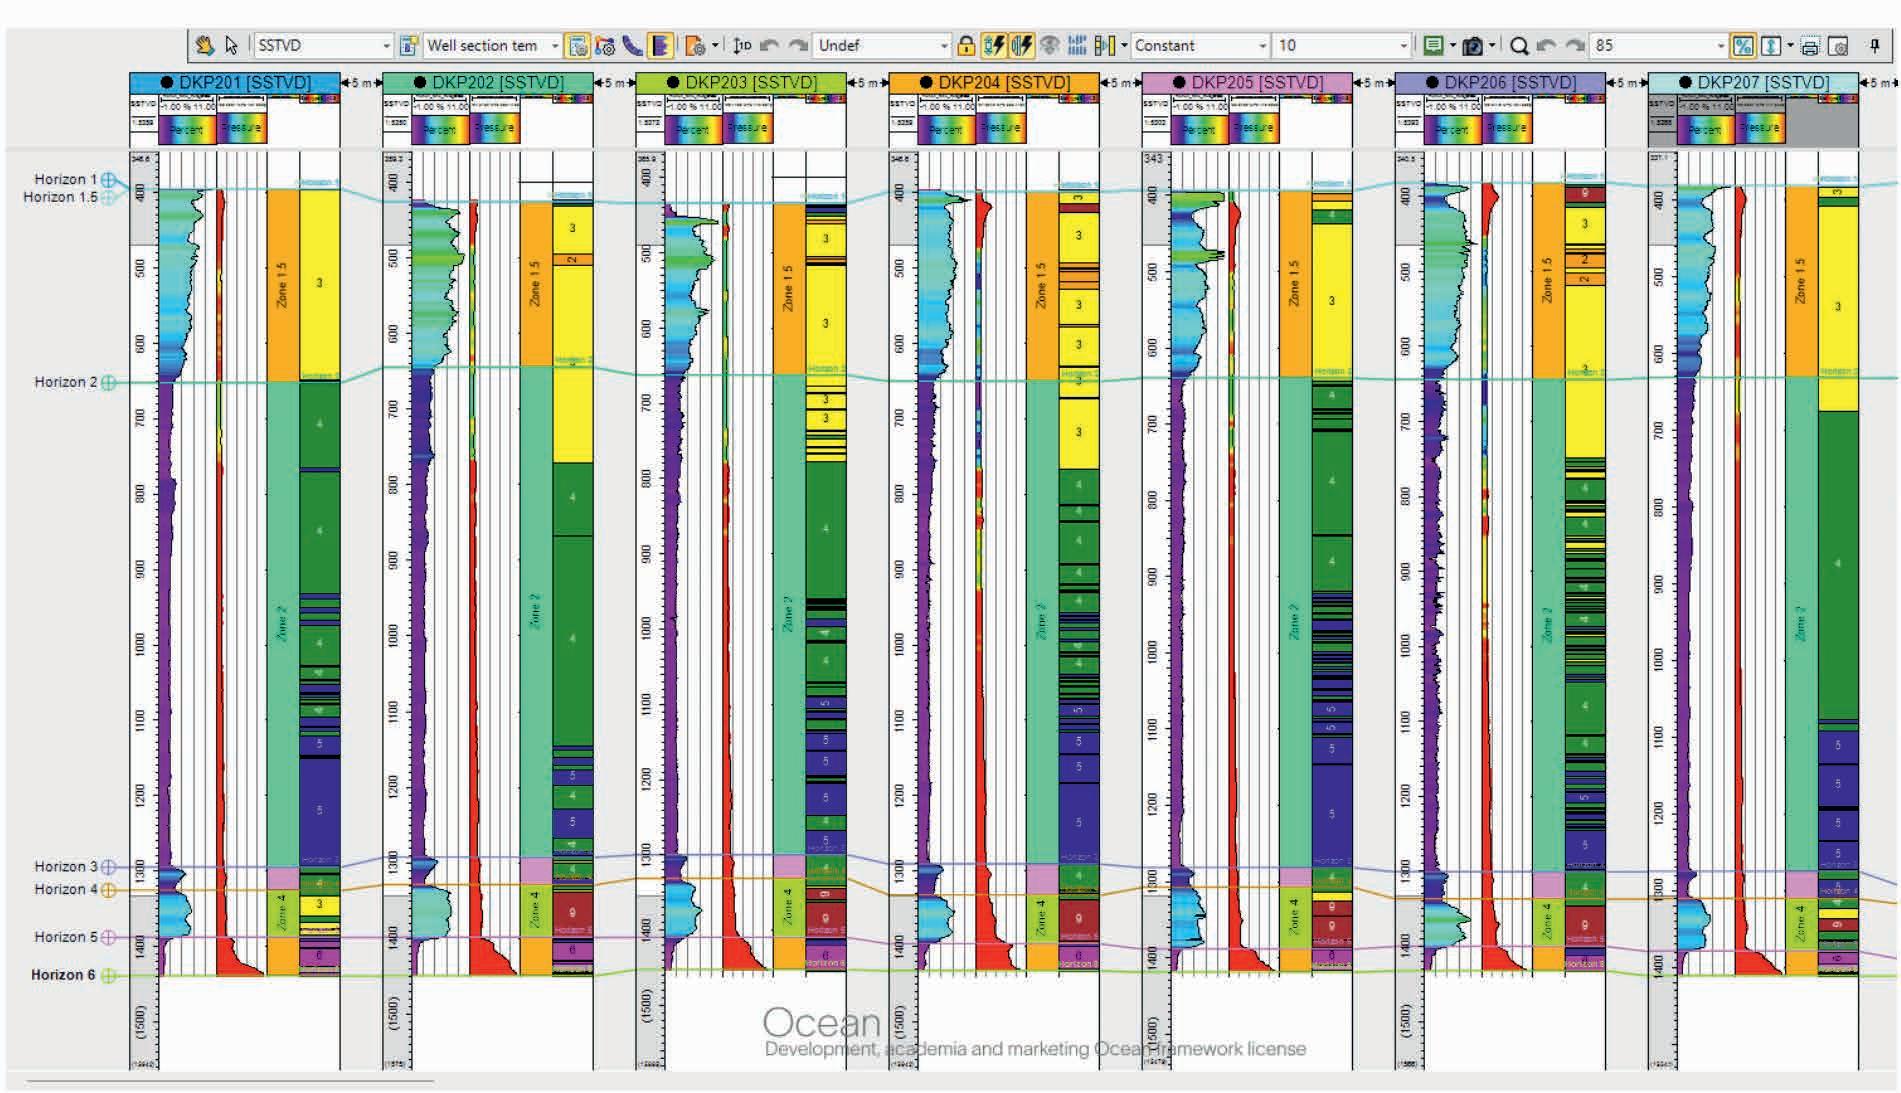
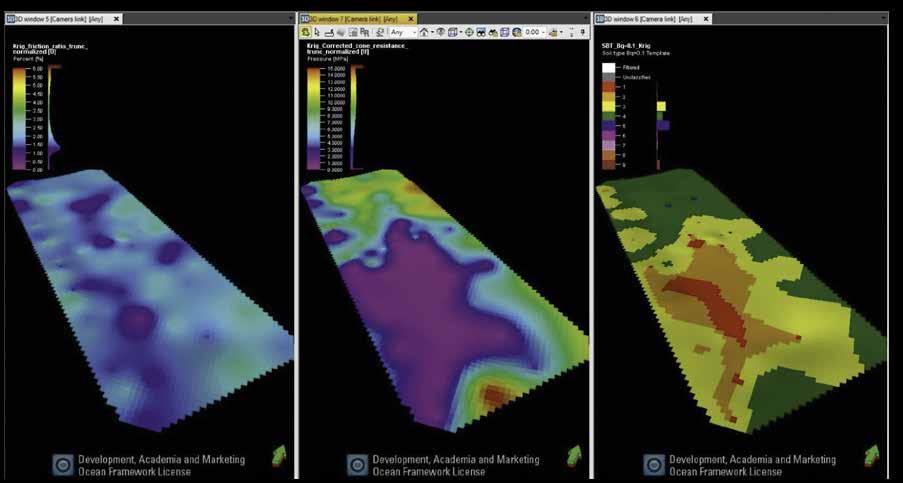
picked based on pore pressure, friction rate and corrected cone resistance logs. Where the stratigraphy was incomplete due to erosion or non-deposition, the missing well tops were inserted as collapsed tops on the first occurrence of a natural, present formation top, using Blueback Toolbox functionality. This ensured that the correct stratigraphic zonation was used when the model was built.
A simple 3D model was built based on the formation top stratigraphy (Figure 5). The normalised friction ratio and the normalised corrected cone resistance logs were upscaled and populated into the grid using the Kriging algorithm. The soil behaviour type classification was applied on the populated maps via Prizm and Blueback Investigator.
In some quarters, there is an ideological disinclination to use technologies designed for the E&P industry, owing to a percep-
tion that they are tainted by association. We argue that to enable a rapid transition away from hydrocarbons and towards renewable energy, the wind energy industry must leverage all available tools, and build on the decades of technological development facilitated by the E&P industry.
In this paper, we outlined the similarities between the LAS file type typically used for E&P well data, and the GEF file type typically used for cone penetration test data. Despite these similarities, the file types are not interchangeable.
We showed how Cegal Prizm, a Python interface for Petrel, can be used to circumvent this issue allowing CPT data to be ingested in Petrel. In this way ground modelling workflows can benefit from the advanced visualisation, analysis and 3D modelling provided by this platform. Prizm can further be used to streamline workflows. For example, we showed how a Python script can be deployed to partially automate soil behaviour type classicisation.
Access to the Petrel platform opens up a wide range of additional plugin applications that offer a multitude of advanced tools including rapid multivariant plotting, superior data analysis, and advanced data conditioning.
References
de Gast, T., Vardon P.J. and Hicks, M.A. [2017]. Estimating spatial correlations under man-made structures on soft soils. Proc., Geo-Risk 2017, Denver, GSP284, 382-389.
de Gast, T., Vardon, P.J. and Hicks, M.A. [2019]. December. Observations and considerations regarding estimating horizontal scales of fluctuation around linear infrastructure. Proceedings of 7th International Symposium on Geotechnical Safety and Risk (pp. 340-345). Taipei, Taiwan: Research Publishing.


Jefferies, M.G. and Davies, M.P. [1993]. Use of CPTU to estimate equivalent SPT N 60. Geotechnical Testing Journal, 16(4), 458-468.
Moss, R.E., Seed, R.B. and Olsen, R.S. [2006]. Normalizing the CPT for overburden stress. Journal of Geotechnical and Geoenvironmental Engineering, 132(3), 378-387.
Robertson, P.K. [1990]. Soil classification using the cone penetration test. Canadian Geotechnical Journal, 27(1), 151-158.
Robertson, P.K. [2009]. Interpretation of cone penetration tests — a unified approach. Canadian Geotechnical Journal, 46(11), 13371355.
Stuyts, B., Weijtjens, W., Jurado, C.S., Devriendt, C. and Kheffache, A. [2024]. A Critical Review of Cone Penetration Test-Based Correlations for Estimating Small-Strain Shear Modulus in North Sea Soils. Geotechnics, 4(2), 604-635.
ADVERTISEMENT

18 -20 NOV. 2025


Step into the forefront of subsurface innovation at the EAGE/FESM Conference on Petrophysics Meets Geoscience: Unlocking Reservoir Potential in a Dynamic Energy Landscape. From advanced rock physics to cutting-edge reservoir characterization, connect with leading experts and explore transformative solutions shaping the energy sector. REGISTER TODAY! and be part of the conversation driving the future of reservoir development.


Allan McKay1*, Luca Limonta1, Roberto Ruiz1, Bertrand Caselitz1, Bent Kjølhamar1, Christine Roche1, Enda O’Doherty 2 and Toby Harrison3 outline how use of an integrated 3D survey is a viable way to both improve the offshore wind site characterisation process and reduce the overall duration and cost.
Introduction
Prior to the construction of an offshore wind farm (OWF) geophysical and geotechnical site characterisation surveys are undertaken. One of the main purposes is to enable an integrated interpretation to characterise the structure and properties of key soil units, identify hazards – be they of natural or cultural origin – and enable reliable and safe foundation or anchoring systems to be selected and designed appropriately.
However, these site characterisation surveys can take multiple years as a sequential and iterative site characterisation survey strategy is often employed because of both structural and technical reasons. One key structural reason is that prior to contract award and/or a final investment decision project funding is limited and expenditure on site characterisation must be carefully managed. So initial survey scopes are usually limited to reconnaissance. A key technical reason is that interpreted geophysical data is required to both plan and derisk geotechnical surveys and guide the foundation design, i.e. determine where the subsurface needs to be investigated to ensure all soil units are sufficiently well sampled and tested both to enable robust characterisation, and to ensure safety of e.g. geotechnical operations.
A sequential and iterative survey strategy is sub-optimal and ultimately unsustainable with the growing scale of offshore wind developments, ambition to develop projects rapidly, and need to reduce the overall levelised cost of energy. In addition, many seismic surveys that are undertaken are 2D, and as the site characterisation phase progresses then multiple surveys may be undertaken with increasingly fine line spacing. Nevertheless, even after a multiyear campaign there can be both uncertainty about the spatial variability of key subsurface units and properties, as well as lack of flexibility in the placement of infrastructure such as Wind Turbine Generators (WTG). Such uncertainties – and the need to mitigate risk – can contribute to conservatism and over-engineering of structures such as WTG foundations e.g. using more steel than is necessary. Clearly, conservatism in engineering design is a cost driver, and has led to the development of modern design methods
that are tailored to the specific case of OW; see for example Zdravković et al. (2020). This kind of development of engineering design methods needs to be matched by geophysical methods.
Moving from 2D to 3D seismic methods reduces subsurface risk and uncertainty but it must be both necessary and cost-effective. The most obvious factor driving necessity is geological complexity, but it is by no means the only factor; see for example Caterall et al. (2025). In addition, prediction of geotechnical parameters (e.g. Klinkvort et al. 2024) and/or soil properties such as small strain shear modulus (e.g. Ruiz et al. 2025) using seismic data has progressed rapidly (see for example the review of Michel et al. 2025, and references therein). These kind of developments offer ways to ensure that the soil information in the seismic data is fully utilised, and to strike an optimal balance between e.g. soil properties inferred across the full subsurface volume of interest using seismic data and soil properties determined at discrete locations by geotechnical sampling and testing. However, most of this predictive work has been done using 2D seismic data that may not have been designed, acquired or processed with quantitative interpretation in mind. In addition, without 3D data methods to interpolate parameters and/or incorporate auxiliary parameters spatially such as geo-statistics and kriging must be employed. To realise the full potential 3D seismic data is necessary.
A key step in ensuring that geophysical surveys are cost effective was our development of an integrated geophysical and hydrographic survey incorporating 3D Ultra High Resolution (UHR) seismic data – using advanced processing and imaging methods – to characterise the seabed and shallow subsurface. This innovative survey approach was proven in a recent project in Northern Europe and is the subject of the brief case study described in this paper. A similar approach has been then employed on further projects. In addition, building on the idea that prediction of soil properties is key to enabling site characterisation survey activities to be optimised, we outline briefly examples that show progress. Finally, we will outline how use of an integrated 3D survey is a
1 TGS | 2 North Irish Sea Array | 3 Gavin and Doherty Geosolutions
* Corresponding author, E-mail: allan.mckay@tgs.com
DOI: 10.3997/1365-2397.fb2025077
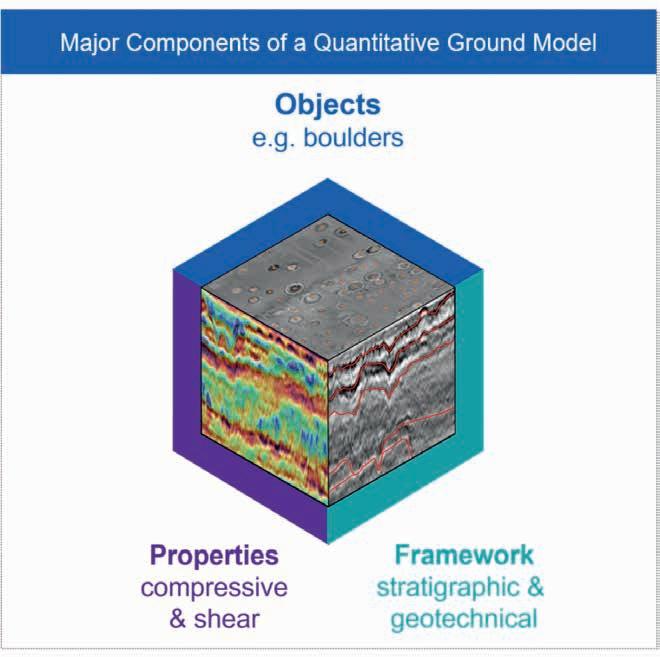
viable way to both improve the OW site characterisation process and reduce the overall duration and cost.
Typical survey objectives, geophysical methods and practicalities
Typical geophysical site characterisation survey objectives are usefully discussed with reference to the Quantitative Ground Model (QGM) that is a part of the overall collation of all available site information; see for example OSIG (2022).
There are three major components of the QGM as shown in Figure 1: the overall framework that defines the major soil units of interest, the properties of each soil unit, and hazards such as
subsurface boulders. The areal extent and depth of interest for a QGM for an industrial scale windfarm is of order 100 km2 and 100 m below the seabed respectively. The scale highlights one of the challenges: cost-effective site characterisation across large spatial scales whilst ensuring resolution at the sub-metre scale. For example, in former glaciated margins one common survey objective is to be able to detect and locate small hazardous objects such as seabed and subsurface boulders smaller than 1 m. Another is to define the main soil units that can include thin, dense, high strength soil units such as glacial tills. Both present a construction risk and affect the choice of foundation type which can adversely affect development costs.
An integrated 3D UHR seismic survey includes all geophysical measurements necessary to characterise the static properties of both the seabed and shallow subsurface, as well as provide data to identify cultural objects that may be hazardous (e.g. unexploded ordnance) and/or have cultural significance (e.g. shipwrecks). The geophysical sensors used, and purpose are outlined in Table 1.
To ensure the survey is cost effective, and can be performed in a single-pass fashion where all data are acquired simultaneously, necessitates using a capable survey vessel that has sufficient space to accommodate all the required equipment and can remain at sea for extended periods of time without recovering all sensors during inevitable periods of poor weather, or for regular portcalls. A sketch of the sensors and how they can be deployed from the vessel is shown in Figure 2.
Careful line planning is needed as part of the survey design and planning process. Whilst the sub-bottom profiler and magnetometer are usually constrained to the vessel and side scan sonar tracks, complete seabed and subsurface data coverage over the defined survey area(s) is usually needed for 3DUHR, MBES and SSS. The swath coverage that can be achieved is constrained by both the survey area conditions (e.g. water depth and sea-conditions) as well as the survey goals (e.g. resolution requirements).
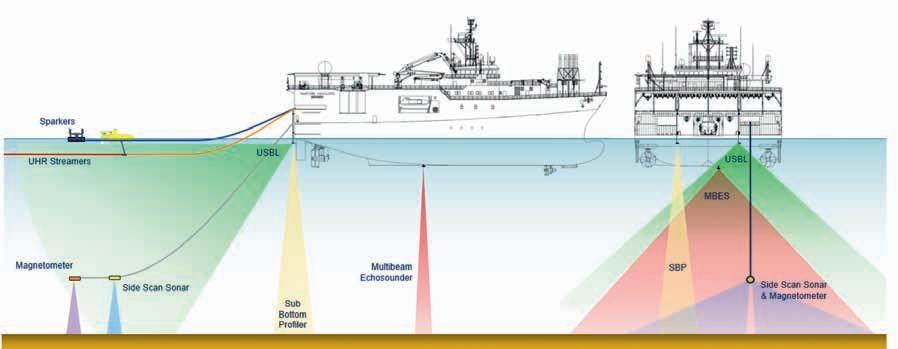
Sensor
Sparker Sources/ UHR Streamers
Purpose
3D Imaging of the subsurface at meter/sub-metre scale
Multibeam Echo Sounder (MBES) Bathymetric mapping of sea-bed depth, morphology and features
Side Scan Sonar (SSS) Mapping of seabed objects and features
Sub Bottom Profiler (SBP) Near-surface 2D imaging at sub-meter scale
Magnetometer (MAG) Detection and mapping of ferrous objects
Figure 2 Sketch showing various geophysical sensor platforms deployed.
Table 1 Geophysical and hydrographic sensors deployed in an integrated 3D UHR survey and outline of the main purpose of each. Note that the spatial and temporal frequency of UHR encompasses that of Extremely High-Resolution seismic data e.g. with temporal sampling rates of a fraction of milli-second and sub-metre spatial resolution; see Hill et al. (2024).
As outlined in Widmaier et al. 2023 utilisation of multiple wide-tow sources and streamers enables the sail-line efficiency, near-offset coverage, sampling and resolution of UHR 3D seismic acquisition to be optimised especially in the shallow waters (e.g. 15-60 m) typical for bottom fixed offshore wind. Furthermore, Caselitz et al. 2025 demonstrate that whilst the typical processing and imaging workflows are based on high resolution exploration and production 3D seismic methods, special attention to the processing of UHR data before migration and imaging is required to maximise bandwidth (e.g. with both inversion and machine learning-based de-ghosting methods) and to remove the effects of sea conditions as the 3D UHR sources and streamers are towed relatively shallow in the water column.
Here we outline a case example from a first of a kind project where an integrated hydrographic and geophysical survey incorporating 3D UHR seismic data was undertaken. To the best of our knowledge this was the first time that all geophysical sensors such as Multibeam Echo Sounder, Side Scan Sonar, Sub bottom Profiler and Magnetometer were acquired together with full-coverage 3D UHR seismic data in a single-pass fashion.
Survey objectives
The survey was designed to both map and image in detail the seabed and subsurface soil units in 3D UHR across the full site of approximately 100 km2. One of the key aims was to enable micro-siting of WTGs as earlier studies and the geological setting indicated a complex subsurface. The complexity drove one of the technical objectives of being able to identify subsurface boulders that can damage piles during installation. Hence, all three aspects of the QGM outlined previously were being investigated.
Efficiency was a key consideration to ensure that the survey duration was kept to a minimum. In addition, for practical reasons (e.g. to minimise disruption to fishing activities) the survey was undertaken towards the end of the summer season. Therefore, an important consideration was ensuring that the line-plan and survey strategy was realistic and would not generate excessive data infill on a particular geophysical sensor thus compounding weather risk and increasing survey duration.
The detailed nature of the survey included objectives such as identification of 30 cm objects on the seabed and small hazardous subsurface objects such as boulders. In practice that meant that e.g. the vertical resolution of the UHR data needed to be less than 50 cm. Careful survey design and planning was required to ensure that both the technical and operational objectives could be met as a whole, as well as individually for each geophysical sensor. Our survey design incorporated the use of 10 UHR streamers, 130 m long, spaced 12.5 m apart and four wide-tow sparker sources. The group interval of each 48-channel streamer was split between 1.5625 and 3.125 m across the first 12 and remaining 36 channels in the mid/tail streamer sections respectively; the temporal sampling interval was 0.125 ms. The design enabled an efficient line-plan with the vessel sail-line spacing being 62.5 m whilst the 3D seismic imaging to be undertaken with a horizontal spacing of 1.5 m and vertical resolution of about 0.25 m. In addition, to ensure that the line-plan could be satisfied two
multi-beam sensors were installed to increase the bathymetric swath coverage. Deployment of a (nadir) gap-filling side scan sonar was evaluated but considered unnecessary, assuming the line-plan could be adhered to.
Rapid and prompt turnaround of survey deliverables was key. Given the scale of the survey and number of sensors deployed the data volumes were significant: several terabytes of raw data were generated each day. Therefore, high bandwidth satellite connectivity was used to ensure that the survey data could be supplied continuously to office-based staff to enable processing and interpretation to continue in parallel with data acquisition.
The survey started mobilisation in early September and completed towards the end of October. Despite being undertaken in early autumn and experiencing inevitable periods of poor weather the vessel remained on site during periods of weather standby with all survey equipment except the sparker sources deployed in safe standby mode e.g. streamers deployed deep. This enabled operations to begin quickly as the weather improved and was possible because the survey vessel was designed for long endurance surveys, as are the technical solutions designed and employed to enable safe standby mode.
As is to be expected in any first of a kind project there were challenges, with valuable learnings. Indeed, there were sleepless nights for all key personnel on the project team but close collaboration across the full project team – vessel and office-based staff - ensured that all remained focused on the desired outcome: a safe and successful survey. In line with the saying that ‘the proof is in the eating of the pudding’ the survey completed successfully with all key Health, Safety and Environmental performance indicators being met.
Interpretation of the data is ongoing but there is no doubt that interpreted survey data deliverables have generated new insights for the project development team that are both important and valuable in terms of both foundation design and installation. In addition, the data offers new insights of wider project stakeholder and cultural interest such as added information about potential wrecks. Here we highlight three main examples, based on each element of the QGM introduced earlier, to show the potential of this kind of an integrated approach in terms of interpretation outcomes with a focus on the 3D UHR seismic data and the quantitative integration of geotechnical data.
The first example illustrates the potential of 3D UHR seismic data to go beyond structural imaging and map more detailed and subtle changes in soil properties such as soil-stiffness that are significant for both WTG foundation design and installation. One of the subsurface challenges is that reconnaissance geotechnical testing showed a marked stiffness change in chaotic glaciomarine/glaciolacustrine sediments overlying the bedrock. However, the spatial extent of the stiffness change is uncertain: it does not generate strong, spatially continuous and easily interpretable reflections. Nevertheless, having access to 3D UHR seismic data enables the extraction of many different seismic attributes across
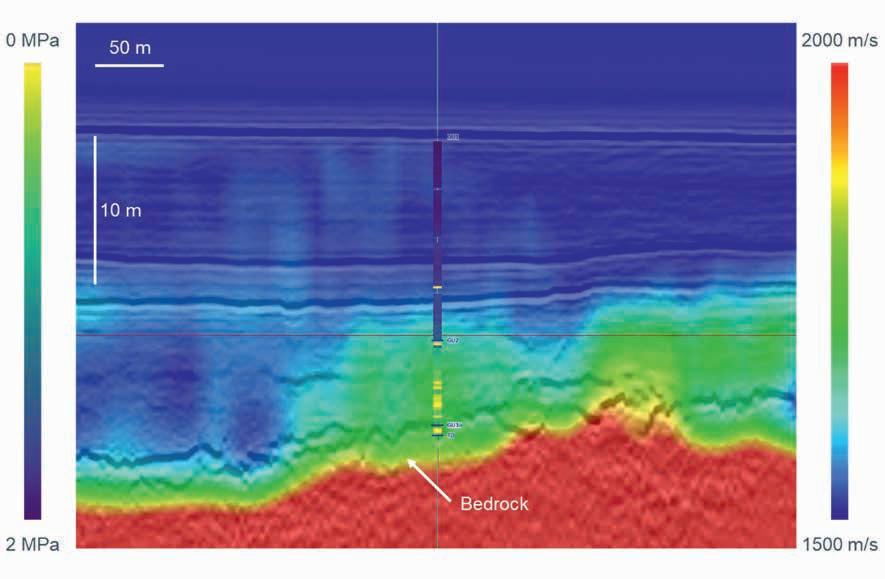
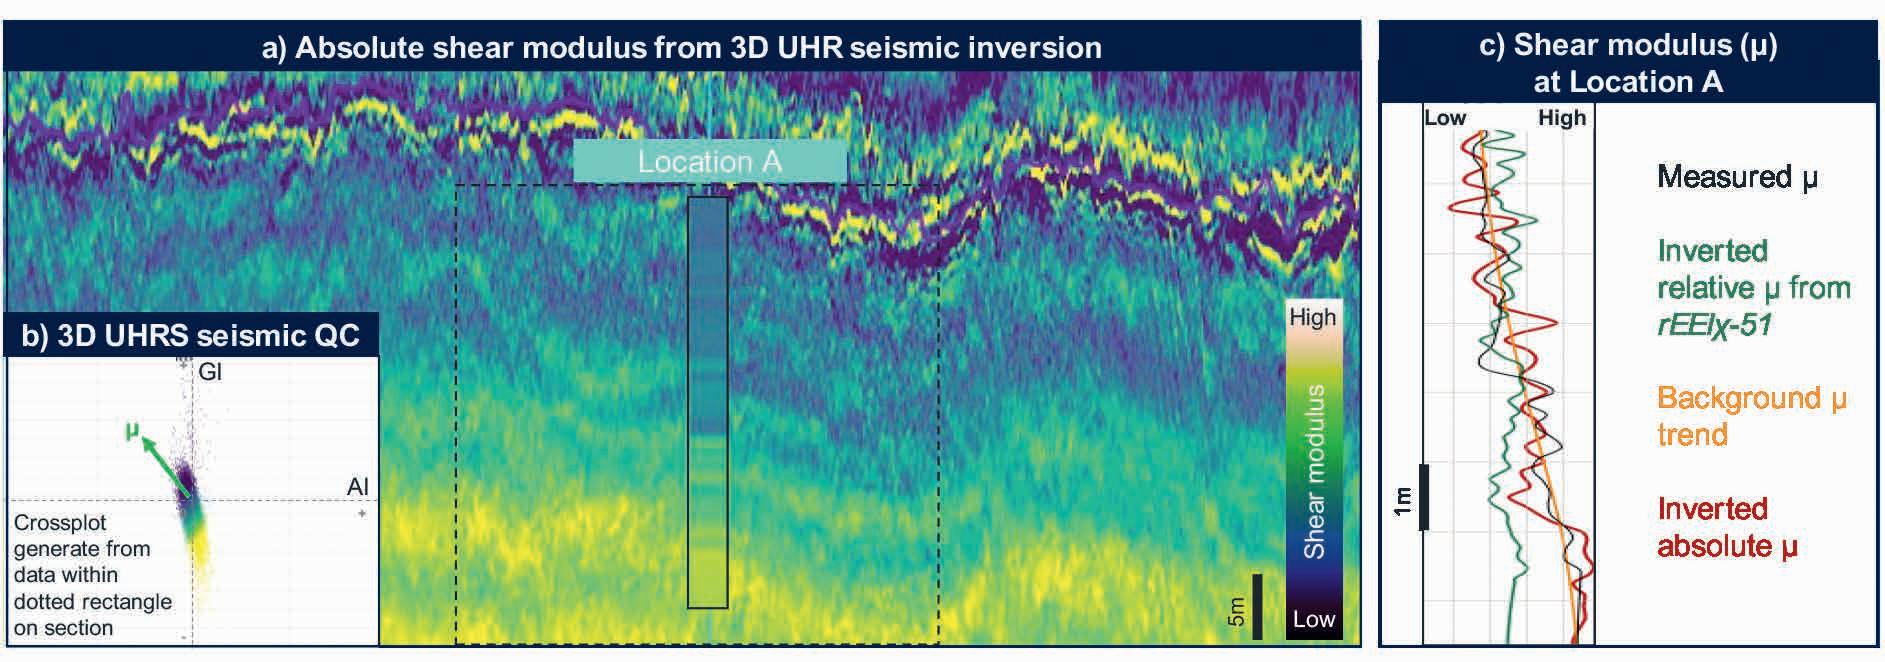
the site, and changes in seismic velocity – a fundamental and key attribute of seismic imaging – appear to be correlated with the stiffness change. This correlation motivated further analysis.
Whilst time-based seismic imaging methods have mainly been employed in offshore wind, and are often sufficient from a structural imaging perspective to highlight major features of interest, the associated velocity models are smooth and do not necessarily honour the interface between soil units. With more advanced depth-based imaging methods, high-resolution velocity models that are conformal with geological structure and soil-units, and consistent with geotechnical parameters, can be derived. Figure 3 shows an example from a pre-stack Kirchoff based depth-imaging workflow where a tomographic velocity modelling approach was used; see Limonta et al. (2025a) for more details. The example shows that while a major change in subsurface velocity occurs at the sediment/bedrock interface more subtle soil-property changes in some areas in the overlying sediment - the chaotic units of interest – are captured as changes in velocity. These subtle changes in velocity clearly vary spatially and correlate well with an important change in soil-stiffness, as can be seen by the correspondence with the overlain CPT cone resistance in Figure 3: both are positively correlated.
The second example goes beyond observation of soil property changes via qualitative comparison of geophysical and geotechnical data and into the realm of quantitative soil property prediction. In Figure 4 we show the prediction of the small strain shear modulus that is a fundamental measure of a soil’s stiffness. The prediction used pre-stack inversion of the 3D UHR data for Acoustic and Gradient Impedance as part of the relative Extended Elastic Impedance method (see Went 2025, and references therein). The low frequency model – to transform from relative to absolute quantities – was estimated using a parametric transform between compressional wave velocity and shear modulus derived from the limited set of geotechnical measurements available and applied to the seismic velocities. As shown in Figure 4 (C) the predicated and measured shear modulus at the geotechnical testing location match well, highlighting the robustness of the proposed workflow; see Ruiz et al. (2025) for more details.
The third example highlights the reduction of subsurface uncertainty because of access to multiple geophysical datasets and moving from only interpretation of 2D profiles to 3D data volumes. As noted earlier one of the key aims was to enable micro-siting of WTGs and this drove one of the aims of being
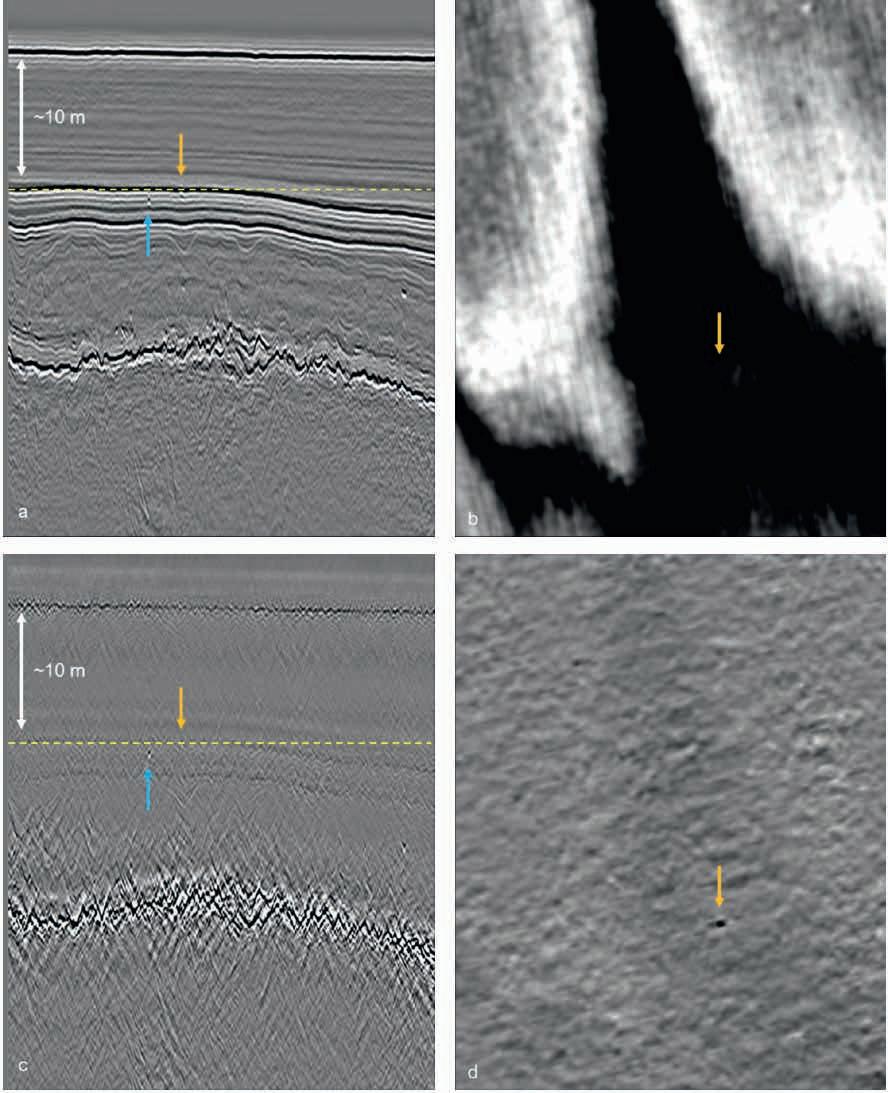
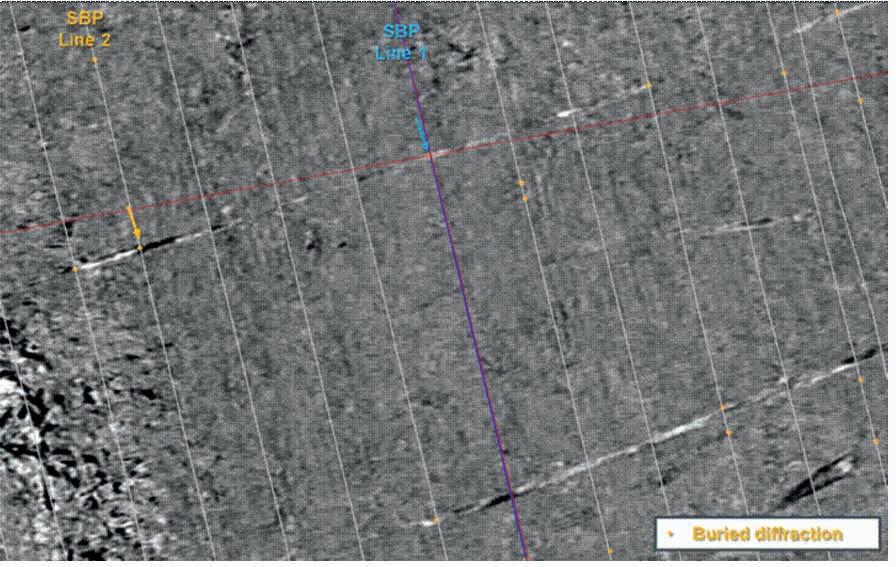
able to identify subsurface boulders. Despite the efficiency of the survey, it was possible to detect and isolate small subsurface features at depth. To do so, the 3D data were imaged using a diffraction imaging workflow where diffractions are separated from the dominant reflection events pre-migration, and then
Figure 5 3D UHR Inline Section (a,c) and time slices (b,d). The top images show Full stack; the bottom images are the diffraction imaging volumes. Point contacts are shown by the arrows. Note how a potential point contact is obscured by a strong reflection event but is clearly observed in the diffraction volume.
Figure 6 Time slice through the 3D UHR volume with 2D SBP lines (grey/purple lines) overlain. Orange dots show point contacts from only SBP interpretation: note how the orange dots correlate with the obvious linear features interpreted to be iceberg scour marks.
the 3D diffraction data are migrated to locate the feature in 3D space that caused the diffraction; see Figure 5 that shows detection and isolation of potential boulders about 1.5 m in size, and Limonta et al. (2025b) for more details. One of the key learnings is that while there are undoubtably subsurface boulders present
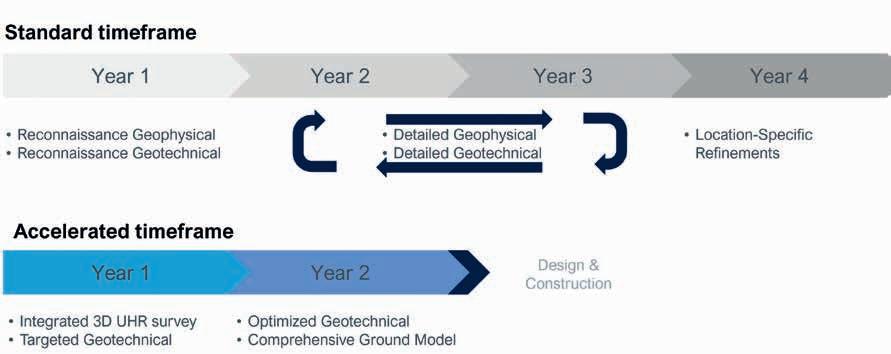
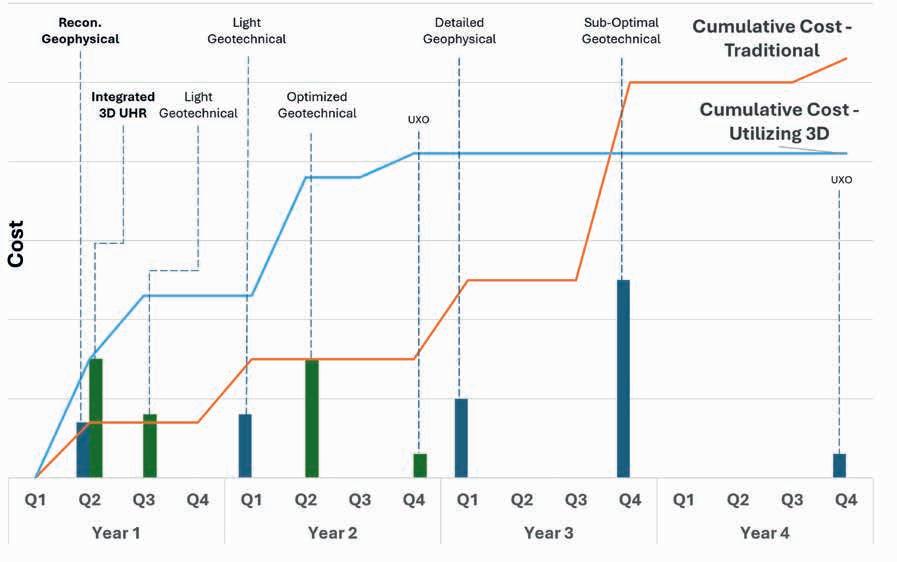
there are fewer than might have been expected had the sparse and limited insight from 2D data been all that is available to the team. As illustrated in Figure 6 numerous potential boulders were found initially via interpretation of the 2D SBP data. However, when the SBP data are interpreted together with the 3D UHR seismic data it is clear that the source of the majority of these anomalies is strong linear features that are interpreted to be iceberg plough marks created by icebergs scraping along the former muddy paleo seabed.
An integrated 3D survey acquired early in the site characterisation process negates the need for multiple geophysical surveys to move from reconnaissance to detailed surveys. Thus, as illustrated in Figure 7, adoption of an integrated 3D UHR survey from an early stage in the offshore site characterisation process can shorten the overall timeline for site characterisation considerably. In addition, by utilising high-bandwidth satellite connectivity relevant survey data can be supplied continuously to office-based staff to enable processing and interpretation to proceed in parallel with data acquisition. This shortens the time between data acquisition and interpretation and therefore the complementary geotechnical site characterisation survey can proceed concurrently, or back-to-back with the geophysical survey. In contrast, a traditional site characterisation survey strategy usually allows at least a few months to elapse between geophysical and geotechnical surveys, and this may mean that the geotechnical
survey can only be executed the following year which is clearly inefficient.
There are numerous different ways that a time-reduction of site characterisation activities can translate to a reduction in the cumulative cost of the site characterisation work or be considered in terms of overall value to an offshore wind project (e.g. quicker route to electricity generation if site characterisation is on the critical path of the project). Ultimately analysis needs to be undertaken on project basis with a view of controlling factors and constraints, such as site complexity and the regulatory environment, to ensure it is robust. However, an illustrative comparison can be made if we consider the potential optimisation of geotechnical sampling and testing with a view to reducing the overall survey scope, even if the reduction in overall geophysical survey costs – due to fewer surveys being performed – are marginal. This has a clear cost impact for any project as geotechnical sampling and testing is necessary, and accounts for greater than half of the seabed and subsurface site characterisation budget; see for example the overview of windfarm costs in the UK compiled by BVG Associates (2025) on behalf of various UK governmental and trade bodies. Also, geotechnical survey activities could account for up to about 80% of the site characterisation cost if separate geophysical and hydrographic surveys are forgone. This kind of comparison is shown in Figure 8 and it is clear that while more may be spent in the earlier phase of site characterisation (see the cumulative costs in Year 1 on Figure 8) the overall cumulative cost could be lower with optimisation of the detailed geotechnical survey.
A single pass integrated geophysical and hydrographic site characterisation survey incorporating full coverage 3D UHR seismic data enables seabed and subsurface soil units to be delineated, soil properties estimated and hazardous objects identified. Incorporation of such an integrated 3D survey into the site characterisation survey strategy during the offshore wind project’s development phase should at the very least enable a decrease in the number of geophysical surveys that need to be undertaken to characterise the static properties of a site. However, as the case example outlines, high quality UHR 3D data and a limited sample of geotechnical data enable key soil properties to be estimated. These kinds of methods will enable optimisation of geotechnical sampling and testing surveys, with the QGM being a key decision tool in this respect e.g. being used to help decide where sampling and testing could be done on a given site with a complete 3D view of subsurface soil unit and property variability. As outlined these efficiency gains could translate to a reduction of the cumulative cost of site characterisation even if the cost of an integrated 3D survey is greater than the cost of an early phase reconnaissance survey.
The authors wish to thank the wider North Irish Sea Array Offshore Wind Farm team for their support and permission to publish the case examples, as well as the numerous TGS colleagues who have contributed to this work and made it a success.
References
BVG Associates. [2025]. Guide to an Offshore Wind Farm, Published on behalf of The Crown Estate, Crown Estate Scotland, Offshore Wind Growth Partnership, ORE Catapult, and the Scottish Enterprise Agencies: Scottish Enterprise, Highlands & Island Enterprise and South of Scotland Enterprise. https://guidetoanoffshorewindfarm.com/wind-farm-costs/ accessed August 2025.
Caselitz, B., McKay, A., Widmaier, M., Oukili, J., Davies, D. and Pernin, N. [2025]. Harnessing 3D ultra-high-resolution seismic technology for offshore wind farm development: Advancements, challenges, and future prospects. The Leading Edge, 3, 170-177.
Catterall, V., Arlott, L., Clarke, L., Cottee, J. and Morris, J. [2025]. Drivers for acquiring 3D UHRS data across offshore windfarms. Proceedings of the 5th ISFOG 2025, ISBN 978-2-85782-758-0.
Hill, A.W., Nicol, G. and Cook, M.R. [2024]. A proposed standard seismic frequency nomenclature for geophysical site investigation surveys in the offshore energy sector. First Break, 42(11), 37-41.
Klinkvort, R.T., Sauvin, G., Dujardin, J., Griffiths, L., Vardy, M.E. and Vanneste, M. [2024]. Cone Penetration Testing Prediction Using Seismo-Acoustic Data. 85th EAGE Annual Conference & Exhibition, Extended Abstracts.
Limonta, L., Caselitz, B., Ruiz, R. and Kjølhamar, B. [2025a]. 3D UHRS Depth Velocity Model Building for Offshore Wind Farm Site Characterization. 6th EAGE Conference and Exhibition on Global Energy Transition – Offshore Wind Energy Conference.
Limonta, L., Roche, C. and Kjølhamar, B. [2025b]. 3D UHRS Diffraction Imaging for Point Contact Detection in Offshore Wind Site Surveys. 6th EAGE Conference and Exhibition on Global Energy Transition – Offshore Wind Energy Conference.
Michel, G., Coughlan, M., Stanca, R., Narozny, R., Trindade, L. and Joseph, T. [2025]. A review of benefits and pitfalls for prediction of geotechnical parameters in offshore wind ground models. Proceedings of the 5th ISFOG 2025, ISBN 978-2-85782758-0.
OSIG Renewables Guidance Notes. [2022]. Guidance Notes for the Planning and Execution of Geophysical and Geotechnical Ground Investigations for Offshore Renewable Energy Developments. ISBN 0 906940 59 1.
Ruiz, R. and Limonta, L. [2025]. Pre-stack 3D Ultra High-Resolution Seismic inversion for shear modulus prediction. 6th EAGE Conference and Exhibition on Global Energy Transition – Offshore Wind Energy Conference.
Went, D. [2025]. A graphical approach to determine the relationship between intercept, gradient, and the common seismic rock properties: Global model and application. The Leading Edge, 3, 224229.
Widmaier, M., Roalkvam, C. and Orji, O. [2023]. Advanced 3D seismic crossover technologies between hydrocarbon exploration, CCS development, and offshore wind. First Break, 41(11), 5358.
Zdravković, L., Jardine, R.J., Taborda, D.M.G., Abadias, D., Burd, H.J., Byrne, B.W., Gavin, K.G., Houlsby, G.T., Igoe, D.J.P., Liu, T, Martin, C.M., McAdam, R.A., Wood, A.M., Potts, D.M., Gretlund, J.S. and Ushev, E. [2020]. Ground characterization for PISA pile testing and analysis. Geotechnique, 70(11), 945960.


Be part of the First EAGE Offshore Workshop “Seismic to Simulation”: Workshop Series in Kuwait, bringing together top professionals and researchers to discuss breakthroughs, share expertise, and drive the future of offshore exploration and production.
Reserve your spot!


Second EAGE Workshop on Advances in Carbonate Reservoirs: from Prospects to Development
Don’t miss the opportunity to showcase your research at the Second EAGE Workshop on Advances in Carbonate Reservoirs: from Prospects to Development — submit your abstract today and contribute to shaping the future of carbonate reservoir exploration and development.
Abstract Submission Deadline: 30 November
Dr Graeme Nicoll1* and Dr Paul Helps1 present an approach to applying geological subsurface screening methods for the exploration of lithium, a critical mineral required for the Energy Transition.
Introduction
The Energy Transition is being driven by the need to mitigate climate change through a progressive global switch to lower carbon energy sources. Critical minerals such as lithium, copper, cobalt and rare earth elements will be needed in ever greater amounts for electrification and infrastructure upgrades as well as for providing the raw components for advanced electronics, military hardware, electric vehicles, renewable energy generation and battery storage. These materials and their usage are also increasingly becoming the focus of global geopolitics. Among the clean energy minerals we need to rapidly scale up and secure the production of is lithium (Figure 1), which is the focus of this article.
The lithium market has faced significant challenges recently due to production cuts, shifting demand patterns, and geopolitical tensions. After recent oversupply fears, the global lithium market is, however, starting to tighten once again, with a projected return to deficit in the next few years.
So, what is this vital element, and more importantly, how do we find more of it efficiently?
Lithium (Li) is a soft, silvery-white alkali metal with an atomic number of 3, making it the lightest metal and a solid element. Lithium is not rare per se, and occurs in many rock-forming minerals, but needs to be concentrated into ore deposits of economic grade to make it worthwhile to extract. Lithium is primarily concentrated in magmatic environments but is also found in low background levels (~20ppm) in the world’s oceans, lakes and lakeside sediments, where additional natural concentration processes can occur. Currently, hard-rock lithium pegmatite deposits account for approximately half of the global lithium production, the majority of which are mined in Australia (e.g., Greenbushes). The largest lithium resources are dominated
by the South American brine-type deposits, such as Chile’s Salar de Atacama and Bolivia’s Salar de Uyuni (Benson et al., 2017).
There is, however, a growing interest in dissolved lithium, such as in oilfield formation waters, suggesting that economic opportunities may have been missed for co-production. For example, if lithium-rich formation waters from the Permian basin were artificially concentrated, they could potentially produce 787 metric tons of Li2CO3 per day (Robichaud & Robichaud, 2019), equating to approximately >$10 million per day, at current prices. The value of this lost potential has fluctuated considerably since 2019, due to the discussed lithium market challenges (e.g. Els, 2022), but it remains a valid point.
Taking applicable geological subsurface screening methods from the hydrocarbon industry, we have begun applying them, within a wider mineral systems approach, to metal exploration (for example Wrobel-Daveau & Nicoll, 2022, Helps and Nicoll, 2024, Helps and Nicoll, 2025). For instance, as discussed below, using a source to sink mentality, typically used in sediment provenance and clastic reservoir quality studies, but applied to the lithium mineral system. The key geological features in this system can be tracked and understood throughout geological time in a holistic fashion, using the tools we already have available in global/regional hydrocarbon exploration.
Lithium as a source to sink system –a holistic viewpoint
There are three main types of economic lithium deposit that are currently mined around the world: pegmatites, saline brine deposits and those associated with caldera clay deposits (alongside new potential dissolved lithium sources, discussed later). All of these can be encompassed by a holistic, source-to-sink approach (Figure 2), which echoes that routinely used in petroleum system
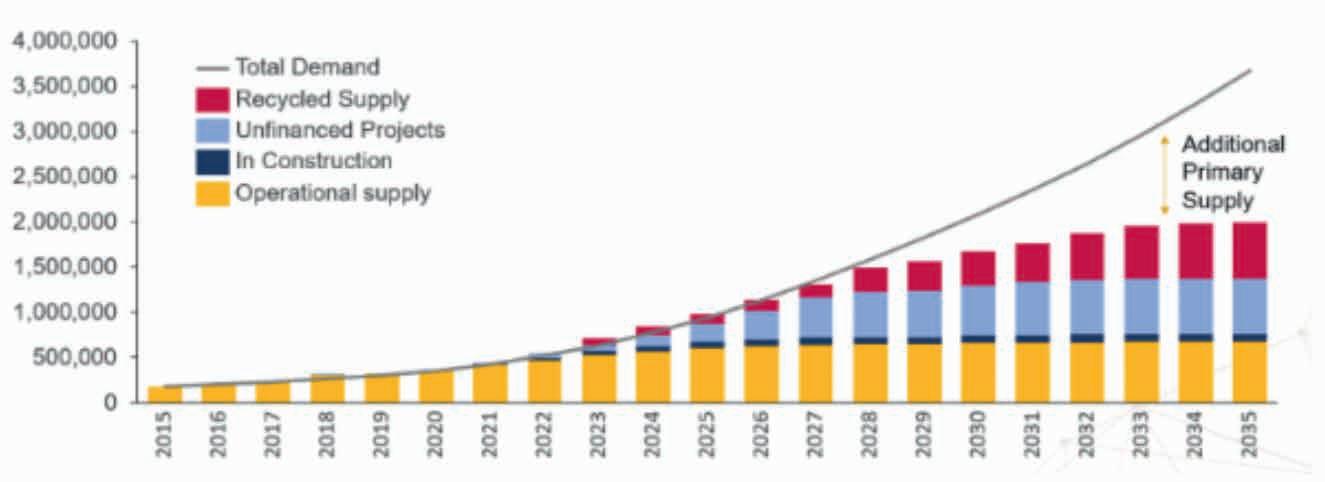
1 Halliburton
* Corresponding author, E-mail: Graeme.Nicoll@halliburton.com
DOI: 10.3997/1365-2397.fb2025078
Figure 1 Potential mismatch between lithium supply and demand through to 2035. Supply includes financed and unfinanced projects, as well as a predicted increasing year-on-year supply from recycling, which has an approximate 12-year lag from when the material was first consumed. Source: Leyland (2020).
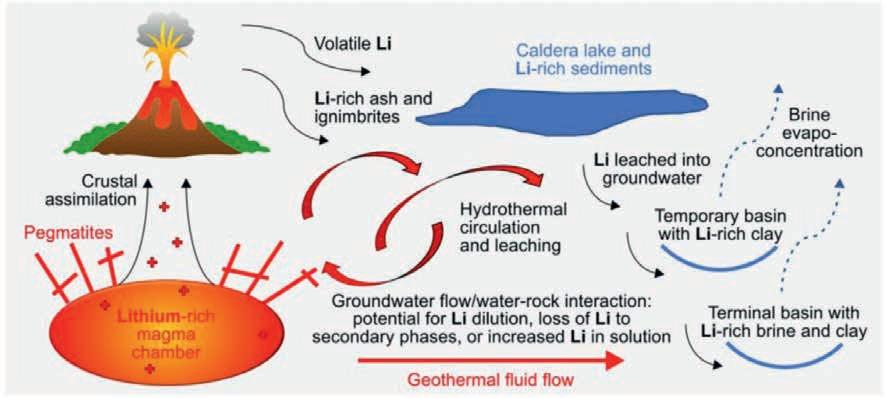
analysis, clastic provenance, reservoir quality and Earth System Science (Nicoll & Greselle, 2020).
The primary source in this system is from lithium-rich magmas; lithium-rich pegmatite deposits are typically associated with such magmas. Pegmatite deposits form during late-stage crystallisation of chemically evolved (high silica) magmas, such as granites. Lithium, as an incompatible element (it does not ‘like’ to go into crystal structures, preferring to stay in the liquid portion of a magma as long as possible), is often concentrated into late-forming minerals, such as spodumene and lepidolite. These processes are also why granitic pegmatites are an important source of other, commercially important rare metals including tin, tantalum, niobium, beryllium, rubidium, scandium, uranium and the rare-earth metals.
Lithium-rich pegmatites (and some associated rare-earth metals) are common in collisional/post-collisional tectonic settings, and are typically hosted in upper greenschist to lower amphibolite facies metamorphosed crustal rocks. Peak ages of lithium-rich pegmatite formation correspond to collisional orogeny and supercontinent assembly, at ~2640, 1800, 960, 484 and 310 Ma (Bradley et al., 2017).
Where these evolved magmas have erupted onto the Earth’s surface, lithium can be leached from lavas and volcanic ash by meteoric and hydrothermal fluids and becomes bound to clay minerals (e.g. hectorite) within ash-rich sediments in adjacent basins. Key parameters in the formation of caldera-hosted lithium clay deposits include rhyolitic lavas in continental settings, which have elevated lithium concentrations due to the assimilation of felsic, crustal material, as well as post-caldera magmatism and hydrothermal circulation to expedite lithium leaching. An example deposit is the McDermitt Volcanic Field in Oregon and Nevada, which has been identified as one of the largest Li resource (~2Mt) in the United States (Benson et al., 2017).
Saline brine deposits are accumulations of saline groundwaters that are enriched in dissolved lithium leached from the source lithium-rich magmatic rocks. Lithium is highly soluble, and, unlike sodium, potassium, and calcium, it does not readily form evaporite minerals when concentrated by evaporation. Instead, it ends up in residual brines in the shallow subsurface (Kesler et al., 2012).
During production, these brines are pumped to the surface where lithium is further concentrated in a succession of artificial evaporation ponds, each one having a greater Li concentration (Bradley et al., 2013). The importance of evaporation, during
formation and production, is why many of the important brine deposits, such as those in the Puna Plateau (Chile-Argentina-Bolivia) and the Qinghai-Tibet plateau, are in arid climate belts and at high altitude.
Lithium-brine deposits of present economic interest are mostly of Quaternary age. However, some workers have started paying attention to the potential of Cenozoic and Mesozoic brine deposits, typically buried hundreds to thousands of meters below the surface. Multiple models for the formation of subsurface brine deposits have been discussed (Li et al., 2018), and all share similar important geological factors that can be understood and assessed through a source-to-sink approach in the geological past: the presence of evolved magmatic rocks as the primary source of lithium and evaporite-type deposits as sinks. Processes (the ‘-to-‘ in source-to-sink) include regional geothermal or magmatic activity and semi-/arid climates enhance lithium leaching, mobilisation and concentration.
In the above section we discussed how a holistic, source-to-sink viewpoint can be used to describe and understand the currently mined economic lithium deposits. However, an interesting addition to this system is lithium dissolved in subsurface waters (aquifers, groundwaters and geothermal systems). These contain very low concentrations of lithium but in very high-volume fluid bodies where some form of concentration is needed. Advances in technology permit the recovery of lithium from concentrations in water as low as 70 mg/l (Daitch, 2018).
An example geothermal system is the United Downs Deep Geothermal Power Project near Redruth, Cornwall, UK. Cornish Lithium (2022) reported average lithium concentrations of 220 mg/l in geothermal waters at and near this site. A source-tosink mindset is still very helpful for understanding these aqueous systems. In the case of geothermal waters, lithium-rich granites associated with areas of enhanced heat flow are the source for fluids that can be exploited, from geological structures acting as fluid conduits and quasi-sinks, for both their geothermal energy and dissolved metal properties.
Waters within sedimentary basins (formation waters) can also become enriched in lithium, which has been sourced from evolved magmas or sediments eroded/derived from them. This has only relatively recently gained considerable attention (Dugamin et al., 2021) and highlights significant economic
opportunities for lithium extraction that may have been missed. For example, the most common fluid type within many producing hydrocarbon wells is water. This is essentially waste and needs to be treated and disposed of (often pumped back into the reservoir from whence it came once the hydrocarbons have been separated). In many areas around the world historic fluid geochemistry data from formation waters is being reassessed and many new projects are being considered or entering production (e.g. Mining Technology, 2025; Standard Lithium, 2025).
Despite the huge potential and recent interest in lithium extraction from oilfield formation waters, the source of the dissolved lithium remains uncertain. Many case studies provide multiple and highly variable models to explain the origin and concentration of the lithium. With this uncertainty, greater regional context and identification of the main geological driving factors is needed to develop robust screening and modelling methodologies as well as predicting away from data control – for which the Neftex® solution from Halliburton Landmark is well-suited and can potentially improve understanding, evaluation and derisking of these new lithium resources.
Although the occurrence and source of lithium in the world’s oilfield waters is potentially poorly understood at present, a review of several case studies indicates some commonality between the postulated lithium sources and sinks. Lithium can be sourced from lithium-rich hinterland areas or leached from the basinfloor (fractured basement or older sedimentary units). The sinks are typically the same reservoirs as in petroleum systems, units with sufficient porosity and permeability linked via migration pathways to the source. Many varied and complex processes between the source and the sink act to both concentrate and dilute the amount of dissolved lithium, including the evaporation of seawater at the time of host-rock formation deposition, water-rock interactions along flow paths, hydrothermal systems associated with fault networks, diagenetic reactions, and meteoric recharge (e.g., Dugamin et al., 2021; Daitch, 2018; Eccles and Berhane, 2011; Chan et al., 2002).
Our preliminary work on oilfield formation waters utilises various existing Neftex® datasets and products to help screen for the presence of these key system elements and to help characterise the lithium concentration in the sink formation waters.
The presence of lithium-rich source rocks can be assessed through multiple datasets (Figure 3). For example, Geochronology and Mineral Deposit data (yellow squares) are filtered to highlight tectonic settings that are likely to produce high volumes of granitic magmas (in collision and subduction settings). As an addition, Geodynamic units from the Neftex® Plate Model are used to assess the nature of the crust, in areas where direct data may be lacking, but may have potential to contain subsurface lithium-rich basement source rocks (yellow polygons on map). Whole-rock Geochemistry datasets provide both direct evidence of lithium-rich hinterland areas as well as proxies for lithium-enrichment (purple and green circles). For the sinks, Neftex® Gross Depositional Environment (GDE) maps are used to produce a map of evaporite deposits (pink polygons) through time, which serve as a proxy for basins with favourable environments and system elements such as seals. The formation waters will be hosted within porous and permeable units comparable to hydrocarbon reservoirs. In the example on Figure 3, the USGS Produced Waters Database (Blondes et al., 2019) is styled up by lithium concentration (red to orange to blue in decreasing concentration, with red symbols representing samples where lithium is enriched enough to be recoverable with current technology (>70 mg/l). The resulting map in Figure 3 shows that lithium-rich formation waters occur in sedimentary basins where evaporitic deposits are present, and the geological conditions and elements they represent, as well as where hinterland areas containing lithium-rich rocks are situated in relative proximity to the basin sinks, or potentially importantly on connected paleo-drainage pathways (Figure 4).
Looking closer at individual basins, the paleoenvironmental and basin dynamic changes over time can improve understanding of the concentrations and distributions of lithium. For example, within the Louisiana-Mississippi Salt Basins that border the Gulf of Mexico, lithium enrichment in the Oxfordian Smackover Formation brines involve lithium being sourced from the underlying, Oxfordian, Norphlet Formation (see Daitch, 2018). This clastic unit is thought to have a provenance from Alleghenian-sourced volcaniclastics and granitic rocks, which is potentially the primary source of lithium. Fluids originating in the underlying Oxfordian Louann salt, migrated through the Norphlet, mobilising the lithium. Lithium-enriched fluids probably also drained into the Smackover Sea where the water was further concentrated by evaporation, prior to deposition of the Smackover Formation during the Late Jurassic (Figure 4).
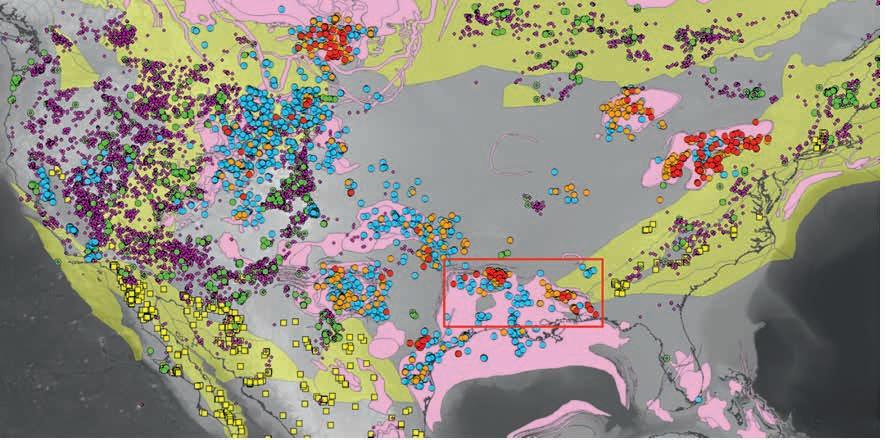
Figure 3 Map of Neftex® data and products used to create a preliminary assessment and application of a source-to-sink approach to the screening for lithium-rich formation waters across the United States. Geochronology and Mineral Deposit data: yellow squares; favourable geodynamic settings from Neftex® Plate Model (yellow polygons); Whole-rock Geochemistry dataset: small purple circles (average to five times the average crustal abundance (ACA) of lithium or proxy elements), green circles (>5 times ACA of lithium or proxy elements); stacked evaporite deposits from GDE maps: pink polygons; USGS Produced Waters Database: larger red (>70 mg/l), orange (20–70 mg/l) and blue (0–20 ppm, the average crustal abundance of lithium). Red inset shows the general location of the Smackover Formation, see Figure 4.
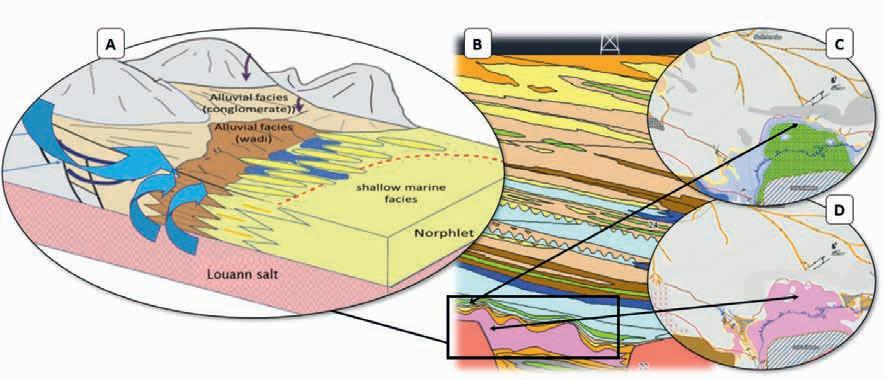
Our preliminary work on lithium has demonstrated that typical petroleum exploration datasets and products, like the Neftex® solution from Halliburton Landmark, when combined with holistic source-so-sink methodologies, can be readily transferred from petroleum to first-pass mineral exploration workflows. These standardised and curated spatio-temporal models can be investigated, for both the location and formation mechanics of hinterland regions which have been enriched in lithium, as well as an understanding of the primary sink areas (their paleogeography, drainage, climate and basin dynamics at discrete time intervals). Further research will improve understanding of the numerous and often complex variables within these mineral systems. The examination of case studies from a source-to-sink viewpoint allows us to bring all the necessary insights together to create rapid and robust screening workflows.
The team at Neftex has been gathering data from the public domain, standardising and integrating it within a spatio-temporal framework, supported by its proprietary sequence stratigraphic and plate tectonic models, for over 24 years (Simmons, 2021). This has been used to derive additional interpretative products which have successfully helped to predict and explore for hydrocarbons (see Head and Simmons, 2021). While building a range of datasets and interpretive content, Neftex has effectively created a fully integrated model of the Earth’s evolution through geological time. This can be used to understand the geological evolution of regions and test additional adjacent resource concepts beyond hydrocarbons, helping to accelerate and de-risk exploration for the global transition to lower carbon energy sources.
Our newest offering, Neftex® Prospect, from Halliburton Landmark, is targeted for the mineral exploration sector, is a cloud-based software that offers data, robust tools, comprehensive tectonic insights, and integrated workflows to identify the relevant key geological components for understanding mineral driving forces and helps to bring a mineral systems approach to exploration. We can provide cross-industry collaboration, subject matter expertise, relevant content, and applications to assist and enhance your mineral screening workflows.
Figure 4 a) Block model showing lithium concentration and formation water flow paths from the underlying salt, basement and hinterland (modified from Daitch 2018), b) Play Cross Section through the Western Gulf and Louisiana Salt Basins Basin (Neftex® product), showing the arrangement at depth of the Louann Salt in pink and the overlying Norphlet & Smackover Formations, c) paleogeographic map during the Late Jurassic, showing the extent of the near-shore clasticshighlighting areas where concentration of lithiumrich fluids is more likely (confirmed by the USGS Produced Waters, Figure 3) and potential additional target zones, d) paleogeographic map during the Late Jurassic, showing the extent of the salts – and the potential drainage connections to regional felsic volcanics, highlighting additional zones were lithium concentration could occur (Neftex® product maps).
Benson, T.R., Coble, M.A., Rytuba, J.J. and Mahood, G.A. [2017]. Lithium enrichment in intracontinental rhyolite magmas leads to Li deposits in caldera basins. Nature Communications, 8(1), 1-9.
Blondes, M.S., Gans, K.D., Engle, M.A., Kharaka, Y.K., Reidy, M.E., Saraswathula, V., Thordsen, J.J., Rowan, E.L. and Morrissey, E.A. [2018]. U.S. Geological Survey National Produced Waters Geochemical Database (ver. 2.3). United States Geological Survey (USGS). Digital Dataset.
Bradley, D., Munk, L., Jochens, H., Hynek, S. and Labay, K. [2013]. A Preliminary Deposit Model for Lithium Brines, United States Geological Survey (USGS), 1-9.
Chan, L.-H., Starinsky, A. and Katz, A. [2002]. The behavior of lithium and its isotopes in oilfield brines: evidence from the HeletzKokhav field, Israel. Geochimica et Cosmochimica Acta, 66(4), 615623.
Cornish Lithium [2022]. Cornish Lithium finds “globally significant” lithium grades in geothermal waters and prepares for work on pilot plant. https://cornishlithium.com/company-announcements/ cornish-lithium-releases-globally-significant-lithium-grades/.
Daitch, P.J. [2018]. Lithium extraction from oilfield brine. University of Texas at Austin.
Dugamin, E.J.M., Richard, A., Cathelineau, M., Boiron, M., Despinois, F. and Brisset, A. [2021]. Groundwater in sedimentary basins as potential lithium resource: a global prospective study. Scientific Reports, 11, 1-10.
Eccles, D.R. and Berhane, H. [2011]. Geological Introduction to Lithium-Rich Formation Water with Emphasis on the Fox Creek Area of West-Central Alberta (NTS 83F and 83K), Alberta Geological Survey, 28 Els, F. [2022]. Gravity-defying lithium price rally continues with “little relief in sight”. MINING.COM, https://www.mining.com/insanelithium-price-rally-continues-with-little-relief-in-sight/.
Head, R. and Simmons, M. eds [2021]. Exploration Handbook: Halliburton, e-book, ISBN 978-1-9160054-2-6.
Helps, P. and Nicoll, G. [2024]. Searching for metals in sedimentary basins: Technology transfer for the Energy Transition. Subsurface Insights, February 2024, 1-16.
Helps, P. and Nicoll, G. [2025]. Screening and prospectivity mapping for critical metals at a global scale with reference to magmatic nickel. Subsurface Insights, February 2025, 1-11.
Kesler, S.E., Gruber, P.W., Medina, P.A., Keoleian, G.A., Everson, M.P. and Wallington, T.J. [2012]. Global lithium resources: Relative importance of pegmatite, brine and other deposits. Ore Geology Reviews, 48, 55-69.
Leyland, A. [2020]. Lithium ion battery cell prices fall to $110/kwh, but raw material risk looms large, Benchmark Minerals Intelligence https://www.benchmarkminerals.com/membership/lithium-ionbattery-cell-prices-fall-to-110-kwh-but-raw-material-risk-loomslarge-2/.
Mining Technology. [2025]. Gradiant launches lithium production facility from oilfield-produced water in Pennsylvania. https://www. mining-technology.com/news/gradiant-lithium-production-facility-pennsylvania/.
Nicoll, G. and Gréselle, B. [2020]. The Future of Source-to-sink: An Initiative to Synchronize Geoscience Across European Industry and Academia, Exploration Insights Magazine, 5, 5-7.
Robichaud, S.R. and Robichaud, N.W. [2019]. Mineral ResourceLithium - Recovery from Naturally Occurring Permian Basin Waste Water. AAPG Search and Discovery
Simmons, M.D. [2021]. Arabian Plate sequence stratigraphy at 20: History and legacy. Exploration Insights Magazine, 8, 4-13.
Standard Lithium. [2025]. The South West Arkansas Project. https://www. standardlithium.com/projects/arkansas-smackover.
Wrobel-Daveau, J.-C. and Nicoll, G.R. [2022]. Plate tectonics as a tool for global screening of magmatic arcs and predictions for related porphyry deposits. Economic Geology, 117(6), 1429-1443.


Over 80,000 papers and articles covering the main fields of study within geoscience, engineering and energy
All proceedings from EAGE Events held around the world, as well as from partner associations
Works on all devices, IP address authenticated access from your smart phone, tablet, laptop or PC
- Access EAGE’s leading scientific journals
- Enjoy top-quality research articles, news, special monthly topics, industry features, and company profiles in EAGE’s fl agship magazine, First Break
Email earthdoc@eage.org to start your FREE CORPORATE TRIAL today!
Mike Branston1*, James Butt1, Ran Bachrach1, Mathieu Chapelle1, Rob Campbell1, Robin Fletcher1, Konstantin Galybin1, David Halliday1, Sarah Harrington1 and Simone Re1 review the insights gained from the Net Zero Technology Centre’s Open Innovation project (Spark 2368).
Introduction
To achieve net zero goals by 2050, carbon capture and storage (CCS) is expected to be a key technology for reducing greenhouse gas emissions. The safe storage of CO2 in the subsurface will require regular monitoring to confirm conformance or detect unexpected leakage as mandated by governmental authorities. CCS sites require a measurement, monitoring, and verification (MMV) plan that, in addition to other objectives, provides spatial monitoring of the plume evolution to provide assurance regarding containment of the CO2 and conformance with predicted CO2 migration. Due to the economics of CCS, we must consider the
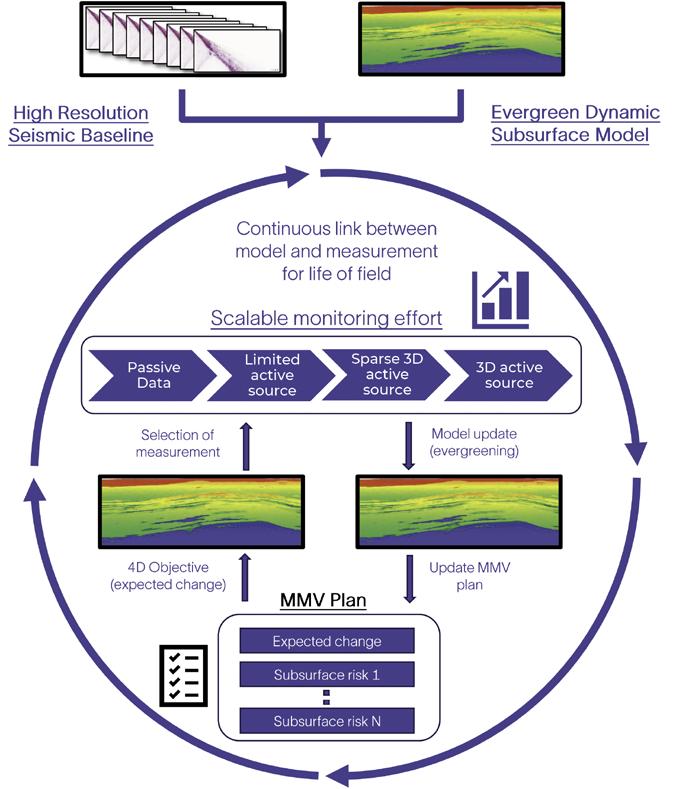
1 Schematic of an adaptive monitoring workflow. The high-resolution dynamic subsurface model and baseline seismic data are used to simulate monitoring measurements and assess their alignment with MMV objectives. By adapting to the evolving risks over time, monitoring effort and frequency can be efficiently scaled to optimise resources and reduce risk.
1 SLB
* Corresponding author, E-mail: MBranston@slb.com DOI: 10.3997/1365-2397.fb2025079
most cost-effective manner to measure and monitor the conformance and containment of CO2 under geological storage.
Time-lapse (4D) seismic monitoring, incorporating both surface and borehole acquisition methods, represent a well-established reservoir surveillance technique for quantifying variations in subsurface properties. These variations are recorded using geophysical sensors—including geophones, hydrophones, and ocean-bottom nodes — deployed in either permanent or temporary configurations, contingent upon the geophysical and geomechanical characteristics of the reservoir and the associated economic constraints. The use of this conventional 4D seismic monitoring for CCS has been challenged in terms of cost, the impact on the environment, and the impact that the required scale of operation for CCS has on both. As the deployment of CCS expands, it becomes increasingly important to minimise these costs to ensure the economic viability of projects.
To address this challenge, a transformative approach to 4D seismic monitoring is required, one that not only reduces expenses but also enhances the efficiency and effectiveness of monitoring strategies. The seismic industry is actively exploring cost-effective solutions, and the use of distributed acoustic sensing (DAS) technology, utilised for fibre-optic cables deployed at the surface (surface distributed acoustic sensing or S-DAS) for onshore and offshore CCS stores, has emerged as a promising approach for subsurface imaging and CO2 injection monitoring.
When considering the use of S-DAS for CCS monitoring applications, the main advantages are:
• Fibre optics are very low-cost broadband sensors that enable dense spatial acquisition along the cables.
• Fibre optics maintenance costs are very low (no corrosion or electronics).
• Fibre optics carry a very small environmental footprint.
• Fibre optics are, in many cases, multi-usage sensors that can measure vibrations, temperature, and strain. Moreover, the same infrastructure (cable) can have multiple uses e.g. vibration monitoring and communications.
This article considers how to achieve this goal of cost-effective, efficient monitoring of CCS sites by reconsidering our subsurface monitoring approach, away from discrete, well-sampled, high-
cost monitoring to regular, appropriately sampled, low-cost monitoring options informed by interrogation of the subsurface models. It collects the work that has been undertaken and published as part of the Net Zero Technology Centre (NZTC) Open Innovation Program (Spark 2368).
Branston et al. (2024) introduced an adaptive monitoring system which takes advantage of a high-resolution baseline model. The baseline data facilitates the development of an MMV plan, either through traditional methods or via the quantitative risk assessment (QRA) method (Sorgi et al., 2024, 2025). High-resolution baseline data acquisition and modelling enable the integration of the monitoring programme with the MMV plan, facilitating continuous updates to subsurface models and supporting their maintenance as evergreen models. In this scheme, monitoring effort and frequency is adaptive and dynamically scales appropriately with the evolution of the CO2 plume and the phase of injection (Figure 1).
The adaptive monitoring concept is acquisition system agnostic, but it has been developed to benefit from implementation within an S-DAS system (Branston et al. 2025). The specific benefits presented by the S-DAS system include high-receiver sampling, ability to record ultralow frequencies, excellent surface wave, P-wave and S-wave sensitivities and suitability for recording passive ambient or man-made noise (Bachrach et al. 2024). The low sensor cost, and ease of regular data harvesting provide additional benefits for deployment within an adaptive monitoring system, facilitating regular updates into the subsurface model through a digitally integrated installation. Integration of borehole measurements (including borehole DAS) can also improve accuracy by providing complementary measurements.
Experiments conducted within a digital twin of a Southern North Sea saline aquifer show the system can report on three critical monitoring objectives: fluid front movement, pressure envelope development, and induced seismicity. We also note
the opportunity that seismicity detection and seismic interferometry (using ambient noise) have further cost optimisation opportunities when coupled with the broadband response of the S-DAS system.
The adaptability is enabled through a set of differing and scalable monitoring solutions (Figure 2), including microseismicity (Galybin et al., 2025), passive seismic methods (Bachrach et al., 2024), conformance and non-containment indicators from sparse measurements (Fletcher and Halliday, 2025), CO2 tracking methods utilising time shift variations (Chapelle et al., 2024 and Re et al., 2025), targeted sparse 3D CO2 localisation (Halliday et al., 2024, 2025), and conventional 4D imaging using compressional and converted reflection data (Bachrach et al., 2023).
We will describe this scalable monitoring solution in order of active source effort, which serves as a proxy for the primary operating cost associated with each data acquisition activity using an S-DAS measurement system.
A synthetic 3D geological model, designed as an analogue of the Southern North Sea (SNS) subsurface, was used to validate the S-DAS response to CO2 injection and visualise adaptive monitoring outputs. The model, described in detail by Harrington et al. (2024), focused on a shallow saline aquifer at ~1.2 km depth. Porosities were derived using stochastically simulated facies-based compaction trends from local well data, enabling rock physics-consistent modelling of velocities and densities. A dynamic flow simulation coupled with a 3D mechanical earth model (3D MEM) was used to simulate CO2 injection at supercritical conditions over 10 years, at a rate of 9 million standard cubic metres per day, until a bottomhole pressure constraint of 250 bar was reached. The resulting CO2 plume achieved a diameter of 5.4 km after a decade of injection. This model serves as a platform for understanding the geomechanical and seismic responses to CO2 injection for the saline aquifer case.
A simulation to seismic workflow (Harrington et al., 2024) was applied to the dynamic model to determine the elastic

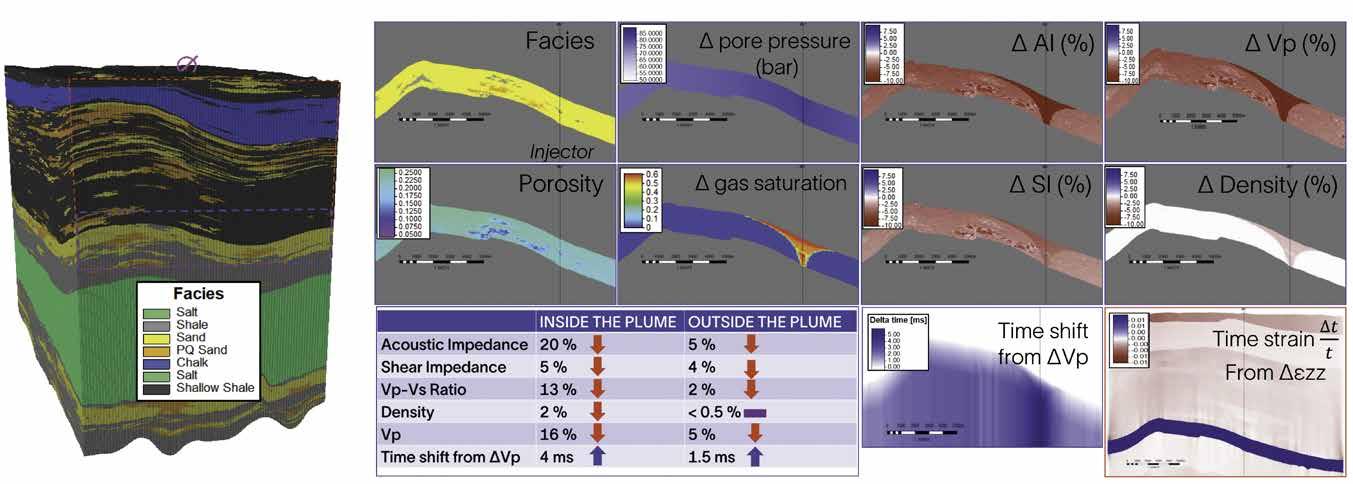
Figure 3 Analogue Southern North Sea dynamic model. The geomechanically-coupled simulation model involves a single injector into a saline aquifer at 1.2 km depth, combined with a 4D rock physics model to generate elastic properties, angle-dependent reflectivity and time shifts at various timesteps. These outputs are used to test and validate monitoring techniques in a shallow water setting.
properties and angle-dependent reflectivity at different timesteps. The CO2 fluid properties were modelled using equation of state as a function of pressure and temperature and mixed with the in-situ brine properties, assuming homogeneous mixing and supercritical phase CO2. A third-order elasticity model (Prioul and Lebrat, 2004) is used to determine the change in the stiffness of the isotropic rock due to the increasing pore pressure, incorporating the coupled geomechanical model into the simulation to seismic process. The model exhibited a maximum 18% decrease in acoustic impedance (AI) within the plume and a 3 to 5% change in AI away from the plume, when CO2 and associated pressure increase is added to the model. The shear impedance (SI) shows a similar magnitude of softening between the saturation plume and the pressure envelope. The change in density is predominantly within the saturation plume. The Vp/Vs ratio shows a decrease of approximately 13% within the plume and a small increase of <2% outside the plume in the pressure envelope.
The SEG Advanced Modelling Corporation (SEAM) CO2 project served as an additional industry supported model. The model is fully described by Fehler (2024) and Yoon et al. (2024), showcasing a coupled dynamic model containing structural trapping mechanisms, open and sealed faults, and stacked clastic brine-filled reservoirs between 1.5 to 2 km depth. We use the conformance case and two nonconformant cases (where the CO2 migrates into the mid-aquifer but remains in the storage unit and where the CO2 migrates up the open, sub-seismic fault, into a shallow aquifer) to demonstrate these workflows.
Fibre optic distributed acoustic sensing (DAS) is a technology that measures subsurface vibrations by probing the strain induced on a fibre-optic cable by seismic waves (Hartog, 2017). DAS has been used in the borehole environment over the last decade and has been demonstrated to provide a reliable alternative for vertical seismic profiles (VSP). The horizontal deployment of DAS at the surface (S-DAS), as an alternative to traditional point receivers, has been investigated through field trials by Bakulin et al. (2020), Bachrach et al. (2022) and Busanello et al. (2023). This approach poses new processing challenges and requires dedicated signal processing workflows and algorithms to address
the characteristics observed in onshore or offshore acquisition environments (Bachrach et al., 2023).
When positioned horizontally on the surface (S-DAS), cables are sensitive to primary reflections (PP) and converted wave (PS). Due to the strong directivity response of the cable, the sensitivity of the cable to the different reflected wave modes varies strongly as a function of the emergence angle. Bachrach et al. (2023) demonstrated that with an appropriate signal processing sequence for seabed surface DAS data, high quality PP and PS images are attainable.
Utilising S-DAS, a spoke-shaped cable geometry has been designed to enable adaptive subsurface coverage of both PP and PS waves around an injector well via different source geometry designs (Branston et al., 2024). The design allows for multiple and varying active source efforts in addition to the passive seismic wavefield being recorded. The goal of this geometry (which is a single realisation of many other possible designs) is to be centred on the injection site and provide coverage for the duration of the injection plan, whilst being adaptive in terms of acquisition effort and subsurface coverage. A spoke could be constructed from an existing fibre-optic cable (utilising unused fibre in the cable) or augmented with purposefully laid fibre-optic cable. The number and density of spokes would be field-dependent and evaluated as a part of the design process; aligned with the established riskbased monitoring objectives.
Induced seismicity is a key risk in CCS operations, as highlighted by the In Salah CCS project where a link between injection pressure and seismicity was established (Oye et al., 2013). The US Department of Energy also flags this risk due to its potential for destructive ground motion, whilst monitoring caprock integrity is vital for public assurance for CCS projects.
DAS is an established downhole logging technique for acquisition of VSPs and microseismic data (Mizuno and Le Calvez., 2023). Galybin et al. (2025) utilised the SNS aquifer model to evaluate several DAS deployment scenarios: downhole, surface, and hybrid, to contrast the performance of such networks against conventional downhole and surface geophone networks.
A 1D model was used to investigate detectability, horizontal and vertical uncertainty of microseismic event detection at such a site using a hydraulic fracture monitoring survey design algorithm developed by Raymer and Leslie (2011). Microseismic events, with depths ranging from 600 m above to 400 m below the target zone and local magnitude (ML) between –3 and 2, were modelled across an 8 km × 8 km area centred on the injection site. To evaluate the sensitivity and uncertainty of event location for each method, common assumptions on noise, event picking, and complete coupling were applied for detection on at least one component of each system.
It was found that the combination of S-DAS and downhole DAS provides the best detectability and smallest event location uncertainty at 2.8 km within the 200 m uncertainty criteria (Figure 4). The S-DAS network on its own performs favourably with detectability -0.8 < ML and 2.3 km range uncertainty in the model compared to other methodologies such as ocean bottom seismometers (OBS) (-1.5 < ML and 1.7 km range uncertainty) and downhole geophones (-2 < ML and 1.4 km range uncertainty). An OBS and geophone-based seismicity monitoring network may be adequate depending on local conditions, but DAS networks are emerging as an attractive and effective tool for continuous induced seismicity monitoring.
Passive DAS recording on fibre-optic cables has been traditionally used for microseismic event location in the borehole environment. However, with the benefits of dense inline sampling and continuous interrogation of DAS measurements, the potential exists for analysing ambient seismic signatures from geogenic and anthropogenic sources at the surface.
Seismic interferometry using S-DAS has high promise for improving monitoring objectives, as the ability to continuously record data over long periods of time favours ambient noise interferometry. Moreover, as no active sources are required, the use of S-DAS in this manner, without active seismic sources, therefore provides a monitoring system with significantly reduced operational costs and minimal environmental impact.
Bachrach et al. (2024) analysed continuous passive S-DAS recordings over an 18-day period where ambient Scholte wave data were recorded over an existing telecommunication cable
(Raknes et al., 2023). Despite observing very large variability in the noise patterns, surface wave data from 0.1 Hz was observable and used to construct passive virtual shots rich in low frequencies. Subsequent Scholte wave inversion of the recorded North Sea dataset, compared to a synthetic surface wave analysis and inversion of a controlled experimental model, demonstrated that the broadband characteristics of S-DAS can be inverted for shear wave velocity, and the low-frequency passive data is sensitive to subsurface velocity changes at depth beyond 1 km, depths relevant for CCS operations.
Wavefield colouring is an approach that uses limited repeat active seismic shots into a receiver array, input into full-waveform modelling to identify and understand how wavefields interact with zones in a model, tracking their progression over time (Fletcher and Halliday, 2025).
This is performed by generating two wavefields from a standard modelling experiment and an experiment modified by a weight that discriminates events passing through the zone of interest. Division of the two wavefields enables separation of events that have interacted with the zone of interest. This has an obvious application in subsurface monitoring. With a high-quality baseline model (e.g., generated using full-waveform inversion (FWI)), we can identify subsurface zones that correspond to different monitoring scenarios and use wavefield colouring to indicate where data should change in response to a change in those subsurface zones. This can be compared with just a few carefully recorded shot gathers utilising a normalised root mean squared (NRMS) attribute, or similar, providing a cheap and robust monitoring method.
Halliday et al. (2025) demonstrated this using the SEAM CO2 dynamic model, with synthetic data generated for the baseline and migration scenario case after 30 years of injection. Figure 5 shows a 2D section of the baseline (P-wave) velocity model with coloured lines delineating the top of three zones: conformance in green (containment within main reservoir); non-conformance (migration into a middle reservoir) in blue; and non-containment (migration into a shallow aquifer) in red. Waveform colouring is used to generate data-domain masks corresponding to changes in each zone (Figure 5b) for a selection of five shots spread evenly
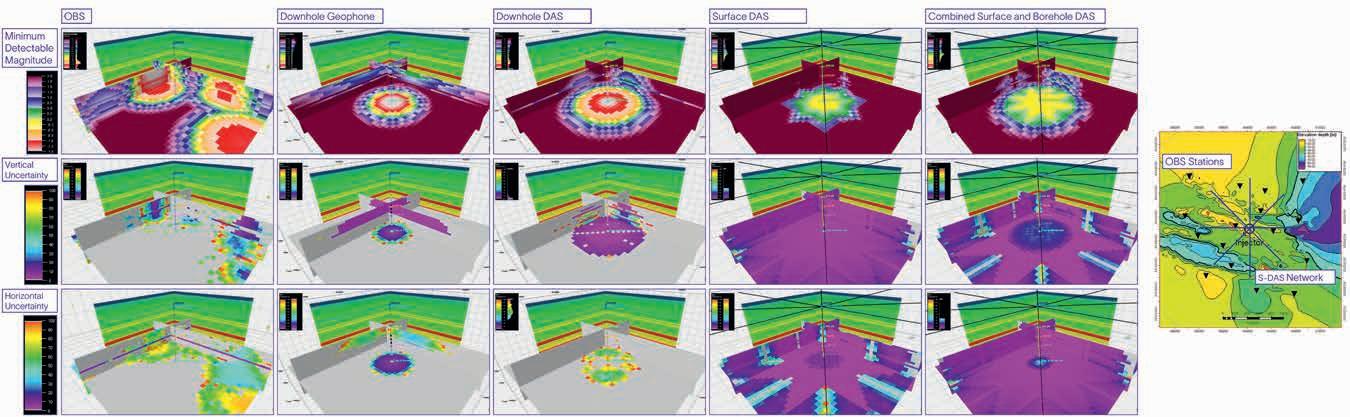
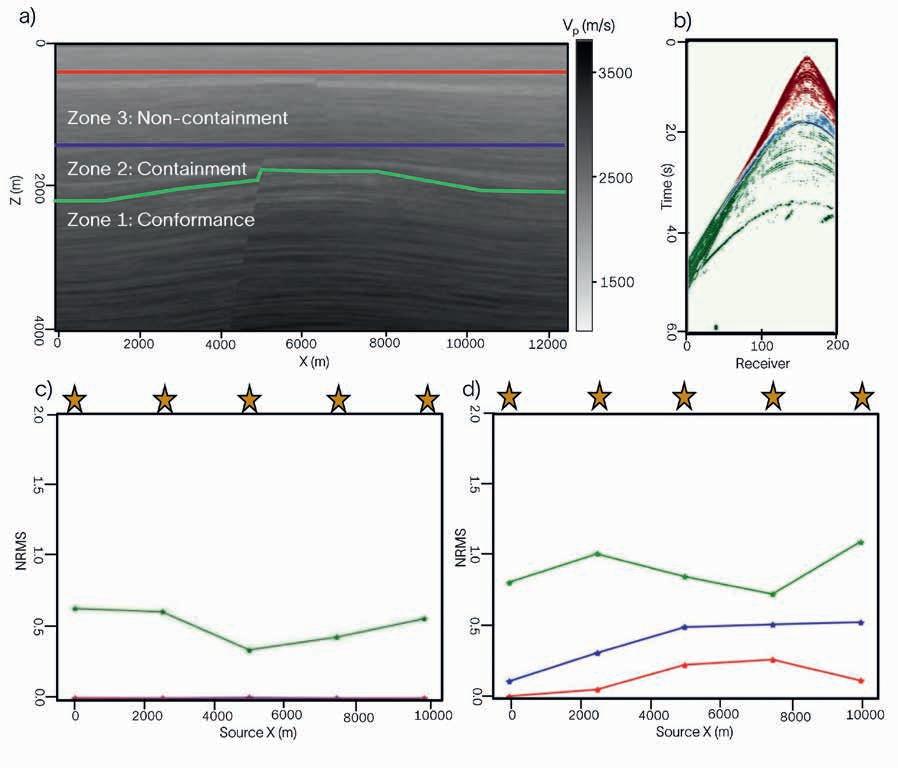
Figure 5 (a) P-wave velocity model with markers indicating the top of zones delineated to track conformance (green), non-conformance (blue) and non-containment (red). Output of the synthetic case study, where the wavefield colouring process (b) indicates change within given zones across five different shot gathers. Results are shown for both (c) the conformance case and (d) non-conformance, and non-containment cases.
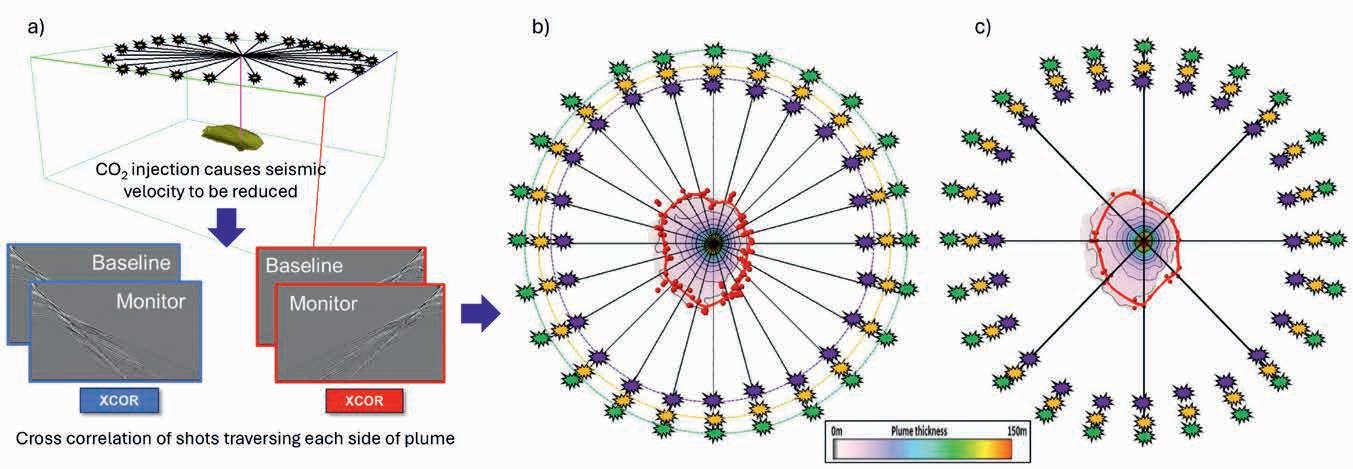
along the surface of the model. Synthetic 2D acoustic data are generated for three different datasets. Figure 5c shows these values for the first case, indicating that change is only detected within the green zone as expected, with Figure 5d showing the same for the second case, correctly identifying change across all three zones.
Wavefield colouring provides a mechanism to track or detect CO2 within a known subsurface using minimal active source effort. Having detected movement of the CO2 within the subsurface, we can scale the monitoring effort to localise the CO2 and update our subsurface model in 3D, rather than immediately scaling to a full 3D monitor survey.
complimentary measurements using a sparse active source effort. Both techniques leverage the S-DAS geometry, comprising multiple spokes radiating from the injection location, with co-located baseline and monitor shot gathers.
To track the CO2 plume extent and estimate plume thickness, Chapelle et al. (2024) and Re et al. (2025) have developed techniques that use time-shift and
methods to provide
Seismic surveys are often designed to capture compressional reflection data for subsurface imaging, with demonstrated success in identifying changes in gas saturation through time-shifts (Zadeh and Landro, 2011). However, during acquisition, additional wavefields, such as refractions and diving waves, are also recorded. Chapelle et al. (2024) demonstrated a method to detect the onset of time-shifts associated with refracted waves in a CO2 plume using a direct time-shift estimation between shot gathers. Using repeated active shot gathers positioned at a sufficient distance from the injection well, a cross-correlation-based method effectively tracked the onset of the time shift, even in noisy conditions. The plume’s edge was subsequently determined by combining the time-shift onset with ray tracing. This approach is made possible by the dense spatial sampling provided by S-DAS.
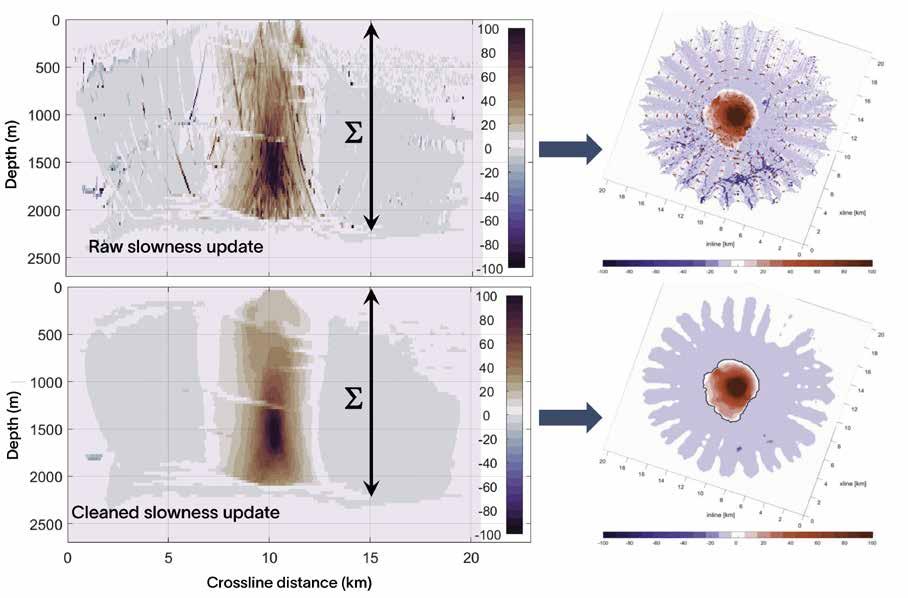
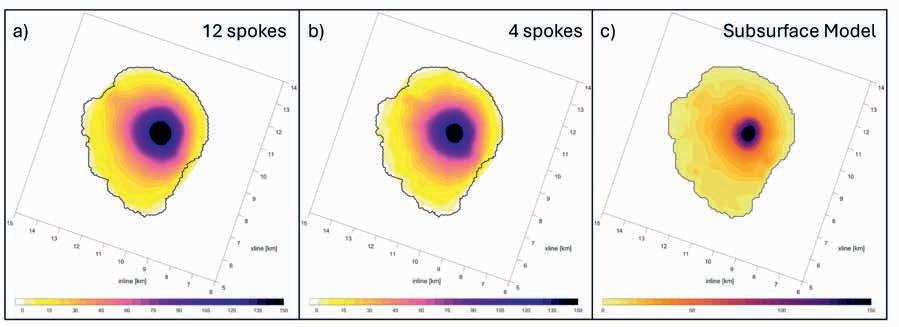
The relationship between accuracy and the number of S-DAS spokes was investigated, showing that the plume is identifiable with just four spokes, while additional spokes improve delineation accuracy (Figure 6). This automated workflow, requiring no advanced processing or imaging, identifies the plume edge within minutes.
Refraction tomography is a complementary technique, here utilising a minimal active source effort to record a long-offset seismic dataset to characterise the origin of the delay time on the refracted first arrivals when compared to an equivalent baseline.
Since the modelled effect of CO2 replacing brine results in a reduction of compressional velocity, post-injection traveltimes of the raypaths intercepting the plume are slightly longer than the ones modelled with the pre-injection model (i.e., starting model for the tomography), which translates into an increase in the slowness in the plume zone.
With the sparse input source data, Re et al. (2025) utilised elastic finite difference modelled shot gathers from the SNS model to compute the synthetic first-break picks with an eikonal solver and computed the tomographic update using the algebraic reconstruction technique (ART), based on the backpropagation of the residuals (Worthington 1984). ART addresses the matrix inversion challenge by directly mapping residuals into the model parameter space, ensuring that model cells not intersected by any raypath receive a null update by design. While the proposed measurements result in sparse tomography equations due to limited and uneven subsurface illumination, ART is less susceptible to inversion artifacts and numerical instabil-
Figure 7 The top panel displays a map of the total vertical traveltime difference, calculated by integrating the raw slowness update along the vertical axis. In the bottom panel, a corresponding map is shown, derived by integrating the cleaned version of the slowness update. The integration enhances the image through its averaging effect, further refining the interpretation and providing greater clarity when analysing constantdepth slices of the slowness update.
Figure 8 Normalised vertical traveltime differences are used as a proxy for the plume thickness for the modelled S-DAS cable scenario with (a) 12 spokes, (b) 4 spokes, compared to (c) the actual plume thickness. In all the panels the black line represents the actual plume’s boundary where CO2 saturation is zero.
ities compared to conventional inversion-based tomography methods.
The tomographic results reveal that while limited subsurface illumination from sparse acquisition introduces some artifacts, image enhancement filtering methods effectively remove them to create results that align closely with the lateral extent of the simulated CO2 plume propagation (Figure 7). The cumulative traveltime difference is a good proxy for the actual plume thickness (Figure 8).
Within the presented scenario, the refracted wavefield carries information that is useful for inferring the lateral extent of the plume and its thickness, while its three-dimensional shape remains somewhat ambiguous. A possible strategy is to exploit the refraction tomography approach for a preliminary rough delineation followed by a more sophisticated method making use of the full wavefield.
Having detected movement of the CO2 within the subsurface we can scale the monitoring effort to localise the CO2 and update our subsurface model in 3D and with greater accuracy.
A conventional 4D seismic monitoring approach will typically involve acquiring a high-density baseline survey, with monitoring surveys of an equivalent density acquired at defined intervals. The baseline and monitor data are processed rigorously to minimise acquisition-related differences, before isolating the 4D difference through seismic imaging. However, with a 4D
FWI workflow, these datasets can be utilised within an approach that requires minimal data preprocessing and minimises acquisition-related differences by solving for both the baseline and the monitor models in a joint inversion (Dutta et. al., 2023) to directly detect the 4D change in the model domain. By adopting this 4D detection objective, rather than a 4D imaging and characterisation objective, we can exploit data redundancy in conventional 4D seismic acquisition.
Halliday et al. (2024) introduced an approach to design sparse active source surveys that target specific 4D changes in the subsurface. Using a quantitative perturbation analysis based on full-wavefield forward modelling, the 4D target (e.g. the predicted plume extent, or an area identified as being at high risk of containment failure) can be synthetically probed with different acquisition geometries to determine which provides the most cost-effective solution to illuminate, detect, and localise the targeted change. A metric-driven approach enables selection of the most cost-effective geometry that meets the 4D objective. This approach also considers sensitivity to factors such as signal-to-noise ratio and 4D repeatability for different subsurface models and monitoring risks. The seismic survey design will adapt as the subsurface model is updated, and risks change, through the lifecycle of the storage site.
Halliday et al. (2024) demonstrate this approach utilising the SNS dynamic subsurface model, with elastic 2D forward modelling generating a baseline and three monitor datasets, with
plume diameter expanding from 1 km to 5 km. Synthetic shots were modelled every 125 m, and receiver positions were located on the seabed to mimic an S-DAS acquisition. It was shown that 4D FWI using diving waves can distinguish the velocity decrease and shape of the CO2 plume accurately compared to the subsurface model. Halliday et al. (2024) show how probing the model and evaluating illumination and detectability metrics against relative cost allowed the significant reduction in monitor source effort (Figure 9). Figure 9a shows the baseline velocity model created using diving-wave FWI, with stars at the top of the model indicating the 180 source positions. Figure 9b shows the updated monitor model using a repeat of the 180 source positions, and Figure 9c shows the same, but using only 10 active source locations. Note that there is a gap in the centre of this sparse source coverage. Since only diving waves are considered, the sources in this gap do not have a significant impact on the updates. Figure 9d shows the true modelled velocity change (top), the change extracted from the dashed boxes in Figure 9b and 9c. Using only the 10 optimised source locations allows the plume to be delineated, with the only compromise being an increase in noise introduced by the imaging system.
Halliday et al. (2025) extended the analysis for a 3D case involving stacked reservoirs in the SEAM CO2 model, to validate the 4D FWI workflow for 3D plume localisation, to demonstrate containment in addition to identifying non-containment risks.
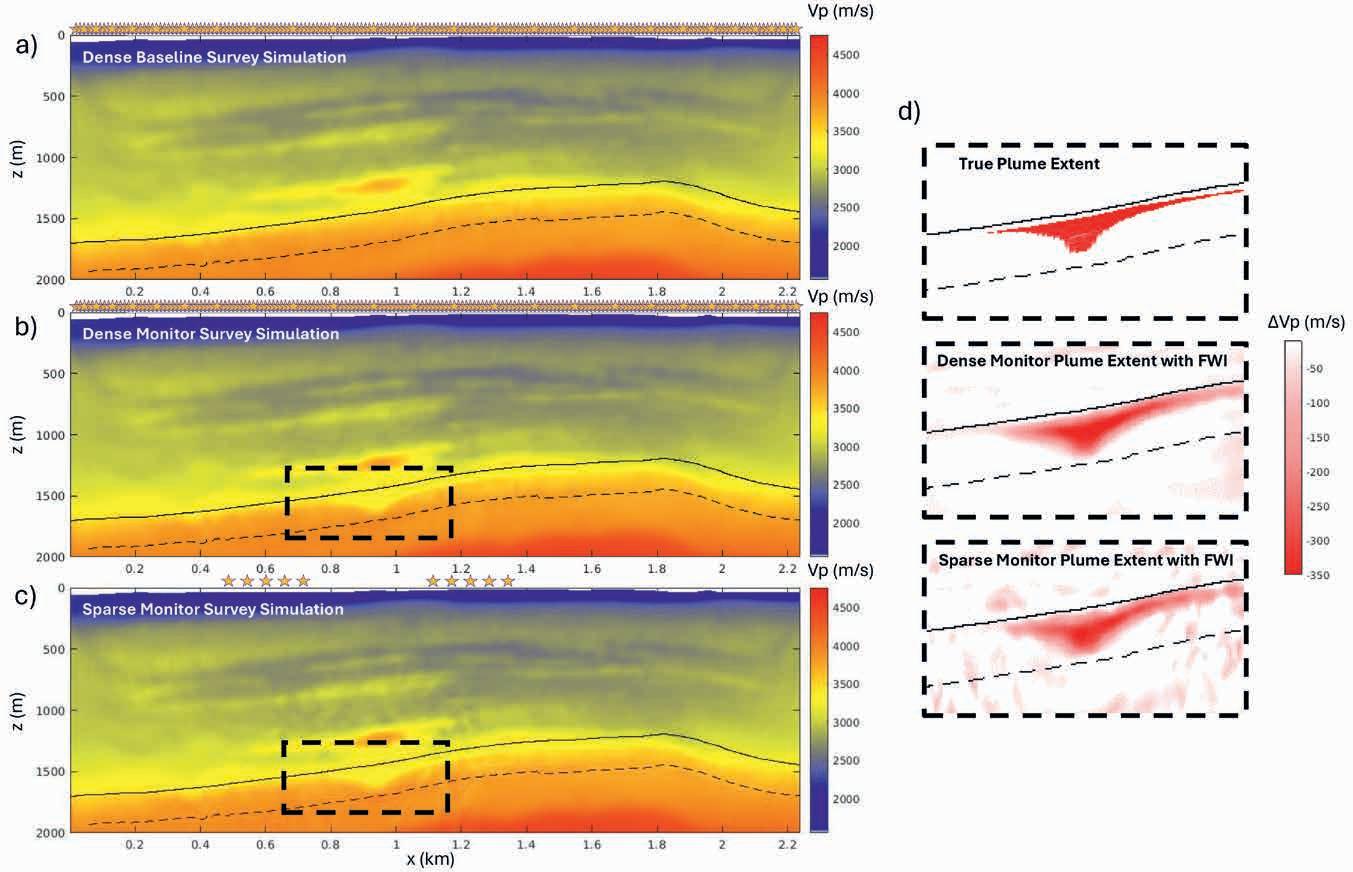
the
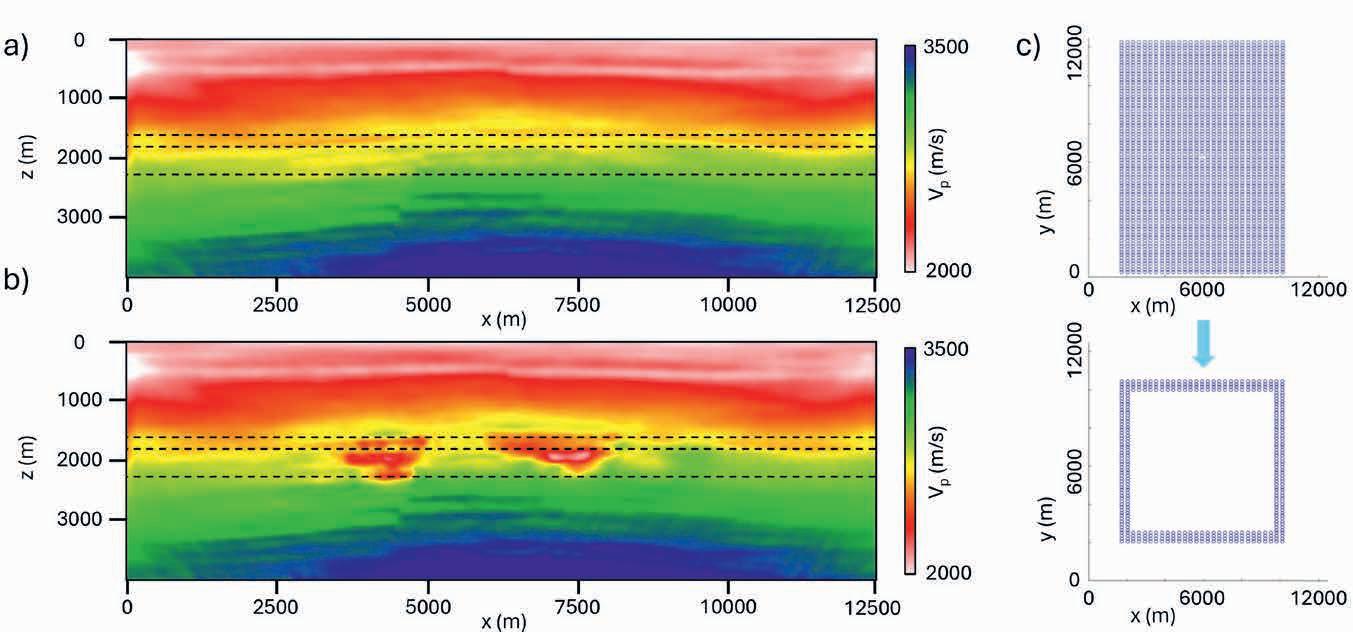
Figure 10 Forward Modelled 4D FWI experiment to determine the sparest appropriate geometry using the SEAM CO2 model. (a) A baseline model is generated with FWI using a dense baseline survey (300-by-150 m source grid). Perturbations are used to probe the baseline model to determine sparse monitoring geometries for multiple scenarios after 30 years injection, including (b) CO2 contained within the lower reservoir and migrating into the upper reservoir. (c) The resulting metric-driven approach enabled the 2400-shot geometry to be reduced to a 400-shot geometry, selected to generate the 4D update.
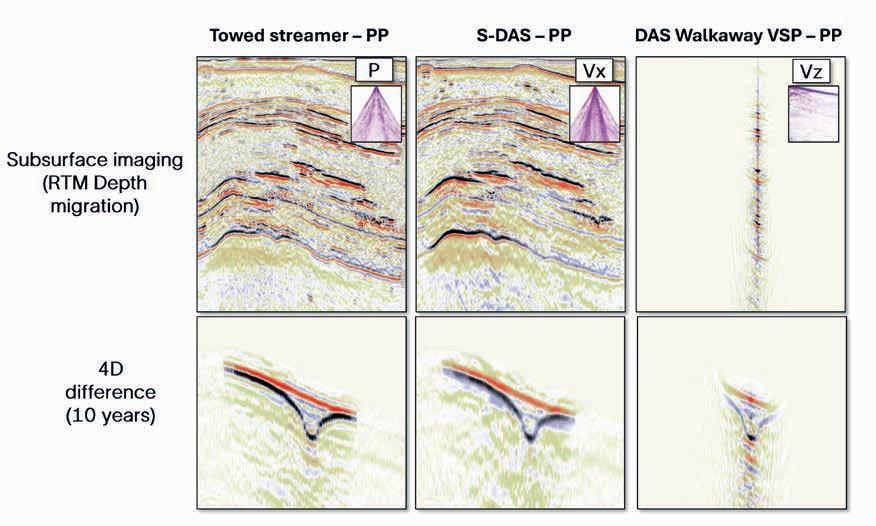
Using the same metric-driven approach, the baseline 2400-shot survey was evaluated and reduced to a 400-shot monitor.
Diving-wave-driven 4D FWI to a maximum frequency of 25 Hz characterised the velocity change of the CO2 plume in both containment and non-conformance cases where CO2 has migrated into a secondary reservoir (Figure 10).
We have successfully described the value of scalable data domain methods that can be used, when coupled with S-DAS, to detect and quantify the presence, extent and evolution of a CO2 plume using limited active source efforts and passive noise. For a system such as this to be truly scalable we should also be able to derive more conventional seismic imaging products, for use in more conventional interpretation and characterisation workflows.
Algorithms and processing solutions have been designed, tested, and deployed to capitalise on the advantages and
Figure 11 Elastic forward modelling and reverse time migration (RTM) applied to towed streamer, S-DAS, and walkaway DAS VSP geometries using the SNS model. (a) Baseline images with measured components; (b) 4D PP difference images. Plume migration exceeds DAS VSP coverage, indicating monitoring limitations. The plume has extended beyond the coverage of the DAS VSP.
overcome the limitations of S-DAS, for example the primary wave (PP) directivity, with Bachrach et al. (2022), Raknes et. al. (2023) and Bachrach et al. (2023) providing field evidence of the ability to harvest PP and PS data from S-DAS installed on the seabed.
Branston et al. (2024) used synthetic pre-stack data, generated using finite-difference modelling and migrated with reverse time migration (RTM) for the SNS aquifer model to demonstrate how conventional time-lapse imaging could be used with S-DAS (Figure 11). Variation in amplitude response as a function of emergence angle is captured through using different components of the wavefield. Results suggest that S-DAS has the potential to monitor plume evolution with 4D imaging from early stage injection through to post-injection and closure, and increasingly valuable after the CO2 plumes move outside the illumination afforded by downhole VSP measurements.
Branston et al. (2024) showed how this adaptive monitoring methodology can be utilised when considering coverage and
imaging of both PP and PS wavefields through experimentation and forward modelling using dynamic simulation models. Different types of active source imaging into a S-DAS array of spokes emanating from an injector well were considered based on the phase of injection and the frequency of monitoring. A central rig-based source provides similar PP illumination coverage to a conventional 3D DAS VSP, with improved illumination from the PS wavefield due to the migration of the reflection points towards the receiver. A ring source pattern at an appropriate distance from the injector well provides a mechanism to record long-offset first-arrival time-shift information and diving waves, and to verify that CO2 has not migrated outside of the receiver array. A spiral source pattern provides PP and PS coverage and can be used to sample the subsurface in a more complete manner. Duration estimates indicate that even for the densest source effort across the SNS model, the duration may be one quarter the duration of a 3D VSP acquisition and one twelfth of that of a towed-steamer acquisition over the equivalent area.
An adaptive monitoring strategy utilising S-DAS has been developed and tested using two geomechanically coupled dynamic CCS reservoir models to explore an iterative, ongoing, and cost-efficient approach to monitoring. This strategy balances risk reduction with detectability, cost-effectiveness, and the value of information to optimise monitoring efforts.
An adaptive monitoring approach, wherein the data required to drive model updates are developed in tandem with quantitative risk assessments and integration with the MMV plan, to effectively address and minimise risks related to conformance and containment. This is combined with a novel sensor and layout geometry using S-DAS, providing a large selection of complementary measurements to be acquired in a scalable manner.
We have shown how passively acquired measurements, including induced seismicity detection and collection of surface waves for interferometry, provide continuously accessible measurements for conformance, or a warning system to identify initial non-conformance or non-containment.
Limited active source efforts enable progressively detailed subsurface CO2 movement indicators, starting with waveform colouring utilising a handful of repeated shots to indicate conformance and containment. Additionally, acquired long-offset seismic data can provide indicative plume extent and thickness using time-shift analysis and refraction tomography. Increasing active source effort further enables full-waveform inversion for a direct property estimation and increased accuracy of measurements for targeted conformance and containment risks. None of these data domain geophysical analyses preclude the ability to increase the source effort further to create time-lapse images of the subsurface using primary and converted wavefields, comparable to conventional measurements.
The geometry of the surface and borehole fibre-optic cable is a key consideration and should be considered early in the project. The potential exists to use existing fibre-optic
infrastructure over the reservoir and augment this with additional fibre-optic cable when required, as determined by the requirements of the combined output of the quantitative risk assessment and adaptive monitoring design.
The authors thank the Net Zero Technology Centre (NZTC) for its funding in support of this project as part of their Open Innovation Program (Spark 2368). We also acknowledge the contributions of Iain Martin (NZTC), Chris Ward and Helen Basford (Spirit Energy Production UK Ltd), Mark Johnson (Veri Energy) and Gwenaëlle Salaün (formally Ørsted A/S) for their support of this project. The authors thank their SLB colleagues for their efforts and insight, and SLB Exploration data for the use of the horizons used in the static and dynamic modelling.
The SEG Advanced Modelling Corporation (SEAM) is a not-for-profit research entity. We gratefully acknowledge the SEAM CO2 Project and all participating companies. Participants are Chevron, ConocoPhillips, Oxy, Saudi Aramco, Shell, SLB, Total Energies, and Woodside.
Bachrach, R., Busanello, G. and Sayed, A. [2022]. Applications of surface distributed acoustic sensing for CO2 storage and windfarms: Results from large-scale experiment. The Third EAGE Global Energy Transition Conference and Exhibition, Extended Abstracts.
Bachrach, R., Ramani, K., Kanrar, A., Gupta, S., Sayed, A., Twynam, F., Busanello, G., Raknes, E.B., Ivanov, Y. and Sagary, C. [2023]. New wiggles from old cables: Data processing and imaging considerations. Geophysics, 88(6), WC199–WC208.
Bachrach, R., Sayed, A., Clementi, M., Skorinski, D., Raknes, E. and Ivanov, Y. [2024]. Scholte-wave interferometry using passive surface distributed acoustic sensing (S-DAS) with application for CCS monitoring. 85th EAGE Annual Conference & Exhibition.
Branston, M., Bachrach, R., Butt, J., Harrington, S., Chapelle, M. and Campbell, R. [2024]. A new adaptive monitoring scheme to report spatial conformance of CO2 plume migration. 85th EAGE Annual Conference & Exhibition.
Branston, M., Bachrach, R., Halliday, D. and Fletcher, R. [2025]. An example of adaptive seismic monitoring of CCS using the SEAM CO2 model. 86th EAGE Annual Conference and Exhibition.
Busanello, G., Bachrach, R., Sayed, A. and Boiero, D. [2023]. Surface distributed acoustic sensing (S-DAS) for high-resolution near-surface characterization. 84th EAGE Annual Conference & Exhibition, Extended Abstracts
Chapelle, M., Branston, M., Butt, J., Campbell, R., Bachrach, R., Harrington, S. and Busanello, G. [2024]. Finding the edge of the CO2 plume with two shots and a surface DAS. 85th EAGE Annual Conference & Exhibition.
Dutta, G., Saragoussi, E., Cheng, X., Sourial, M., Zhai, Y., Parekh, C. and Vigh, D. [2023]. Joint 4D full-waveform inversion using enhanced template-matching objective function. SEG Technical Program, Expanded Abstracts, 1740-1744.
Fehler, M. [2024]. SEAM Update: SEAM CO2 project: Evaluating geophysical methods for characterization of CO2 injections. The Leading Edge, 43(12), 870-872.
Fletcher, R. and Halliday, D.F. [2025]. Colouring full waveform modelling. 86th EAGE Annual Conference & Exhibition, Extended Abstracts.
Galybin, K., Branston, M. Lal Khaitan, M. [2025]. Induced seismicity monitoring —comparison of surface deployed DAS arrays versus other common seismicity monitoring techniques. 4th Carbon Capture and Storage Conference Asia Pacific, Extended Abstracts
Halliday, D.F., Chapelle, M., Branston, M. and Bachrach, R. [2024]. Adaptive 4D full-waveform inversion for cost-effective monitoring of CCUS sites. 5th EAGE Global Energy Transition Conference & Exhibition.
Halliday, D., Fletcher, R., and Branston, M. [2025]. Full-waveform adaptive monitoring for CCS. 86th EAGE Annual Conference and Exhibition.
Hartog, A.H. [2017]. An introduction to distributed optical fibre sensors CRC Press. DOI: 10.1201/9781315119014.
Harrington, S., Bachrach, R., Di Martino, P., Branston, M., Butt, J., and Chapelle, M. [2024]. Simulation to seismic modelling for CCS MMV planning: New insights for S-DAS monitoring. 85th EAGE Annual Conference & Exhibition.
Mizuno, T., and Le Calvez, J. [2023]. Quantitative evaluation of DAS passive seismic monitoring: Theory and case studies. 84th EAGE Annual Conference & Exhibition, Extended Abstracts
Oye, V. [2013]. Correlation between injection rates, pressure data and induced microseismicity. 75th EAGE Conference & Exhibition –Workshops, Extended Abstracts.


Prioul, R., and Lebrat, T. [2004]. Calibration of velocity-stress relationships under hydrostatic stress for their use under non-hydrostatic stress conditions. SEG 74th Annual Meeting.
Raknes, E.B., Foseide, B., Landrø, M., Dong, H., Brenne, J.K., Wienecke, S., Bjørnstad, S., Frivik, S.A., and Elboth, T. [2023]. New wiggles from old cables: Acquisition, cable, and data aspects. Geophysics, 88(6).
Raymer, D.G., and Leslie, H.D. [2011]. Microseismic network design: Estimating event detection. 73rd EAGE Conference & Exhibition, Extended Abstracts
Sorgi, C., De Gennaro, V., and Mandiuc, A. [2024]. A new methodology for quantitative risk assessment of CO2 leakage in CCS projects. SPE Journal, 29(12), 7214-7233
Sorgi, C., De Gennaro, V., Yoon, S., and Prioul, R. [2025]. Modelling-based quantitative leakage risk analysis for enhanced CCS monitoring, measurement and verification plans. 4th Carbon Capture and Storage Conference Asia Pacific.
Worthington, M.H. [1984]. An introduction to geophysical tomography. First Break, 2(11), 20–26.
Yoon, S., Prioul, R., Bailey, W.J., Birchwood, R., Rodriguez-Herrera, A., and Stefani, J. [2024]. Assessing CO2 leakage risks and fault stability: A coupled flow and geomechanics simulation with uncertainty analysis of fault properties. 58th U.S. Rock Mechanics/ Geomechanics Symposium.
Zadeh, M.H., and Landrø, M. [2011]. Monitoring shallow gas migration by refraction time shift. SEG Technical Program, Expanded Abstracts.


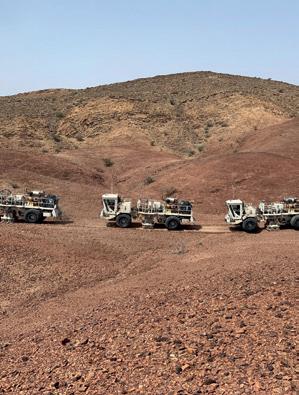


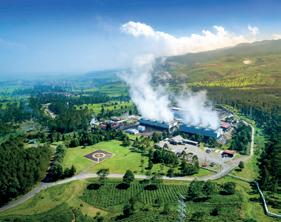


Habib Al Khatib1* and Elodie Morgan1 introduce a seismic surveillance strategy designed to integrate flow model outputs and risk assessment with targeted seismic measurements, shifting the focus from imaging everything to imaging what matters and when it matters.
Abstract
Across carbon capture and storage (CCS) conferences, cost reduction remains a central theme to enable deployment ‘at scale’. Monitoring, measurement, and verification (MMV) plans span the entire Life of Injection (LoI) and beyond, representing significant operational expenditure. Drawing from oil and gas heritage, pioneering CCS projects like Quest and Sleipner rely on image-based solutions (VSP, 4D seismic). While robust, these methods are costly and raise operational and societal concerns. Even if providing global insights about the subsurface and seismic images have proved efficient for oil and gas production optimisation, a question is raised regarding its adoption on CCS, where safety is the primary concern.
To address the surveillance need of CCS, it is important to mention that the million dollar question here isn’t whether to image, but when. In our industry, ‘the value of full 4D is in the surprise’, but surprises are precisely what CCS operators want to avoid. Instead, we propose a seismic-focused monitoring method called spot seismic, which is model and data-driven. Lightweight and repeatable, this active seismic method has been successfully implemented onshore and offshore. Its goal is to provide timely evidence that the CO2 plume behaves as predicted, and to trigger alarms when significant anomalies arise. The spot seismic method, has been recognised in the Global CCS Institute’s state of the art: CCS Technologies 2025 report as a TRL 8-9 scalable and innovative approach for CCS surveillance.
This predictive monitoring approach not only addresses CCS economics but also serves multiple stakeholders, aligning with regulatory frameworks and enabling transparent, risk-based decision-making.
Introduction
Conventional seismic monitoring solutions inherited from the oil and gas industry are fundamentally image-based. Techniques such as VSP, 2D, 3D, and 4D seismic are designed to visualise the subsurface. While high-resolution imaging is indispensable for initial site characterisation, risk identification, and model building, these methods come at a steep cost financially, operationally, and sometimes socially. They often require extensive access to land or sea, disrupting other activities and raising concerns among stakeholders.
Once the site is imaged and the field characterised, operators move towards a final investment decision (FID), weighing projected revenues typically tied to annual CO2 storage capacity (Mtpa) against long-term risks and costs.
Among these, MMV stands out as a critical factor that can make or break the economic viability of a CCS project. As illustrated in Figure 1, MMV operations may span over +60 years, demanding a strategy that ensures safety and regulatory compliance without undermining investment confidence.
Early CCS injection projects have leaned heavily on this high-cost, image-based surveillance. For example, the Quest CCS project conducts annual DAS-VSP monitoring (Hopkins, 2021), while Sleipner performs full 4D seismic surveys every two years (Furre, 2017). These methods have been effective in demonstrating plume conformance and containment, but their recurring cost and operational complexity have prompted the industry to seek smarter, leaner alternatives.
This article introduces a seismic surveillance strategy designed to meet that challenge. By integrating flow model outputs and risk assessment with targeted seismic measurements (Morgan et al., 2020), we shift the focus from
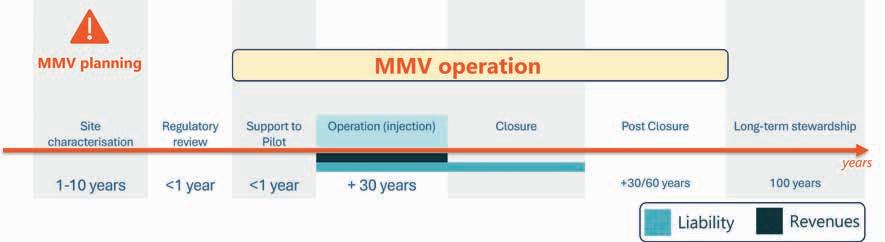
1 SpotLight
* Corresponding author, E-mail: Habib@spotlight-earth.com
DOI: 10.3997/1365-2397.fb2025080
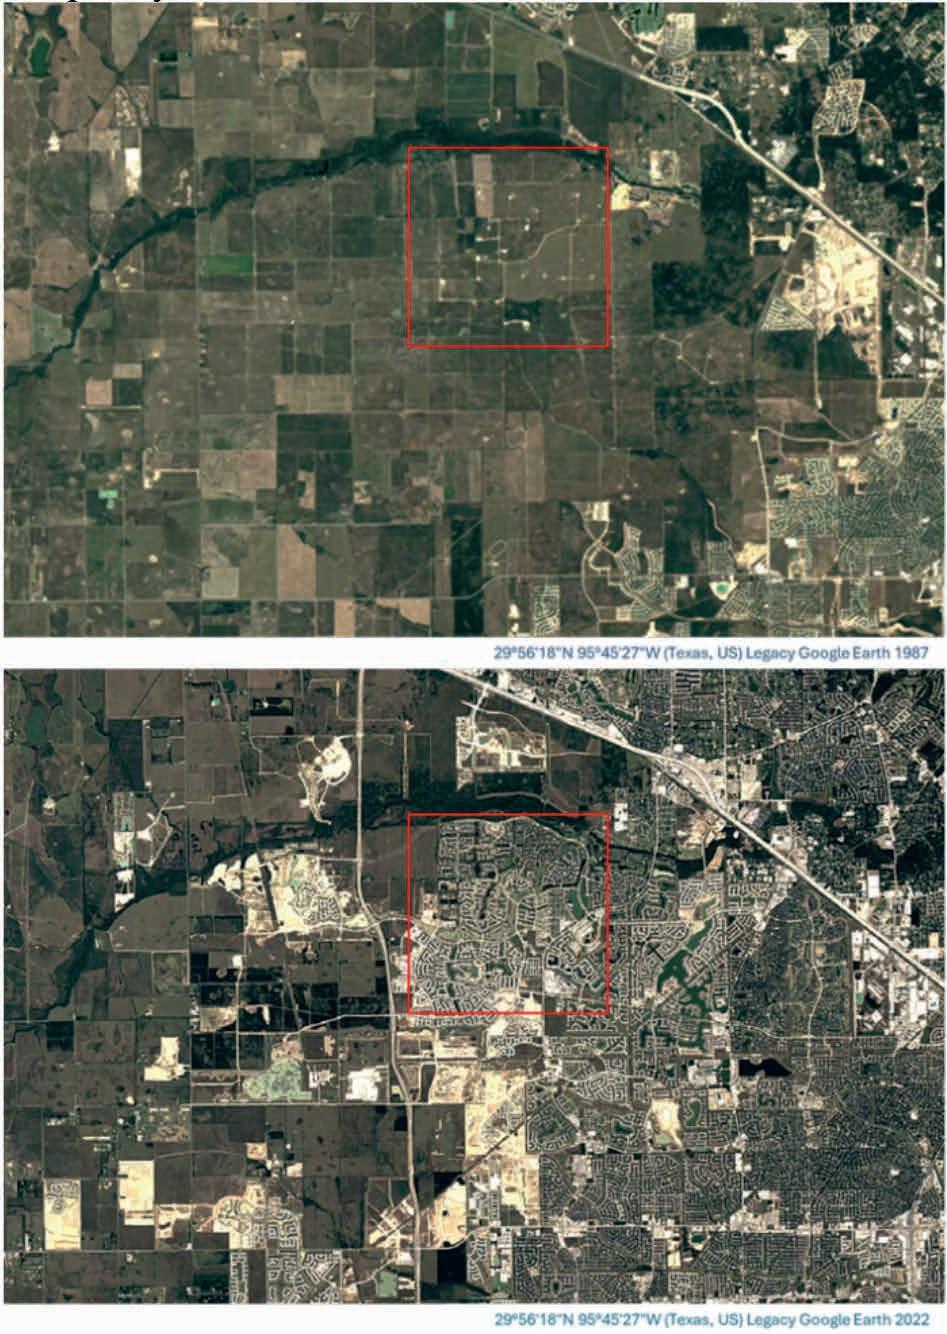
imaging everything to imaging what matters and when it matters.
Using a single source and receiver location per ‘spot’, (one of them can be an antenna) this method enables frequent validation (or invalidation) of the flow model. We call this approach predictive monitoring (Al Khatib et al., 2024).
Rather than relying solely on periodic full-field imaging, predictive monitoring uses active spot seismic measurements to evidence that the CO2 plume behaves as expected. If anomalies are detected, corrective actions, including ultimately full 4D seismic surveys, can be triggered precisely where and when needed.
In some cases, the economics of a full 4D MMV solution can be absorbed, and FID reached. But even when budgets allow it, operators face (or will face) a trio of challenges that are often underestimated, and each has the potential to compromise longterm surveillance:
• Obstructions
• Keeping pace with technology
• Environmental footprint
Obstructions
Full 4D seismic monitoring assumes that legacy source and receiver positions can be re-accessed and re-shot using the same equipment and acquisition parameters to ensure optimal detectability. While it may be feasible to forecast seabed or land
accessibility over a 5-10-year horizon, doing so over 20-60 years is far more uncertain (and will be wrong). Offshore wind farms, pipelines, communication cables, and topside infrastructure can all obstruct future surveys. The North Sea Transition Authority (NSTA, 2022) raised this concern in its report on MMV for CCS projects with co-location considerations, highlighting the growing complexity of shared subsurface and surface environments.
Onshore the situation is even more unpredictable, as new roads, infrastructure and even cities can be built over +30years even on top of depleted O&G fields as shown on Figure 2.
Veteran geophysicists will recall that 20 years ago, the state of the art in 4D seismic was far from today’s broadband, wide-azimuth, nodal acquisition. In fact, many streamer-based surveys from the early 2000s would no longer qualify as suitable baselines for modern monitoring. Over a 30-60-year life of injection cycle, this challenge only intensifies. Unless full 4D surveys are repeated frequently, and each iteration incorporates incremental technological advances, there’s a real risk that the original baseline will become obsolete, undermining the very foundation of time-lapse analysis.
Societal acceptability is becoming a central issue in both onshore and offshore CCS. Communities and workers involved in co-located activities may pose risks to MMV operability. Asking fishermen to vacate areas for weeks every few years over a 60-year period is unlikely to be well received... moreover, environmental regulations are evolving. The future legality of seismic sources such as airguns (offshore) and dynamite (onshore) is uncertain. Even alternative sources like marine vibrators are subject to emerging ‘maritime noise budgets’ as seen in UK and Australian legislation, which must be shared across all human activities. Full 4D seismic, with its high acoustic footprint, may face increasing scrutiny in this regard.
Reducing the limitations of image-based MMV to cost alone is a narrow view. One that risks ignoring deeper, systemic challenges until it’s too late. That’s why we propose rethinking CCS surveillance altogether: Image-based solutions require square-kilometre coverage and are inherently exposed to the constraints outlined above. Instead, we advocate for a shift away from the ‘image-based MMV paradigm’ towards a risk and model-driven MMV focused on strategic monitoring at selected locations. We call these locations spots.
Monitoring is not just good practice; it’s a regulatory imperative. Across international frameworks and national implementations, MMV is a cornerstone of safe and effective CO2 storage. A robust MMV plan is required to obtain and maintain a storage permit, and must be risk-based, site-specific, and adaptive to evolving knowledge of the subsurface.
According to the EU CCS Directive (2009/31/EC), operators must compare the actual and modelled behaviour of CO2 and formation water within the storage site. Monitoring must assess whether the injected CO2 behaves as expected, whether any
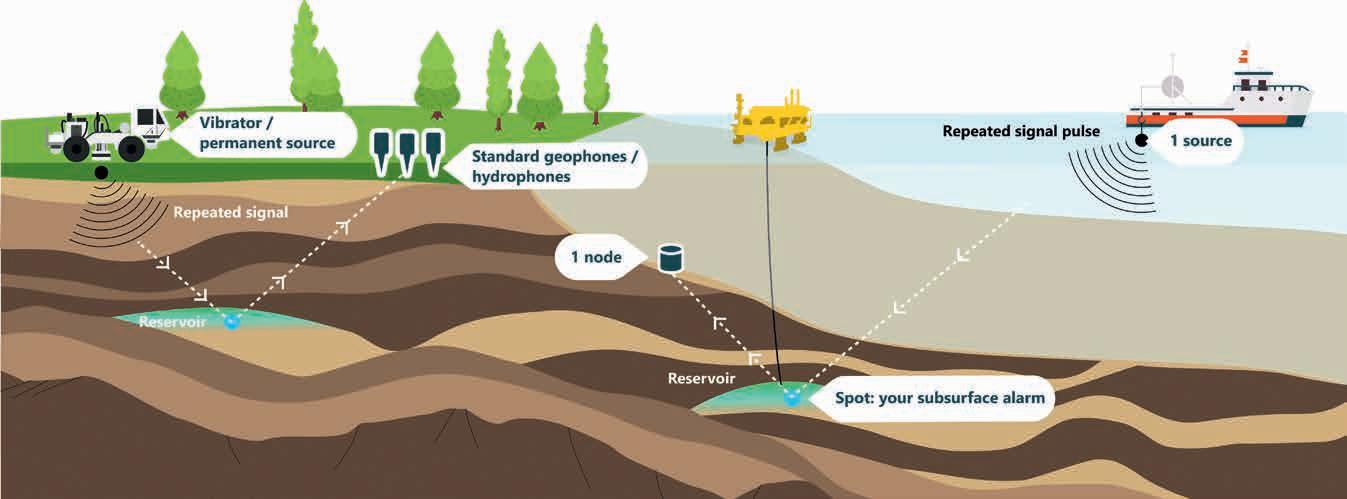
migration or leakage occurs, and whether any such leakage poses risks to the environment or human health.
In the UK, the NSTA emphasises that monitoring strategies must be tailored to the specific risks and uncertainties of each site. Co-location with other marine industries, such as offshore wind farms, adds complexity and demands innovative, flexible MMV approaches.
In Alberta, Directive 065 and the province’s MMV Principles and Objectives require operators to demonstrate conformance that is the alignment between observed data and model predictions. MMV plans must provide evidence of containment, assess environmental risks, and support long-term site closure decisions. Verification is explicitly defined as the comparison of measured and predicted performance.
Importantly, regulators do not mandate imaging the CO2 plume or pressure front. What they require is evidence that the plume behaves as predicted and that the operator can detect and respond to deviations. A lighter, more agile, model-driven solution designed to validate or invalidate predictions will meet these regulatory expectations while reducing operational burden.
One of the most common arguments of full 4D seismic is the phrase:
‘The value of full 4D lies in the surprises.’
In oil and gas, this has often proven true: 4D seismic has revealed unexpected reservoir behaviour, enabling precise in-field drilling and unlocking bypassed hydrocarbons. Even at Sleipner, the first full 4D survey revealed that CO2 was migrating across multiple layers not anticipated by the initial model (Furre et al., 2017).
Another familiar refrain is:
‘All models are wrong, but some are useful.’
While this mindset has served exploration and production well, it may not be appropriate for CCS: unlike oil and gas, where monitoring aims to optimise production, CCS surveillance is about ensuring safety. When an operator requests a permit to inject X Mtpa, based on a predictive model like flow simulation output, it is counterintuitive to claim that the model is likely to be wrong and that surprises will be welcomed years later via a full 4D survey.
Instead, CCS should adopt a different philosophy:
‘Models should be trusted and calibrated until proven wrong.’
‘The value of full 4D lies not in surprises, but in confirmation as 4D is triggered when and where anomalies arise.’
To support this shift, we propose an alternative approach: rather than imaging the entire subsurface at regular intervals, monitoring should focus on strategically selected locations – spots – that are most sensitive to deviations from model predictions. Additional spots will be added to cover the main risks identified in the risk assessment phase like fault, structural leaks or abandon wells. These spots serve as early warning systems, validating or invalidating the model in near real-time. If significant anomalies’ are detected, imaging-base solutions can be deployed only if, where, and when needed, optimising both cost, acceptability and regulatory compliance.
Dynamic reservoir models are sophisticated tools designed to simulate the evolution of pressure and fluid saturation over time. Built from geological data, seismic interpretations, well logs, and historical production records (especially in depleted fields), these models underpin planning, permitting, and risk assessment for CO2 injection projects (Bagochev et al., 2025). In many cases, they shape the economic viability of CCS initiatives before the first molecule of CO2 is injected.
Given their central role, it is essential to develop monitoring technologies that can validate these models at the most critical locations and times. Rather than relying on full-field imaging at pre-determined (or fixed) intervals, predictive monitoring uses model forecasts to guide surveillance efforts, focusing on areas and time most sensitive to change or risks.
To detect the presence or absence of CO2, and pressure effects (when detectable), we propose implementing spot seismic surveillance, a focused, active seismic method designed to deliver frequent, targeted insights.
Unlike conventional image-based seismic monitoring, which requires thousands to millions of source-receiver pairs across
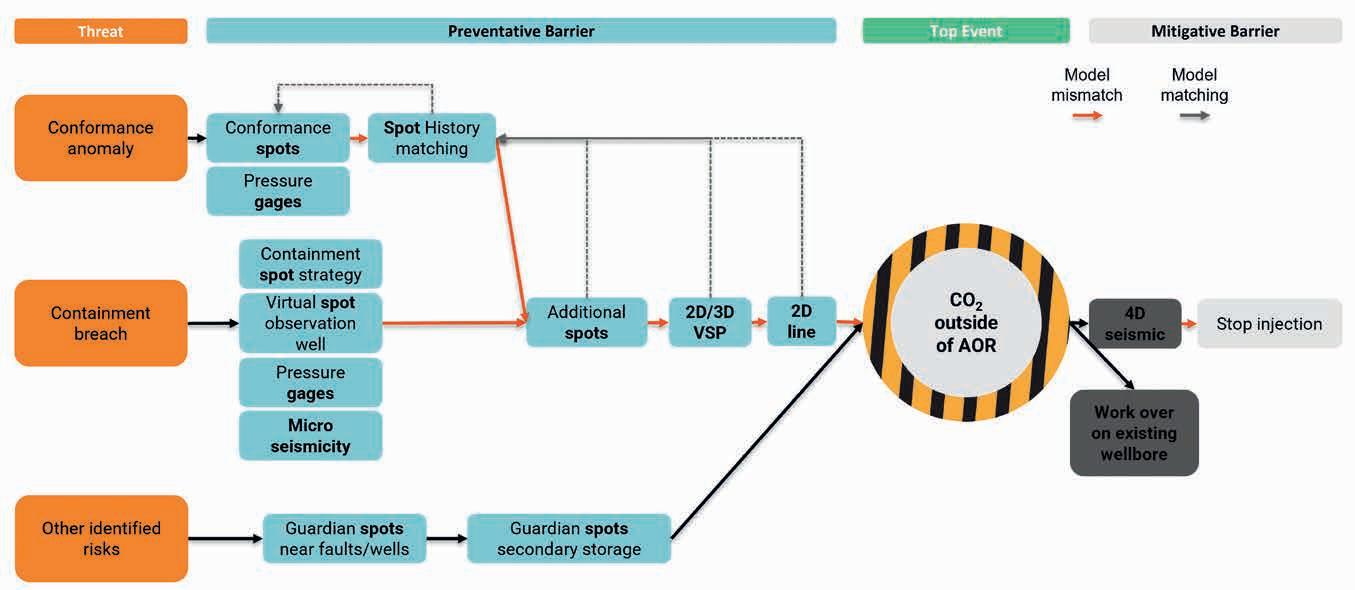
large areas, spot seismic relies on a single source-receiver configuration per location. For each acquisition, the monitoring is concentrated on 15 to 30 strategically selected subsurface locations, referred to as spots.
Spots-associated source and receiver locations are selected using legacy seismic image data, which are mined to identify optimal field locations for monitoring as shown in figure 3. This process also informs the design of the receiver or source antenna configuration (where applicable) to ensure effective signal acquisition and sensitivity at each spot.
Spot seismic is not just a concept, it’s a field-proven technology. Recognised as Technology Readiness Level (TRL) 8–9 in the Global CCS Institute’s State of the Art: CCS Technologies 2025 compendium, it has been successfully deployed across multiple CCS and CCUS projects, both onshore and offshore.
One of the flagship onshore implementations took place at the Weyburn field in Canada, where Spot Seismic was used over a four-year period (Brun et al., 2023). The results were later validated by a full 4D seismic survey, confirming the accuracy and reliability of the focused monitoring approach.
Most recently, Spot Seismic was implemented to monitor the first UK offshore CO2 injection at the Poseidon project, in the Leman field. This pioneering surveillance in a depleted gas field, involved agile acquisition design and integration with VSP, to enable early detection and model calibration during the injection phase (Festucci et al., 2025).
Spot seismic offers a seismic monitoring solution that is not only technically robust but also economically and environmentally efficient. By using just 10–30 source-receiver locations instead of the hundreds of thousands or even millions required for full-field 4D imaging, acquisition costs are drastically reduced.
Beyond cost, the environmental footprint is significantly minimised. Spot seismic reduces emissions, acoustic disturbance,
and operational impact by more than 95%, making it a sustainable choice for long-term CCS surveillance.
The duration of acquisition, typically 1 to 3 days, allows operators to schedule surveys during optimal weather windows or outside noisy hours, improving data quality and reducing risk. Offshore, this agility has enabled the use of vessels of opportunity, as demonstrated in the UK and Denmark (greensand) deployments.
Onshore and offshore, the method can be operated by local seismic providers using standard equipment, further enhancing societal acceptability and reducing logistical complexity.
Spot seismic is designed to complement – not replace – other monitoring tools as significant anomalies, such as leakage or unexpected plume migration, may also be detected through injection pressure monitoring, microseismic, or geochemical sampling. Integrating these measurements with Spot Seismic enhances the overall surveillance strategy, enabling multi-modal validation and early risk detection.
This synergy supports a layered monitoring approach, where spot seismic acts as a trigger mechanism, guiding the deployment of more intensive investigations only when necessary, optimising both safety and resource allocation.
The spot seismic technology can be seamlessly integrated into MMV plans and updated annually (or more frequently if needed).
As a trigger-based monitoring solution, spot seismic is designed to provide frequent, targeted insights into potential containment or conformance issues, early enough to prompt corrective actions.
These actions may include:
• Updating reservoir models
• Adjusting injection strategies
• Deploying denser data acquisition
This approach ensures that high-resolution imaging is not routine, but strategically triggered as shown in figure 4, only when and
where significant deviations are suspected, optimising both cost and operational efficiency
Implementing a predictive, model-driven monitoring approach offers tangible benefits across the entire CCS value chain. As illustrated in Figure 5, dynamic reservoir models are central to nearly every major decision point in a CCS project.
• Final investment decisions are based on flow simulations that estimate injection capacity and long-term behaviour.
• Project economics including revenue forecasts and cost models are derived from these simulations.
• Permits and insurance are granted based on risk assessments informed by model outputs.
• Certification for injection is typically drafted before any CO2 is stored, relying on model predictions.
In this context, a model-driven MMV strategy becomes more than a regulatory obligation, it becomes a strategic bridge between stakeholders: operators, regulators, insurers, certification body and the public. Predictive monitoring can reinforce trust in the model, validates assumptions, and provides a mechanism for early detection and response. It ensures that decisions made before injection are continuously supported by data during and after injection. Predictive monitoring shifts the narrative from reactive compliance to proactive stewardship.
The Energy Transition demands scalable, cost-effective, and socially acceptable solutions for CCS surveillance. While image-based, seismic monitoring has proven its value in early projects, its limitations: economic, operational, and environmental, will become increasingly apparent over the 30-60 year lifecycle of a storage site.
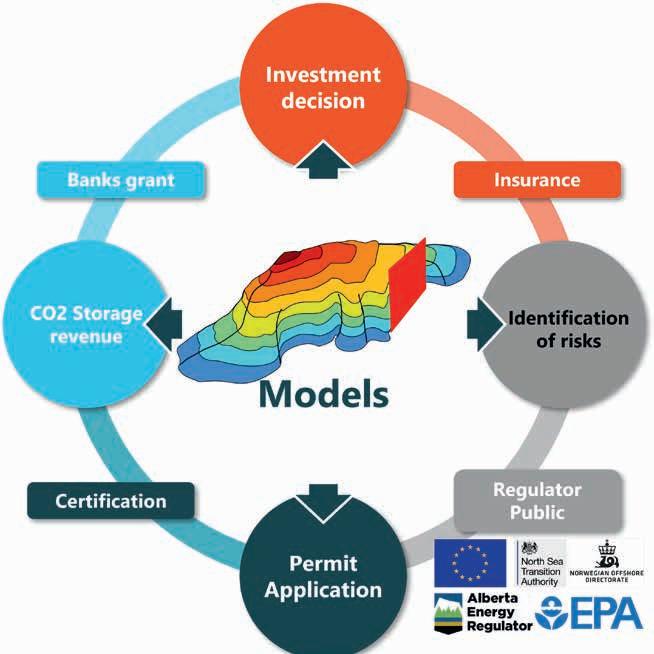
Spot seismic strategy offers a paradigm shift: from imaging everything to monitoring what matters, when it matters. By integrating predictive models and risk assessment analysis with focused, trigger-based seismic acquisition, this approach enables timely validation of plume behaviour, supports regulatory compliance, and fosters trust across stakeholders. It transforms surveillance from a reactive obligation into a proactive commitment to safety, transparency, and long-term stewardship.
We extend our heartfelt thanks to the SpotLighters and our expert committee and professor Jean-Luc Mari for helping us shape spot seismic technology.
A special mention to the pioneers of spot seismic technology that dare to implement this solution on their first CO2 injection. Discussion with regulators, certification and insurance companies also helped to shape this vision. Global and international organisations such as Global CCS institute and IOGP were also a very useful resource to build this article.
Al Khatib, H., Roth, T., Grobys, J. and Szabados, A. [2024]. CCS Predictive Maintenance Using Active Focused Seismic Monitoring. CCUS Conference, Houston 2024.
Bogachev, K., Milyutin, S. and Grishin, A. [2025]. A Dynamic Reservoir Modeling Approach Using the GERG-2008 Equation of State for CCUS Projects. SPE Advances in Integrated Reservoir Modelling and Field Development Conference, Abu Dhabi.
Brun, V. and Chen, S.Q. [2023]. Focused seismic CO2 monitoring: from detection to characterisation. GeoConvention 2023. European Parliament and Council. [2009]. Directive 2009/31/EC on the Geological Storage of Carbon Dioxide. Official Journal of the European Union, L 140/114.
Festucci, A., Mari, J.-L., Gestin, K. and Morgan, E. [2025]. Enabling CCS monitoring in the UK using an agile spot seismic operational model on the Poseidon project. Seismic 2025.
Furre, A.-K., Eiken, O., Alnes, H., Vevatne, J.N. and Kiær, A. [2017]. 20 Years of Monitoring CO2 Injection at Sleipner. Global CCS Institute. [2025]. State of the Art: CCS Technologies 2025.
Government of Alberta. [2022]. Monitoring, Measurement and Verification Principles and Objectives for CO2 Sequestration Projects. Alberta Energy.
Hopkins, J., Mateeva, A., Harvey, S., Kiyashchenko, D. and Duan, Y. [2021]. Maturing DAS VSP as an onshore CCUS monitoring technology at the Quest CCS Facility. GeoConvention Conference 2021.
Morgan, E., Garden, M., Egreteau, A., Boubaker, Y., Gestin, K. and Mari, J.-L. [2020]. Focused and continuous ultra-light seismic monitoring: a gas storage example. EAGE Annual Conference 2020. North Sea Transition Authority (NSTA). [2022]. Measurement, Monitoring and Verification (MMV) of Carbon Capture and Storage (CCS) Projects with Co-Location Considerations.


Rami Niemi1, Harun Bitlis1*, Erika Salmenvaara1 and Valtteri
Viitala1 present a coaxial geothermal system that will contribute to a paradigm shift towards future-proofed urban energy systems.
Introduction
Geothermal energy offers a highly attractive solution for sustainable urban heating and cooling. By harnessing the Earth’s inherent heat stored beneath the surface, geothermal systems provide a stable, emission-free and local heat source that can operate continuously year-round. However, conventional geothermal approaches face limitations. Shallow, ~300-m deep geothermal systems, like ground source heat pumps with u-tube design, are limited in capacity and require large land areas, which are often unavailable in dense urban settings. Meanwhile, traditional aquifer-based deep geothermal plants, typically also used for electricity generation, face high upfront costs, geological uncertainties, and complex operation, restricting their widespread urban application.
In response to these challenges, QHeat has developed an innovative coaxial deep geothermal heat well technology, capable of deep heat extraction and storage, installed at depths ranging from 1000 to 2000 m. This system is engineered to operate reversibly, providing both heating and cooling via integration with heat pumps. The reversible flow also allows us to use the well for storing excess heat, making it perfectly suited for the flexible demands of modern urban environments. The coaxial design optimises thermal performance and enables integration within the framework of 5th Generation District Heating and Cooling (5GDHC) networks, which represent the next evolution in decentralised, bi-directional, and low-temperature thermal grids designed for sustainable cities.
This article presents a comprehensive overview of the coaxial geothermal system developed by QHeat, covering the core technical principles, design innovations, operational advantages, and a detailed case study from Finland. Furthermore, it explores how this technology contributes to the broader paradigm shift towards future-proof urban energy systems.
Coaxial well architecture
QHeat’s patented geothermal system features a highly efficient coaxial, closed-loop design that optimises thermal energy
1 QHeat
* Corresponding author, E-mail: harun.bitlis@qheat.fi
DOI: 10.3997/1365-2397.fb2025081
exchange using a single insulated inner pipe within the wellbore. In this reversible flow setup, heated fluid rises to the surface through the fully insulated inner pipe, which minimises heat loss and preserves high temperatures for heating applications. Simultaneously, cooler fluid flows downward through the annular space between the insulated pipe and the well casing — extending into the open hole — where it absorbs heat conducted from the surrounding bedrock. This configuration maintains critical temperature gradients and enhances energy efficiency by allowing the flow direction to be reversed as needed.
Each 1.5-km deep QHeat heat well, that is combined with a heat pump, is capable of providing sufficient thermal energy for roughly 15,000 m2 of commercial or residential space, corresponding to approximately 1 gigawatt-hours (GWh) of heat annually. In comparison to a gas boiler generating 1 GWh heat, QHeat well can save ~95% of the CO2 emissions, or ~230 tCO2e / GWh3. All this makes it well suited for district heating projects or large-scale buildings like hospitals.
Unlike conventional geothermal systems that depend on rare hydrothermal convection with naturally occurring hot fluids, QHeat’s system relies only on conductive heat transfer from the abundant and widespread bedrock. This approach ensures a high level of predictability and scalability across a wide variety of geological conditions, since it does not require specific hydrothermal reservoirs. The result is a robust and adaptable geothermal heating solution that can be deployed in many locations, making sustainable heating more accessible and efficient.
A fundamental innovation of the QHeat system lies in its capability to reversibly control fluid flow direction within the geothermal well. During periods of reduced heating demand, surplus thermal energy can be effectively stored by injecting heated fluid downward into the well’s lower section. Through conductive heat transfer, this thermal energy is absorbed by the surrounding geological formations, thereby transforming the geothermal well into a reliable seasonal thermal energy storage medium. When heating demand increases, the stored heat is
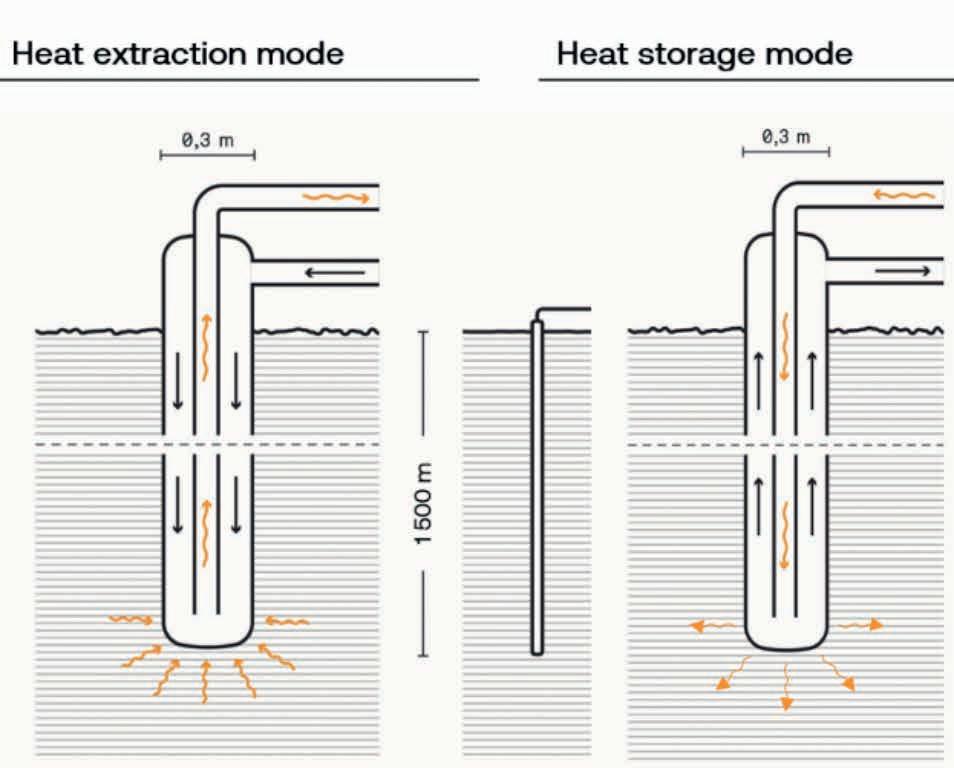
recovered by reversing the flow direction, enabling the extraction of warmed fluid at the surface.
This seasonal reversible flow functionality represents a significant advancement, converting the geothermal well from a conventional unidirectional heat extraction system into a versatile, dynamic thermal energy storage unit. The system operates in two primary modes:
• Heating mode: In colder seasons, cold working fluid is pumped downward through the annular space surrounding the insulated inner pipe, where it acquires heat via conduction from the deep bedrock. The now heated fluid ascends through the insulated inner pipe and is supplied to district heating networks or heat pump systems for space heating and domestic hot water production.
• Cooling and storage mode: During warmer months or times of excess heat availability, warm fluid is injected downward via the insulated inner pipe into the bottom of the well, transferring heat back into the geological formation. This process facilitates long-term subsurface thermal energy storage, enabling the retention of heat for subsequent retrieval when heating demand resurfaces.
This dual-mode operation enables the geothermal well to serve as a large-scale seasonal Borehole Thermal Energy Storage (BTES) system, addressing the critical challenge of aligning renewable heat supply with variable seasonal heat demand. Moreover, this approach enhances operational flexibility by allowing thermal energy to be deposited underground during periods of surplus and withdrawn during peak demand, thereby optimising system efficiency and contributing to sustainable energy management.
The system leverages conductive heat transfer from the bedrock to the circulating water. Unlike hydrothermal systems, which depend on naturally occurring hot water or steam reservoirs, limited in location and subject to geological constraints, the coaxial system utilises the stable and predictable conductive heat of typical bedrock formations found worldwide.
This conduction-based approach offers several advantages:
• Predictability: Rock thermal conductivity and capacity are well studied, allowing precise thermal modelling and design optimisation for each installation.
• Scalability: The system is adaptable to a wide range of geological settings, not restricted to rare hydrothermal fields.
• Low environmental impact: No need for fracturing or largescale fluid extraction, reducing risk of induced seismicity or groundwater contamination.
In heating mode, geothermal fluid temperatures from coaxial wells typically range between 5°C and 15°C, which are insufficient for direct supply to district heating networks. Therefore, the integration of high-performance heat pumps is an essential component of the system. These heat pumps are installed at local heating centres or within individual buildings to elevate the geothermal heat to the necessary temperature levels for the usage.
Using electricity, the heat pumps upgrade the low-temperature fluid to temperatures typically above 55°C, suitable for space heating and domestic hot water production. With Coefficients of Performance (COP) often exceeding 5, the system efficiently delivers five units of thermal energy for every unit of electrical energy consumed, demonstrating a highly effective method for electrifying urban heating. The high efficiency is possible because heat pumps operate more efficiently when the temperature difference between the heat source and the target level is smaller.
This hybrid geothermal heat pump system combines the reliability of geothermal heat sources with the flexibility and efficiency of modern heat pumps. It allows dynamic adaptation to fluctuations in heat demand.
The operation of coaxial geothermal wells relies on advanced sensors and automated control systems. Sensors placed along the well continuously monitor important factors like flow rates, pressure, and temperature in real time. This data allows for precise control and helps to quickly identify any issues.
Smart control software uses this information to adjust the heating and cooling cycles, making the system more efficient. It can also detect problems early and predict when maintenance is needed, which reduces downtime and lowers the risk of failures.
Additionally, the system can connect with smart grids and building management systems to respond to changing energy demands, improving overall energy efficiency while keeping users comfortable.
Seasonal Borehole Thermal Energy Storage (BTES) potential
The reversible coaxial well technology enables a powerful form of seasonal thermal energy storage, wherein excess heat collected or generated in warmer months can be injected and stored deep underground for extraction during the colder heating season. This method leverages:
• Low thermal diffusivity of bedrock, which limits heat loss over time and maintains stored heat effectively.
• Great depth of heat injection (typically >1,000 m), providing thermal insulation from surface temperature variations and seasonal fluctuations.
By slightly raising the temperature of subsurface rock, significant quantities of thermal energy can be stored — potentially enough to meet a substantial portion of the annual heating demand for local district heating networks. The storage potential depends on factors such as borehole depth, downhole temperature, and the thermal properties of the geological formation.
Multifaceted benefits
Grid load balancing: By storing excess heat generated during renewable electricity production peaks (e.g., solar photovoltaic generation in summer), the system helps to flatten demand curves and reduces the need for fossil-fuelled peak heating plants, enhancing grid stability and reducing emissions.
Waste heat utilisation: Many urban processes produce lowgrade heat (from data centres, industrial plants, biomass facilities, or waste incineration) often wasted to the environment. The coaxial geothermal system can capture this heat and store it underground for future use, increasing overall energy efficiency.
Emission reductions: By substituting fossil fuel and other incineration-based heating and enabling renewable electricity-driven heat pumps, the system achieves significant carbon emission reductions, contributing to municipal and national climate goals.
Urban land use efficiency: Unlike large above-ground thermal storage tanks or tens of shallow geothermal installations, deep geothermal wells occupy minimal surface area, crucial for space-constrained urban environments where land is scarce and expensive.
Reliability and resilience: Thermal storage creates a buffer against energy price volatility and supply disruptions, improving urban energy security and self-sufficiency in the face of external shocks or extreme weather events.
The thermal energy storage capacity of subsurface systems depends on several factors, including well depth, the thermal properties of the surrounding rock (such as thermal conductivity and specific heat capacity), and the volume of heat injected. Typical wells can store several hundred megawatt-hours (MWh) of thermal energy — potentially enough to meet a significant portion of district heating demand over several months, depending on subsurface conditions and operational parameters.
Thermal modelling and simulation of heat injection and extraction cycles are essential to optimising operation, ensuring maximum efficiency and minimal thermal degradation of the rock formation over time. These models help to prevent thermal interference between wells in dense networks and support longterm sustainability of storage performance.
Evolution from earlier generations
District Heating and Cooling (DHC) has evolved substantially over the past century:
• 1st Generation: High-temperature steam systems primarily serving industrial applications.
• 2nd Generation: Hot water networks operating at 70-120°C, common in mid-20th-century urban systems.
• 3rd Generation: Lower temperature hot water (~70-90°C) to improve energy efficiency and reduce losses.
• 4th Generation: Low-temperature networks (~50-60°C) emphasising renewables and waste heat integration.
• 5th Generation (5GDHC): Characterised by very low temperature operation (~25-40°C), decentralisation, bidirectional flow, and high flexibility.
Characteristics of 5GDHC 5GDHC networks enable:
• Decentralised and bidirectional network: Buildings can act as both energy consumers and producers, exchanging excess heat and cold with the network.
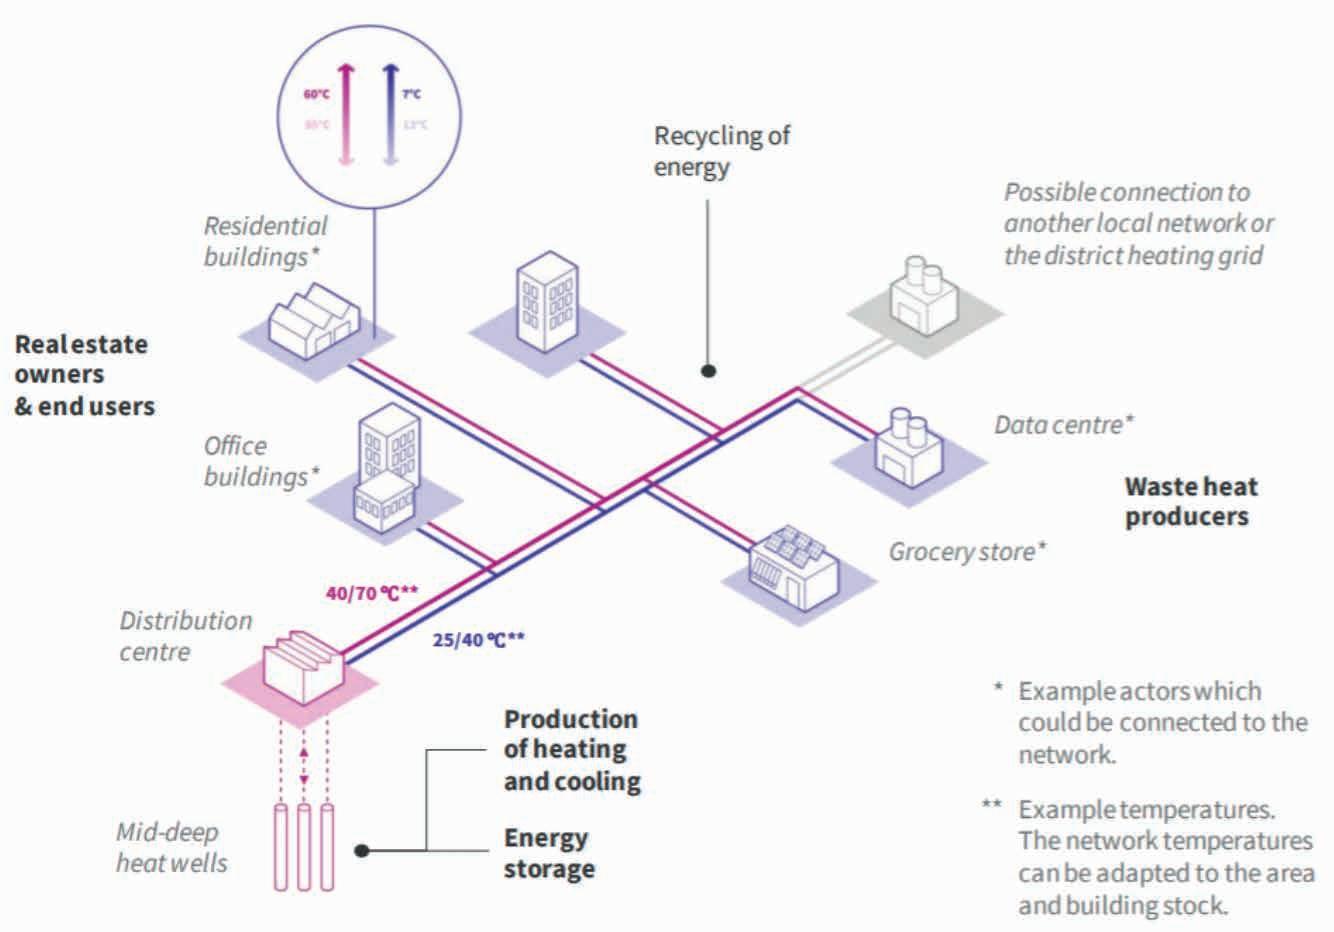
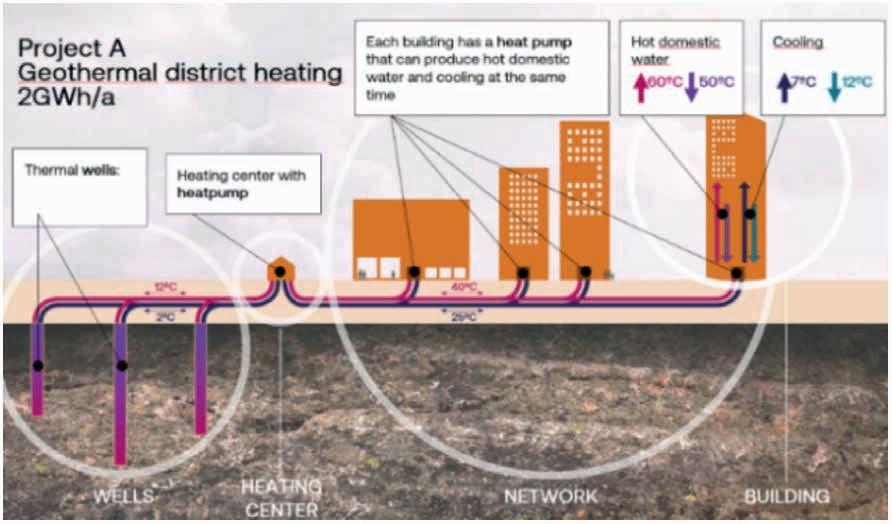
• Ultra-low temperatures: Unlike previous generations, 5GDHC network (~25-40°C) operates close to ambient temperature, reducing heat losses and improving the system efficiency.
• Heat pumps for flexibility: The system uses heat pumps to raise or lower temperatures to buildings’ specific needs at the point of consumption, enhancing energy efficiency. Low-temperature network is very compatible with heat pumps, since heat pumps use temperature differences to move thermal energy rather than generating heat directly.
• Renewable and waste heat integration can utilize geothermal energy, industrial waste heat, data centre excess heat, and other local sources.
• Smart control systems providing real-time demand response, grid interaction, and optimisation for maximum efficiency and comfort.
QHeat’s Role in 5GDHC
QHeat’s coaxial geothermal wells serve as distributed thermal hubs within 5GDHC networks, enabling:
• Stable and predictable production: Provides year-round heating and cooling without weather dependency.
• Low operating temperature: Matches the near-ambient temperature of 5GDHC, minimising heat losses and generating high energy efficiency for the heat pumps.
• Decarbonisation and efficiency: Reduces reliance on fossil fuels while improving network energy balance.
• Storage capability: Acts as a thermal battery, optimising heat use throughout the year.
Urban residential heating project in Finland
Project overview
The pilot project in a high-density Helsinki capital region demonstrates the real-world feasibility and advantages of deep coaxial geothermal heat wells integrated into a local district heating and cooling network. This network serves a residential complex totalling 250 apartments and a floor area of 14,000 m², providing heating, cooling, and domestic hot water.
Wells 3
Annual Output 2.000 MWh
Peak Power >550 kW
CO2 Reduction Potential 460 t CO2 /year (~2 GWh gas offset
Integration
Connected to district retun lines
Cost Component Amounth Details
Drilling (3 wells)
€2-2.5 M As lump sum
Surface Equipment €600 k Heat pumps, control systems
Total CAPEX ~€3 M Payback: ~8 yeard (vs. gas boilers)
Table 1 Project technical and financial summary.
Technical setup
• Three coaxial wells, to maximum a depth of 1500 m within a constrained urban footprint, minimising disturbance.
• A low-temperature thermal network interconnects several residential buildings, distributing geothermal heat and cooling efficiently.
• Cooling is produced by a hybrid heat pump and the heat storage capability is performed for heat storage of solar collectors that produce excess heat during the summer. This is QHEAT’s patented solution.
• Annual heat supply reached 2.0 GWh, meeting 98% of the residential heating demand.
• System-wide average COP of 5.5, indicating highly efficient heat pump operation.
• CO2 emissions reduced by approximately 460 tons annually, a meaningful contribution to local climate targets.
• Cooling demands were met effectively during the summer, improving resident comfort while reducing peak electrical loads.
Market potential and scalability
European heating market context
Heating represents approximately half of Europe’s total energy consumption, with fossil fuels accounting for roughly 60% of
this demand. EU climate policies, including the Green Deal and Fit for 55 targets, mandate aggressive reductions in carbon emissions, spurring a vast market for renewable heating technologies.
Opportunities for coaxial geothermal systems
• Ideal for dense urban areas where land is scarce and surface geothermal options are limited.
• Adaptable to various building types: residential, commercial, and industrial.
• Compatible with existing district heating infrastructure, enabling phased, cost-effective transitions.
• Supports integration of diverse renewable and waste heat sources for robust urban energy ecosystems.
Policy and investment drivers
• EU and national subsidies incentivise renewable heat infrastructure investments.
• Carbon pricing enhances economic competitiveness of geothermal solutions.
• Public-private partnerships can accelerate deployment and risk-sharing.
• Continued investment in R&D will improve drilling techniques, materials, and system integration for even greater efficiency and cost reductions.
Future outlook and innovation pathways
Integration with smart grids and digitalization
The application of IoT and AI technologies enables advanced predictive control of heat extraction/injection schedules, maintenance needs, and demand forecasting, optimising system performance and cost-effectiveness.
Hybrid systems and sector coupling
Combining geothermal systems with solar PV, heat pumps, data centres, and hydrogen infrastructure can create integrated urban energy ecosystems that are efficient, flexible, and resilient.
While initial deployments focus on geologically favourable Scandinavian regions, coaxial geothermal technology has potential in diverse geological settings globally, broadening the impact of sustainable urban heating.
Ongoing innovations in drilling efficiency, pipe insulation materials, corrosion resistance, and automated well construction will reduce costs, increase lifespan, and improve system reliability.
QHeat’s coaxial deep geothermal heat well technology marks a pivotal advancement in urban renewable heating and cooling. By enabling efficient, reversible heat extraction and seasonal storage at significant depths, it provides a robust backbone for 5th Generation District Heating and Cooling networks — decentralised, low-temperature, flexible thermal grids essential to future sustainable cities.
This technology drives decarbonisation, enhances grid resilience, lowers costs, and improves urban liveability, all while integrating seamlessly into existing urban environments. With continued innovation, supportive policies, and growing investments, coaxial deep geothermal wells are positioned to become a cornerstone technology in the global energy transition towards net-zero urban energy systems.
Buffa, S., Cozzini, M., D’Antoni, M., Baratieri, M. and Fedrizzi, R. [2019]. 5th generation district heating and cooling systems: A review of existing cases in Europe. Renewable and Sustainable Energy Reviews, 104, 504-522.
Lund, H., Werner, S., Wiltshire, R., Svendsen, S., Thorsen, J. E., Hvelplund, F. and Mathiesen, B.V. [2014]. 4th Generation District Heating (4GDH): Integrating smart thermal grids into future sustainable energy systems. Energy, 68, 1-11.


21-22
28-30
12-14 Nov First EAGE Workshop on Surface Logging www.eage.org
12-14 Nov Third EAGE Workshop on Geothermal Energy in Latin America www.eage.org
12-14 Nov EAGE/Aqua Foundation Third Indian Near Surface Geophysics Conference & Exhibition www.eage.org
18-20 Nov EAGE/FESM Conference on Petrophysics Meets Geoscience: Unlocking Reservoir Potential in a Dynamic Energy Landscape www.eage.org
18-20 Nov International Geomechanics Conference www.igsevent.org
18-20 Nov SBGf Conference Rio’25 www.rio25.sbgf.org.br
24-26 Nov Third EAGE Seabed Seismic Today Workshop www.eage.org
30 Nov4 Dec 19 th Workshop of the International Lithosphere Program www.ilp19.com
1-3
6
EAGE/DGG


500+ ATTENDEES


100+ TECHNICAL PRESENTATIONS


80+ STRATEGIC SPEAKERS

20+ EXHIBITORS