All rights reserved. First Break or any part thereof may not be reproduced, stored in a retrieval system, or transcribed in any form or by any means, electronically or mechanically, including photocopying and recording, without the prior written permission of the publisher.
PAPER
The publisher’s policy is to use acid-free permanent paper (TCF), to the draft standard ISO/DIS/9706, made from sustainable forests using chlorine-free pulp (Nordic-Swan standard).
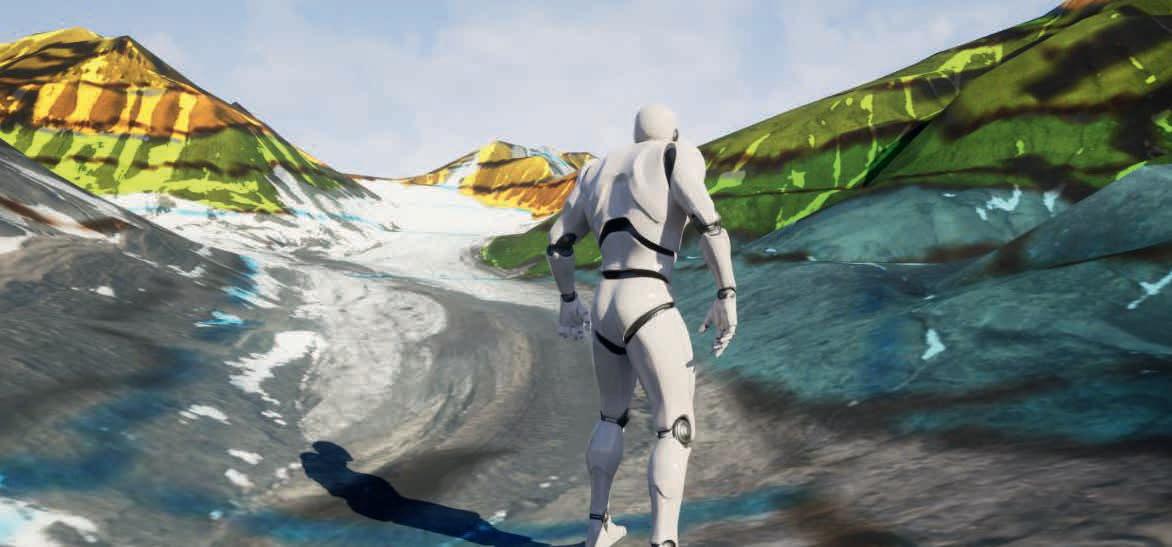
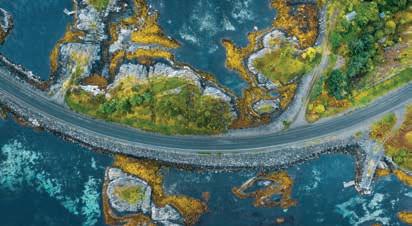
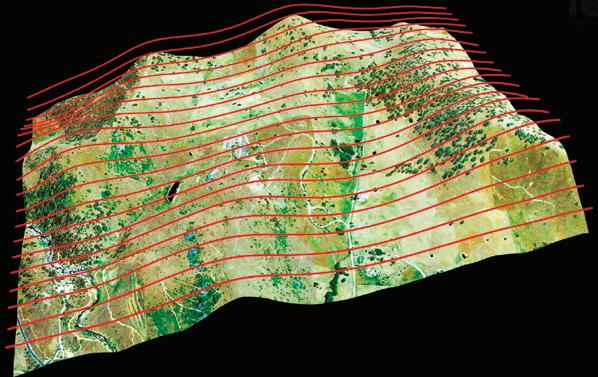
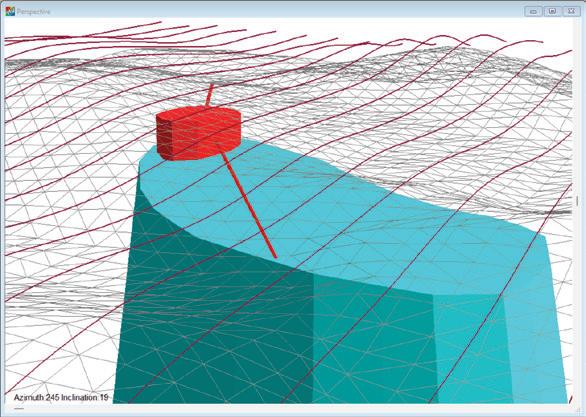
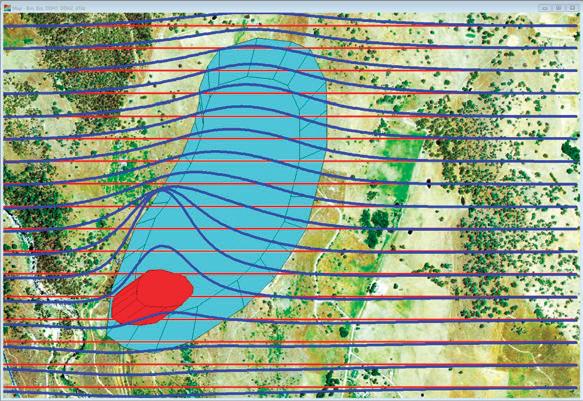
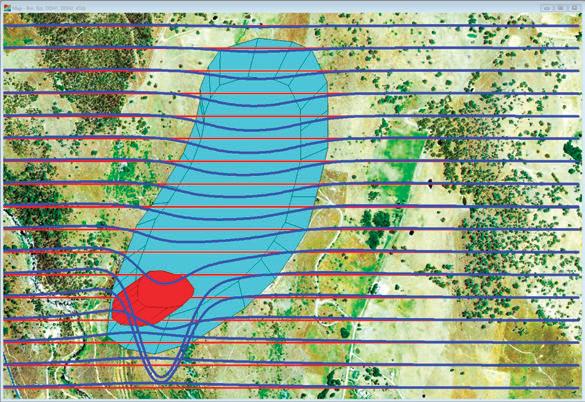
The use of gaming and geodata visualisation in preparation for high Arctic research fieldwork
31 The use of gaming and geodata visualisation in preparation for high Arctic research fieldwork
Daniel Kramer, Marius Opsanger Jonassen, Kim Senger, Rafael Kenji Horota and Solveig Solem
Special Topic: Environment, Minerals and Infrastructure
39 Ultra high-resolution shallow marine imaging with a sparker over a deep streamer
Vetle Vinje, Florian Josse, Thibaut Choquer, Peng Zhao, Isabelle Thauvin, Patrick Charron and Philippe Herrmann
47 Timing the triggers: Radiocarbon chronostratigraphy for geohazard assessment in offshore Myanmar
Joy Muraszko, Elena Grimoldi, Riccardo Borella, Andrea Caburlotto and Francesca Zolezzi
53 Global inversion of ERT and IP data using VFSA for improved detection and uncertainty assessment of leachate accumulation in urban landfills
Giorgio De Donno, Michele Cercato and Davide Melegari
59 An exploratory geophysical study focused on a site of a wind energy generation park
Ana Abreu, Nicolás Valverde, Valentina Curutchet, Misael Lemes, Santiago Delgado, Freddy Rondon and Javier Sánchez-Rojas
66 Calendar
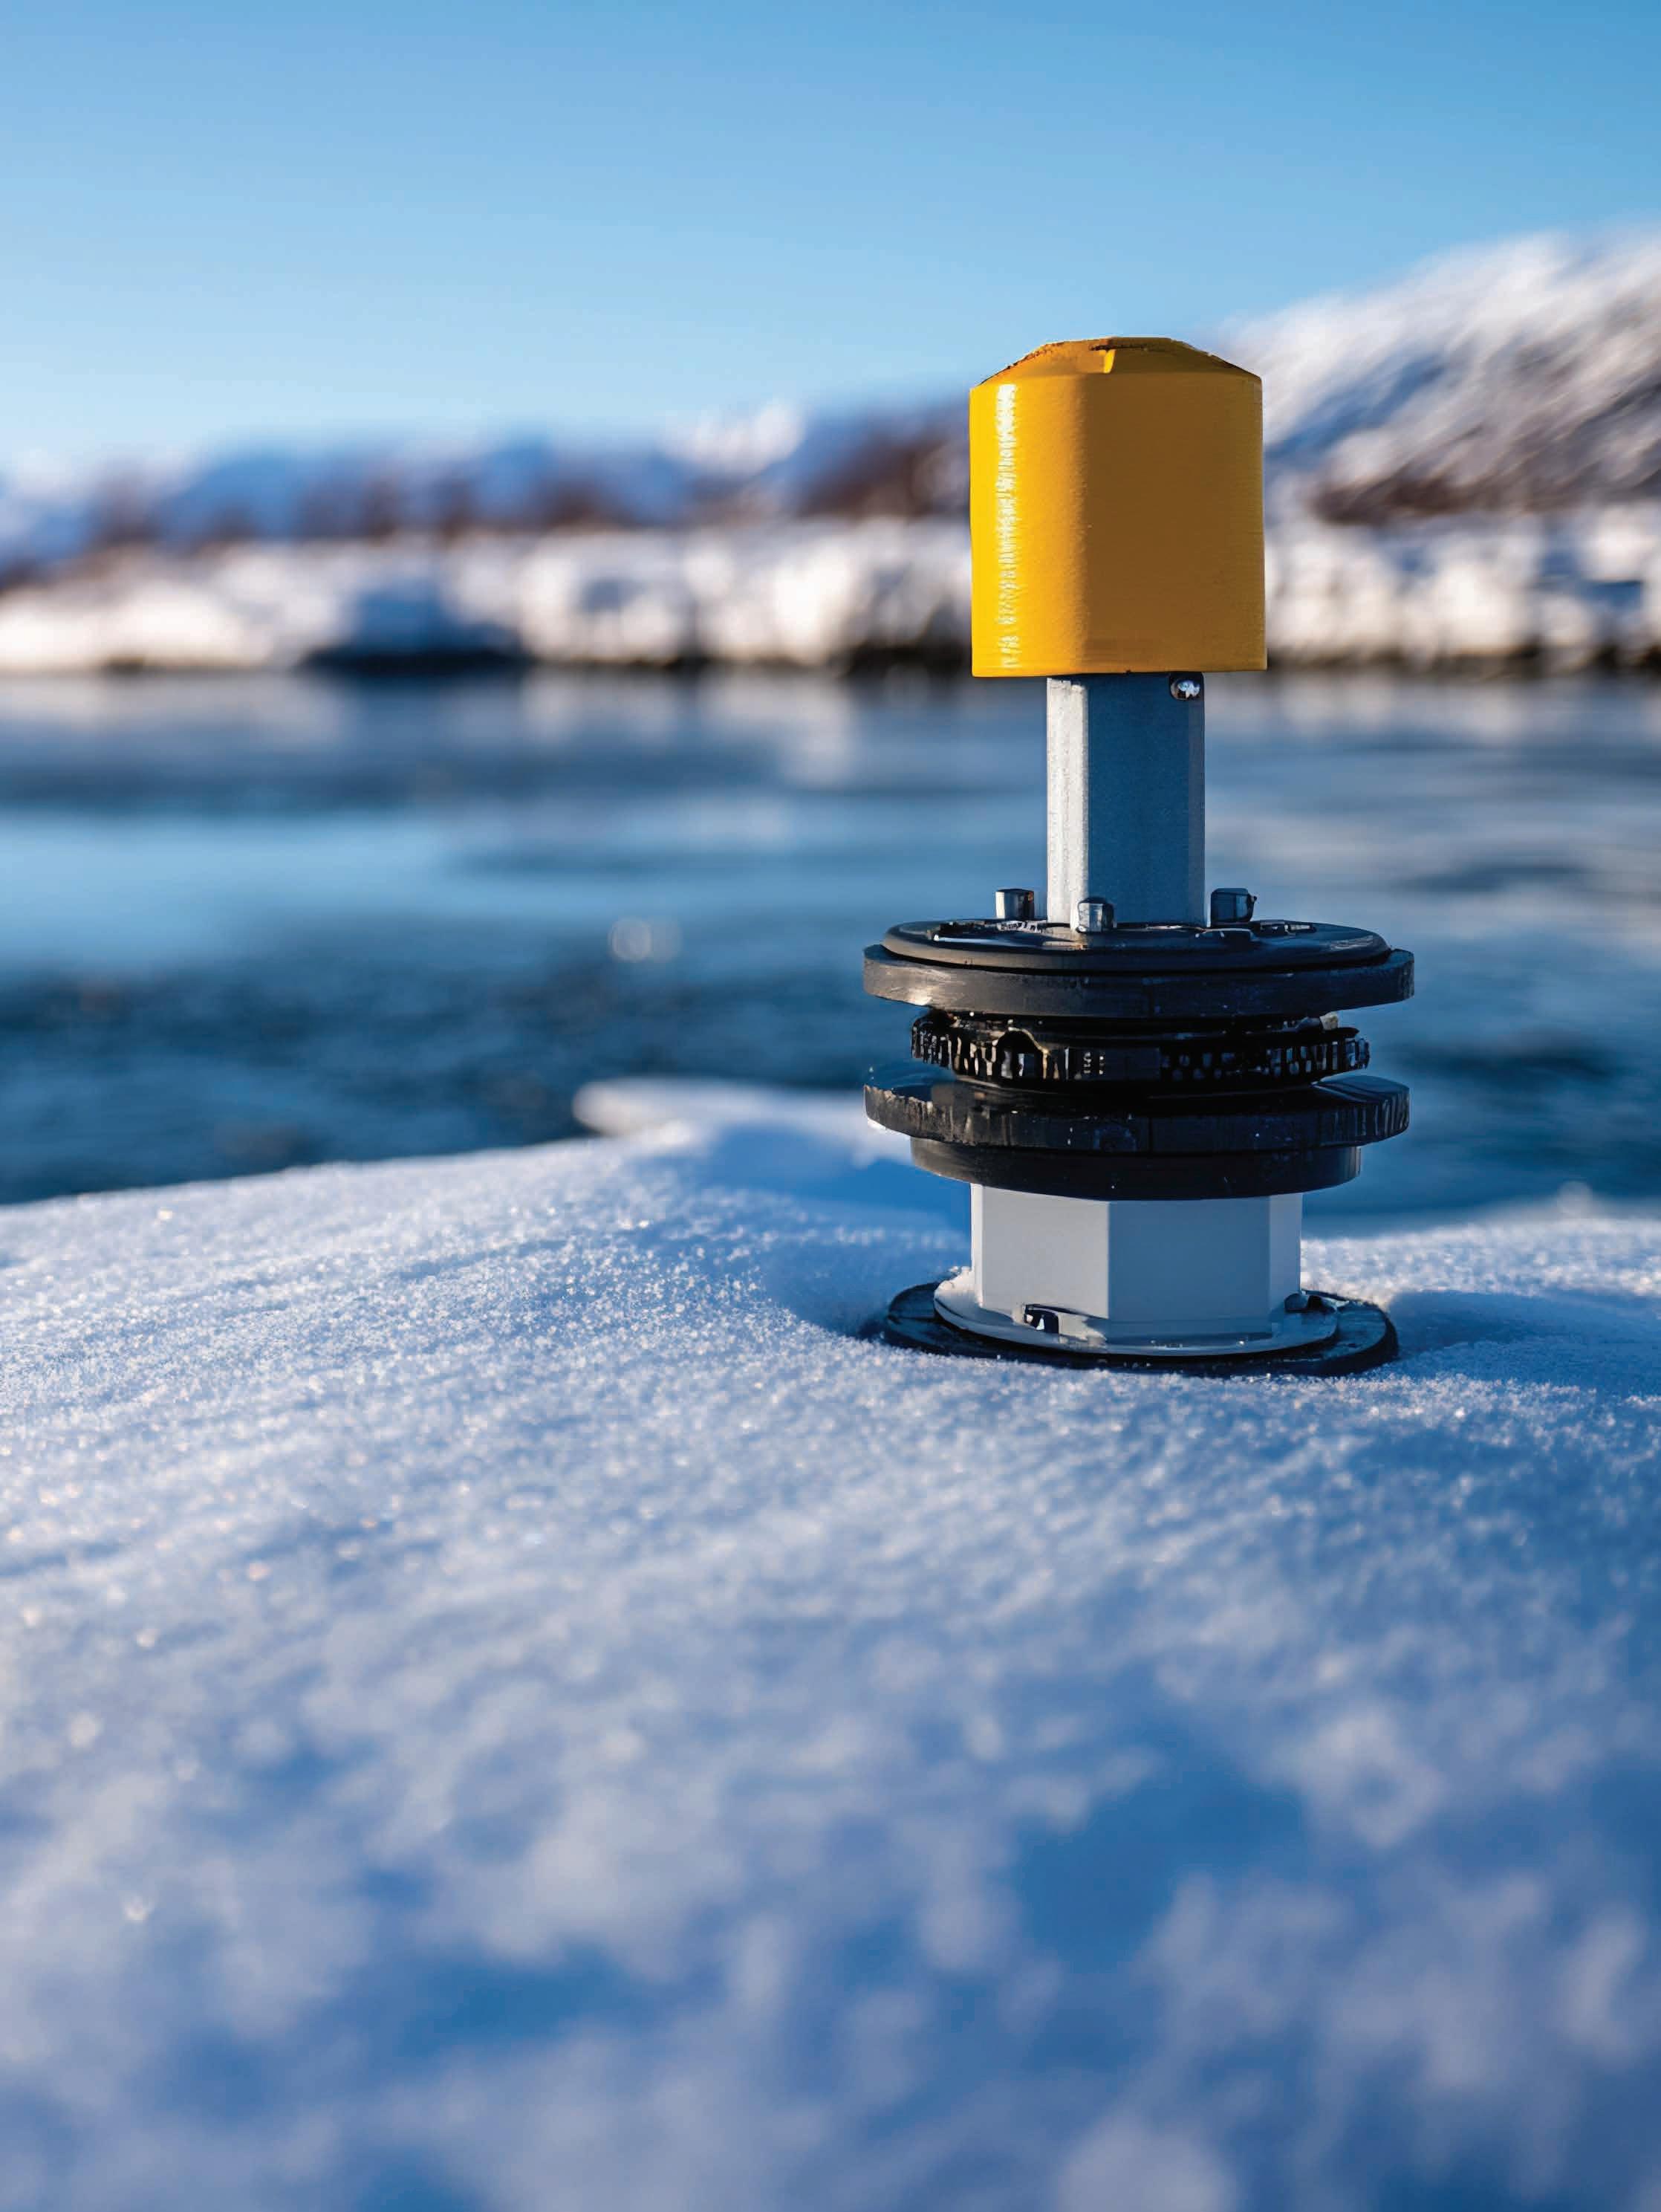
cover: Navigational beacon in an Arctic region. This month we feature a study using gaming and geodata visulation in preparation for Arctic fieldwork.
European Association of Geoscientists & Engineers Board 2025-2026
Environment, Minerals & Infrastructure Circle
Andreas Aspmo Pfaffhuber Chair
Florina Tuluca Vice-Chair
Esther Bloem Immediate Past Chair
Micki Allen Liaison EEGS
Martin Brook Liaison Asia Pacific
Ruth Chigbo Liaison Young Professionals Community
Deyan Draganov Technical Programme Representative
Madeline Lee Liaison Women in Geoscience and Engineering Community
Gaud Pouliquen Liaison Industry and Critical Minerals Community
Eduardo Rodrigues Liaison First Break
Mark Vardy Editor-in-Chief Near Surface Geophysics
Jonathan Redfern Editor-in-Chief Petroleum Geoscience
Robert Tugume Member
Anke Wendt Member
Martin Widmaier Technical Programme Officer
Sustainable Energy Circle
Giovanni Sosio Chair
Benjamin Bellwald Vice-Chair
Carla Martín-Clavé Immediate Past Chair
Emer Caslin Liaison Technical Communities
Sebastian Geiger Editor-in-Chief Geoenergy
Maximilian Haas Publications Assistant
Dan Hemingway Technical Programme Representative
Carrie Holloway Liaison Young Professionals Community
Adeline Parent Liaison Education Committee
Longying Xiao Liaison Women in Geoscience and Engineering Community
Martin Widmaier Technical Programme Officer
SUBSCRIPTIONS
First Break is published monthly. It is free to EAGE members. The membership fee of EAGE is € 85.00 a year including First Break, EarthDoc (EAGE’s geoscience database), Learning Geoscience (EAGE’s Education website) and online access to a scientific journal.
Companies can subscribe to First Break via an institutional subscription. Every subscription includes a monthly hard copy and online access to the full First Break archive for the requested number of online users.
Orders for current subscriptions and back issues should be sent to First Break B.V., Journal Subscriptions, Kosterijland 48, 3981 AJ Bunnik, The Netherlands. Tel: +31 (0)88 9955055, E-mail: subscriptions@eage.org, www.firstbreak.org.
First Break is published by First Break B.V., The Netherlands. However, responsibility for the opinions given and the statements made rests with the authors.
Mike Branston Vice-President
Sanjeev Rajput President
Martin Widmaier Technical Programme Officer
Andreas Aspmo Pfaffhuber Chair Environment, Minerals & Infrastructure Circle
Maren Kleemeyer Education Officer
Johannes Wendebourg Chair Oil & Gas Geoscience Circle
Giovanni Sosio Chair Sustainable Energy Circle
Diego Rovetta Membership and Cooperation Officer
Eric Verschuur Publications Officer
Christian Henke Secretary-Treasurer
Maximising energy resources is the theme for next year’s Annual in Aberdeen
Ariel Flores, senior vice president, subsurface, bp, and chair, Local Advisory Committee, sets the scene for 87th EAGE Annual Conference & Exhibition being held in Aberdeen, Scotland on 8-11 June 2026 at the P&J Live Convention Centre.
EAGE’s 2026 theme is Maximizing Recovery: Unlocking Value Through Technology and Partnerships, building on the successful, well attended event held in Toulouse, France. This is especially relevant as the world is in an ‘energy addition’ phase – consuming increasing amounts of both fossil fuels and low carbon energy to meet growing demand. The reality is that oil and gas will be needed for decades to come, with demand continuing to be robust beyond 2035.
Meeting this demand will only be possible by utilising the latest technology and leveraging strategic partnerships to maximise recovery in a cost challenged environment. The geoscience and engi-
neering community has much to contribute by coming together with key partners to address the challenges and opportunities ahead. The conference therefore provides a much-needed platform to explore ideas and build the networks needed for the work ahead.
The programme has been designed to engage, inspire and facilitate collabo ration. There will be representation from industry, academia, IOCs, NOCs and many more experts and thought leaders. It is made up of keynote presentations, technical sessions, workshops, field trips and a major exhibition showcasing the latest industry trends, research and tech nology.
This will be the first time the con ference is held in Aberdeen. Known for decades as a global hub for oil and gas, the city is now also a leading force in energy transition, aiming to become the Net Zero Capital of Europe. Aberdeen brings together deep industry knowledge, cutting-edge research, and a growing eco system of low-carbon innovation. Beyond the conference, delegates can explore a region rich in natural beauty and culture. From striking coastlines and historic castles to world-famous whisky and warm
Scottish hospitality, Aberdeen offers a truly memorable setting for this landmark EAGE gathering.
Finally, I would like to thank everyone who has helped to make this event possible, and I look forward to continuing the conversation with you all in Aberdeen.
Whether you’re a returning attendee or joining EAGE Annual for the first time, EAGE Annual 2026 offers an opportunity to reconnect with colleagues, explore new technology, attend presentations, meet clients, search for career opportunities, or simply stay engaged with the latest in geoscience and engineering. Stay updated on www.eageannual.org.
New Circle is born
Underground hydrogen storage at GET
Kaust team wins Laurie Dake Challenge
Ariel Flores.
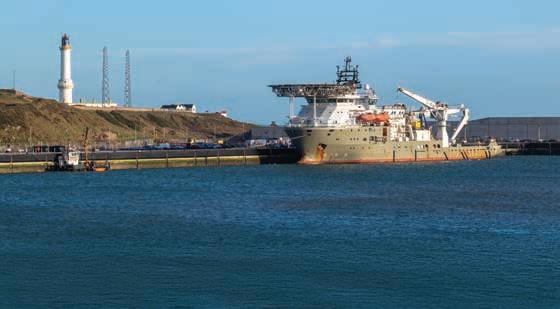
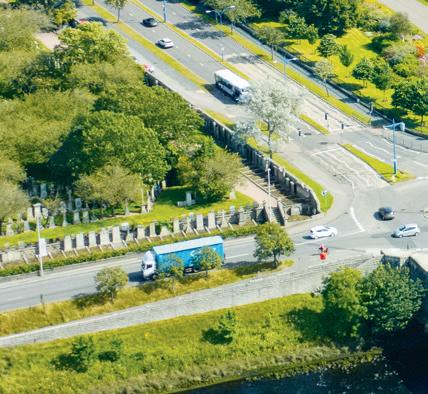
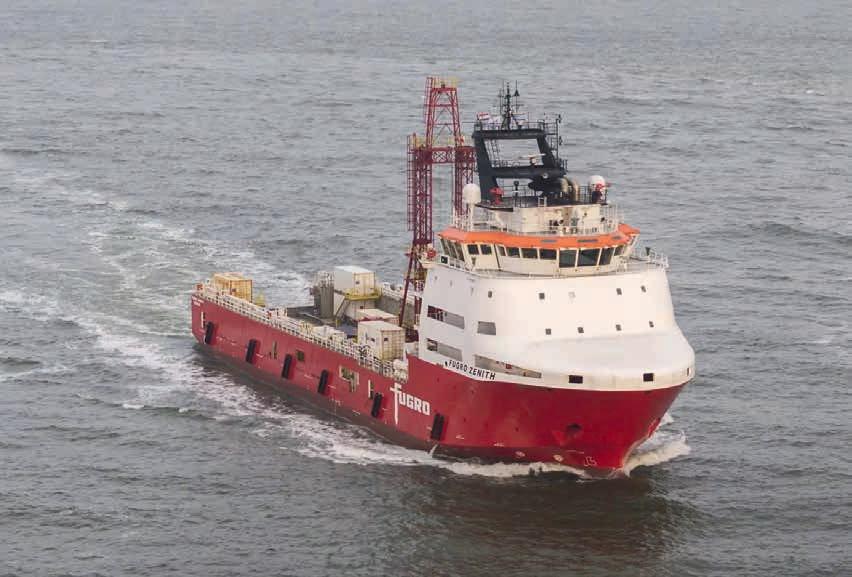
Boka Atlantis, an offshore support vessel berthed in the new part of Aberdeen Harbour.
Wide-ranging Strategic Programme planned for GET meeting
A major feature of this year’s EAGE Global Energy Transition (GET) Conference & Exhibition in Rotterdam on 27–31 October 2025, will once again be the Strategic Programme. It is expanding significantly in both size and scope, with an exceptional line-up of high-level speakers across the energy landscape, from policy, regulation, and industry.
These high-level panel discussions bring together industry leaders, academics and analysts to discuss the wider economic and policy issues affecting global energy transition and have played a key role in the increasing popularity of the GET programme. Early confirmed panellists include directors, vice-presidents, and advisers from leading organisations such as the European Commission, Shell, Equinor, EBN, Viridien, Microsoft, and TNO, alongside influential researchers and policy experts from institutions like The Hague Centre for Strategic Studies, NTNU, and TU Delft.
Here’s a quick look at what to expect:
Geopolitical reset: Power, policy, and the global energy future
Tracking the momentum of global decarbonisation initiatives has become increasingly complicated by geopolitical turmoil. With topics ranging from regional policy to global supply and demand scenarios, the panel aims to bring clarity to ongoing climate agreements, the rise of renewables, and how to track real progress in our complex, fast-changing world.
Critical raw materials in Europe
As Europe pushes forward with clean energy goals, securing access to critical raw materials (CRMs) is more important than ever. EU policy, circularity, land and
Not too late
Diederik Samsom to speak on climate issues at Opening Ceremony
An important highlight of the Opening Ceremony on 27 October will be a keynote by Diederik Samsom, former party leader of the Dutch Labour Party and chief of staff to the European Commission’s Commissioner for Climate Action. Drawing on his deep experience in energy, climate policy, and sustainability, Samsom will offer his insights into Europe’s path toward a low-carbon future.
marine exploration, and the innovation networks supporting a sustainable supply of CRMs will be on the agenda.
Can Europe lead the way with a clear roadmap for new energy innovation and competitiveness? Europe has led in areas like CCS and offshore wind, but can it stay ahead? This session addresses competitiveness, the EU Clean Industrial Deal, and how to turn decarbonisation into growth. Expect a timely discussion on strategy, policy, and public-private alignment.
Financing and insurance of the Energy Transition
Transition requires investment, but where will it come from, and how can it be protected? This session digs into funding strategies, insurance frameworks, investor expectations, and the role of geoscience
The call for late-breaking abstracts is open until 15 September. Submissions will be considered for poster presentations only, perfect for showcasing your latest research or field results.
To take part in EAGE GET 2025, register by 1 September to benefit from early bird discounts. Free visitor passes are also available, and those looking to make the most of the event can opt for an all-access pass, which includes entry to workshops, field trips, and short courses. For full programme details and registration information, visit eageget.org.
in derisking large-scale clean energy projects.
Geoscience communication and public engagement in the energy transition: Experiences and lessons Organised by the EAGE Special Interest Community on Geoscience Communication & Public Engagement, this session highlights the critical role of engaging the public in energy transition projects. Featuring insights from geothermal, wind, hydrogen, and subsurface storage initiatives, it will explore real-world case studies and strategies for building trust, addressing concerns, and fostering inclusive participation in sustainable energy development.
Geological risk assessment in energy transition technologies: The importance of modelling tools and techniques
This session explores how geoscience modelling supports key energy transition projects like geothermal, CCS, hydrogen, and offshore wind. We’ll discuss its role in risk assessment, resource estimation, and project planning, as well as its value in improving communication across teams. GET 2025 offers an unmissable opportunity to explore where the energy transition is heading and who is leading the way. Learn more: https://eageget.org/ strategic-plenary-agenda/
LEAP ENTIRE WORKFLOWS IN A SINGLE BOUND
COMPLETELY REPLACING TRADITIONAL WORKFLOWS
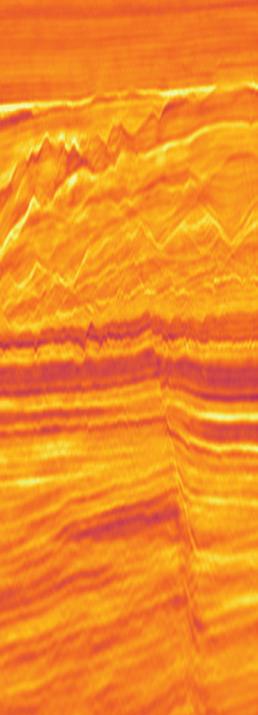
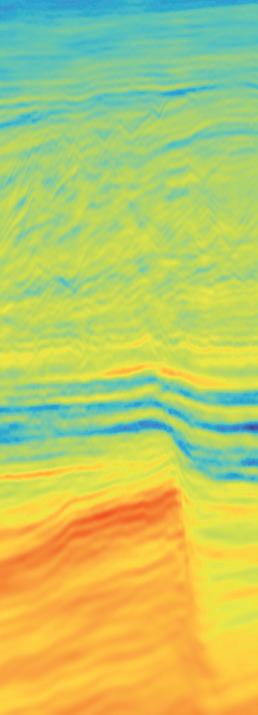
DUG Elastic MP-FWI Imaging enables simultaneous inversion of reflectivity (3-component, directional, horizontal), P-wave velocity, S-wave velocity, density, P-impedance, S-impedance, and Vp/Vs ratio, providing quantitative-interpretation-ready outputs of the highest resolution and amplitude fidelity — using field-data input. In this example we can readily identify the reservoir location — a beautiful flat spot!
No more jumping through hoops — DUG Elastic MP-FWI Imaging gives you everything you need with one powerful leap.
Available in DUG Insight!
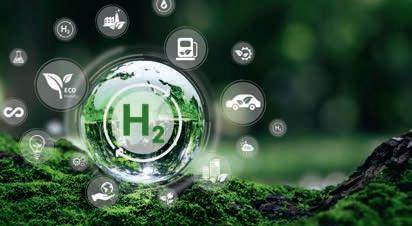
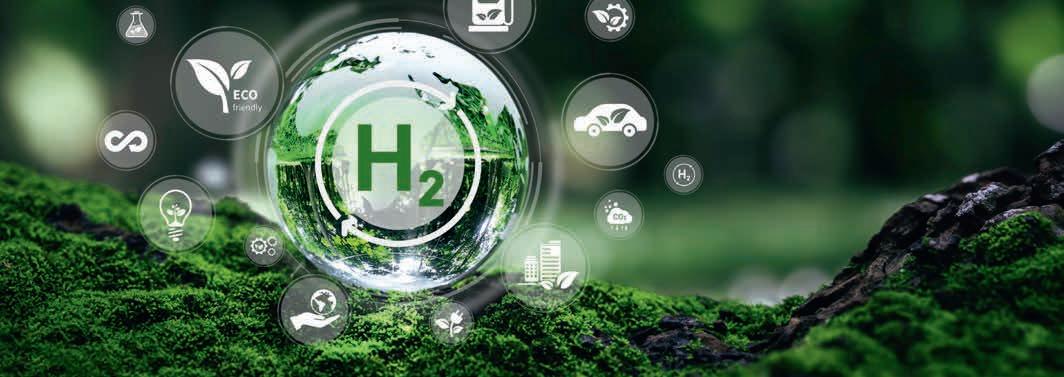
Prospects of underground hydrogen storage to feature at GET 2025
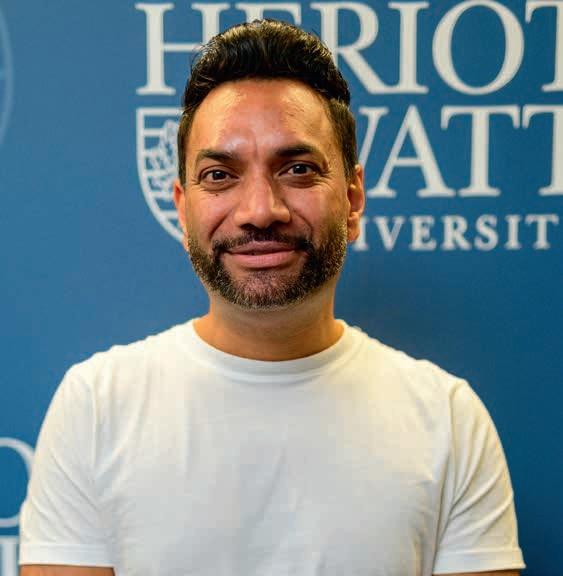
At GET 2025, Dr Kamaljit Singh, associate professor, Institute of GeoEnergy Engineering, Heriot-Watt University (UK) will be presenting his short course: Underground hydrogen storage in rocks: pore-to-core scale flow processes, X-ray imaging and modelling. Here he tells us what’s involved.
What inspired you to develop the course?
My motivation stems from the urgent need to advance underground hydrogen storage (UHS) as a vital component of hydrogen economy, which will play a key role in addressing climate change and global warming. Large-scale UHS will become essential for balancing supply and demand and ensuring energy security. Because UHS is a relatively new field, there are many outstanding challenges, particularly related to physical and microbiological processes that occur underground at high temperature and pressure conditions, which are not yet fully understood. This course is designed to explore these processes by connecting fundamental concepts with the latest research insights especially using imaging and modelling techniques.
Your course places strong emphasis on 3D and 4D X-ray imaging and pore-scale modelling
3D and 4D X-ray imaging are state-ofthe-art tools for visualising multiphase flow processes in porous systems. In our laboratory, we use these techniques to observe cyclic hydrogen injection in rocks under realistic subsurface pressure and temperature conditions. Pore-scale modelling complements these experiments by allowing us to simulate flow processes and extract critical parameters like capillary pressure and relative permeability, which serve as essential inputs for largescale simulations.
Recognising the diverse backgrounds of participants, we will begin by introducing fundamental concepts of porous media flow, imaging and image processing before progressing to more advanced topics. Participants will be guided through various workflows for image processing specific to UHS. We will also showcase videos of our experimental work conducted in cutting-edge imaging facilities.
Course attendance
What are some of the most surprising or promising findings in your recent research?
Our experiments with cyclic hydrogen injection in porous rocks have revealed complex flow patterns, particularly in heterogeneous rocks.
We also found that different experimental protocols can lead to entirely distinct flow behaviours, underscoring the sensitivity of these processes to initial and boundary conditions. One surprising finding was the extent of hydrogen dissolution in water.
Despite hydrogen’s low solubility, we observed notable dissolution driven by its high diffusivity. Another challenging area involves microbial interactions and biofilm formation, which can significantly influence hydrogen flow in porous rocks. We are currently developing innovative strategies to visualise these interactions to assess their impact. Sharing these insights, along with the advanced imaging and image processing techniques we have applied to UHS, will be one of the key highlights of this course.
You can attend by selecting the course as part of your GET 2025, All Access Pass or by registering for the course individually. Don’t miss the chance to be part of this forwardlooking discussion at the forefront of the energy transition.
Kamaljit Singh.
The course provides a fundamental understanding of the key physical and microbial processes occurring at the pore-to-core scale during UHS in rocks.
Prepare your abstract for EAGE Digital 2026
Abstracts are already being invited for the 6th edition of EAGE Digital scheduled for 9-12 March 2026 in Stavanger, Norway.
The previous edition of the event in Edinburgh proved an outstanding success attracting more professionals than ever
wanting to keep abreast of all the latest developments as the energy resources sector turns increasingly to digital solutions to enhance operational efficiency and sustainability.
For those wanting to be part of this world-leading conference in the
geoscience field, the call for abstracts is now open with a deadline of 1 November 2025 for submissions via www.eagedigital.org.
All submissions will undergo peer review and may be selected for oral or poster presentations.
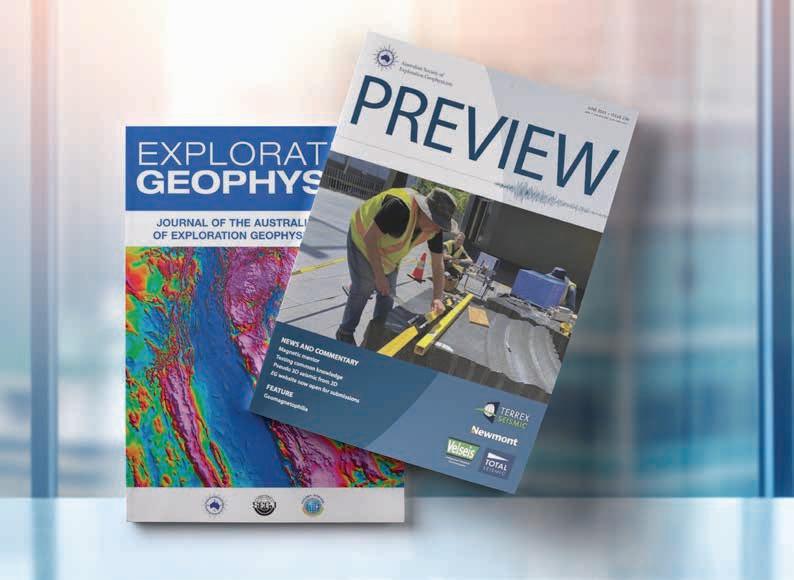
ASEG and EAGE join forces to bring geophysical knowledge to a wider global audience
We are delighted to announce our new collaboration with the Australian Society of Exploration Geophysicists (ASEG). This partnership marks an exciting development in the global geophysics community. ASEG’s two flagship publications, Exploration Geophysics and Preview Magazine, are now hosted on EAGE’s EarthDoc platform, expanding access, visibility, and impact for geoscientific content worldwide.
This initiative began with a simple conversation — one of those rare, welcome moments of shared vision — where both organisations immediately saw the potential in joining forces. With mutual enthusiasm and a deep commitment to advancing geophysical science, ASEG and EAGE partnered to provide even greater value to researchers, professionals, and students across the globe.
Exploration Geophysics is a peer-reviewed, open access journal published in partnership with the Society of Exploration Geophysics of Japan (SEGJ) and the Korean Society of Earth and Exploration Geophysicists (KSEG). The journal serves as a vital international platform for original research, case studies, and methodological advances in exploration and applied geophysics.
Its editorial panel brings together reviewers from across the globe, drawing on both industry and academic expertise to uphold the highest standards of quality and relevance. The journal covers a broad range of topics including mineral, petroleum, mining, and environmental geophysics, offering insights that address realworld challenges in diverse geological settings.
Published six times per year, Exploration Geophysics regularly features special thematic sections and curated collections from ASEG’s conferences. Its presence on EarthDoc ensures that this valuable content reaches an even wider audience of geoscientists around the world.
Known for its accessible and engaging content, Preview is Australia’s premier magazine dedicated to exploration geophysics. It serves as an essential resource for professionals in mining, energy, environmental industries, government, and geoscientific research.
Also published six times a year in both print and digital formats, Preview features a vibrant mix of industry news, technical updates, thought pieces, book reviews, and insightful case studies. Regular columns include updates from the ASEG Executive, Branch News, upcoming events, and government initiatives — all curated to keep readers connected and informed. With its approachable style and wide-ranging topics, Preview is not only a go-to publication for ASEG members but also a valued resource for institutions and companies worldwide who rely on current developments in applied geoscience.
This partnership represents more than just enhanced distribution. It reflects a shared vision between ASEG and EAGE — one grounded in the belief that open access to knowledge, professional collaboration, and global visibility are essential to the future of geoscience.
We look forward to the many new connections, collaborations, and innovations this partnership will inspire within the geoscience community.
Near Surface Circle reimagined for the transition era
Andreas Pfaffhuber, chair, Environment, Minerals, and Infrastructure Circle in the EAGE Board, introduces a renaming initiative.
Two years ago, EAGE began a strategic transformation to better align with the rapidly evolving challenges faced by the geoscience community and society at large. The introduction of Circles, replacing traditional Divisions, marked a shift toward greater agility, inclusiveness, and inter-disciplinary collaboration. This model has already proven effective in engaging new stakeholders and expanding our collective impact.
As part of this evolution, we are pleased to announce that the Near Surface Geoscience Circle will now continue its mission under a new name - the Environment, Minerals, and Infrastructure Circle (EMI).
The new Circle name signals a renewed focus on today’s key challenges in near-surface geoscience.
The new name reflects more than just a broadened scope, it signals a renewed commitment to addressing some of the most pressing issues of our time. The EMI Circle will serve as a platform for knowledge exchange, innovation, and outreach across areas vital to a growing global population. These include sustainable infrastructure development, mitigation of natural hazards intensified by the climate crisis, and the responsible management of water and soil resources.
In addition, EMI embraces the increasing demand for critical minerals, resilient infrastructure, and efficient geotechnical risk reduction, all of which are central to the energy transition and sustainable technological development. The Circle also addresses challenges related to UXOs (unexploded ordnance), contaminated ground, mining engineering, groundwater characterisation, and even archaeological geoscience.
To maximise impact, EMI will actively reach out to industry stakeholders including those who may not yet be aware of the solutions geoscientists can provide. The intention is to help bridge gaps between scientific innovation and practical application.
EAGE Education Calendar
TRANS-DIMENSIONAL INVERSION: THE EXAMPLE OF GRAVITY DATA IN 3D USING GRAVITY DATA FROM THE BOULIA REGION (QLD, AUSTRALIA) BY JEREMIE GIRAUD
25 AUG –30 OCT GEOLOGICAL CO2 STORAGE BY ANDREAS BUSCH, ERIC MACKAY, FLORIAN DOSTER, MARTIN LANDRO AND PHILIP RINGROSE
By clearly marking the role that geoscience plays in managing and mitigating environmental and societal challenges, EMI aims to raise awareness of the discipline’s value not only among professionals, but the broader public. We hope to elevate the relevance of geoscientists and inspire greater interest in the geo disciplines and STEM fields more broadly.
We invite all members – current and prospective – to engage with EMI, contribute their expertise, and help shape this exciting new chapter in EAGE’s journey.
LECTURER WEBINAR
ONLINE COURSE
MINS + Q&A
SELF-PACED MATERIAL (16 HOURS) AND 7 LIVE WEBINARS OF 1 HR EACH
7 SEP SATELLITE INSAR DATA: MONITORING FROM SPACE BY ALESSANDRO FERRETTI NAPLES, ITALY DURING THE NSG 2025
9-10 SEP SEQUENCE STRATIGRAPHY: CONCEPTS, METHODS, AND WORKFLOWS BY RENE JONK
Andreas Pfaffhuber.
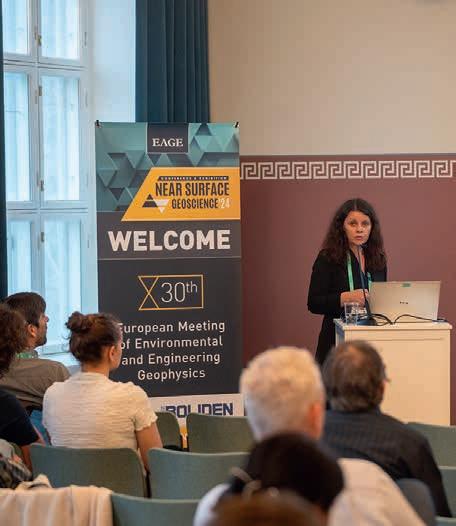
Make sure to sign up for the NSG2025 experience in Italy
This is a reminder that the highly anticipated Near Surface Geoscience Conference and Exhibition 2025 is only a month away – 7-11 September in Naples.
Awaiting participants are five parallel conferences at one venue -the main event Environmental and Engineering Geophysics, plus Mineral Exploration and Mining; Infrastructure Planning, Monitoring and BIM; Geohazards Assessment Risk Mitigation, and UXO and Object Detection. This rich technical programme includes 250+ oral and poster presentations, 50+ technical sessions, 40+ exhibitors and 450+ attendees. Delegates can also join a short course on Satellite InSAR Data: Monitoring from Space and three highly focused workshops on Geophysical Exploration to Volcanological Areas: imaging challenges and public and operational constraints; Geophysical Applications to Archaeology: innovation in acquisition and data modelling: and Airborne Geophysics: advances and perspectives from different platforms. The workshops offer interactive, real-world case studies appropriate at a city with a storied archaeological and volcanic heritage.
The field trips on offer do much to complement the programme. There will be a visit to the Bourbon Tunnel (Galleria Borbonica), one of the most fascinating underground routes in Naples, a masterpiece of civil engineering constructed by King Ferdinand II of Bourbon in 1853. A
second field trip at the Vesuvius volcano and Oplontis provides the possibility to investigate the relationship between the different types of pyroclastic deposits and their effects on Roman buildings.
The third field trip at the Phlegrean Fields, Pozzuoli, will explore the active Campi Flegrei caldera, a 12 km wide volcanic field characterised by an almost circular structure enclosing numerous volcanic edifices including tuff cones, diatremes, tuff rings, and a few lava domes. The fourth field trip involves one of the world’s most iconic archaeological sites: the Roman cities of Pompeii and Herculaneum. The cities were destroyed
and buried by the Vesuvius Plinian eruption of 79 AD. Lastly, a boat excursion field trip, offering a rare opportunity to explore the coastal geology of the Posillipo promontory and the Phlegraean Fields will be available.
Additionally, the Icebreaker reception and Conference Evening social programmes will be held at the historic monumental Santa Maria La Nova church and cloister, adorned with frescoes by renowned Neapolitan painters from 1600. What better way to intermingle with fellow delegates!
Make sure you register today at eagensg.org to secure your spot.
Mediterranean city of Naples.
What went down at Helsinki NSG in 2024.
PARALLEL CONFERENCES UNDER ONE EVENT 5
Giovanni Florio
NSG 2025 Local Advisory Committee Chair
“ NSG 2025 is set to be a vibrant platform for sharing cutting-edge geophysical innovations across academia, industry, and government organisations. This year’s expanded technical programme is particularly exciting, featuring parallel conferences on UXO detection, mineral exploration, infrastructure monitoring, and geohazards. Attendees will benefit from rich networking and learning opportunities—set in a captivating landscape, between Vesuvius and the Phlegrean Fields, where Earth’s processes are vividly on display. I look forward to welcoming you in Naples!”
HIGHLIGHTS
1. OPENING SESSION ON GEOSCIENCE COMMUNICATION
2. DEDICATED SESSION ON THE CRITICAL RAW MATERIALS ACT: FROM THEORY TO PRACTICE
Get the complete NSG experience: the All Access Pass includes
• Opening Session
• Technical Programme
• Exhibition
• Icebreaker Reception
• Special Talks
• Conference Evening
• Workshops
• Short Course
• Field Trips
• Daily Lunch & Coffee Breaks
50+ Oral and Poster Presentations
Technical Sessions
250+ Attendees
40+
450+ Exhibitors
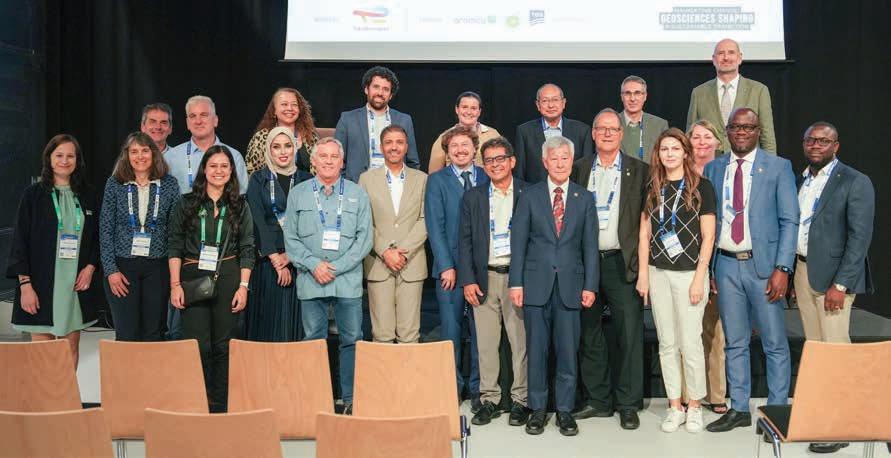
Associated Societies make their mark at the EAGE Annual
We welcomed 24 of our associated societies at the EAGE Annual highlighting the value of these collaborations for our members.
The societies showcased their current and upcoming projects at a dedicated area in the exhibition floor and took part in a networking meeting that facilitated cooperation talks with their peers and the EAGE Board.
Some of our partner societies were also actively involved in the conference programme. The HPC-AI Society, for example, hosted the panel discussion Powering the future: Is AI just buzz or the real deal in energy? at the Digital Transformation Area (DTA). Doug Norton, the society’s president and panel moderator, spoke of some real wins already happening in the energy industry. ‘Digital twins alone are increasing production while lowering risk and cost for facility operation. For GenAI, there is progress being made on seismic foundation models that can take text in and output graphics. For windfarm simulation, AI is being added to speed simulations by up to 4000 times getting to decision on the same day vs. 40 days. Looking ahead, applying AI to cybersecurity and physical AI hold even greater potential’.
At the International Prospecting Centre, representatives from the Nigerian Association of Petroleum Explorationists (NAPE) presented Growth opportunities in the Niger Delta: Bridging the legacy assets with low-carbon frontiers and
participated in the panel discussion How ultra-deepwater is revitalising oil and gas exploration
According to NAPE president Johnbosco Uche, ‘Active participation at the EAGE Annual creates opportunities to build strategic collaborations with international professional bodies, academia and industry leaders. In a rapidly evolving energy landscape, such partnerships are essential for capacity building, knowledge transfer, and the continuous development of geoscience professionals across Africa’.
Among other notable contributions, John Duhault from the Canadian Society of Exploration Geophysicists (CSEG), was the guest speaker in a dedicated
meetup organised as part of the EAGE Mentoring Programme; and Eleonore Dalmais from the French Association of Geothermal Professionals (AFPG), served as a panellist in Geoscience communication for policy a session hosted by the Geoscience Communication and Public Engagement Community, in collaboration with the Sustainable Energy Circle.
This year’s Technical Programme also featured some of the top presentations from the IMAGE 2024 conference organised by SEG, AAPG and SEPM. Topics covered included fault displacement gradients in mechanically layered rock and sparse ocean bottom node seismic interferometry and inversion.
The EAGE Annual provided a valuable opportunity to (re)connect with our associated societies and develop cooperation talks.
Every month we highlight some of the key upcoming conferences, workshops, etc. in the EAGE’s calendar of events. We cover separately our four flagship events – the EAGE Annual, Digitalization, Near Surface Geoscience (NSG), and Global Energy Transition (GET).
7th International Conference on Fault and Top Seals
14-18 September 2025 – Bucharest, Romania
The event once again will bring together leading geoscientists, researchers, and industry professionals to exchange knowledge and advance understanding in fault and top seal processes across various geological settings. Sharing knowledge from different techniques will help to reduce uncertainty and mitigate risk for conventional, emerging and future applications. A key highlight is the one-day field trip to the Carpathian foothills, one of Central Europe’s most hydrocarbon-prolific regions. The excursion offers a rare opportunity to explore world-class reservoir and seal outcrops in a region that has served as a cornerstone of geological research for nearly 150 years.
Regular fee until 18 August 2025
First EAGE Workshop on Geophysical Techniques for Monitoring CO2 Storage
21-22 October 2025 – Toronto, Canada
This inaugural workshop aims to help connect ideas and methods in carbon storage monitoring for the new wave of commercial projects now underway and the next waves that are about to be initiated. On the agenda will be consideration of storage sites, risk types and levels, regulatory environments, and local geophysical capabilities and how they differ between onshore and offshore and between sites in each environment. These will lead to plans and approaches that are practical and efficient.
An interactive session is planned to conclude the event, ensuring all attendees actively participate, debate, discuss, and propose ideas.
Regular fee until 19 September 2025
First EAGE/ AAPG/ SEG Carbon Capture Utilisation and Storage Workshop (CCUS) 21-23 October 2025 – Al Khobar, Saudi Arabia
This collaborative event intends to lay the foundation for a cornerstone event in the CCUS community, not just in the Middle East, but globally.
A key enabler of CCUS is utilisation, one of the conference themes. By creating valuable products and generating cash flow, utilisation allows us to build the infrastructure needed to decarbonise entire industries and nations. The other topic is storage where Middle East geology offers extraordinary opportunities for carbon sequestration.
A distinctive feature of the workshop will be the focus on the carbonate rock formations of the region.
Register at eage.eventsair.com/eageaapgseg-ccus-workshop
8th Asia Pacific Meeting on Near Surface Geoscience & Engineering (NSGE) 12-14 May 2026 – Bandung, Indonesia
With a focus on applied technologies, sustainable practices, and cross-sector insights, the 8th NSGE will address key topics such as environmental geophysics, engineering applications, site characterisation, urban development, and natural hazard mitigation. As the energy transition accelerates, sessions will also explore the role of near-surface methods in supporting geothermal energy, infrastructure resilience, and carbon storage.
Set in the scenic highlands of West Java, Bandung, a city renowned for its academic institutions, innovation spirit, and cultural vibrancy, provides an inspiring backdrop for this technical and professional exchange.
More details to come. Stay tuned on eage.org
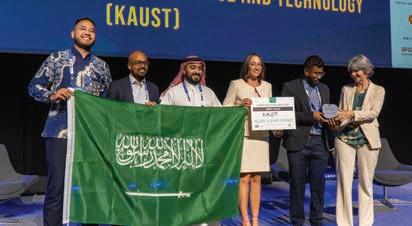
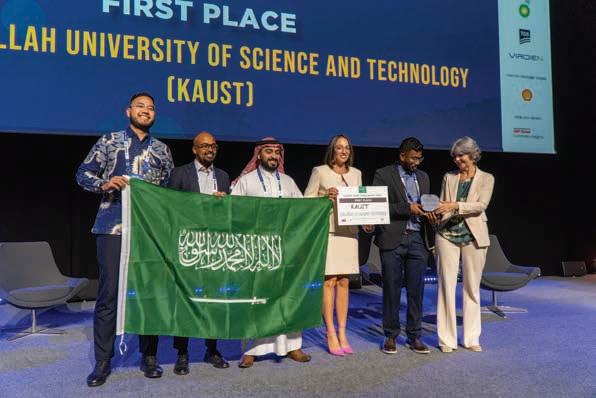
KAUST team triumphs in Laurie Dake Challenge 2025
The Laurie Dake Challenge 2025 concluded with a standout performance from the team representing King Abdullah University of Science and Technology (KAUST). The team’s innovative project secured first place in EAGE’s prestigious student competition.
Team members Abdirizak Omar, Mariia Solodiankina, Rayhan Nugroho, Zakaria Alghamdi, and Akshith Suresh impressed judges with their forward-looking research into CO2 storage, focusing on the potential of basalt formations for permanent carbon capture through mineralisation. This approach could play a transformative role in global carbon management strategies thanks to its capacity for long-term, stable storage.
Reflecting on the experience of presenting their findings at the EAGE Annual Conference, Suresh described it as both humbling and exhilarating. ‘It was an
incredible experience,’ he said, ‘not just to present, but also to learn from brilliant minds from all over the world. We were inspired by the level of discussion and the diversity of approaches taken by other teams.’
Participating in the Laurie Dake Challenge offered the KAUST team a rigorous test of both its technical knowledge and collaborative skills. ‘We gained hands-on experience with geoscience workflows,’ according to Suresh. ‘Just as importantly, we learnt how to work effectively under pressure, adapt quickly to new information, and draw on each other’s strengths.’
The team’s journey to the final round was made possible through the support of the EAGE Student Fund, which helped cover travel and accommodation expenses making the whole experience far more accessible.
Looking ahead, Suresh acknowledged the importance of student-focused initiatives like the Laurie Dake Challenge in connecting academic learning with industry practice. His message to future participants was clear: ‘Go for it. It’s intense, but it’s one of the most rewarding experiences you’ll have.’
To help make future opportunities like this possible, consider donating to the EAGE Student Fund. Your support can open doors for students worldwide to gain experience, grow professionally, and shape the future of geoscience.
EAGE Masterclass on Geothermal Energy comes to Paris
EAGE is hosting its next Masterclass on Geothermal Energy on 17-20 November 2025 in Paris offering a comprehensive programme of short courses taught by leading experts in the field. It is designed to provide participants with a deep understanding of the key technical aspects of geothermal energy development.
Three short courses focusing on a different aspects of geothermal energy make up the programme. It opens with a two-day course led by Andrea Moscariello
(University of Geneva) on geothermal energy systems and their role in the energy transition. Covering everything from shallow ground-source heat pumps to high-temperature power generation and heat storage, participants should gain a complete overview of geothermal energy utilisation, as well as exploration and engineering strategies required for successful implementation.
Denis Voskov (TU Delft) will present a one-day course on geothermal reservoir
engineering, exploring the main principles and challenges of geothermal energy production, supported by both lectures and practical exercises. The programme concludes with a course led by Sebastien Soulas (Avalon Sciences) on trends in borehole geophysics offering insights into the integration of vertical seismic profiling (VSP) for reservoir characterisation and field-scale geophysical monitoring in geothermal context.
Beyond technical training, the EAGE Masterclass also supports career development. As an accredited CPD points provider for the European Geologist (EurGeol) title, EAGE awards up to 20 CPD points to participants completing all three courses. Learn from top experts, gain practical skills, and connect with a global network of professionals. Join the full programme via an All Access Pass, or register for individual courses.
KAUST team.
Dive into different technical aspects of geothermal energy through our Masterclass.
CONFERENCE REPORT
Resource discussions heat up in Morocco
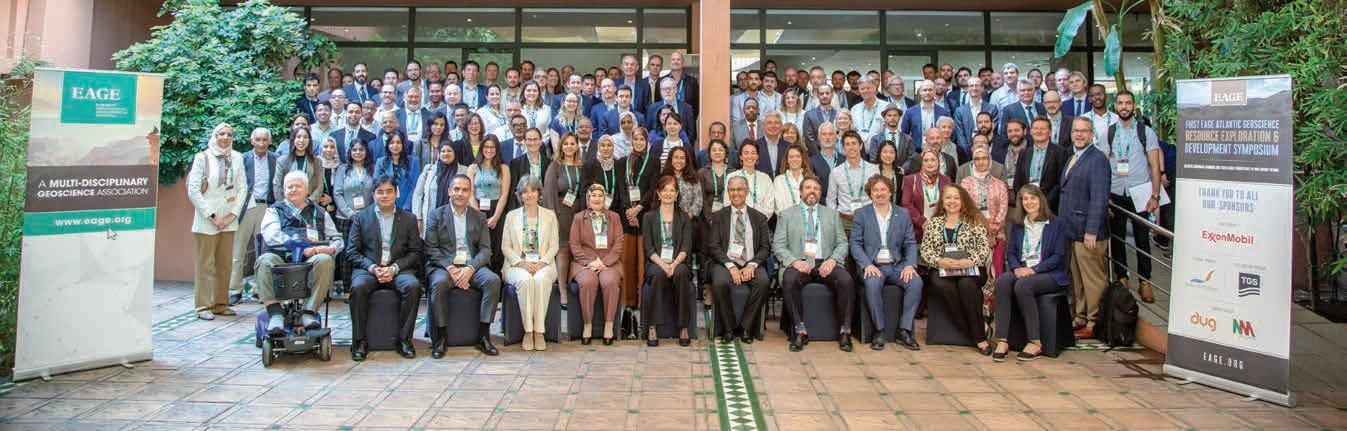
Marrakech was the choice for the First EAGE Atlantic Geoscience Resource Exploration and Development Symposium (AGREDS) held on 5-7 May 2025, attended by over 150 participants ranging from IOCs, NOCs, government Institutions, medium-to-smaller and independent oil and gas companies, service companies and academia.
The keynote by Ken McDermott (Shell) set the stage for discussion on tectonic evolution in the Atlantic region. He focused on the new insights of geodynamic models of the opening of the southern Atlantic, highlighting how the tectonic evolution has influenced heat-flow variability, source rock facies deposition in the Lower Cretaceous along the southern margins. He noted the need to recognise the type of margin domain – Transform, Magma Rich or Magma Poor, the concept of Continental Transition Zone (CTZ) rather than Continent Ocean Boundary (COB) – when working in magma-rich or magma-poor domains, and ideas on identifying available ‘play space’ to high-grade exploration fairways.
Subsequent presentations continued exploring this theme while moving northward from the southern margins, through Central Atlantic and Northern Atlantic margins. Geoffroy Mohn discussed the timing and evolution of rifting in the Central Atlantic (the Moroccan and Scotian Atlantic conjugate margins), with models on paleobathymetry of the Scotia Atlantic margin. Jeff Kraus followed up with
a focused look at the Moroccan-Scotian margins looking specifically at variations in magma budget and extensional rates, defining the margin domains in Agadir and Essaouira offshore basins, and showing the implications of this work on accommodation for clastic fairways.
The second keynote by Douglas Paton (TectonKnow) furthered the debate on the value of the conjugate margins. He provided another variation of margin classification, with a compositional component added, placing local play concept fairways into a larger overarching regional context to better understand implications on heat flow modelling and impacts of higher heat flow of ‘leaky transforms’.
The second set of morning talks started with Jon Teasdale (Geognostics) showing some recent work on high resolution plate tectonics modelling from the present day back to the Trias, captivating the audience with his timelapse model spanning 200 my. He showed a detailed look at the opening of the Central Atlantic rift and the implications for timing of the opening of the Tethys and Caribbean gateways. Hala Chebli (ONHYM) presented recent work she had completed at the University of Texas at Austin on the influence of syn-rift structuring on the linked kinematic systems identified in the offshore Essaouira basin of Morocco. Garry Karner (ExxonMobil) discussed evidence for early Jurassic restricted and isolated shallow marine depositional environments in the Central Atlantic and tied his work to Teasdale’s, then adding
an entertaining discussion on SDRs, what they mean, and how they can be used for understanding depositional settings.
The stratigraphy session covered a wide range of topics including the identification of fans and channels based on slope gradient from seismic data; fieldwork observations from the Barrechid sub-basin and the indication of contribution of non-marine waters; salt tectonics applied to a carbonate platform environment and the tectono-sedimentary influence on reservoir distribution. The High Atlas rifting and unidirectional dykes implications on the origin presentation were widely discussed during the Q&A. Integrated pre-salt evaluation of the Kwanza Basin, as mentioned by one speaker, has opened up new questions.
The keynote on technology summarised the key technologies driving higher efficiency in exploration and development operations. They include low frequency sources for seismic acquisition, FWI (Full Waveform Inversion) and multi-parameter FWI in seismic processing, access to high-quality fast-track data and the use of machine learning.
In the exploration panel, we heard about the use of seismic attributes and the potential overuse of AVO and how we must continue to apply geological intelligence to data and information. We were also reminded of the value of reprocessing old seismic data and the multiple exploration opportunities which Morocco offers.
In the hydrocarbon resources and exploration sessions, we learnt how var-
Bringing minds together: Delegates at the First EAGE Atlantic Geoscience Resource Exploration & Development Symposium.
iable the source rocks in the Atlantic can be depending on which segment of the Atlantic they deposit and their age. Many variables play a vital role for the success of the source rock.
During the session on advancements in geoscience technologies we saw brilliant improvements from some of the main service providers. The talks and additional talks by operators highlighted the impact on subsurface evaluations with real case studies from the Atlantic Margin. Specifically, the impressive advancements give interpreters the comfort of more reliable reprocessed data, new visualisation techniques, and AI-enhanced workflows to derisk prospectivity and identify new plays. The outlier of the session was a talk on core scanning which, although
markedly different from the rest, sparked some insightful questions.
Overall, there was great coverage of the Atlantic Margin with a focus on conjugate margins including a large selection of presentations on Morocco both onshore and offshore, its conjugate Nova Scotia, both sides of the Equatorial Margin, southern Atlantic basins offshore Brazil, Uruguay, Namibia and South Africa, the Lower Congo, Guyana and Suriname, Equatorial Guinea and the Kwanza Basin.
Some of the ideas which resonated during the event included the introduction of the term ‘fairy circles’ in reference to hydrogen exploration; the plea to stop using the term COB (except in transform margins); effect of mantle convection cells and considering dynamic topography; Andrew Pepper reminding us that faults are not needed for hydrocarbon migration and pointing out ACMES, specially during the Aptian and the mid Jurassic; the subaerial depositional model for SDRs; salt imaging and its effect on petroleum systems; heat flow models and lessons; seismic reprocessing, fast-track data, FWI, importance of ultra far-angle stacks; deepwater exploration trends, challenges, lessons learnt and future opportunities; effect of MTCs; plus interaction of turbidites and contourites change of slope and stratigraphic trapping.
The knowledge shared during AGREDS 2025 will undoubtedly contribute to better-informed exploration strategies and innovation as we collectively work toward meeting future energy demands.
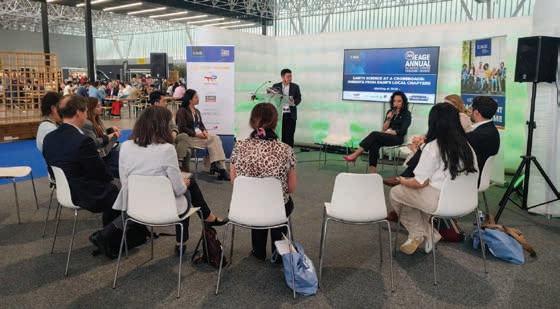
Chapters brought their stories to Annual in Toulouse
Visiting Local Chapter representatives made the most of the final day of the EAGE Annual Conference, when they met to reflect on some key issues facing the geoscience community and review them through the lens of local engagement.
The discussion was led by Dong Zhang (LC Netherlands) and covered such questions as how Earth scientists can better communicate the role of geoscientists in critical areas such as climate change or raw mineral resources, which of course was one of the central themes debated in Toulouse. For Local Chapters, one of the main difficulties is the sheer breadth of the field. Geoscientists operate across such a wide range of fields. As a result, the public is often not aware of their contribution.
Chapters were universal in their agreement that one essential skill was
required for communication: storytelling. ‘It’s simply no longer enough to be good at what we do at a technical level,’ said Aimie McSeveney (LC Oslo). According to Hayet Serradji (LC Paris), ‘We lead the technical conversation, but we do not share our experiences with the broader public. The challenge is not just to tell our story, but to share our values – especially with students and kids.’
The panel also tackled some specific factors that are driving the closure of geoscience programmes in some regions – the latest example being the phasing out of the Earth Sciences curriculum at the Vrije Universiteit of Amsterdam. While this trend has not reached everywhere equally, there is a concern it may spread and various countries – from France to Azerbaijan – have observed a shift in the nationality of students choosing a study path in geosciences: the EU component is decreasing, with more enrollments going towards renewable energy programmes or data science. ‘This shift reflects changing interests, policy priorities, and funding pressures,’ explained Tiexing Wang (LC London). ‘But the need for geoscientific expertise in the energy transition remains critical. The challenge is making
that value visible and understood before we create a knowledge gap we can’t easily fill.’
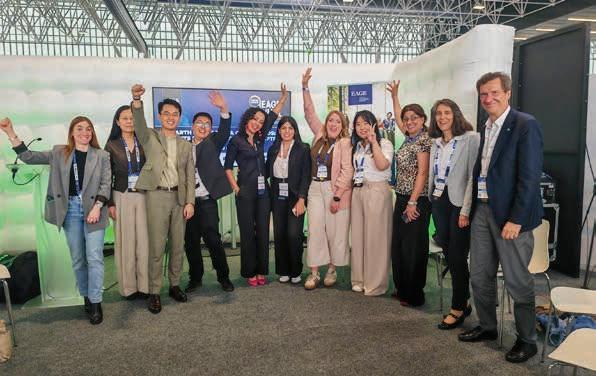
The meeting was also a space to trigger new collaborations and share best practice. Haoxing Zhu, representing a prospective new Local Chapter based in northeast China, talked about communicating directly with the public and choosing the right channels to reach it. LC Paris has had positive experiences with its happy hour, a mix of learning and networking, which has been attracting a high number of students. Leyla Alimuradova (LC Azerbaijan) reported on her work bridging different stakeholders through communication, and reaching out to local students with an EAGE Day.
Local Chapter group makes its presence felt.
Discussing Chapter experiences.
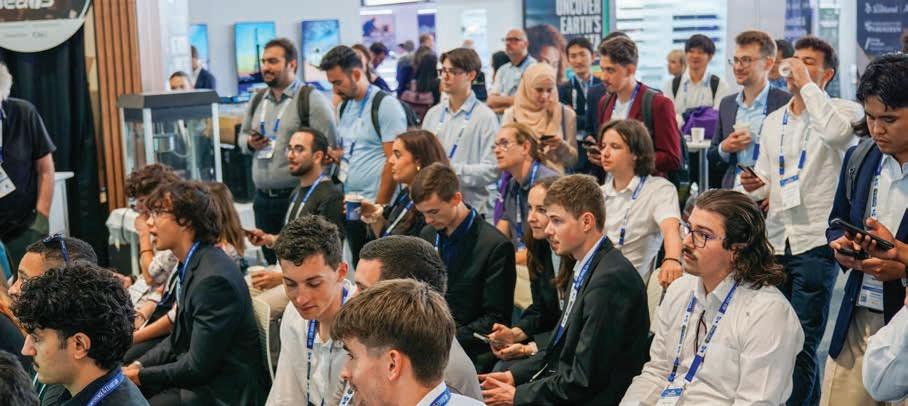
Student and community activities flourish at Toulouse Annual
The EAGE Annual 2025 in Toulouse offered an enriching experience for both students and professionals, bringing together more than 300 participants in a dedicated Student Programme and a wide range of activities in the Community Programme.
The Student Programme welcomed 329 students from around the world to take part in a variety of activities designed to support their academic and professional growth. One of the key highlights was the final round of the Laurie Dake Challenge, where teams presented their CO2 mineralisation projects to an expert jury. The team from KAUST (King Abdullah University of Science and Technology) was announced as the winner during the Opening Ceremony. Sponsored by Equinor and the EAGE Student Fund, the challenge showcased the importance of student-led innovation in the energy transition.
Students also had the opportunity to explore Toulouse’s geological heritage during a dedicated field trip, test their knowledge in the EAGE Global GeoQuiz, and participate in the Exhibition Tour & Education Hunt to connect with industry representatives. A standout activity was the opportunity for students to experience a trial job interview. In the end 28 students took part in the mock interviews conducted by professionals from four companies, receiving practical feedback to boost their confidence and career readiness. The student programme concluded with the Networking Café, offering students direct access to potential employers and academic mentors in a relaxed and welcoming environment.
Space for exchange and innovation
Running in parallel, the Community Programme offered a rich platform for engagement at the EAGE Community Hub, located in the heart of the Exhibition Hall. Attendees could meet with Local and Student Chapters, Technical Communities, and Special Interest Groups, and learnt more about EAGE services including EarthDoc, Learning Geoscience, and membership benefits.
Innovation was a key theme this year, highlighted by the EAGE Hackathon entitled EAGE Agents , where participants created AI-driven solutions for seismic data processing. Winning projects were presented at the Digital Transformation Area, drawing attention to the potential of agentic AI in geoscience workflows.
The Community Programme also featured engaging sessions such as Geoscience Narratives, which focused on storytelling as a tool for public engagement, and Geosecrets of France, where local experts revealed the fascinating geology of the Toulouse region. The Local Chapters’ Panel gave active members a platform to share best practices and inspire new initiatives. Meanwhile, the Annual General Meeting for Members (AGMM) offered a forum for dialogue with the EAGE Board. To support personalised networking, the Brain Match activity helped participants connect with like-minded peers and experts from across the globe.
Together, the Student and Community Programmes at the EAGE Annual 2025 reflected the Association’s commitment to education, innovation, and global collaboration, thereby empowering geoscientists to shape the future of the field.
GeoQuiz competition in progress.
Celebrating 10 years of the EAGE Americas Office
In 2015, the EAGE took a major step in expanding its global reach by establishing a dedicated Americas office, headquartered in Bogotá, Colombia. Today, as we mark a decade since its founding, we look back on the growth of a team and a mission that have brought geoscientists and engineers across the region together. It is also a moment to celebrate its achievements including building of a staff 70% made up of women making it a model of inclusive leadership to keep advancing geoscience across borders.
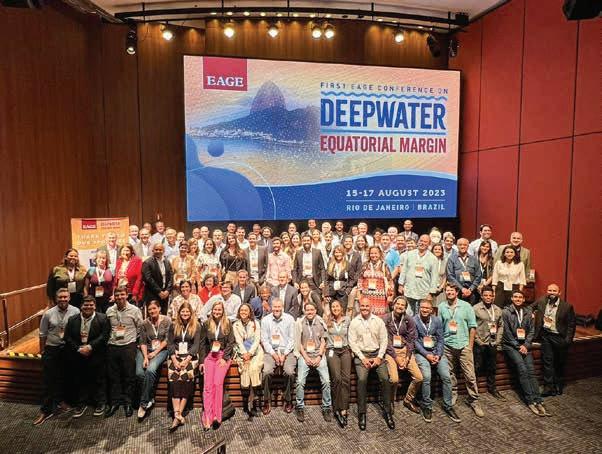
Operations began in 2017, with the First EAGE/AMGP/AMGE Latin-American Seminar on Unconventional Resources in Mexico that welcomed 150 attendees. Just two years later, in 2019, EAGE hosted another successful event in Mexico – the First Workshop on Deepwater Exploration: Foster Collaboration to Unlock Potential –with 200 participants thereby setting the foundation for a growing presence across the Americas. Since then, the office has developed over 11 events per year in countries including Brazil, Guyana, Colombia, Argentina, and Canada.
The team’s close collaboration with key local organisations, e.g., SBGf, CSEG, Geological Society of Trinidad & Tobago, ACGGP, IAPG, and AGEOCOL, has ensured every event is relevant, regionally grounded, and built with purpose.
Edward Wiarda, EAGE past president (2024), recalls his experience with the Americas office: ‘The regional office arrived in Bogotá at about the same time I landed with my young family in Colombia to work for Ecopetrol as a principal
geophysicist. Independently, and with a shared passion and dedication, we all set off to work transferring, sharing and implementing knowledge, technical solutions, hard-learnt lessons, skills and innovations from around the world to Colombian basins and the LATAM region. It was only a matter of time that we would join forces and form a very productive, fun and fruitful collaboration. This soon culminated into many highlights and activities including a rejuvenated Student Lecture Tour through Colombia, Mexico, Brazil and Argentina, and organising many successful ‘firsts’ of EAGE workshops and conferences in the region, with hot industry topics like Advanced seismic solutions and new exploration concepts to unlock the potential of the Caribbean, High performance computing and the Guyana-Suriname Basin.
The EAGE Americas office represents a celebration of gender equality, geographic expansion, and cultural diversity within the EAGE, and cross-border knowledge sharing between key regions. We should be proud of the team’s resilience through Covid times and continuing efforts to push our energy transition mission and the new Sustainable Energy Circle roadmap in the region. Thanks to the office, the EAGE is widely considered as a trailblazer for energy transition and sustainable energy (geothermal, CCS, and critical earth minerals) in the Americas.’
Francois Lafferriere, COO at Eliis, provides this perspective from a commercial point of view. ‘EAGE Americas has played a crucial role in our company’s growth and visibility in the region. Its events have
provided valuable connections and opportunities from the very beginning with a strong focus on key regional energy challenges, excellent technical exchanges, and fantastic networking, helping us grow a vibrant user community across the Americas. We congratulate EAGE Americas on its 10-year anniversary and look forward to continuing our support in the years ahead.’
For the future, the EAGE Americas office remains focused on key technical and regional priorities: seismic acquisition, CO2 monitoring and storage, and deepwater exploration, especially in areas like the Guyana-Suriname Basin, Equatorial Margins, and North and South Atlantic Conjugate Margins. Topics like critical minerals and near-surface geoscience are gaining relevance, and the team is ready to support meaningful conversations around them.
Yohaney Gómez, a local adviser for EAGE, reflects: ‘It is gratifying to see the significant role played by EAGE in the America region, overcoming the challenges of the energy transition and successfully moving in a collaborative environment with local associations and professionals through the knowledge shared across the world supporting the development of the region.’
The EAGE Student Fund supports student activities that help students bridge the gap between university and professional environments. This is only possible with the support from the EAGE community. If you want to support the next generation of geoscientists and engineers, go to donate.eagestudentfund.org or simply scan the QR code. Many thanks for your donation in advance!
Delegates at Rio conference.
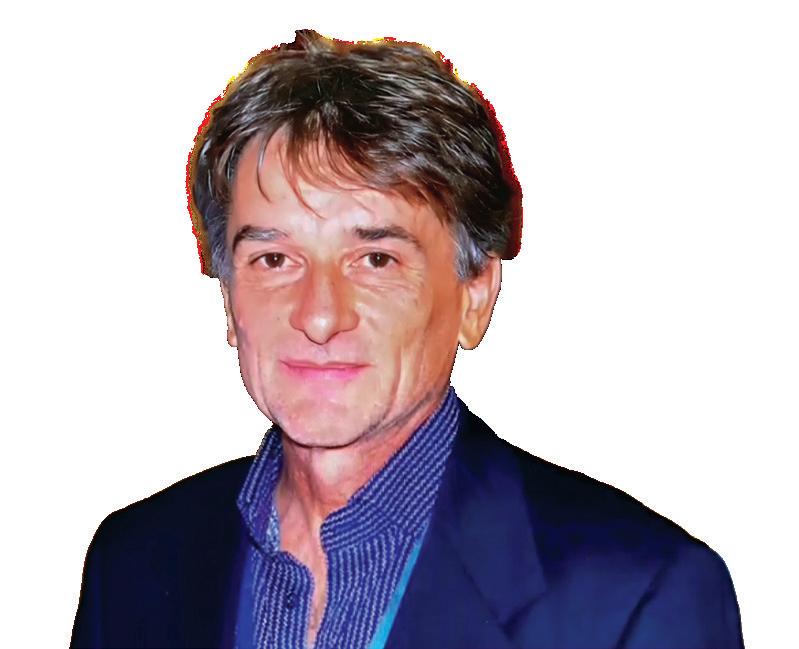
Personal Record Interview
Seismic, rugby and active philanthropy all part of this geoscientist’s journey
Pascal Breton’s geoscience credentials, e.g., a globally recognised borehole seismic expert and former EAGE secretary-treasurer, belie his current role managing TotalEnergies’ rugby sponsorship programme, not to mention continuing involvement in the NGO he co-founded 27 years ago in Manila to support homeless city children.
Small village start
I grew up in a small town in the Sarthe region of western France. My father was a truck driver, my mother worked at a factory, and few young people around me pursued higher education. In the early 1980s, I became one of the town’s first engineering graduates. After a two-year DEUG in mathematics and physics in Le Mans, I left to study geosciences engineering at the Institut de Physique du Globe in Strasbourg. I had no background in geoscience at the time but I liked the idea of a profession that would allow me to explore the world.
Oil connection
It wasn’t until I was 22 that I first went on an aeroplane! I had to fly to an oil congress in Paris to represent the school. For my finalyear internship I joined the Elf Aquitaine’s research group in Pau, working on emerging techniques in petroleum geophysics. My National Service proved fortuitous. I found myself serving in Tahiti for 18 months working with the CEA (Commissariat à l’Énergie Atomique). The job involved research on circum-Pacific seismicity and geophysical studies of the Mururoa Atoll, still an active nuclear test site at the time.
Borehole specialist
Back home I joined Elf Aquitaine as a geophysicist in Pau, specialising in borehole seismics, an area the company was eager to expand. Our small team quickly developed a reputation for innovation, both in tool development (often in collaboration with service companies) and in data acquisition and processing workflows. Within a
few years, we had earned recognition as one of the world’s leading teams globally in this field.
Sabbatical volunteer abroad
Part of me still wanted to engage with the wider world. I had begun overseas volunteering during my holidays, eventually taking a 15-month sabbatical to co-found an NGO in the Philippines called ANAKTnk (www.anak-tnk.org). It was created to support street children and families in the slums of Manila. The experience left a profound mark on me, and 27 years later, I’m still deeply involved. Today, the NGO supports more than 2500 beneficiaries daily through the work of 230 local staff members. From France, I continue to serve as president, leading fundraising and strategic development.
Back to work
When I returned to France, Elf Aquitaine had become Total. I resumed my role as a geophysicist, this time leading a team focused on integrating advanced reservoir characterisation techniques – AVO, 4D seismic and more – into dynamic reservoir models. While technically stimulating, I began to feel restless.
A communicator is born
By chance I was offered the opportunity to manage university and school partnerships around the world presenting Total’s upstream business and metiers to students, also building partnerships with academic institutions and identifying new talent. These years were among the most reward-
ing of my career. It inspired me to co-author a book La faim du pétrole and give frequent talks to both students and academics on energy, human development and climate challenges. It also revealed a new passion: communication. I fully transitioned into this new role from external relations to VP E&P communication. I also became more active in professional associations, particularly EAGE, where I served as secretary-treasurer.
Gave rugby a try
My communication role eventually led to a completely different environment: managing sports sponsorship. It began with my involvement in TotalEnergies’ local partnership with Pau’s rugby club in SW France. When the 2023 Rugby World Cup was scheduled for France, I managed to procure the job of managing the company’s major sponsorship, encouraged by our CEO Patrick Pouyanné, a rugby fan. The experience brought home that a sport like rugby, rooted in values of respect, solidarity, and community, can serve as a powerful platform for public engagement. Today, approaching retirement, I manage all the company’s rugby partnerships across France, from youth and amateur clubs to professional and French national teams. Though I never played the game myself, I’ve become one of its most devoted ambassadors.
Philosophy for life
Through it all, I’ve tried to stay grounded by three constants: family, the work of ANAK-Tnk, and a love of building bridges – between people, disciplines, and cultures.
Pascal Breton
CROSSTALK
BY ANDREW M c BARNET
BUSINESS • PEOPLE • TECHNOLOGY
Libya’s bid for international business
Libya’s National Oil Corporation (NOC) and the Ministry of Oil and Gas announced last month that 37 companies, including supermajors, have qualified for the first oil and gas exploration licensing round since 2007.
The bidding round includes 11 onshore and 11 offshore blocks across established high-potential basins such as Sirte, Murzuq, and Ghadames, as well as unexplored acreage in the Mediterranean. An updated production-sharing agreement is being crafted to make international participation more inviting.
This is a remarkable development for a country that has descended into unresolved divisions on occasion spilling over into civil war following the overthrow in 2011 of the notorious, autocratic regime of Col Muammar Gaddafi after 42 years in power.
A member of OPEC, the country ranks tenth in world oil reserves of 48.36 billion barrels (OPEC figures), and is Africa’s most prolific oil producer after Nigeria but, in different circumstances, would be the dominant one. The International Energy Agency reported that in June Libya was producing 1.22 million barrels per day (bpd) compared with Nigeria’s 1.43 million bpd.
Amidst decades of turbulence, the extraordinary fact is that ever since oil was discovered in the 1950s, Libya has managed to maintain more or less uninterrupted output, always with some participation by western oil companies, mainly under the auspices of its quasi-independent National Oil Company (NOC).
Italy pursued colonial ambitions including invasions of Eritrea, Somalia and Ethiopia as well as Libya. In 1911 Italy had declared war on the failing Ottoman Empire and succeeded in sequestering Libya, then made up of the provinces of Tripolitania and Cyrenaica.
Italian occupation met with prolonged resistance especially from the Cyrenaica region orchestrated for 20 years until his capture and execution in 1931 by Omar al-Mukhtar, leader of the Senussi Order. His heroics are captured in the 1981 big budget, box office flop The Lion of the Desert funded by Gadaffi with Anthony Quinn in the title role and Oliver Reed as Rudolfo Graziano, the Italian general who eventually captured al-Mukhtar. The film was banned in Italy and not finally shown until 2009.
Once in power (1922) Mussolini visualised Libya as a ‘fourth shore’ sanctioning a brutal ‘pacification programme’ including concentration camps and the death of thousands (see prize winning Genocide in Libya: Shar, a Hidden Colonial History, 2021, by Ali Abdullatif Ahmida, professor of political science at the University of New England).
‘The marriage between oil and politics has rarely been harmonious.’
The declared aim of the new licensing round is to increase Libya’s output to 2 million barrels per day by 2028. Whether the round will be completed is a moot point. The marriage between oil and politics has rarely been harmonious.
First serious mention of oil arose in a report in 1938 by Ardito Desai, an Italian geographer, mountaineer and global explorer extraordinaire who died at the age of 104 in 2001. At that time Libya was ruled by Benito Mussolini’s Italian fascist government. In the earlier so-called scramble for Africa by the Western powers,
Outbreak of the Second World War caused Libya to become embroiled in the Western Desert campaign battles between the Axis powers (Italy and Germany) and the Allies (mainly British troops) and noted for the famous personal rivalry between Generals Rommel and Montgomery. Not surprisingly the researches of Ardito Desio, director of the Libyan Geological Survey from 1936 to 1940, were consigned to the back-burner. His work had mainly focused on water resources and discovery of potassium salts in the Marada Oasis, but he recommended to AGIP, the Italian state oil company, drilling for oil in the Sirte Basin, but the technology of the day proved inadequate to capitalise (see, Ardito Desio: Italian geoscience legend who led first K2 ascent by Franco di Cesare, Franchino Aristide and Francesco Guidi, First Break Vol 22, Dec 2004, pp 83-89).
After the war, Britain briefly governed Tripolitania and Cyrenaica provinces and the French controlled the adjoining largely
desert Fezzan province. A newly independent United Kingdom of Libya was established in 1951 as an extremely poor, war-ravaged country via a settlement brokered through the United Nations. The three provinces were combined with three separate capitals Tripoli (Tripolitania), Benghazi (Cyrenaica) and Bayda (Fezzan) under King Idris as-Senussi, previously Emir of Cyrenaica and the leader of the Senussi Muslim Sufi order.
King Idris courted unpopularity by abolishing the federal system and the provincial legislative assemblies in 1963 and was always vulnerable for being beholden to western powers. He was eventually deposed by Muammar Gadaffi in 1969 in a coup d’état fuelled by perceived regime corruption, Arab nationalism and in the wake of unrest at the West’s support for Israel in the 1967 Six Day War.
The reign of King Idris, however, had been distinctive in bearing witness to the discovery of oil and the establishment of a framework to develop the new found resources. Libya’s prospects were transformed, joining OPEC as the second-largest oil producer behind Saudi Arabia with production peaking at some 3 million barrels per day in 1970, and the economy booming.
With investment from the oil industry already dwindling and confronted with severe loss of revenue from reduced oil production, Gadaffi turned Libya into a pariah state with his well-documented support for anti-Western terrorist organisations worldwide.
This was highlighted by Libya’s apparent involvement in the 1986 bombing of a Berlin nightclub in which two American soldiers were killed prompting retaliatory US air attacks on Tripoli and Benghazi, killing 35 Libyans, including Gaddafi’s adopted daughter. The 1988 bombing of the Pan Am flight over Lockerbie in Scotland was the most notorious atrocity involving Libya.
‘Everything changed when Gadaffi emerged as de facto leader’
Yet Libya was allowed back into the international community after Gadaffi admitted responsibility for Lockerbie, paid compensation to families of victims, and also renounced his weapons of mass destruction programme. In September 2004 President George W. Bush formally ended a longstanding embargo ordered by President Reagan on US company operations in Libya. This led to a revival of Libya’s oil fortunes with badly needed investment.
The finding of oil in neighbouring Algeria in 1953 had proved to be a powerful call to action. Legislation in the mid 1950s provided the fiscal terms and conditions for prospecting by international companies, 14 in the original round of concessions, notably Esso (as it was then) and the Oasis group (renamed Waha Oil Company) made up of Continental (ConocoPhillips), Amerada (Hess) and Marathon Oil, but Europen companies were also in the mix. Esso was to be the developer of the first oil from Zelten (now Nasser) field in the prolific east Libyan Sirte Basin (estimated reserves at the time of 2.5 billion barrels), discovered in 1956 with production beginning in 1961. By the end of the decade Libyan output with pipelines to terminals on the coast had risen spectacularly, focused on the Sirte, Ghadamis, Muruzq and Tripolitania basins (with accumulations in Paleozoic, Mesozoic and Tertiary strata). By 1969 14 major fields had been discovered with Libyan exports profiting from the quality of the crude and access to Western European markets with no Suez Canal to contend with.
Everything changed when the 27-year-old military officer Gadaffi emerged as de facto leader in a bloodless coup while King Idris was seeking medical treament in Turkey. Reflecting a trend across Middle Eastern countries culminating in the 1973 oil crisis, Gadaffi immediatedly began the process of nationalising the petroleum industry, establishing the Libya National Oil Company in 1970 and squeezing more revenue from international oil companies. The initial result was more money for Libya to be invested in education, healthcare, and infrastructure. Living standards for many Libyans were improved as part of Gadaffi’s vision for his country based loosely on his philosophising in the The Green Book, which rejected both capitalism and communism. Prosperity at home came at the price of brutal crushing of opposition and all the predictable corruption and nepotism associated with dictatorial rule.
Normalisation was short-lived. Ever since Gadaffi was finally overthrown during the Arab Spring protest movements in 2011, Libya’s rival factions have been unable to come to terms. Oil output has been disrupted repeatedly in the chaotic decade including civil war in 2014. The country remains divided between two rival authorities.The Government of National Stability (GNS) in Benghazi established by the Sirte-based House of Representatives (HoR), is predominantly backed by Egypt, Russia and the United Arab Emirates (UAE). It holds sway over the eastern and southwestern regions, and is aligned with the self-styled Libyan National Army led by Field Marshal Khalifa Haftar, who exercises control over the majority of the country’s oilfields.
Meanwhile, the Government of National Unity (GNU) under Prime Minister Abdul Hamid Dbeibah, predominantly supported by Turkey and Western nations, and endorsed by the UN, exercises control over the capital, Tripoli, and surrounds.
In August last year, Libya lost more than half of its oil production, about 700,000 bpd with some exports during a stand-off between rival political factions over the central bank.
There are some good omens for the successful conclusion of the intended licensing round. Over the past 18 months, key players such as ENI, bp, OMV and Repsol have lifted force majeure and resumed upstream activities. But violence lurks, for example, in May deadly clashes in Tripoli followed the killing of powerful militia leader Abdelghani al-Kikli, also known as Gheniwa.
Finally Libya is not averse to pursing oil ambitions overseas. Greece recently invited Libya to start talks on a controversial, probably unlawful, deal signed in 2019 between the Libyan government (now endorsed by all factions) and Turkey. This would recognise Turkey’s claim to an Exclusive Economic Zone (EEZ) over a wide-swathe of the Eastern Mediterranean. With implications for Cyprus and Egypt, this is a potential regional hotspot the world could do without.
Views expressed in Crosstalk are solely those of the author, who can be contacted at andrew@andrewmcbarnet.com.
JOIN US IN ABERDEEN
The world is in an ‘ energy addition ’ phase. Oil and gas will be needed for decades to come, with demand continuing to be robust beyond 2035. Meeting this demand will only be possible by utilising the latest technology and leveraging strategic partnerships . The geoscience and engineering community has much to contribute.
PXGEO appoints strategy chief
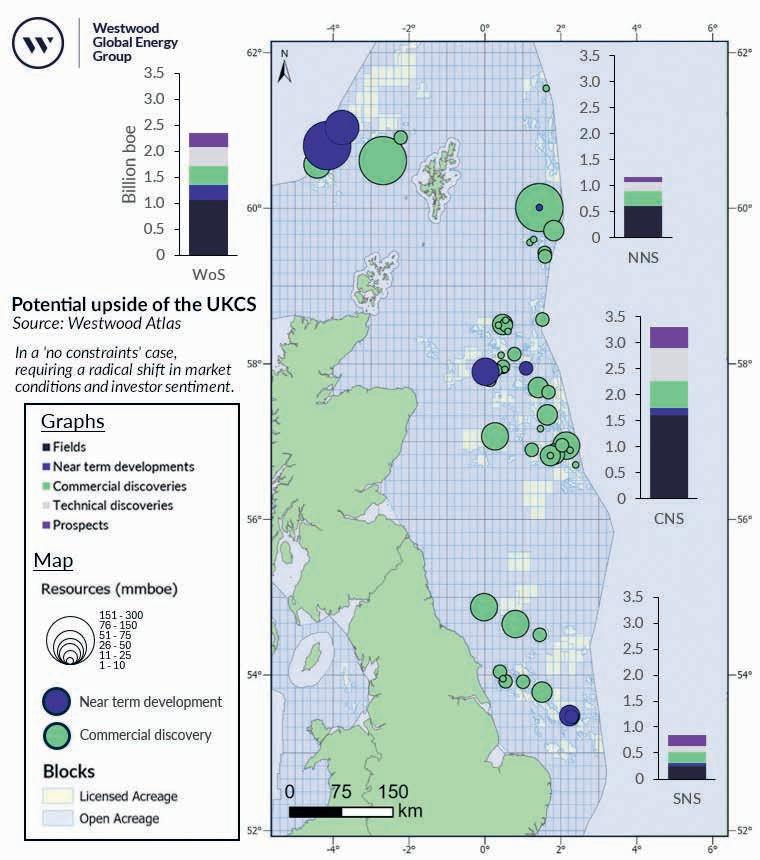
UK’s recoverable oil and gas resources are in danger of plummetting, says Westwood
Westwood has downgraded its estimate of how much oil and gas can be recovered from the UK North Sea to 0.6 billion boe by 2030 and 3.8 billion in the longer term.
In 2019, the UK’s North Sea Transition Authority (NSTA) projected that 1.3 billion boe could be recovered from the UK North Sea by 2030 and 6.5 billion boe between 2025 and 2050
Westwood notes that, according to the UK government’s Climate Change Committee, demand for oil and gas in the UK will be 15 billion boe oil and gas in a ‘balanced pathway’ to Net Zero by 2050. ‘The UK is set to import the majority of this,’ says Westwood.
‘The geology has not changed. Opportunities which existed in 2019 still exist today. Commodity price volatility has always been a challenge. Instead, the fiscal, regulatory and political environment has led to companies deferring or cancelling plans for both short and long-term investments,’ says Westood. ‘There is still a substantial prize available to companies and the government, if the investment environment allows it.’
Westwood estimates that in a high case, the UK Continental Shelf (UKCS) could produce 4.3 billion boe. However, in a substantially improved market environment, including significant changes to tax, licensing and regulatory approvals, and favourable commodity prices, the UK could unlock up to 7.5 billion boe.
‘A major shift in investor sentiment would also be required to achieve this, built on a stable and globally competitive fiscal policy; a supportive investment environment; long-term commitment to ongoing licensing; faster approvals process for new developments and licence awards,’ Westwood states.
If investor sentiment were to deteriorate further, there is a risk that recovery could be as low as 2.6 billion boe.
Of the 7.5 billion boe identified, around 0.5 billion boe is found in near-term developments – opportunities where technical and commercial plans for development are well advanced. An additional 1.4 billion boe is associated with discoveries that Westwood deems to be potentially commercial for development.
Westwood also identifies 20 ‘drill-ready’ exploration and appraisal (E&A) opportunities. ‘In many cases, operators are only waiting for the right investment environment to commit to drilling them. In recent years, while E&A drilling numbers have reached record lows, success rates have been high. With a focus on the potential for future gas developments, there are tangible E&A opportunities particularly in the Southern North Sea, West of Shetland and Quad 9 of the Northern North Sea.’
Of the 7.5 billion boe potential, around 7.3 billion boe is located within 50 km of existing hubs, which would enable
Equinor publishes Johan Svedrup plan
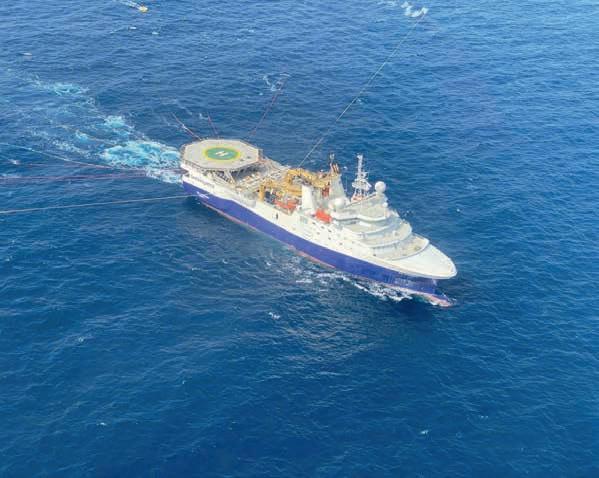
Shearwater wins contract for offshore West Africa survey
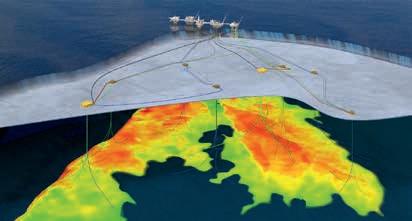
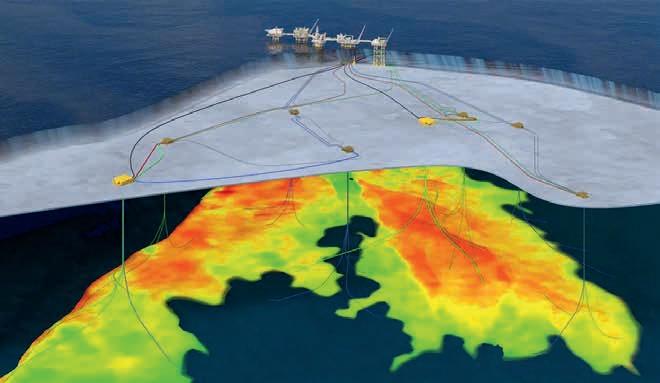
Potential upside of the UKCS in the ‘no constraints’ scenario.
Source: Westwood Atlas.
tiebacks to existing infrastructure and thereby reduce development costs, lower emissions intensity and enable development of resources that would otherwise be uneconomic. However, Westwood notes that a high number of fields and hubs could cease production before 2030. ‘Once these facilities cease, it will be too late to unlock many tie-back opportunities and therefore the time for an investment re-set is now.’
The government has stated its intention to ‘not award new licences to explore new fields’. However, substantial volumes of contingent and prospective resources exist in unlicensed acreage. The Westwood Atlas database identifies 9.7 billion boe of risked prospective resources lying within 50 km of a producing hub, with 76% of this currently unlicensed. In addition, 2.3 billion boe of discovered contingent resources lie unlicensed within 50 km of a production hub. ‘Allowing appro-
priate new licence awards provides an opportunity to examine and potentially develop some of this resource. Preventing new licence awards would further damage investor sentiment and send a political message that the UK is a closed shop to global investors.
‘A constructive outcome from the recent government consultations on the Future of the North Sea and the fiscal regime, combined with pragmatic policy change, could unlock significant value. This would boost tax revenues, protect jobs, support lower emissions intensity production and help to fund the energy transition,’ says Westwood.
‘The geology is unchanged. The skills remain, for now. With timely decisions, the North Sea can continue to contribute meaningfully to the UK’s energy system as it transitions to net zero.’
Viridien, TGS and Axxis image OBN North Sea data
Viridien, TGS and Axxis Multi-client have completed the final imaging of OMEGA Merge, to deliver a single dataset across the Heimdal Terrace, Utsira, and Sleipner based on ocean bottom node (OBN) multi-client surveys in the North Sea.
Spanning a total area of 3700 km² from the deployment of more than 250,000 nodes and 9.5 million shots, OMEGA Merge is the largest continuous OBN dataset on the Norwegian Continental Shelf.
Viridien conducted pre-migration matching to ensure consistency in time, phase, amplitude, and frequency content. The velocity model was then unified using Viridien’s time-lag full-waveform inversion (TL-FWI) and long-wavelength tomography technology. Utilising this
unified model, the data was pre-stack depth-migrated to produce a seamless and continuous volume that covers the entire OMEGA Merge area.
Viridien said that the final dataset brings substantial improvements in resolution and structural clarity, revealing previously unseen exploration targets and providing greater confidence in prospect understanding compared to vintage seismic data.
Dechun Lin, EVP, Earth Data, Viridien, said: ‘The final dataset shows unparalleled imaging clarity, offering new insight into complex subsurface structures. This level of detail will support confident exploration and development decisions for years to come.’
Shearwater wins 4D survey in the Norwegian Sea
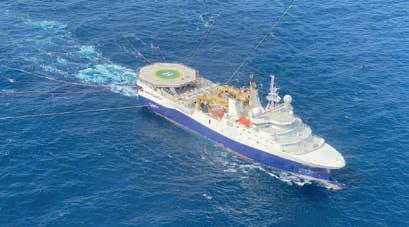
Shearwater Geoservices has been contracted by Equinor to perform a 4D towed-streamer seismic survey over the Tyrihans field in the Norwegian Sea. It is the first project awarded under the 2021 Equinor framework agreement following a recent extension for an additional two years.
The one-month survey is set to launch in early August. Shearwater will deploy the vessel Amazon Conqueror using Isometrix technology. The survey follows previous 4D campaigns for Equinor, most recently at the Mariner and Heidrun fields in 2024. Applying the same technology to capture repeat high-quality seismic data over the Tyrihans area will enable Shearwater to understand changes to the reservoir over time in the producing field and support future production strategies to optimise output, the company said.
‘The award reflects Shearwater’s strong technical capabilities and consistent operational reliability. Finding good solutions together with our clients is always a priority for us. In this case, we can provide our client with updated reservoir data to support long-term production optimisation and value creation,’ said Irene Waage Basili, CEO of Shearwater.
Meanwhile, Shearwater has implemented measures to increase balance sheet resilience in response to the combination of short-term low activity levels and working-capital intensive projects during the second and into the third quarter of 2025.
The company has agreed a deferral of two debt instalments until January 2027. It has also implemented a cost reduction programme. These and other measures are expected to improve Shearwater’s liquidity over the next 12 months by over $60 million.
Omega OBN Merge brings a unified dataset, providing substantial improvements in resolution and structural clarity.
TGS and Equinor work on CCS digitalization
TGS has announced a collaboration agreement with Equinor to advance the digitalization of carbon capture and storage operations.
Equinor’s Northern Lights project will integrate TGS’ Prediktor Data Gateway into its digital system to enhance management of the full CO2 value chain, from the receiving terminal to permanent storage. By delivering real-time data, the software enables more efficient operations and informed decision-making across the entire CCS process, said TGS. Its functionality supports critical areas such as simulation, capacity planning, CO2
tracking, emissions and financial reporting, permitting, compliance, trading, audits, and health and safety. This will allow Northern Lights to streamline workflows, reduce risk, and ensure regulatory alignment – ultimately creating greater transparency.
‘By leveraging real-time Operational Technology (OT) data through the Open Platform Communications Unified Architecture (OPC UA) information model, Prediktor Data Gateway empowers Equinor with enhanced control and scalability to meet evolving needs,’ said TGS.
Viridien launches industry-first drop node solution
Viridien has launched Sercel Accel, the land seismic industry’s first onshore drop node solution.
‘Accel is designed to overcome the challenges of today’s complex, high-density seismic operations by accelerating survey deployment, increasing operational efficiency gains and consistently delivering the highest-quality data,’ said Viridien.
Accel eliminates the need for nodes to be buried or planted in the field, thereby reducing deployment time and labour requirements, said Viridien. With its droppable design, compact size, and integrated smart portable deployment system, Accel streamlines logistics, improves in-field agility and helps to reduce operational costs by up to 30% and significantly lower HSE risk, the company added.
Accel is powered by the Sercel QuietSeis MEMS sensor. Built-in, field-proven Sercel Pathfinder QC technology also provides near real-time quality control status monitoring and ensures reliable node retrieval.
Accel is said to bring a new level of flexibility to land seismic data acquisition with the introduction of modular Accel Solution Packs which combine nodes, software and services. These are designed to meet wide-ranging survey needs, from initial exploration to large-scale mega-crews. With this approach, customers can tailor and scale their required Accel Solution Packs based on project duration, complexity and strategic goals, bringing unmatched agility to their field operations.
Jerome Denigot, head of sensing and monitoring, Viridien, said: ‘With the launch of Accel, we revolutionised how data is captured, managed, and ultimately trusted by our customers for its total integrity and accuracy. Thanks to its seamless integration with our other acquisition systems, our Accel drop node solution enhances both crew productivity and safety. Scalable and supported by our flexible Accel Solution Packs, including software and services, it heralds the start of a new era in fast, high-resolution land seismic acquisition – accelerating projects of any size.’
bp has appointed Simon Henry as a non-executive director. In 35 years with Shell, he held senior finance and management roles and was chief financial officer and a member of the board from 2009 until 2017. Henry is currently a non-executive director of Rio Tinto. He will also step down as a director of Habour Energy. bp also announced that Pamela Daley, non-executive director, has stepped down from the bp board for personal reasons.
EMGS had one vessel on charter in the second quarter. Atlantic Guardian. It completed the second of two proprietary surveys in India and transited back to Norway for three fully prefunded multi-client surveys in the North Sea with a total contract value of $2.7 million. EMGS recorded three vessel months in the second quarter and expects to record approx. $200,000 in multi-client late sales.
Hess is relinquishing Block 59 offshore Suriname. The block will return to Staatsolie and become part of the open acreage. Block 59 covers 11,480 km2 in water depths of 2700 to 3500 m. After 6000 km of 2D seismic data and 9000 km2 of 3D seismic data were collected in the block, the two previously exiting partners considered the risk too high for drilling an exploration well.
TotalEnergies has signed an agreement to acquire the 25% interest held by Moeve (formerly known as CEPSA) in Block 53, offshore Suriname, joining APA (45%, operator) and Petronas (30%) as partner in the licence. Block 53 contains the Baja-1 discovery.
TotalEnergies has acquired Petronas’ interests in multiple blocks offshore Malaysia and in one block offshore Indonesia. It has also acquired a 25% interest from Chevron in 40 Outer Continental Shelf (OCS) federal leases, including 13 blocks in the Walker Ridge area, nine blocks in the Mississippi Canyon area and 18 blocks in the East Breaks area.
ENERGY TRANSITION BRIEFS
TotalEnergies has acquired a 50% stake in the solar, wind and battery energy storage systems (BESS) portfolio of AES Dominicana Renewables Energy. The deal follows TotalEnergies’ 2024 acquisition of a 30% share in AES solar and battery assets currently under construction in Puerto Rico. The combined portfolio now exceeds 1.5 GW of renewable energy and BESS capacity across the Caribbean.
One of the UK’s most ambitious hydrogen infrastructure programmes has won £96 million public funding for its next phase of engineering, planning and public consultation. East Coast Hydrogen, a partnership of National Gas, Caden and Northern Gas Networks will repurpose and build gas pipelines to deliver clean hydrogen across the North East, the Humber region, Yorkshire and the East Midlands. East Coast Hydrogen will enable power generation and heavy industry across the East Coast to transition from natural gas.
Fugro is working with geographical information system (GIS) software provider Esri to provide integrated geospatial solutions that empower climate resilience decision-making and sustainable development. The initiative will focus on tackling the environmental challenges of Small Island Developing States (SIDS), starting in the Caribbean.
Baker Hughes and Petronas have signed a deal to explore business initiatives that have the potential to support the delivery of Asia’s energy transition. The two companies will enhance local supply chain capabilities and explore the feasibility of implementing a variety of technology solutions including enhanced LNG services and cross-border talent training and development programs to strengthen local field operations.
bp has agreed to sell its US onshore wind business, bp Wind Energy, to LS Power. The business has interests in 10 operating onshore wind energy assets across seven US states, operating nine of them. The assets have a combined gross generating capacity of 1.7 GW (1.3 GW net to bp).
PXGEO appoints Hans-Peter Burlid to steer growth and strategy
PXGEO has appointed Hans-Peter Burlid to the newly created position of chief strategy and transformation officer (CS&TO). Burlid, who is currently the organisation’s CCO, will drive long-term strategic direction to deliver sustainable growth and lasting competitive advantage.
A specialist in seismic data acquisition and marine geophysical services, PXGEO was established in 2021. The firm employs 400 people at its Dubai headquarters and offices in Paris, Houston, and Oslo, along with a dedicated offshore workforce.
‘Having been with PXGEO since its inception, Burlid brings an extensive and deep understanding of the company’s operations, culture and commercial landscape. Known for his strong business acumen and a proven track record of driving complex, cross-functional projects, he is well-positioned to lead the company’s strategic agenda under the guidance of newly appointed executive chairman and CEO Charles ‘Chuck’ Davison Jr,’ said PXGEO.
Burlid has 21 years’ experience largely in finance and commercial roles throughout the maritime and subsea data acquisition industry. Prior to PXGEO, he
Hans-Peter Burlid (Credit: PXGEO).
spent 13 years at the company’s predecessor Polarcus, a publicly traded geophysical service provider, where he rose through the ranks to become CFO for five years.
Davison said:
‘I’ve been fortunate to benefit from Hans-Peter’s commercial expertise and leadership during his tenure as CCO. His deep knowledge of our organisation and his strategic mindset will be invaluable as we advance our growth agenda and execute our longterm plans. With Hans-Peter undertaking this new assignment, we are confident PXGEO will continue to evolve and strengthen its market position around the world.’
PXGEO has begun a search for a new CCO who will take on unified leadership across sales, commercial, and business development functions. Until the new appointment is made, Burlid will continue to serve as CCO.
TGS has won a contract for offshore wind site characterisation, including acquisition, imaging and interpretation services offshore Norway. Ramform Vanguard was due to start acquisition in early July, with a duration of approx. 25 days. The imaging and interpretation work will commence concurrently with data acquisition and final data delivery to the client is expected in Q1 2026.
The Ramform Vanguard is equipped with TGS’s proprietary Ultra-High-Resolution 3D (UHR3D) streamers and integrated geophysical sensors. This technology is designed to sample the seismic
wavefield at a high spatial and temporal rate, providing high-resolution data of the shallow subsurface targets for wind farm development.
Kristian Johansen, CEO of TGS, said ‘Another offshore wind site characterisation contract in Northern Europe extends our acquisition campaign in the region by nearly a month. We are seeing strong client adoption for our high-quality geophysical approach to mapping shallower subsurface targets, which supports data-driven decision making for offshore wind farm development and offers a compelling alternative to traditional geophysical wind solutions.’
Halliburton supplies subsurface modelling for Petronas Carigali
Halliburton has announced a strategic collaboration with Petronas Carigali to advance subsurface modelling and reservoir management. Petronas Carigali will deploy Halliburton Landmark’s DecisionSpace 365 Geosciences Suite and Unified Ensemble Modelling solutions to unify exploration and development workflows and accelerate time to first oil.
‘Halliburton Landmark’s scalable earth modelling and ensemble workflows are a significant evolution from traditional grid-based modelling and deterministic reservoir forecasting,’ said Halliburton in a statement. ‘These technologies are intended to enable Petronas Carigali exploration and asset teams to collaborate in real time using a unified live earth model, with the aim of achieving more accurate reserve estimations through ensemble modelling.’
The Geosciences Suite’s scalable earth modelling maintains geological fidelity across all scales – from basin-wide views to individual fields – to ensure consistent data and models flow from exploration to development. The workflow supports
faster project maturation through the front-end loading process, according to Halliburton. Using the Unified Ensemble Modelling solution, asset teams can automate the generation of multiple probabilistic geological scenarios while integrating real-time reservoir flow data, the company added. This approach is designed to enhance forecast precision, accelerate scenario analysis, and improve confidence in decision making.
‘A harmonised, AI-assisted workflow anchored on a single live-earth model across the exploration and development phases is central to our strategy in achieving our ambitious project delivery targets,’ said Hazli Sham Kassim, senior vice-president of Malaysia Asset and CEO of Petronas Carigali.
The collaboration follows a comprehensive benchmarking of Petronas’ greenfield and mature reservoir practices. The new approach will incorporate multi-scenario probabilistic modelling, supported by AI and machine learning to drive greater efficiency and insight.
Shearwater wins 3D seismic survey off the coast of West Africa
Shearwater Geoservices has won a 3D marine seismic acquisition contract from TotalEnergies on the STP-02 Block off
the West African island of Sao Tome & Principe.
The two-month survey will start early in the third quarter of 2025 using the vessel SW Empress. TotalEnergies has operated the offshore exploration block STP02 since 2024 on behalf of its partners, ANP-STP and Sonangol.
Shearwater CEO Irene Waage Basili said: ‘This award marks the initiation of our extended collaboration with TotalEnergies, as it will be the first project after the recently announced seismic capacity agreement, which is an important strategic platform for both companies, providing Shearwater with long-term visibility on future demand, while also supporting TotalEnergies’ global exploration strategy.
Ukraine’s largest energy company Nattogaz and Baker Hughes have signed a deal to explore opportunities to strengthen and modernise Ukraine’s energy sector.
Through the agreement, the companies will explore technical, operational, and commercial opportunities in key energy sectors, including oil and gas extraction, transportation, storage and processing, as well as geothermal projects, carbon capture technologies, and electricity generation.
Gabon
‘Naftogaz Group is building collaboration frameworks that help Ukraine to overcome wartime challenges, implement modern energy solutions, and strengthen energy independence,’ said Sergii Koretskyi, chief executive officer of Naftogaz.
Key areas of co-operation outlined in the agreement include services and equipment for drilling and well construction; emission reduction solutions, carbon capture projects, hydrogen and
geothermal energy; digital services, automation and analytics; equipment for subsurface operations and production processes; and software for asset management and drilling optimisation.
A separate agreement was signed between Baker Hughes and JSC ‘Ukrtransgaz’, a member of Naftogaz Group, to leverage Baker Hughes’ gas technology equipment portfolio for projects in Ukraine involving underground gas storage and power generation.
launches fiscal regime to attract deepwater investment
Gabon has launched a campaign to attract investment in deepwater oil and gas exploration. With 72% of the country’s deepwater acreage unexplored, the country’s energy ministry is revising existing petroleum laws.
With more than two billion barrels of proven oil reserves and significant gas potential, Gabon has set a goal of holding production above 220,000 barrels per day (bpd) for the short to mid-term.
In 2019, the country introduced its Hydrocarbons Code, amending production sharing contracts (PSC), state profitability and tax. Further revisions of the code are expected to encourage deepwater exploration, said Gabon’s oil and gas ministry.
Major players are already active in Gabon, it added. BW Energy, for example, signed PSCs for exploration blocks Niosi Marin and Guduma Marin in 2024, covering an eight-year exploration period with a two-year extension option. BW Energy and its part ner VAALCO Energy have committed to drilling one well as well as carrying out a 3D seismic acquisition campaign.
BW Energy also has stakes in the Dussafu licence, which features 14 producing wells tied back to a FPSO through a 20 km pipeline. Partners on the licence include the state-owned Gabon Oil Company (GOC) and Panoro Energy. Inde pendent oil and gas company Perenco spudded the Hylia South West discovery in Gabon in early 2024, revealing substantial oil-bearing columns in the Ntchengue Ocean reservoir.
China’s CNOOC launched wildcat drilling on Blocks BC-9 and BCD10 in early 2023 on the back of 1.4 billion barrels of recoverable resource potential, with future discoveries set to
double Gabonese oil production while derisking deepwater exploration.
Meanwhile, Perenco is developing the Cap Lopez LNG terminal in Gabon, targeting first production by 2026. Situated at the existing Cap Lopez oil terminal, the project will introduce a FLNG vessel to monetise offshore gas reserves and reduce flaring. The FLNG vessel will feature a production capacity of 700,000 tons of LNG and 25,000 tons of LPG, supported by a storage capacity of 137,000 m3. The project complements the Batanga LPG facility, which came online in December 2023 with a target production capacity of 15,000 tons of LPG annually. Beyond LNG and LPG, Gabon is planning to expand its sole operating refinery – SOGARA – from 1.2 million tons to 1.5 million tons of crude. This expansion would enable the country to achieve self-sufficiency in refined
Minister of oil and gas Sosthène Nguema has also prioritised increasing storage capacity for refined products in the country from 60 days to 90
‘Deepwater exploration and production stands to transform Gabon’s economy, with potential discoveries supporting the development of a new petroleum hub in Central Africa. Through its aggressive investment campaign, commitment to regulatory reform and engagement with IOCs, the Ministry of Petroleum is strengthening the competitiveness of doing business in Verner Ayukegba, senior vice-president at the African Economic Conference.
Minister of oil and gas Sosthène Nguem.
Equinor reveals plans for Johan Svedrup phase 3
Equinor and its partners are investing $1.3 billion in the third phase of Johan Sverdrup. New subsea infrastructure will increase recovery by 40-50 million barrels of oil equivalent (boe).
‘By building on the technologies, solutions, and infrastructure from phases 1 and 2 of Johan Sverdrup, we can carry out an efficient development with a rapid start-up of production. The project increases the recovery rate and value creation from Johan Sverdrup, one of the world’s most carbon-efficient oil and gas fields,’ said Trond Bokn, senior vice-president for project development in Equinor.
The development includes two new subsea templates which will be tied into existing infrastructure via new pipelines. The investment will increase recoverable volumes from the field by 40-50 million boe, with production expected to start in the fourth quarter of 2027.
To ensure optimal resource utilisation, the project leveraged artificial intelligence to analyse field layouts and well paths. This technology has enabled faster decision-making and resulted in cost savings of $13 million for the phase 3 project, said Equinor.
The expected recovery rate from Johan Sverdrup is already 66%. ‘The phase 3 project is an important step towards achieving our ambition of 75%,’ said Equinor. The average for the Norwegian Continental Shelf (NCS) is 47%, it added.
‘In 2024, Johan Sverdrup set a production record with 260 million barrels of oil, the highest annual oil production ever from a Norwegian field. Every third barrel of oil from the Norwegian Continental Shelf now comes from the field. Phase 3 is an important contribution to maintaining high production from
Johan Sverdrup in the years to come,’ said Marianne Bjelland, vice-president for Johan Sverdrup.
Johan Sverdrup is located in the Utsira High area of the North Sea, 160 km west of Stavanger, in water depths of 110-120 m, covering an area of 200 km2. Production capacity is 755,000 barrels a day, approximately one-third of Norway’s total oil production at current levels.
Phase 3 development comprises two new subsea templates in the Kvitsøy and Avaldsnes areas totalling eight wells (seven oil production wells and one water injection well), tied back to existing templates and pipelines to the P2 platform for processing and export.
Equinor is the operator of the field with 42.6%, along with Aker BP (31.5%), Petoro (17%) and TotalEnergies (8.4%).
US unveils plans for oil and gas lease sale in Gulf of America
The US Bureau of Ocean Energy Management has published a Proposed Notice of Sale (PNOS) for an oil and gas lease sale in the Gulf of America.
Lease Sale 262 will offer approx. 15,000 unleased blocks located 3 to 231 miles offshore across the Gulf’s Western, Central, and Eastern Planning Areas. Covering roughly 80 million acres, the blocks to be auctioned are situated in water depths ranging from 3 m to more than 3400 m.
It is the first of three planned lease sales in the Gulf of America under the 2024–2029 Outer Continental Shelf Oil and Gas Leasing Program. BOEM is also developing a National Outer Continental Shelf Oil and Gas Leasing Program that will include additional leasing opportunities.
‘Offshore oil and gas play a vital role in our nation’s energy portfolio, with the Gulf of America supplying 14% of domestically produced oil,’ said BOEM’s principal deputy director Matt Giacona.
The Gulf of America Outer Continental Shelf spans approximately 160 million acres and is estimated to contain around 48 billion barrels of undiscovered, recoverable oil and 141 trillion cubic feet of natural gas.
Leases awarded through Lease Sale 262 will be for oil and gas exploration and development only. Certain areas may be excluded from this lease sale, including blocks subject to the 8 September 2020, presidential withdrawal, blocks adjacent to or beyond the Exclusive Economic Zone in the northern portion of the Eastern Gap, and blocks
within the current boundaries of the Flower Garden Banks National Marine Sanctuary.
‘To support robust industry participation, lower production costs, and unleash the full potential of the Gulf of America’s offshore energy reserves, BOEM is proposing a royalty rate of 16% for both shallow and deepwater leases – the lowest rate for deepwater since 2007,’ said BOEM’s acting regional director for the Golf of America Laura Robbins.
Publication of PNOS on 27 June 2025 initiated a 60-day comment period for the affected state governors and local governments. After the comment period, BOEM will issue a Final Notice of Sale in the Federal Register at least 30 days before the scheduled public bid reading, proposed for 10 December 2025.
Two new subsea templates (marked in yellow) and the existing infrastructure from phases 1 and 2.
Fugro wins geophysical contract for offshore wind farms in German North Sea TGS completes OBN survey in Gulf of America
TGS has completed the Amendment Phase 4 ultra-long offset ocean bottom node (OBN) survey in the Gulf of America.
The project covers 49 outer continental shelf (OCS) blocks across the Mississippi Canyon and Ewing Bank protraction areas, providing valuable insight for companies preparing for anticipated lease rounds as early as the second half of 2025.
For the first time in the Gulf of America, TGS deployed its proprietary Gemini enhanced-frequency seismic source in an ultra-long offset acquisition setting. Gemini delivers a unique low-frequency, omnidirectional signal that, combined with advanced processing techniques, is said to significantly improves illumination beneath complex salt bodies.
David Hajovsky, executive vice president of multi-client at TGS, said: ‘The successful use of the Gemini low-frequency source in this programme marks a step forward in delivering greater subsurface clarity while meeting evolving industry expectations around responsible operations.’
Fugro has won contracts to conduct both geophysical and geotechnical site investigations for two large-scale offshore wind farms in the German North Sea. The project, known as Windbostel Ost and Windbostel West, is a joint venture between RWE and TotalEnergies, with a combined generating capacity of 4GW.
Fugro will provide geo-data on the seabed and subsurface conditions northwest of the island of Borkum. The geophysical surveys will provide initial detailed mapping of the seabed and shallow subsurface layers, identifying potential hazards and informing early design considerations.
Federal Maritime and Hydrographic Agency (BSH).
After the May 2025 release, which covered the Uinta, Piceance, and Paradox basins, the new dataset delivers regional subsurface insights across more than 4000 wells and includes 59 stratigraphic tops, 29 of which account for repeated occurrences in the thrust belt. The release also includes detailed petrophysical interpretations and regional property maps, supporting both traditional and emerging energy workflows.
The Amendment 4 early-out product will be available in the third quarter of 2025, with final data delivery expected in the second quarter of 2026.
Meanwhile, TGS has released a stratigraphic and petrophysical dataset for the Greater Green River Basin (GGRB) in Wyoming, onshore US, further expanding its Rocky Mountain data portfolio.
The geotechnical investigation will provide data on the seabed’s soil composition and characteristics through in situ testing and sampling. The combined geophysical and geotechnical data will inform foundation design, structural analysis, cable routing, and risk assessment during the construction and operational phases of the project.
This contract follows Fugro’s previous geotechnical investigations for the 1.6 GW Nordseecluster project (RWE share: 51%) in Germany and builds on preliminary geotechnical data acquired by Fugro for the German
Designed for ‘maximum utility and technical integrity’, the dataset enables consistent regional stratigraphic interpretation across structural and depositional complexities, petrophysical analysis of key reservoir characteristics such as porosity and fluid saturation, basin-wide property mapping, facilitating prospect evaluation, reservoir modelling, and carbon storage screening.
The GGRB dataset supports a wide range of subsurface applications, from hydrocarbon extraction to carbon storage assessment. It is built to integrate seamlessly into existing workflows, offering a standardised foundation for geoscientists, engineers, and decision-makers focused on regional exploration and energy transition strategies.
Fugro Zenith vessel.
David Hajovsky, executive vice president of multi-client at TGS.
100+
80+
ENVIRONMENT, MINERALS AND INFRASTRUCTURE
Submit an article
This month we feature some of the papers that will be featured at the EAGE Near Surface Geoscience conference in Naples, Italy on 7-11 September. The conference will also feature five parallel programmes covering: Environmental and Engineering Geophysics; Mineral Exploration and Mining; Infrastructure Planning, Monitoring and BIM; Geohazards Assessment and Risk Mitigation; and UXO and Object Detection. Reflecting the broader theme of this issue, which has been renamed Environment, Minerals and Infrastructure, participants at the conference will have the opportunity to explore a wider range of subjects and innovative approaches, opening new avenues for growth within geosciences.
Vetle Vinje et al investigate a novel UHR configuration deployed during a field test in June 2024 offshore Concarneau in France where a deep streamer was towed underneath a new sparker source.
Joy Muraszko presents radiocarbon dating results from eight cores in the Rakhine Basin, building on previous geophysical interpretations and coring efforts to focus on turbidites and mass transport deposits for geohazard assessment.
Giorgio De Donno et al present an application of a global inversion approach based on the Very Fast Simulated Annealing (VFSA) algorithm to ERT and IP datasets acquired on a municipal solid waste (MSW) landfill located in Central Italy.
Ana Abreu et al present the experimental procedure used to estimate the fundamental period of the soil, Tsoil, which is based on the horizontal- to-vertical spectral ratio (HVSR) method, and the fundamental period of the wind tower, Ttower, based on the top-to-base horizontal spectral ratio (HHSR) method proposed by Álvarez (2025).
First Break Special Topics are covered by a mix of original articles dealing with case studies and the latest technology. Contributions to a Special Topic in First Break can be sent directly to the editorial office (firstbreak@eage.org). Submissions will be considered for publication by the editor.
It is also possible to submit a Technical Article to First Break. Technical Articles are subject to a peer review process and should be submitted via EAGE’s ScholarOne website: http://mc.manuscriptcentral.com/fb
You can find the First Break author guidelines online at www.firstbreak.org/guidelines.
Special Topic overview
January Land Seismic
February Digitalization / Machine Learning
March Reservoir Monitoring
April Underground Storage and Passive Seismic
May Global Exploration
June Navigating Change: Geosciences Shaping a Sustainable Transition
July Reservoir Engineering & Geoscience
August Environment, Minerals and Infrastructure
September Modelling / Interpretation
October Energy Transition
November Marine Acquisition
December Data Management and Processing
More Special Topics may be added during the course of the year.
CALENDAR OF EVENTS
1-4 Sep World CCUS Conference www.wccus.org
7-11 Sep Near Surface Geoscience Conference and Exhibition (NSG) 2025
- 31st European Meeting of Environmental and Engineering Geophysics
- 6th Conference on Geophysics for Mineral Exploration and Mining
- 4th Conference on Geophysics for Infrastructure Planning, Monitoring and BIM
- 1st Conference on Geohazards Assessment and Risk Mitigation
- 1st Conference on UXO and Object Detection www.eagensg.org
7-11 Sep 32 nd International Meeting on Organic Geochemistry (IMOG) www.imogconference.org
9-11 Sep Second EAGE Conference and Exhibition on Guyana-Suriname Basin www.eage.org
14-18 Sep Seventh International Conference on Fault and Top Seals www.eage.org
15-17 Sep Fifth EAGE Workshop on Assessment of Landslide Hazards and Impact on Communities www.eage.org
15-18 Sep AOW Energy 2025 www.aowenergy.com
16-18 Sep The Middle East Oil, Gas and Geosciences Show (MEOS GEO) www.meos-geo.com
17-18 Sep First EAGE Workshop on Energy Transition in Latin America’s Southern Cone www.eage.org
29 Sep1 Oct Second AAPG/ EAGE Mediterranean and North African Conference (MEDiNA) medinace.aapg.org
29 Sep1 Oct Eighth EAGE Borehole Geophysics Workshop www.eage.org
7-11 SEPTEMBER 2025
6-8 Oct Second EAGE Data Processing Workshop www.eage.org Barcelona Spain
6-8 Oct Empowering the Energy Shift - The Role of HPC in Sustainable Innovation: Ninth EAGE High Performance Computing Workshop www.eage.org Barcelona Spain
6-9 Oct GEOTERRACE-2025: International Conference of Young Professionals www.eage.org
14-16 Oct First EAGE Conference on the Future of Mineral Exploration: Challenges and Opportunities www.eage.org
15-16 Oct 3 rd EAGE/SUT Workshop on Integrated Site Characterization for Offshore Renewable Energy www.eage.org
de Chile Chile
21-22 Oct First EAGE Workshop on Geophysical Techniques for Monitoring CO2 Storage www.eage.org Toronto Canada
21-23 Oct First EAGE/ AAPG/ SEG Carbon Capture Utilisation and Storage Workshop (CCUS) www.eage.org Al Khobar Saudi Arabia
27-31 Oct 6th EAGE Global Energy Transition Conference & Exhibition (GET 2025) - EAGE Carbon Capture and Storage Conference
- EAGE Geothermal Energy Conference
- EAGE Hydrogen and Energy Storage Conference
- EAGE Offshore Wind Energy Conference www.eageget.org
The Netherlands
28-30 Oct 2 nd Edition AAPG/EAGE Petroleum Systems of the Middle East GTW www.eage.org Kuwait City Kuwait November 2025
2-5 Nov EAGE/AAPG Workshop on Tectonostratigraphy of the Arabian Plate: Structural Evolution of the Arabian Basins www.eage.org Riyadh Saudi Arabia
10-11 Nov EAGE Workshop on Enhancing Subsurface Practices using AI/ML www.eage.org
10-12 Nov Seventh EAGE Rock Physics Workshop www.eage.org Cape Town South Africa