
SPECIAL TOPIC
SPECIAL TOPIC
CROSSTALK The ethical challenge for geoscientists
TECHNICAL ARTICLE Machine learning algorithms for predicting pore pressure
CHAIR EDITORIAL BOARD
Clément Kostov (cvkostov@icloud.com)
EDITOR
Damian Arnold (arnolddamian@googlemail.com)
MEMBERS, EDITORIAL BOARD
• Philippe Caprioli, SLB (caprioli0@slb.com)
• Satinder Chopra, SamiGeo (satinder.chopra@samigeo.com)
• Anthony Day, NORSAR (anthony.day@norsar.no)
• Peter Dromgoole, Retired Geophysicist (peterdromgoole@gmail.com)
• Kara English, University College Dublin (kara.english@ucd.ie)
Adding value and breathing new life into difficult onshore seismic through a novel bandwidth extension approach FIRST BREAK ® An EAGE Publication
Hamidreza Hamdi, University of Calgary (hhamdi@ucalgary.ca)
Fabio Marco Miotti, Baker Hughes (fabiomarco.miotti@bakerhughes.com)
• Roderick Perez Altamar, OMV (roderick.perezaltamar@omv.com)
• Susanne Rentsch-Smith, Shearwater (srentsch@shearwatergeo.com)
• Martin Riviere, Retired Geophysicist (martinriviere@btinternet.com)
• Angelika-Maria Wulff, Consultant (gp.awulff@gmail.com)
EAGE EDITOR EMERITUS
Andrew McBarnet (andrew@andrewmcbarnet.com)
PUBLICATIONS MANAGER
Hang Pham (publications@eage.org)
MEDIA PRODUCTION
Saskia Nota (firstbreakproduction@eage.org)
Ivana Geurts (firstbreakproduction@eage.org)
ADVERTISING INQUIRIES corporaterelations@eage.org
EAGE EUROPE OFFICE
Kosterijland 48 3981 AJ Bunnik
The Netherlands +31 88 995 5055
• eage@eage.org www.eage.org
EAGE MIDDLE EAST OFFICE
EAGE Middle East FZ-LLC
Dubai Knowledge Village PO Box 501711
Dubai, United Arab Emirates +971 4 369 3897
• middle_east@eage.org
• www.eage.org
EAGE ASIA PACIFIC OFFICE
EAGE Asia Pacific Sdn. Bhd. UOA Centre Office Suite 19-15-3A No. 19, Jalan Pinang 50450 Kuala Lumpur
Malaysia
• +60 3 272 201 40 asiapacific@eage.org
• www.eage.org
EAGE LATIN AMERICA OFFICE
EAGE Americas SAS
Av Cra 19 #114-65 - Office 205 Bogotá, Colombia
• +57 310 8610709
• americas@eage.org www.eage.org
EAGE MEMBERS’ CHANGE OF ADDRESS
Update via your MyEAGE account, or contact the EAGE Membership Dept at membership@eage.org
FIRST BREAK ON THE WEB www.firstbreak.org
ISSN 0263-5046 (print) / ISSN 1365-2397 (online)
33 Capacitance retrieval from resistivity and P-wave velocity products and ratios
Romaric Limacher, Sophie Mann and Antoine Misse
41 Application of machine learning algorithms for predicting formation pore pressure: a case study in the Sapphire field, offshore Nile delta, Egypt
Mohamed Ahmed Abdelhay, Abdel Nasser Helal, Abdel Aleem Elessawy and Amir Lala
49 Drilling for ultradeep exploration
Rasoul Sorkhabi
55 Remote sensing detection of gases and surface anomalies as potential seismic precursors
Gabriela Correa Godoy and Carlos Alberto Vargas Jiménez
63 Enhancing geothermal efficiency with autonomous flow control devices: a new era in sustainable energy extraction
Mojtaba Moradi
69 The application of dispersion and attenuation seismic attributes to determine the gas saturation in the low-impedance sandstone: a case study in the Sadewa field, Indonesia
Mokhammad Puput Erlangga, Wahyu Triyoso, Sigit Sukmono, Fatkhan, Pongga Wardaya and Erlangga Septama
79 Pioneering fully remote reservoir monitoring with time-lapse gravimetry and seafloor deformation measurements Endre Vange Bergfjord, Håvard Alnes, Trond Arne Espedal and Lars Hille
85 Adding value and breathing new life into difficult onshore seismic through a novel bandwidth extension approach Marianne Rauch, Umberto Barbato, John Castagna and Alex Fick
82 Calendar
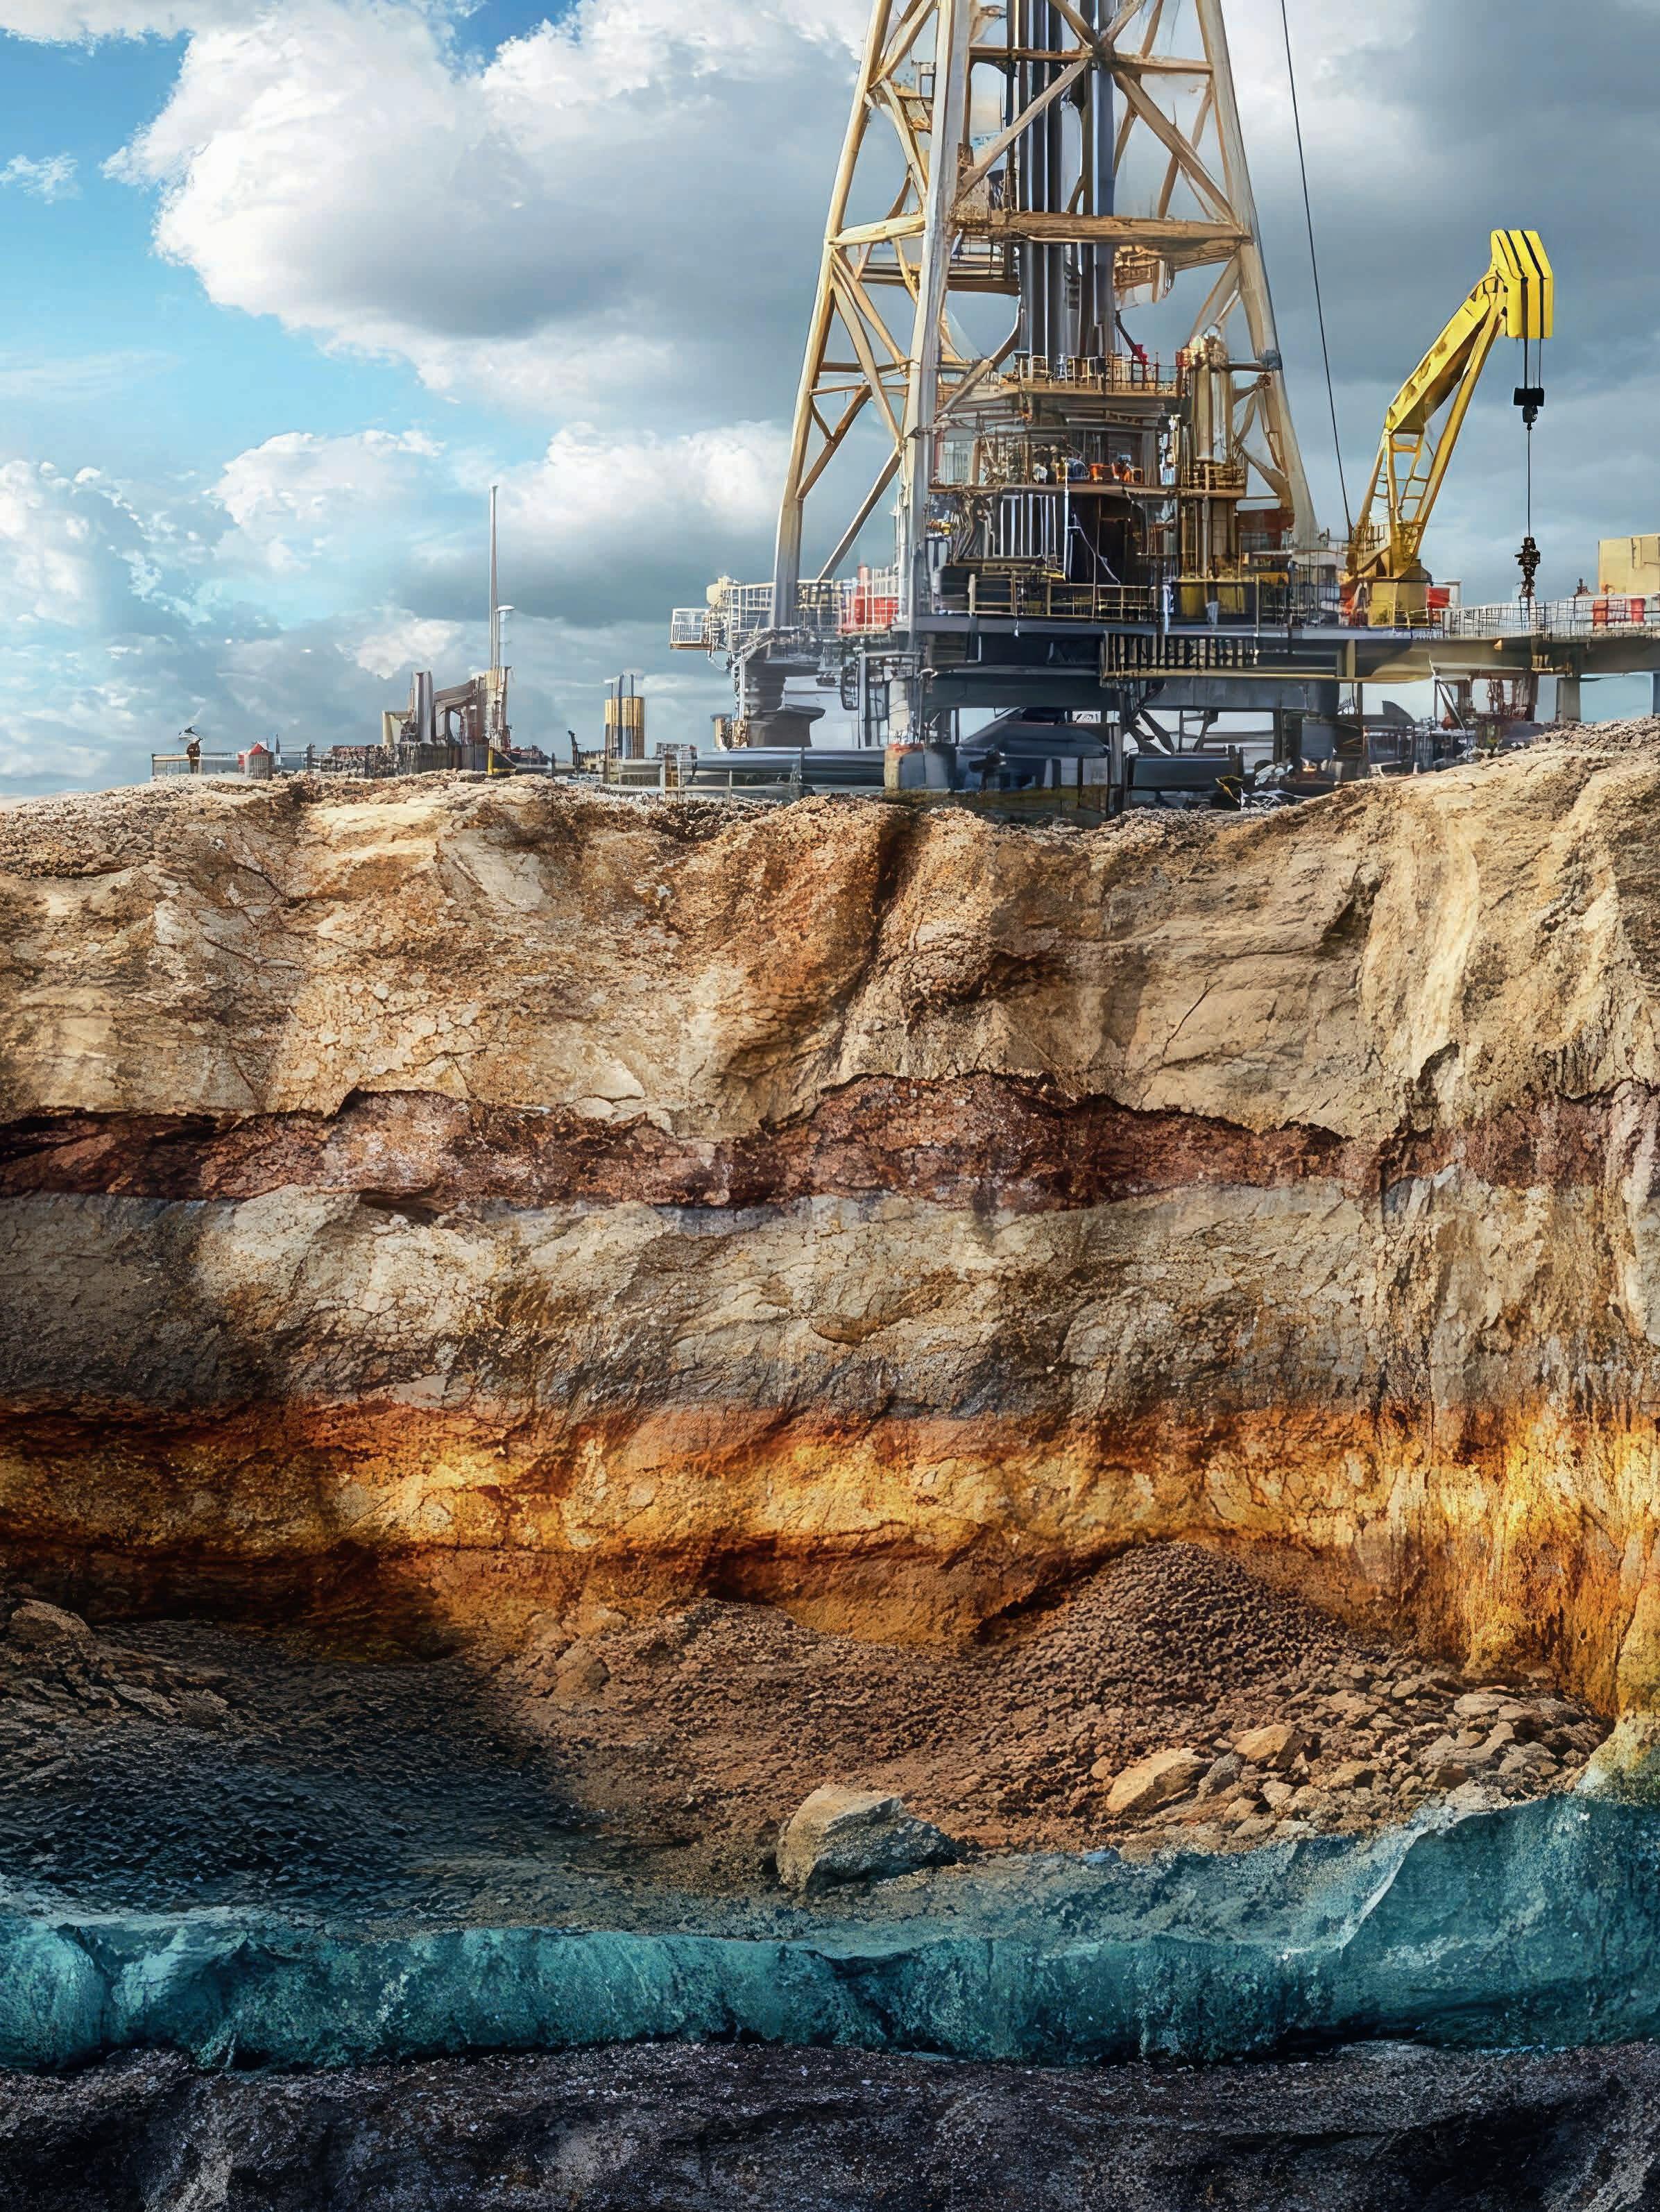
cover: A cross-section of geological layers is exposed as a drill reaches the oil reservoir.
Andreas Aspmo Pfaffhuber Chair
Florina Tuluca Vice-Chair
Esther Bloem Immediate Past Chair
Micki Allen Liaison EEGS
Martin Brook Liaison Asia Pacific
Ruth Chigbo Liaison Young Professionals community
Deyan Draganov Technical Programme Representative
Vladimir Ignatev Liaison CIS / North America
Madeline Lee Liaison Women in Geoscience and Engineering community
Gaud Pouliquen Liaison Industry and Critical Minerals community
Eduardo Rodrigues Liaison First Break
Mark Vardy Editor-in-Chief Near Surface Geophysics
Johannes Wendebourg Chair
Timothy Tylor-Jones Vice-Chair
Yohaney Gomez Galarza Immediate Past Chair
Wiebke Athmer Member
Alireza Malehmir Editor-in-Chief Geophysical Prospecting
Adeline Parent Member
Jonathan Redfern Editor-in-Chief Petroleum Geoscience
Xavier Troussaut EAGE Observer at SPE-OGRC
Robert Tugume Member
Anke Wendt Member
Martin Widmaier Technical Programme Officer
Giovanni Sosio Chair
Benjamin Bellwald Vice-Chair
Carla Martín-Clavé Immediate Past Chair
SUBSCRIPTIONS
First Break is published monthly. It is free to EAGE members. The membership fee of EAGE is € 85.00 a year including First Break, EarthDoc (EAGE’s geoscience database), Learning Geoscience (EAGE’s Education website) and online access to a scientific journal.
Companies can subscribe to First Break via an institutional subscription. Every subscription includes a monthly hard copy and online access to the full First Break archive for the requested number of online users.
Orders for current subscriptions and back issues should be sent to First Break B.V., Journal Subscriptions, Kosterijland 48, 3981 AJ Bunnik, The Netherlands. Tel: +31 (0)88 9955055, E-mail: subscriptions@eage.org, www.firstbreak.org.
First Break is published by First Break B.V., The Netherlands. However, responsibility for the opinions given and the statements made rests with the authors.
COPYRIGHT & PHOTOCOPYING © 2025 EAGE
All rights reserved. First Break or any part thereof may not be reproduced, stored in a retrieval system, or transcribed in any form or by any means, electronically or mechanically, including photocopying and recording, without the prior written permission of the publisher.
PAPER
The publisher’s policy is to use acid-free permanent paper (TCF), to the draft standard ISO/DIS/9706, made from sustainable forests using chlorine-free pulp (Nordic-Swan standard).
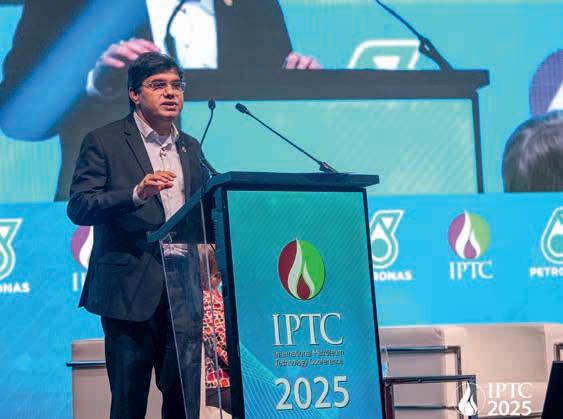
Incoming president Sanjeev Rajput lays out his strategy for EAGE and what has shaped his career and philosophy.
Tell us a little about your background
I was born in India and shaped by a sense of inquiry. My journey has moved across four continents, gathering research depth in the US system, thinking in Australia, and strategic execution in Malaysia, where I currently serve Petronas. These geographies gave me more than career stations; they embedded global awareness in my approach. Across over 20 countries, I’ve worked to integrate technology, science, and leadership into meaningful outcomes, from carbon storage strategy to seismic innovation and AI integration. That fusion is now central to how I lead.
How did your interest in geoscience develop?
It began with a village potter who selected clay not by luck, but by reading the soil’s texture, moisture, and scent. He tapped the ground and said, ‘This one will hold water.’ He wasn’t trained in geology, but he understood stratigraphy in his own way. That moment revealed to me that the Earth leaves clues, if you know how to observe. Years later, geoscience became my method to decode those signals. That foundational insight still guides me.
Highlights of your career so far?
Three themes define my career: innovation, impact, and integration. At Petronas, I’ve led initiatives that dramatically improved decision-making across exploration and development by embedding advanced digital frameworks into subsurface workflows; I helped deliver a national-scale transformation by leveraging AI and geoscience integration to reduce subsurface uncertainty, enhance reservoir
understanding, and improve confidence in strategic investments; and earlier in my career, I championed one of the industry’s first digital field development concepts, bringing together real-time data, predictive analytics, and reservoir intelligence to unlock new production.
One project stands out: our model predicted overlooked pay in a mature field, others missed it, we drilled it, and oil flowed. That shifted our entire mindset. We saw digital not just as technology, but as insight. Yet what I cherish most is mentoring the next generation, watching them apply fresh thinking and bold tools to solve complex challenges, often in ways we never imagined possible.
Your current job in Petronas?
Imagine translating billions of data points into billion-dollar decisions. That’s my daily landscape. I serve as technical authority and general manager for reservoir geoscience innovation at Petronas. My work spans front-endloading (FEL), reservoir characterisation, field-development, AI-led interpretation, seismic QI, CCUS workflow automation, and enterprise-level computing architecture through platforms like EPIC. I also
provide strategic oversight for digital procurement, innovation sourcing, and platform governance. It’s where geoscience meets enterprise, and where insight becomes action.
How would you like to see the EAGE evolve?
I want EAGE to move from being a repository of knowledge to a real-time enabler of transformation. That means integrating digital fluency, equity, and regional relevance. We must be as agile as the technologies we study. EAGE should provide mobilefirst, multilingual, and bandwidth-friendly platforms for learning and certification. Our regional chapters, from Southeast Asia to Latin America, should be empowered to
co-lead the digital transition. I see EAGE as an evolving system, not a static society. We must also go deeper into frontier themes, like geomechanical risk in CCS, or AI bias in seismic prediction, ensuring members lead the discussions that will define the next decade.
One of my top priorities is to strengthen EAGE’s leadership in the energy transition. We must accelerate our focus on CCUS, geothermal energy, hydrogen systems, and sustainable subsurface technologies. These are no longer emerging topics, they are core pillars of our collective future.
Any personal objectives for EAGE?
Yes, my focus for EAGE is built around three pillars: empowerment, expansion, and elevation.
Empowerment involves engaging students as co-creators of real challenges, not just attendees. Expansion means building grassroots momentum through school outreach, student chapters, and regional hubs. Elevation positions EAGE as a thought leader in policy and innovation for CCUS, geothermal, and AI-driven field development.
A key priority is to spotlight game-changing technologies like DUG’s multi-parameter full waveform inversion (MP-FWI).
To mainstream such innovation, I plan to launch EAGE Global Learning Labs, making tools like MP-FWI, machine learning, and digital twins accessible across the EAGE ecosystem.
Any special message for members?
You are no longer just interpreters of subsurface data, you are architects of Earth’s energy transition. In an era of climate urgency, geopolitical complexity, and digital acceleration, our role is more vital than ever. Let’s not just analyse the wavefield, let’s shape the wave.
Geoscience must evolve as a bridge, linking knowledge, sustainability, and impact. Let’s learn beyond disciplines. Let’s collaborate across boundaries. And let’s rise beyond routine, to lead, to include, and to inspire.
Because we’re not just digging for answers anymore, we are laying the foundations of the future; and in every seismic line lies a story, and in every young professional, the potential to reshape how that story is told. Let’s empower them not just to see the layers beneath, but the horizons ahead.
We are no longer just exploring the subsurface, we are exploring the future. Let’s lead it with science, shape it with purpose, and share it with the world.
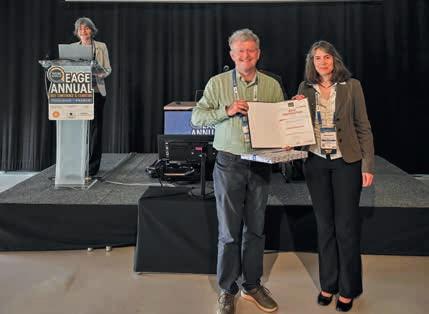
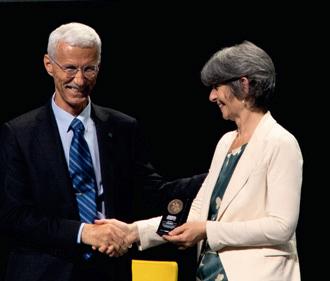
Former EAGE president Philip Ringrose has been named the Best Instructor of 2024 for his highly acclaimed course C02 Storage Project Design and Optimization (Saline Aquifers), which was a cornerstone of EAGE’s educational programme last year.
Delivered at multiple major EAGE events – including the GET 2024 in Rotterdam and the EAGE Masterclasses on CO2 Storage in London (2024) and Utrecht (2025) – the course has garnered exceptional feedback from participants across industries. Ringrose is also part of an Extensive Online Short Course on Geological CO2 Storage, making the content accessible to professionals worldwide.
His course provides a comprehensive overview of how to design and optimise CO2 storage projects, with a particular focus on sandstone (siliciclastic) saline aquifer systems.
By the end of the course, participants had the opportunity to gain a rounded, practical understanding of what it takes to implement effective and safe CO2 storage projects. These are skills that are increasingly in demand as industries and governments work toward net-zero goals.
Ringrose views CO2 storage as a crucial tool in tackling climate change. ‘I am quite passionate that it is technically possible to dramatically cut CO2 emissions to atmos-
phere to achieve the net-zero goals to which our politicians have committed,’ he says. ‘The challenge is: are we willing to make the changes needed in our society since it will be costly and will require behavioural changes and societal commitment.’
Conventional Workflow
TIME PROCESSING, DEPTH IMAGING AND AVA INVERSION
Vp/Vs
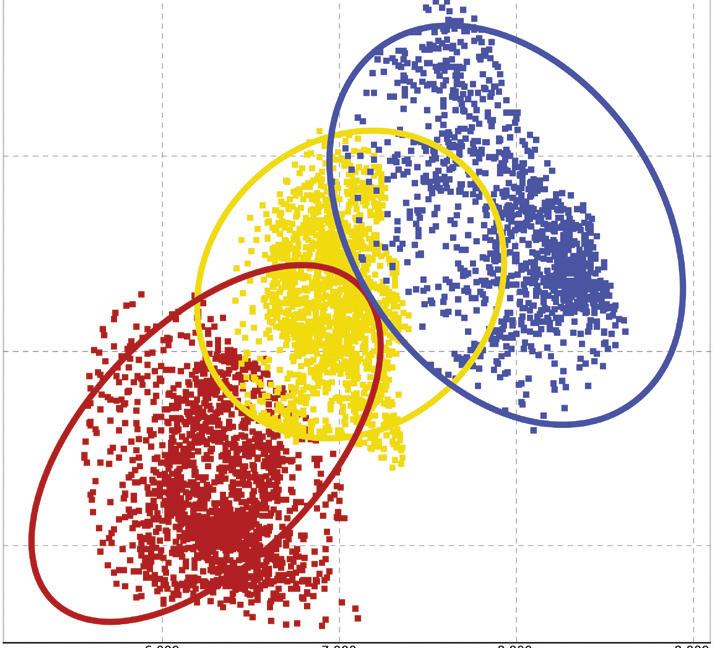
USING FIELD-DATA INPUT
SCATTER = LESS UNCERTAINTY!
Quantitative interpretation requires true amplitudes and high signal-to-noise ratio.
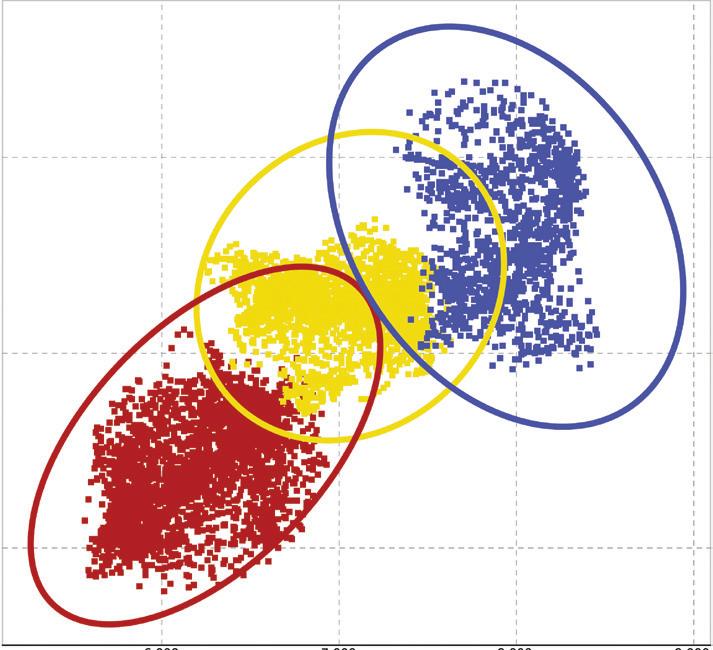
DUG Elastic MP-FWI Imaging eliminates the need for conventional time processing, depth imaging and AVA inversion workflows, along with their assumptions that ultimately affect AVA compliance. With DUG Elastic MP-FWI Imaging more certain predictions can be realised — all using field-data input. Brilliant!
info@dug.com | dug.com/fwi
Everhard Muijzert, chair Awards Committee, encourages members to recommend candidates for EAGE’s range of honours.
The EAGE honours its outstanding members for their significant contributions to geosciences and engineering as well as for contributions to our Association. Last year, the Awards Committee received an exceptional nomination that was supported by 26 members, showing an unprecedented support for a candidate, possibly the highest ever. This remarkable example shows the capabilities and dedication of our members.
Nominations for the 2025 EAGE achievement awards are now open and the EAGE Awards committee is looking
by the achievements of award winners, motivating them to pursue careers in geosciences and engineering.
Overall, the EAGE awards play a crucial role in advancing the fields of geosciences and engineering by celebrating outstanding achievements and fostering a culture of collaboration and togetherness.
A key element of the EAGE awards is recognition by peers. Therefore, prospective candidates are nominated by our members. As a recipient of one of EAGE’s awards, I can personally attest to the great
forward to again seeing our members providing extraordinary support to outstanding candidates.
The EAGE has a total a six achievement awards that together serve several key purposes: Recognition: They acknowledge the hard work and dedication of individuals who have made significant strides in their respective fields. Encouragement: By highlighting exemplary work, these awards encourage others to strive for excellence and innovation. Visibility: Award recipients gain increased visibility within the professional community, which can foster further collaboration and advancements. Inspiration: Young professionals and students are inspired
value and pleasant surprise of the support from fellow members, and the significant impact this recognition had on my early career. Both myself and the members of the Awards committee are now looking forward to receiving nominations for deserving candidates for each of the EAGE achievement awards.
The Desiderius Erasmus Award is presented to individuals for their lifetime contribution in the field of resource exploration and development. It is EAGE’s most prestigious award and is our only award open to non-member candidates. The Conrad Schlumberger Award honours individuals who have demonstrated innovative work in the field of geophysics.
It is one of the most esteemed awards in geophysical research and technology. The Alfred Wegener Award is given to individuals who have made an outstanding contribution to the scientific and technical advancement of EAGE’s disciplines, particularly petroleum geoscience and engineering.
The EAGE recognises young professionals with the Arie van Weelden Award
This is our award for highly significant contributions to one or more of the disciplines in our Association. Candidates must be EAGE members under 35 years of age at the time of the nomination. Now in its third year, the Marie Tharp Sustainable Energy YP Award recognises promising and creative talents among the next generation of energy transition leaders. It is EAGE’s only self-nominating award and candidates for this award must be MSc or PhD students at the time of the application.
Finally, EAGE’s Honorary Membership is open for individuals who have made highly significant and distinguished contributions to the geoscience community at large or to the Association in particular.
Nomination by peers is a key ingredient for the awards. Members are encouraged to get together and collate letters of support for their candidate where the best candidates have a broad support from different members and interest groups. We encourage personalised letters of support.
Each year there are more nominations than winners and the committee encourages resubmission of past nominations, possibly with an improved package. Rules and requirements for the nomination package for each of the achievement awards are available on our website https://eage. org/about_eage/nominations/. Please read and follow these instructions as occasionally a nomination package is received that does not meet the requirements and has to be rejected. We encourage nominations from all EAGE’s technical disciplines, geographies and background.
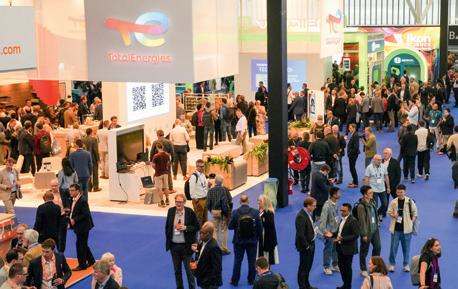
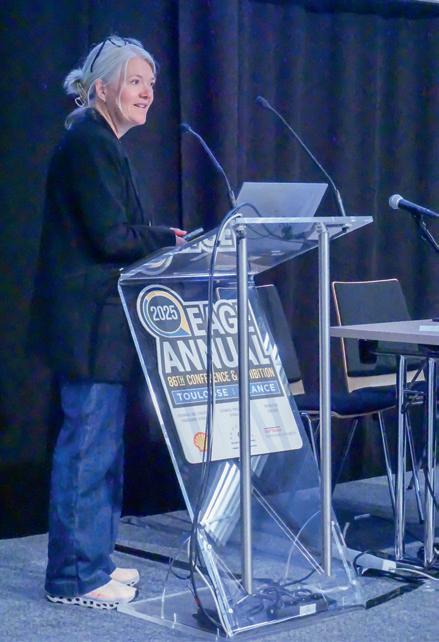
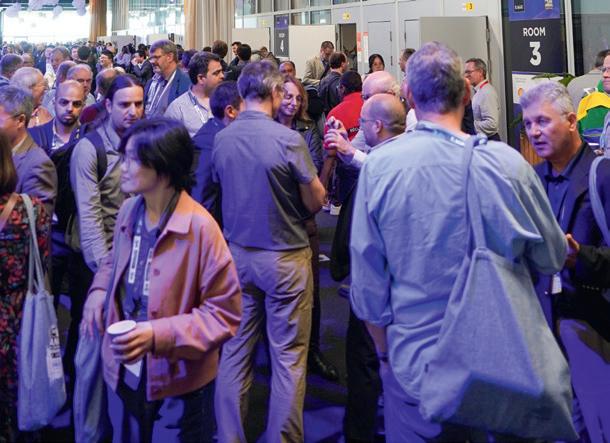
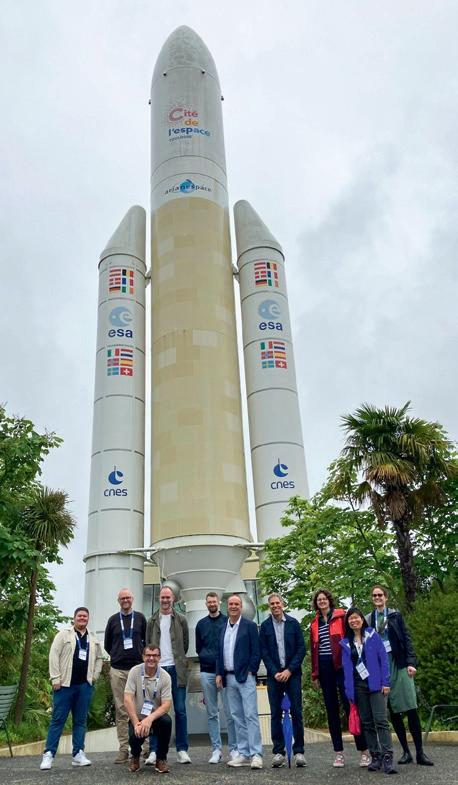
We report on some of the highlights of this year’s Annual Conference & Exhibition in Toulouse.
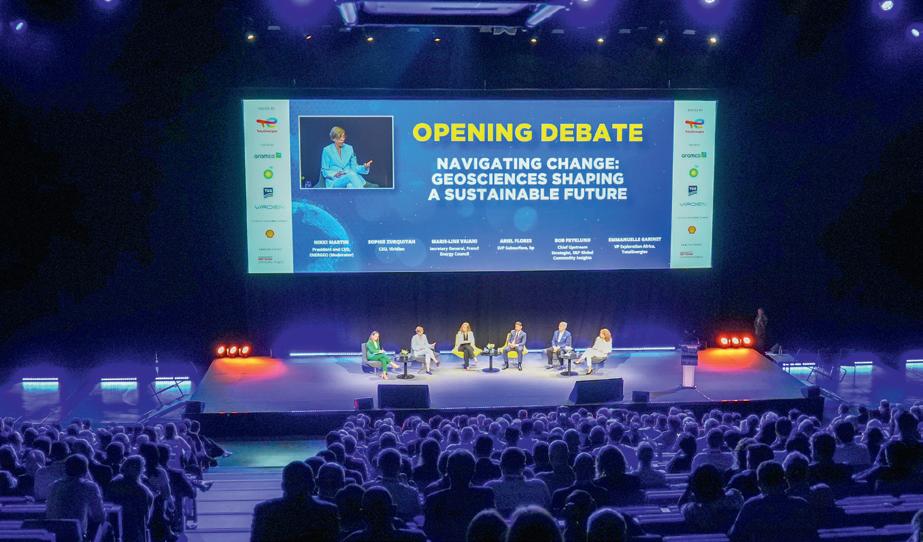
Our 86th Annual proved a landmark event in the Association’s history. The theme Navigating Change: Geosciences Shaping a Sustainable Transition resonated with the thousands of delegates who came to the vibrant city of Toulouse in the week of 2-5 June. Hosted by TotalEnergies, the event showcased both technical excellence and a shared vision for a low-carbon, multi-energy world in line with EAGE’s support of energy transition initiatives.
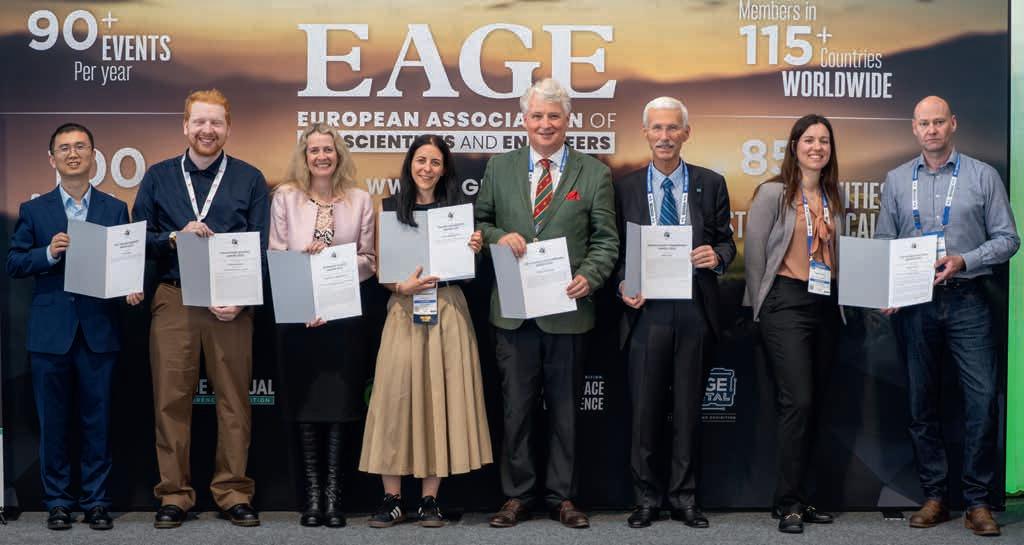
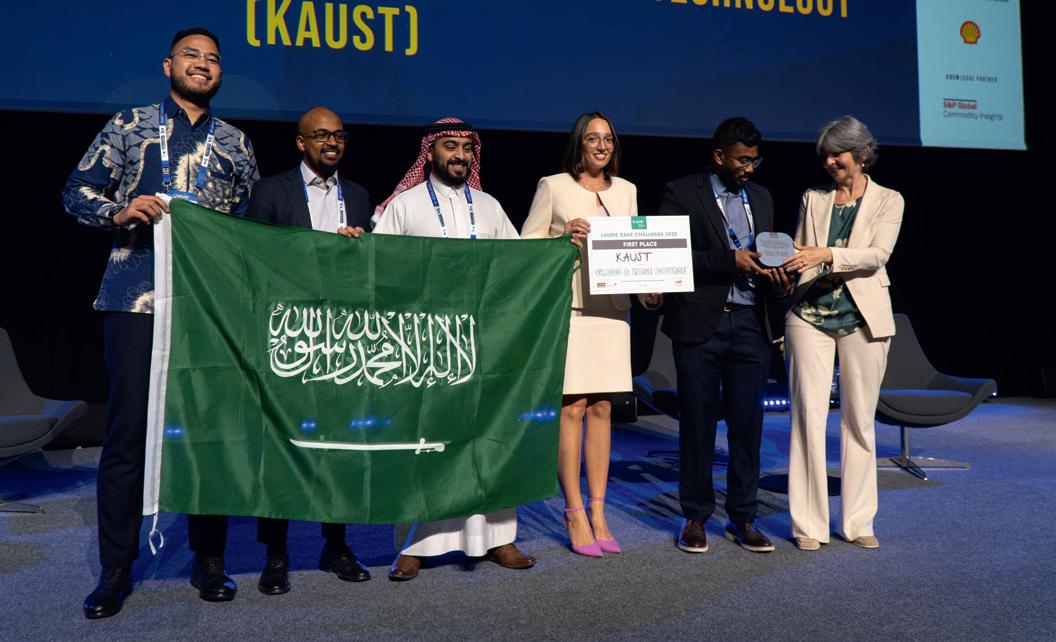
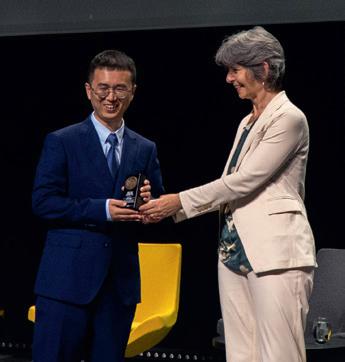
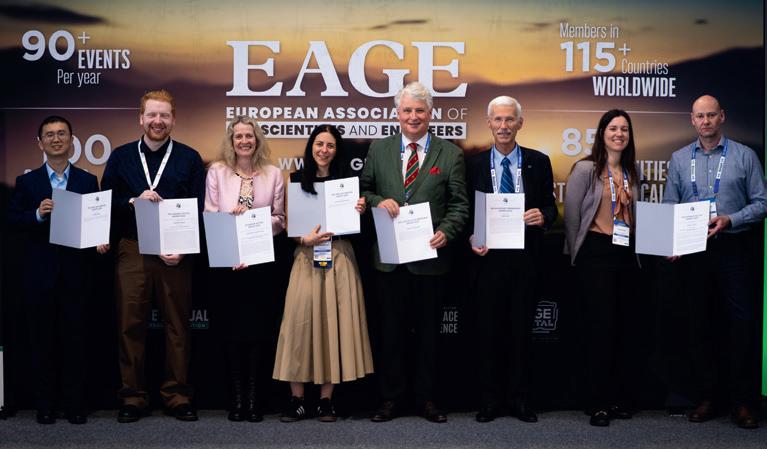
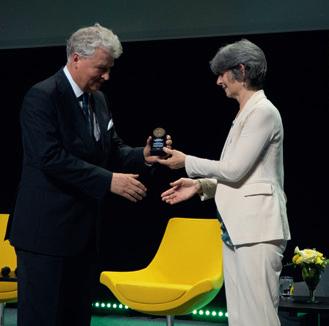
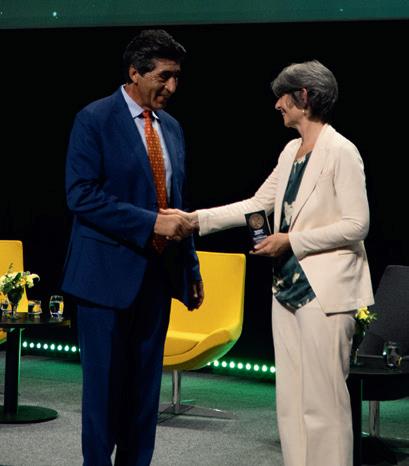
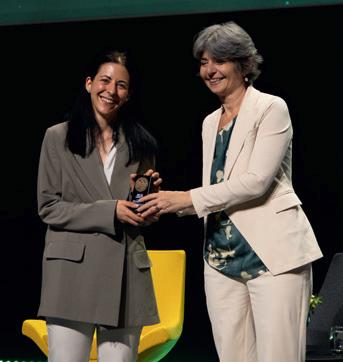
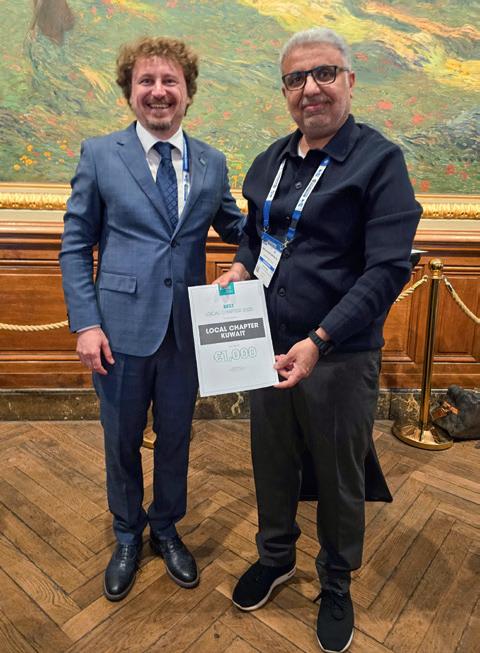
The Opening Ceremony was one of the best attended in EAGE history and set a dynamic tone for the week. It celebrated longstanding excellence with the 2025 Award winners, Laurie Dake Challenge winners, and the Best Local Chapters of the year.
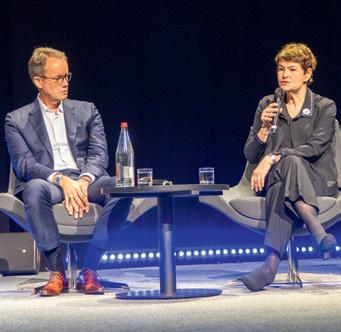
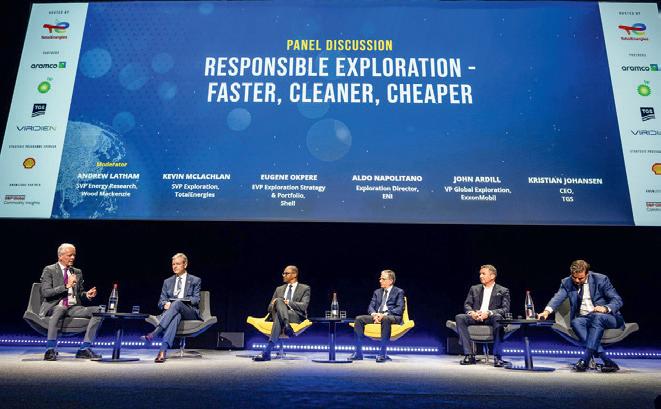
A major highlight was the leadership interview in which Kevin McLachlan, SVP exploration at TotalEnergies, in discussion with Andrew McBarnet, EAGE editor emeritus, provided a candid and compelling overview of the company’s multi-energy strategy. McLachlan spoke about TotalEnergies’ commitment to being a ‘major player in both hydrocarbons and renewables’ outlining a dual approach to investment. With approximately $4.5 billion annually allocated to low-carbon power, including solar-integrated LNG projects, he said TotalEnergies was leveraging its exploration legacy while actively shaping a sustainable future. He stressed the company’s ambition for ‘more energy, less emissions’, stating Scope 1 and 2 emissions were already down 36% from a decade ago, and new goals being exceeded ahead of schedule.
Importantly, McLachlan reaffirmed the continued value of geoscientists, noting they are central to both conventional exploration and the energy transition. Far from phasing them out, he shared that TotalEnergies is hiring geoscientists for lifelong careers, underlining the discipline’s adaptability and enduring relevance.
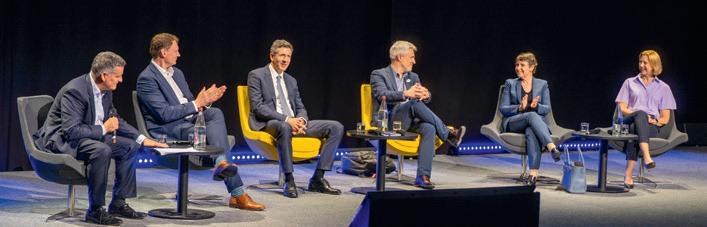
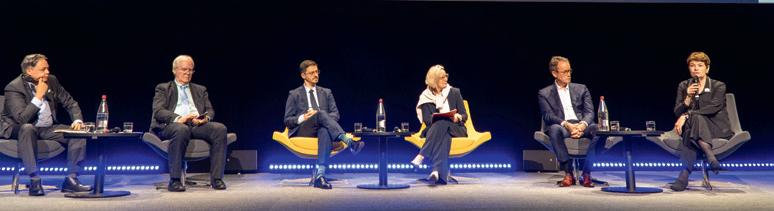
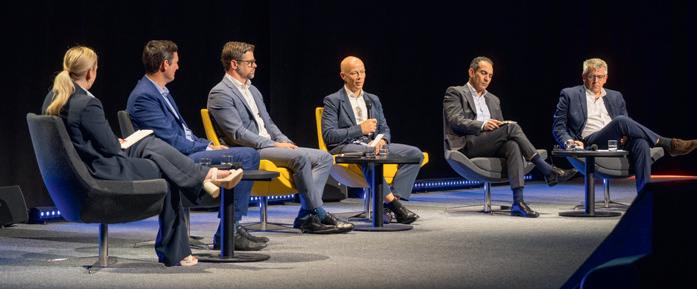
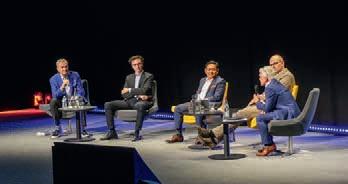
The Opening Debate reflecting the event theme featured a distinguished panel of executives from TotalEnergies, bp, S&P Global, the World Energy Council, and Viridien.
Takeaways from the discussion included geoscience’s central role in energy efficiency, from exploration to carbon sequestration and geothermal development; a consensus that oil and gas will remain part of the mix for decades, even as renewable investment increases; ‘duality’, as coined by Emmanuel Garanet (TotalEnergies), is the new normal, i.e., simultaneously investing in production and emissions reduction; confirmation of the need for responsible exploration, targeting ‘advantaged barrels’ with lower carbon intensity and higher returns; and acknowledgement that geoscientists must be data-literate but remain grounded in domain fundamentals.
Marie-Line Vaiani (World Energy Council) reminded attendees of the energy trilemma, balancing security, equity, and sustainability across diverse regions. Ariel Flores (bp) and Bob Fryklund (S&P Global) both acknowledged the growing tension between energy affordability and transition ambitions, affirming geoscientists’ role in unlocking resilient, efficient, secure energy systems.
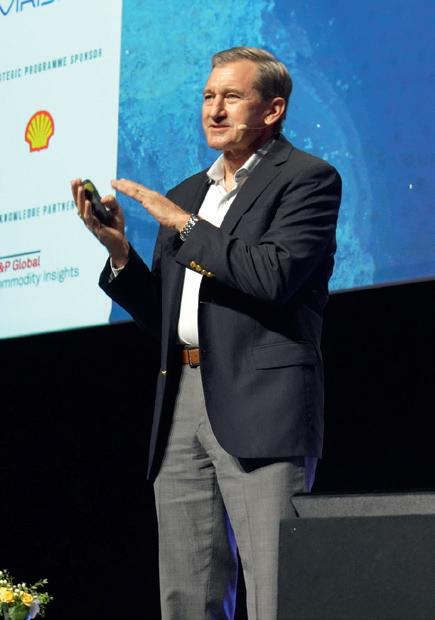
In the keynote A New Energy Path for the 21st Century, Dr Scott Tinker, chairman of Switch Energy Alliance, presented the data-driven, global perspective on energy development for which he has become a major advocate. Tinker challenged binary narratives around energy transition, arguing that energy poverty and economic development hinge on access to secure, scalable energy (hydrocarbons, nuclear, or renewables). Using rich visuals and global case studies, his main point included the need for energy diversity and pragmatism, especially in the Global South; transition must be a managed evolution with infrastructure, technology, and policy alignment; renewables require vast material inputs and cannot currently displace hydrocarbons at global scale; and secure energy underpins environmental progress, i.e., without economic development, environmental goals are unreachable. His final call to ‘power all the people’ reinforced the conference theme that geosciences must not only shape the future of energy but also ensure it is equitable, inclusive, and grounded in real-world physics and economics.
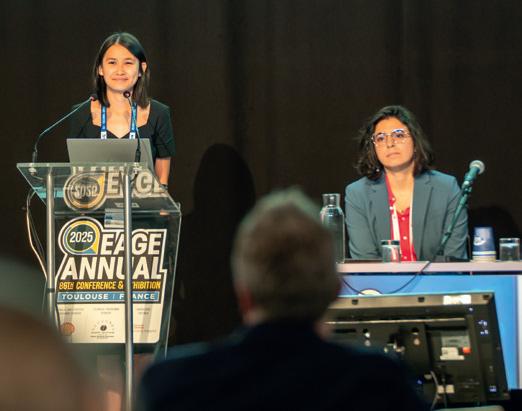
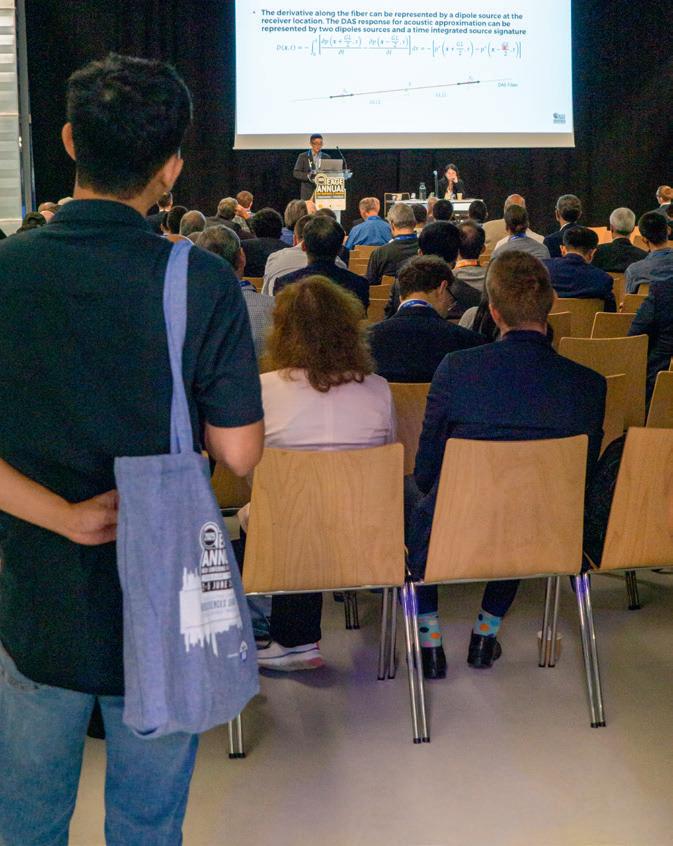
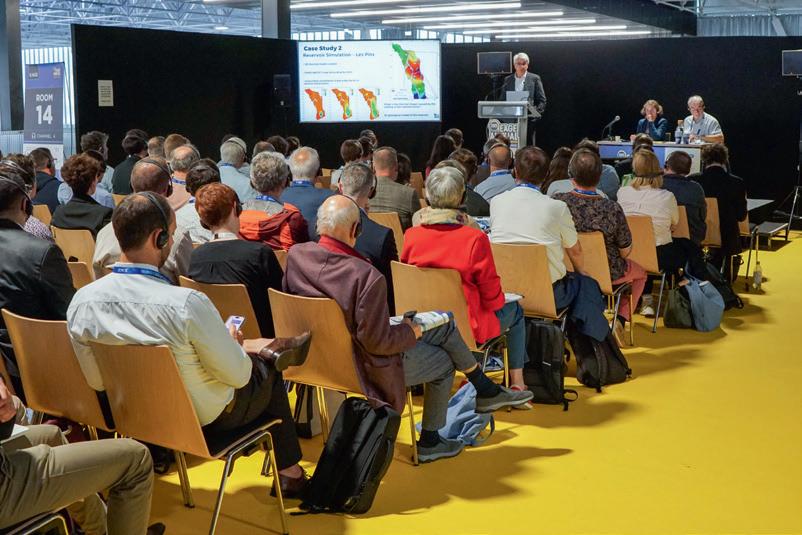
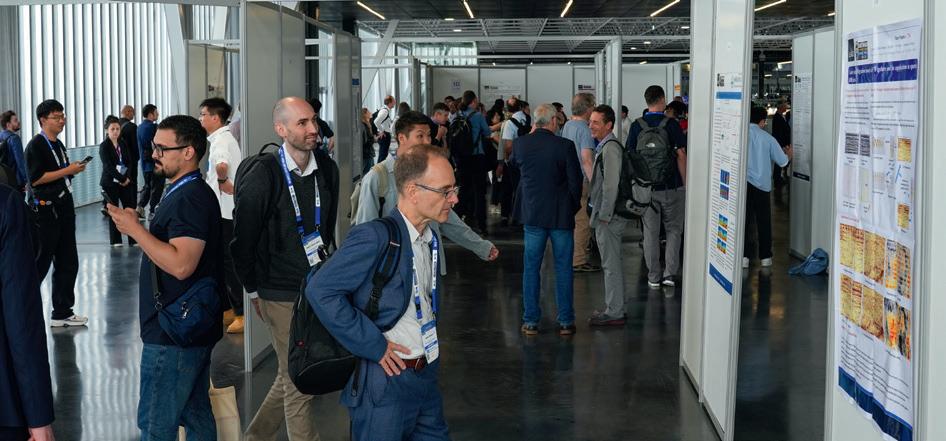
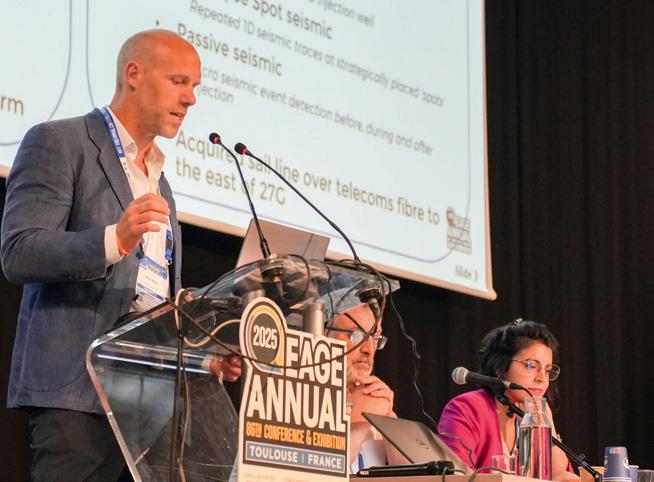
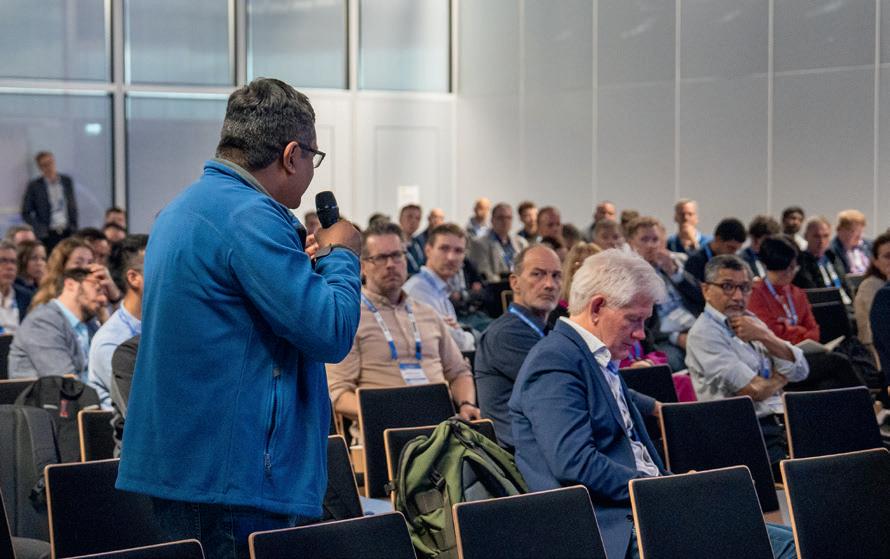
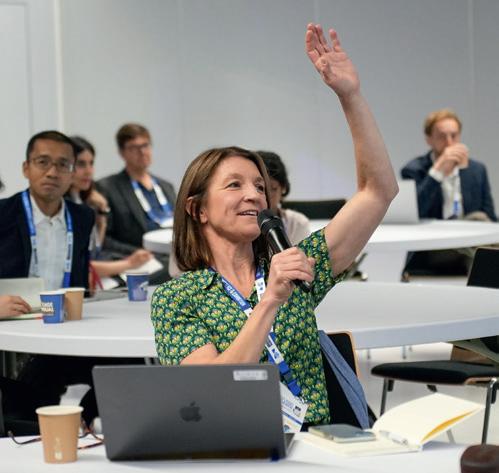
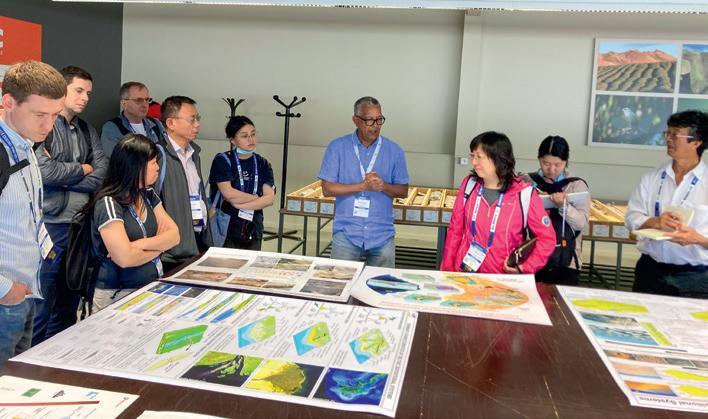
As ever the technical programme was the mainstay of the event. Over 1400 presenters shared innovations and real-world case studies across oral sessions, posters, workshops, and dedicated sessions, reflecting the full spectrum of geoscience and engineering expertise.
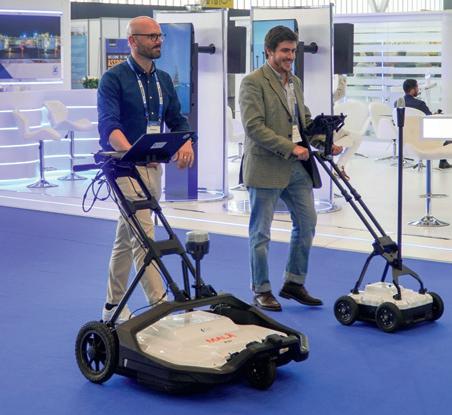
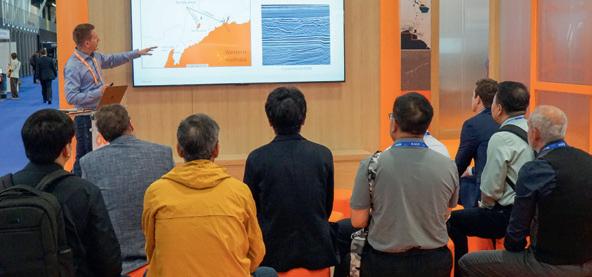
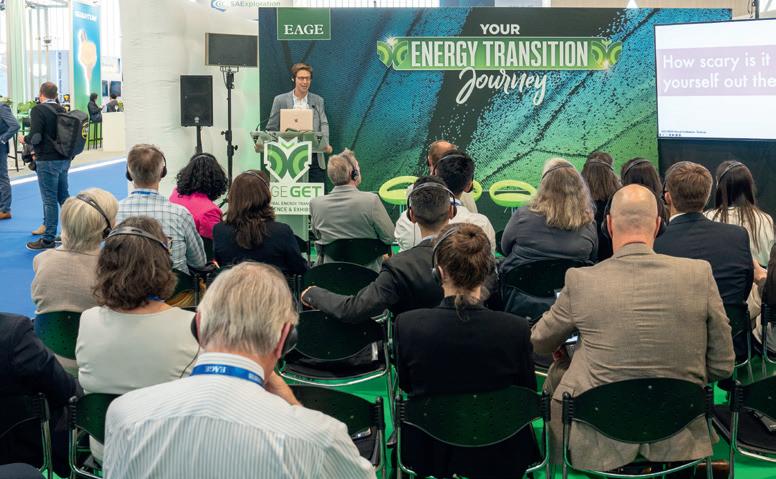
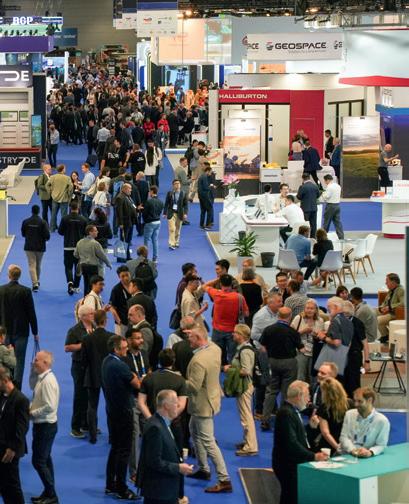
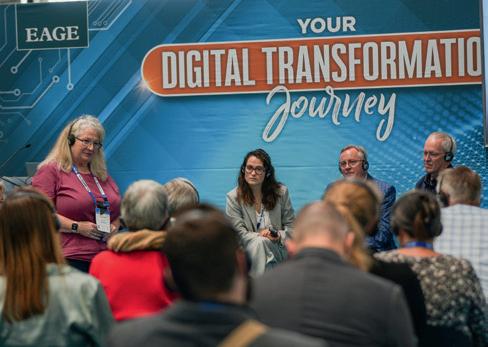
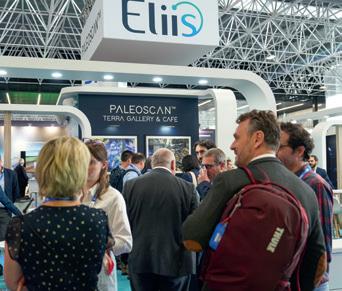
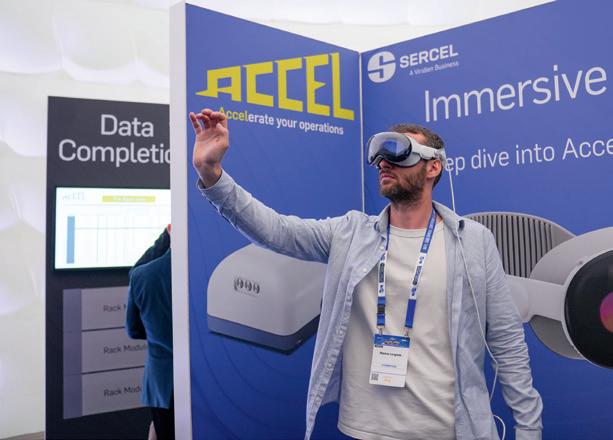
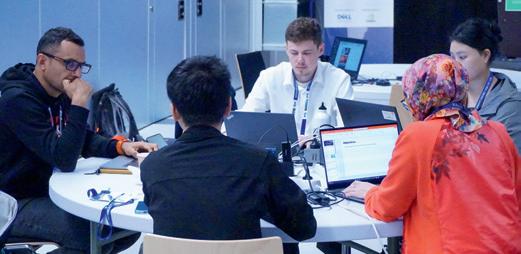
The Exhibition floor reported high engagement from both long-term clients and new prospects. Three dedicated theatres – the Energy Transition Area, Digital Transformation Area, and International Prospecting Centre – drew full sessions and delivered high-value insights, reinforcing the Exhibition’s role as a global platform for knowledge exchange and commercial growth.
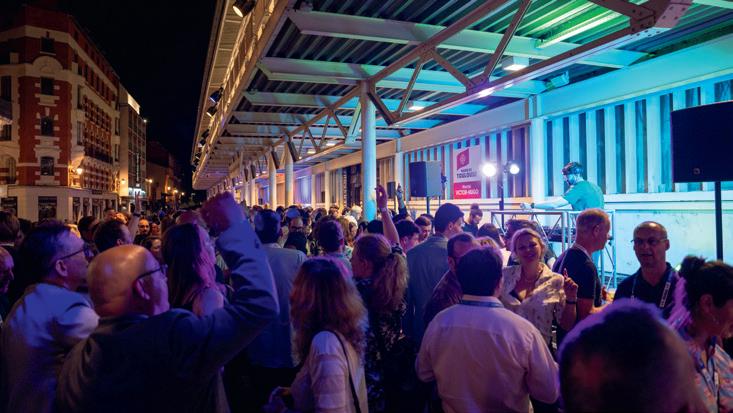
The week was capped off with a festive Conference Evening at the historic Victor Hugo Market, transformed into a private venue for EAGE attendees. With over 70 stalls featuring local wines, cheeses, charcuterie, and desserts, the evening offered a vibrant, relaxed setting for networking, and a true taste of southern France. Many participants described it as one of the best Annual Conference Evenings, if not the best, they had experienced.
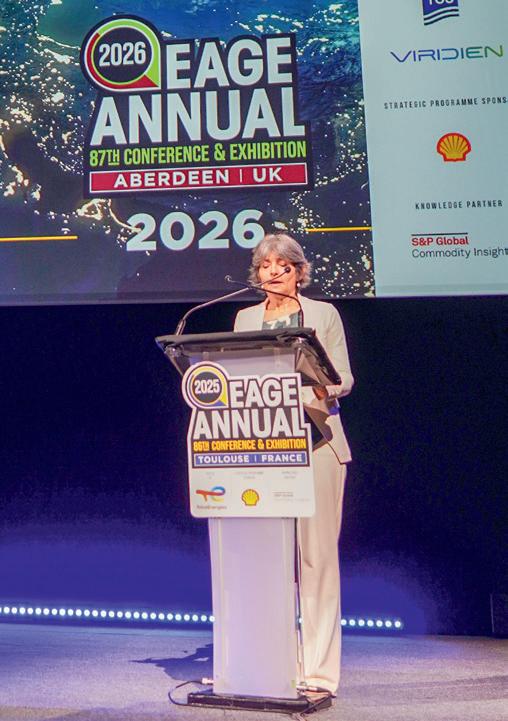
EAGE 2025 reaffirmed that geosciences are not on the sidelines of the energy transition, they are at its core. Now, the countdown begins for the 87th EAGE Annual Conference & Exhibition, taking place on 8-11 June 2026 in Aberdeen. We’re thrilled to bring the event to Scotland for the first time, hosted by bp at the state-of-the-art P&J Live convention centre. With strong local enthusiasm and global anticipation, Aberdeen promises to be another milestone in our shared journey of shaping the future of energy through geoscience.
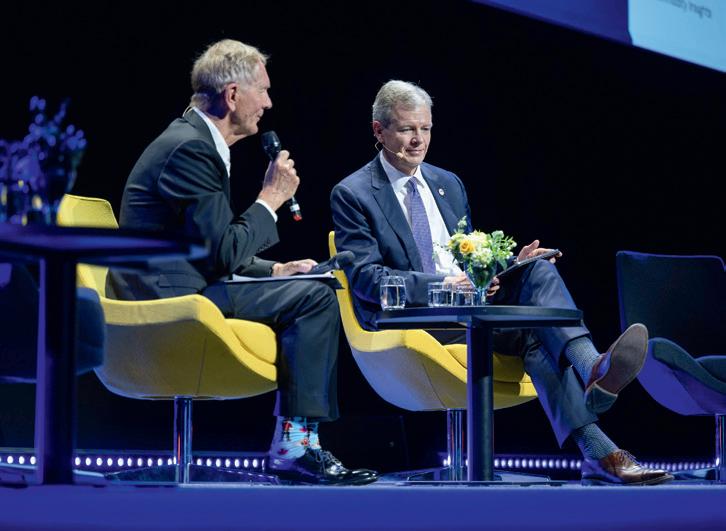
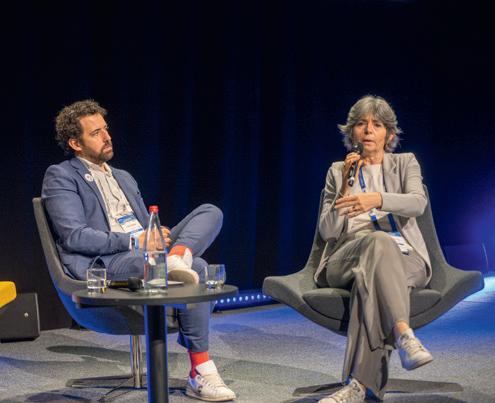
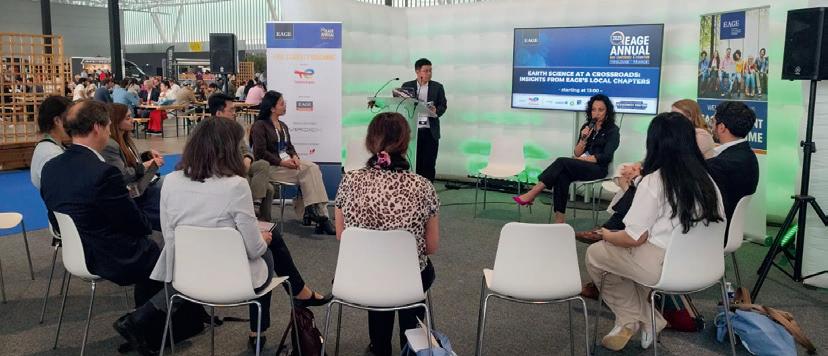
Discussing the bigger picture behind energy transition
Dynamic booths, interactive displays, and engaged attendees
Thanks for Joining Us
Your presence made the event special!
Scan the QR code for the event report
Acknowledging outstanding contributions in our community
Learning from experts, gaining practical knowledge
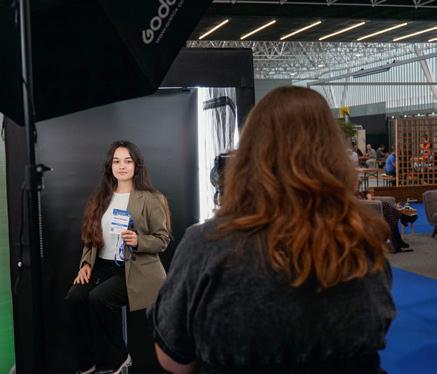
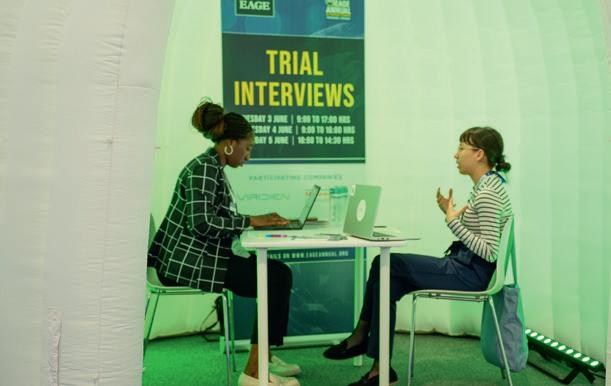
Helping professionals take their next step
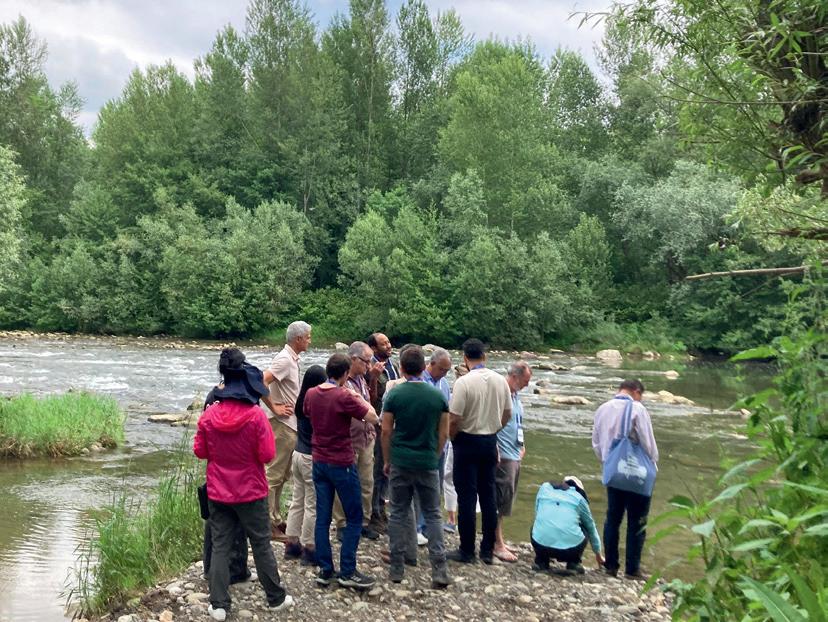
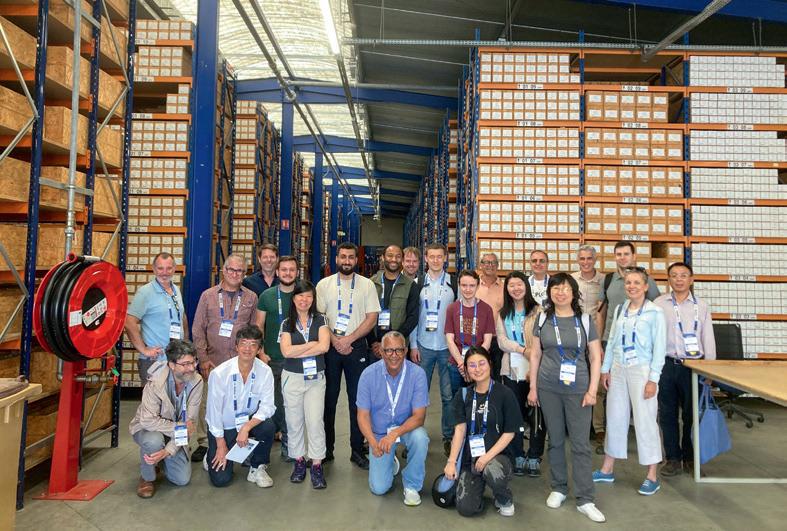
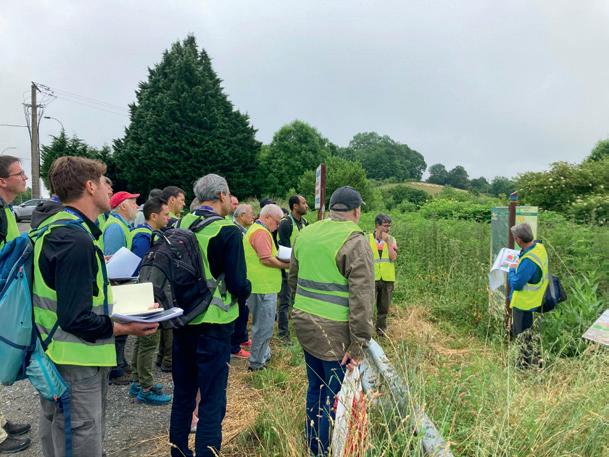
Exploring geology in the region first-hand
A night to remember in the heart of southern France
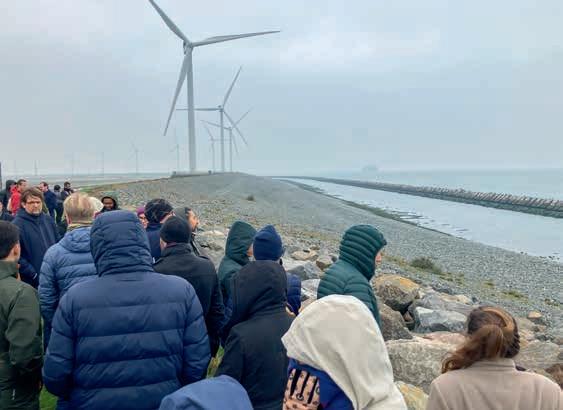
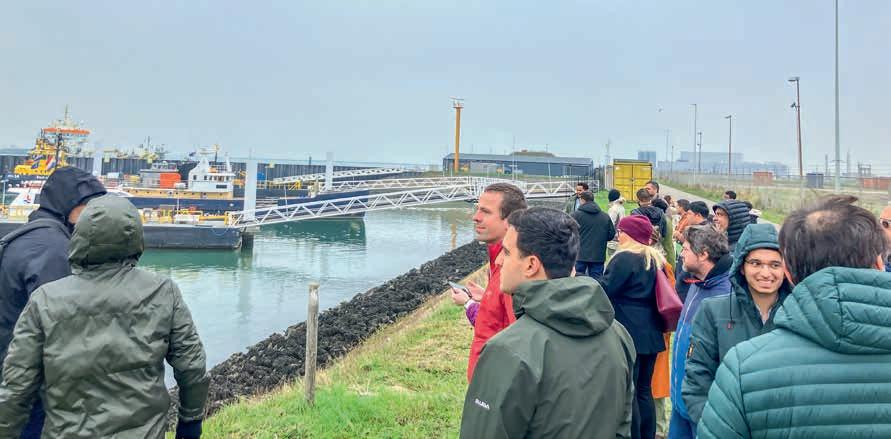
An exciting series of technical field trips providing a rare opportunity to witness energy transition projects up close will be available to participants at the upcoming 6th Global Energy Transition Conference & Exhibition (GET 2025) in Rotterdam on 27-31 October 2025.
From the innovative CCS infrastructure in the Port of Rotterdam to the geothermal-powered greenhouses of Westland, these excursions are designed to complement the conference’s rich technical programme with practical, real-world insights.
in Transit: Capturing, transporting & storing CO2 beneath the North Sea
This visit to the Portland Visitor Centre in Maasvlakte explores the Porthos project, a first-of-its-kind carbon capture and storage (CCS) initiative in the European Union. The project collects CO2 from multiple industrial emitters in the Port of Rotterdam and transports it via a shared pipeline to depleted gas fields more than 3 km below the North Sea. Experts from EBN and the Porthos team will guide participants through the collection, compression, transport, and storage process, as well as the legal and environmental frameworks governing such operations giving them an insight into one of Europe’s most ambitious decarbonisation infrastructures.
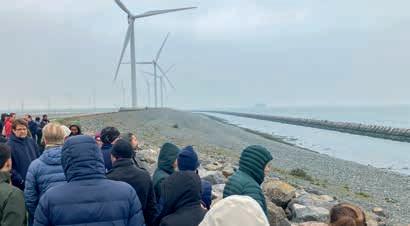
of Change: the North Sea as a future-proof energy and climate zone
A sweeping view of the North Sea’s transition from fossil fuel frontier to a
These field trips are immersive experiences that provide crucial context to the discussions taking place at GET 2025. Whether you’re a geoscientist, policy maker, engineer, or investor, each excursion is designed to enhance your understanding of how theory meets practice in the evolving energy landscape. Spaces are limited, and pre-registration is required, so secure your spot early to make the most of your GET 2025 experience. For more details and booking, visit: eageget.org.
multi-faceted energy and climate zone is offered including topics such as offshore wind deployment, hydrogen production at sea, infrastructure reuse, and marine biodiversity initiatives. Coastal observation points will highlight cable landings and offshore facilities, showcasing how energy transport, system integration, and ecological adaptation are converging in this vital region. Participants should walk away with a deeper understanding of the North Sea’s role in Europe’s sustainable energy future.
Heat Below, Harvest Above: Geothermal energy and sustainable horticulture in Westland
In the agricultural powerhouse of Westland, attendees can visit advanced greenhouses that utilise geothermal heat for sustainable food production. The excursion includes a tour of operations like Ammerlaan The Green Innovator where geothermal energy and captured CO2 are used to grow crops with a lower environmental footprint. The trip highlights circular economy approaches linking energy, food, and climate.
Sinking Grounds, Rising Questions: Subsidence in Gouda’s historic cityscape
A walking tour through the city of Gouda draws attention to the effects of subsidence in urban settings. From water management and peatland subsidence to mining-related ground movements, the trip explores the scientific and historical dimensions of a city shaped by a sinking landscape. A special visit to the iconic Grote or Sint-Janskerk will add cultural context to this geoscientific exploration, a blend of geology with urban planning, sustainability, and heritage preservation.
Journey through the Anthropocene: Site visits to the Sand Motor and River De Rogge
The excursion explores two unique Dutch landscapes shaped by both human intervention and natural forces. The Sand Motor, a large-scale coastal protection experiment, and River De Rogge illustrate how dynamic, nature-based solutions are being designed to manage water, erosion and climate resilience. Attendees will see first-hand how the Anthropocene is being studied and engineered in the Netherlands.
Every month we highlight some of the key upcoming conferences, workshops, etc. in the EAGE’s calendar of events. We cover separately our four flagship events – the EAGE Annual, Digitalization, Near Surface Geoscience (NSG), and Global Energy Transition (GET).
32nd International Meeting on Organic Geochemistry (IMOG) 7-11 September 2025 – Porto, Portugal
IMOG, the largest conference on organic geochemistry, brings together leading experts to explore organic matter cycles across geological and modern time scales. The event highlights integrated paleoenvironmental and climatic studies, advancing our understanding of Earth’s past and present systems focusing on the tools and insights needed to enhance the entire life cycle of energy activities. With 300+ poster and 80+ oral presentations, IMOG 2025 continues to serve as a key platform for driving progress in geochemistry and sustainable energy development through multi-disciplinary research and shared global expertise.
Discounted registration fee available until 10 August 2025
EAGE Workshop on Enhancing Subsurface Practices using AI/ML
10-11 November 2025 – Perth, Australia
This two-day event aims to converge experts from academia, industry, and research institutions to explore and share knowledge on the transformative potential of AI and ML in revolutionising subsurface workflows. Applications of AI/ML across various domains to be discussed include seismic processing and interpretation, reservoir characterisation, well log analysis, and production optimisation with emphasis on how these technologies can improve accuracy, efficiency, and decision-making in the energy sector and beyond. Discussions will also address challenges, best practices, and future directions in deploying AI/ML solutions for subsurface applications.
Abstract submission deadline: 17 August 2025
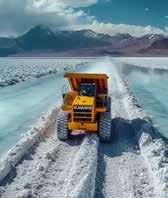
1st EAGE Conference on the Future of Mineral Exploration: Challenges and Opportunities
14-16 October 2025 – Santiago de Chile, Chile
Dedicated to addressing the critical role of mineral exploration in meeting the growing global demand for strategic resources, the conference focuses on innovative technologies, sustainable practices, and collaborative solutions to unlock mineral potential while minimising environmental and social impacts. From advanced geophysical techniques to sustainable water management in salt flats, the conference will highlight trends and challenges shaping the future of the industry. It also aims to promote inter-disciplinary collaboration, encouraging partnerships that will shape the future of the sector.
Abstract submission deadline: 1 August 2025
Fifth EAGE Eastern Mediterranean Workshop 1-3 December 2025 – Cairo, Egypt
The Eastern Mediterranean presents promising exploration opportunities, particularly below the Messinian salt layer. As focus shifts to low-carbon solutions, the region is well-positioned to support global energy security and sustainable growth through diversified, forward-looking energy strategies. The 5th EAGE Eastern Mediterranean Workshop will cover recent exploration successes, deepwater challenges, and the use of advanced technologies associated with seismic imaging and AI. It is also set to examine licensing, infrastructure, and regulatory frameworks, conscious of the evolving role of hydrocarbons in the energy transition. Key topics include carbon capture, synthetic fuels, and energy storage.
Abstract submission deadline: 1 September 2025
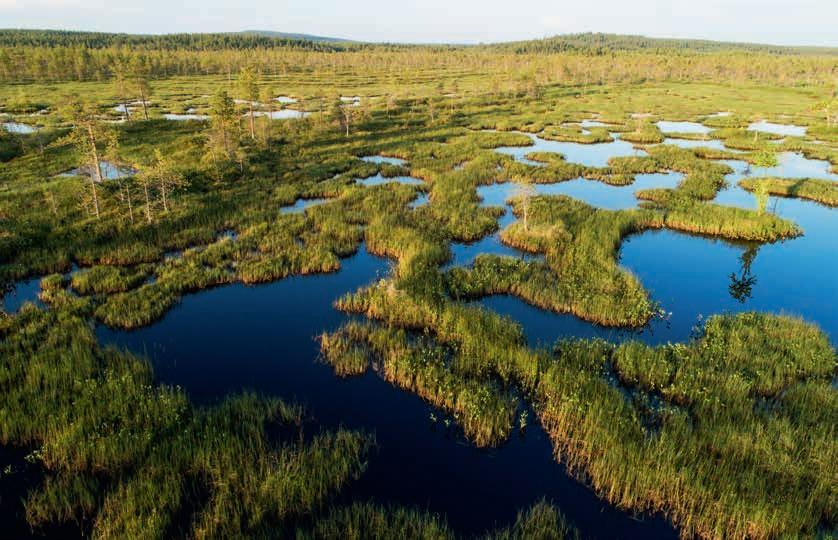
Dr Lee Slater from Rutgers University Newark (New Jersey, USA) was recently on hand to present his talk Looking into the hydrology and carbon cycling of Northern Peatlands via geophysics to Local Chapter Czech Republic in collaboration with the Faculty of Science of Charles University (Prague). The event provided a valuable trailer for the upcoming NSG 2025 conference and exhibition in Naples on 7-11 September.
Dr Slater’s presentation offered a deep dive into the critical role of peatlands in global ecosystems and how geophysical research is advancing our understanding of these environments. Peatlands are wetland ecosystems
characterised by the accumulation of organic material – mainly plant matter – that builds up over thousands of years under waterlogged conditions. Despite covering only 3% of the Earth’s land surface, peatlands store nearly twice as much carbon as all the world’s forests combined. As such these ecosystems, primarily found in northern regions such as Canada, Russia, and Scandinavia, play a crucial role in carbon sequestration and climate regulation.
Near-surface geophysical techniques have significantly advanced the understanding of critical zone structures and the processes influencing boreal peatland systems, according to Dr Slater. His research highlights
how the subsurface mineral sediment architecture plays a crucial role in controlling hydrology and carbon cycling in these ecosystems. He also discussed how geophysical imaging can be used to observe free-phase methane gas dynamics within peatlands. This approach offers valuable insights into how methane is produced, stored and released, helping to improve our understanding of peatland ecosystems and their role in the global carbon cycle.
Finally, Dr Slater presented findings from his ongoing studies that combine geophysical methods with temperature sensing. This work provides novel insights into how subsurface piping systems might regulate peatland hydrology by channelling mineralised groundwater influencing both water flow and nutrient distribution.
The discussion was particularly relevant in view of NSG 2025 as the conference offers extensive opportunities to explore water-related geophysical applications. Register today at www. eagensg.org and explore more topics such as Geophysical surveys of the cryosphere and Arctic, Groundwater exploration and hydrogeophysics, Geophysical investigations in soils and agriculture and much more under the umbrella of the 31st Meeting of Environmental and Engineering Geophysics.
LC Czech Republic recently hosted Dr Lucie Janků of the Czech Geological Survey in a presentation of the Synergys project.
The hybrid meeting started with learning about the meaning of synergy, the interaction or cooperation of two or more organisations, substances or other agents to produce a combined effect greater than the sum of their separate parts. In the case of the Synergys project, it is the use of deep and shallow geothermal in conjunction with solar energy and green hydrogen as a system integrator to increase the share of these sources in the production and storage of thermal and electrical energy. Synergy is often referred to as the inequality formula ‘1+1>2’.
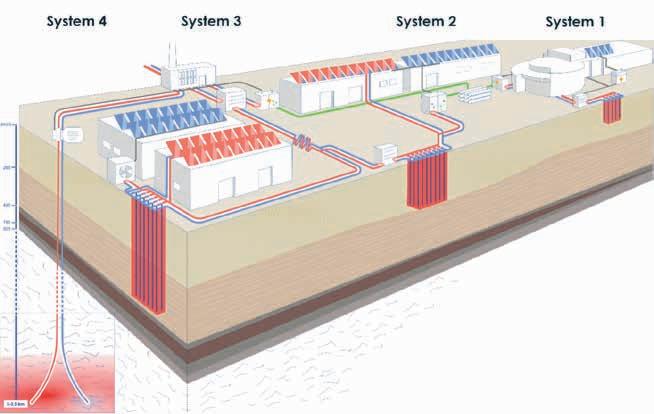
SYNERGYS concept. System 1 – Green Building provides heating and cooling to the RINGEN research centre. System 2 – Green Hydrogen stores excess heat from the electrolyser powered by photovoltaics. System 3 – Shallow Green Heat accummulates seasonal heat from photothermal panels. System 4 – Deep Green Heat harnesses heat from a deep geothermal reservoir. Systems 2, 3 and 4 aim to supply heat to the town‘s district heating network in the future.
Dr Janků explained that the project has been running since 1 January 2023 at the RINGEN research centre in Litoměřice. A subsidy of CZK 1,208.7 million, 95% of the total cost, has
been granted under the Just Transition 2021-2027 operational programme co-financed by the European Union. Main beneficiary is Charles University Faculty of Science with five partners – Czech Geological Survey, the Czech Technical University in Prague, the Geophysical Institute of the Czech Academy of Sciences, the City of Litoměřice and the Jan Evangelista Purkyně University in Ústí nad Labem (see also https://rin-gen.cz/en/aktualne/funding-approval-synergys-geothermal-project).
The project aims to develop three shallow borehole fields at depths of 100, 200 and 500 m to store seasonal heat from the RINGEN building and energy generated by solar panels. Additionally, a 3 km deep well is planned to supplement the system with heat from a deep geothermal reservoir. The well is probably going to be stimulated to increase permeability as the target formation´s natural permeability will likely be below economic use. The challenges addressed in the chosen area represent both low permeability in the crystalline basement and drilling complications in the sedimentary sequence due to the presence of unconsolidated sandstones and weak mudstones. To quote Dr Janků, ‘if the geothermal energy can be used in Litoměřice, it can be used in many other similar unfavourable sites’.
Recently, several 2D seismic profiles across Litoměřice region have been acquired and initial images were shown and discussed. They were targeting fault system imaging in both shallow sedimentary basins and deeper basement. The current images in sediments seem to outline the known faults well and the deeper parts of the image are still being improved. The next stage is developing shallow borehole fields and starting to test the operations and technical challenges associated with drilling these fields. The 3 km deep geothermal well will be drilled in 2026. The project is part of the wider EU effort and knowledge transfer will be an essential part of the work in progress.
The 55th Meeting of Young Geoscientists organised by the Association of Hungarian Geophysicists and the Hungarian Geological Society took place in March in the spa town of Hévíz, providing a competitive environment for the 28 oral and 10 poster presentations that made up the event.
Supported by 16 institutions and companies with valuable special awards,
young professionals, doctoral candidates and university students under 35 years of age could present their latest theoretical and practical research results. Several foreign doctoral students studying at Hungarian universities also presented their research results at the event.
A six member jury awarded prizes to the presentations in theoretical, practical and poster categories.
The untimely death of Jean-Jacques Biteau, at the age of 70, weeks before the EAGE Annual in Toulouse has dealt a devastating loss to his family, friends and colleagues and to the Association which benefited from his dedicated service, remarkable for passionate and inspiring advocacy of both geology and multi-disciplinary geoscience always with kindness and irresistable humour.
His lasting impact on the Association was commemorated in a short presentation to Marie Pierre Biteau, his wife of 37 years, at the Opening Ceremony in Toulouse.
From 2017, Biteau served a total of four years on the Board, including two as president, an achievement matched by only one other president in EAGE’s history. He was a committed member of numerous committees
and a familiar face on the Technical Programme Committee. He tirelessly travelled the world on behalf of the Association. Leveraging his geological background, he also acted as a strong bridge-builder between EAGE and AAPG, fostering international collaboration and shared scientific excellence.
A particular highlight of his contribution to EAGE was being instrumental in securing a record number of geology papers, no fewer than 19 sessions in total, for the Technical Programme at the 2019 Annual Conference in Paris.
Valentina Socco, EAGE president 2024-25, said: ‘Jean-Jaques always impressed for his ability to combine a crystal-clear vision with a humble, open-minded attitude. He always looked at problems from a compre-
hensive perspective, giving them a meaning that extended beyond the mere technical aspects. This made him a truly inspiring figure, who tirelessly made himself available to younger generations and colleagues. He was one of those rare individuals who work daily to improve themselves and, in doing so, improve the environment around them and positively impact the lives of others.’
Biteau was born in 1955 in Vendée, where he spent much of his youth, completing his studies at the Lycée Clemenceau in Nantes. A graduate of the École Nationale Supérieure de Géologie (ENSG) de Nancy in 1977, Jean-Jacques devoted his career to studying the structure and content of sedimentary basins, becoming an internationally recognised expert in oil exploration. One of Jean-Jacques’s defining characteristics was his exceptional capacity for work, organisation, and speed.
Hired by Société Nationale Elf Aquitaine Production, he worked in several subsidiaries around the world, notably in The Netherlands, Cameroon, France, and Angola, before joining Total’s Paris headquarters (now TotalEnergies) in 2000 during the merger of ELF and Total.
Jean-Jacques published numerous articles and books, including a notable volume on petroleum geology co-authored with François Baudin. He was also preparing a memoir for the Geological Society of France tracing 100 years of oil exploration in France highlighting the importance of the accumulated data and knowledge for future potential uses of the subsurface such as hydrogen exploration, underground storage, access to drinking water, and geothermal energy. In later years he was an active member of the ENSG of Nancy alumni association and its president from 2016-19.
EAGE extends its sincere condolences to Biteau’s wife, three sons and their families.
Conference co-chair Tao Yang, chief professional and senior specialist at Equinor, discusses the significance of the inaugural World CCUS Conference (www.ccus.org) being held in Bergen, Norway on 1-4 September.
What inspired the launch of this conference?
While there are many CCUS conferences globally, most tend to focus on a single discipline or are led by one main organisation. Across different engineering communities, there was a strong sense that we needed a truly cross-disciplinary, cross-organisational event, one that really highlights the engineering challenges and innovations.
How does the programme reflect the status of CCUS today and emerging solutions?
We’re seeing an exciting wave of large, real-world CCUS projects taking off around the world, and that momentum is very much reflected in our technical programme, keynote talks, and panel discussions. I’m particularly excited about
sessions on emerging areas like bioenergy with carbon capture and storage (BECCS) and early experiments in subsurface CO2 conversion and utilisation. These are frontier topics that could open entirely new pathways for CCUS.
How can this conference engage the next generation of CCUS professionals?
We’ve made it a priority to create a welcoming and inspiring space for young professionals. Beyond the plenary sessions and technical talks, we have a dedicated Young Professionals (YP) programme and contest designed to highlight emerging talent. The conference will offer opportunities for deep learning and networking across different areas of CCUS, helping to broaden horizons and energise the next generation.
Are there unique aspects of the conferencee that will set it apart?
Absolutely. The Bergen location alone offers an exceptional experience. Beyond the beautiful surroundings, we have easy access to key CCUS field sites. Attendees can visit the Northern Lights CO2 transport and storage project, the Mongstad CO2 capture test centre, and see live demonstrations like the FluidFlower experiment. These site visits will give par-
ticipants direct exposure to cutting-edge work in the field, something you don’t often get at other conferences.
What legacy do you hope this inaugural conference will leave, for the community and the future of CCUS?
Our goal is to build a new platform for cross-industry and cross-organisation collaboration. By bringing together academia, industry, and policymakers in a balanced way, we aim to create a different kind of event, one that goes beyond the traditional government- or industry-driven conferences. We hope it will set a new standard for collaboration and knowledge-sharing in the CCUS community for years to come.
Eleven new courses have been introduced to the EAGE Education Catalogue in the first semester of 2025. The additions highlight the Association’s commitment to providing multi-disciplinary, forward-looking training opportunities led by top-tier instructors to meet the demands of the energy transition, digital innovation, and sustainable resource management.
The courses will be featured at key events including the EAGE Annual Conference & Exhibition, GET, and the EAGE Masterclass on Geothermal Energy, while also being available through interactive online formats and as in-house training courses for companies looking to upskill their teams.
Among the new offerings is Introduction to Python for Geoscientists by Claude Cavelius, an ideal entry point for professionals seeking to build digital fluency. Cavelius will also teach A Dive in AI & Machine Learning for Geoscientist, which guides participants through the core applications of AI across geoscientific datasets, demystifying machine learning and placing it in the context of real-world use cases.
The increasing relevance of hydrogen as a clean energy vector is addressed in Underground Hydrogen Storage in Rocks by Kamaljit Singh. To be held at GET 2025, the course investigates subsurface hydrogen behaviour at pore-to-core scale and explores advanced imaging and modelling techniques to improve prediction and storage performance.
At the intersection of innovation and practice, Sebastien Soulas will lead two new impactful courses. VSP Technology – From Check Shot to Advanced Distributed Acoustic Sensing walks participants through the evolution of VSP, now revolutionised by DAS systems, while Borehole Seismic Monitoring for Sustainable Energy Solutions adopts a wide-lens view of how borehole seismic data can be integrated into new energy projects. Soulas comments: ‘I believe that a holistic approach to understand value and limitations of borehole seismic data and its complex integration with surface seismic for new energies geophysical monitoring and reservoir characterisation is paramount. Experienced and young professionals from geologists, geophysicists, geoscientists to reservoir engineers could benefit from joining these courses.’
Another highlight is Ian Jones’ much-anticipated course on state-of-the-art full waveform inversion (FWI), which many seized the chance to attend during the EAGE Annual in Toulouse. With decades of experience in velocity model building, Jones offers a comprehensive understanding of the various FWI implementations, shedding light on the motivation, limitations, and future possibilities. Jones says: ‘I saw a need to focus on these many variants of FWI, outlining the motivation for the development of each method, its limitation, and potential benefits.’
The catalogue also expands into stratigraphy and structural analysis with courses such as Clastic Sequence Stratigraphy: Concepts, Methods and Workflows by Rene Jonk and Structural Geology Must Knows by Pascal D. Richard who also leads Integrated Fracture Characterisation and Fracture Modelling This latter provides a unified approach to understanding fractures across scales, ideal for those working in exploration or reservoir development.
Subsurface system modelling is further supported with Practical Basin Modelling, Petroleum System Analysis and Geochemistry by Naidu Bodapati, and Geothermal Energy Systems and their Role in the Energy Transition, led by Andrea Moscariello, which addresses a key pillar of sustainable energy solutions. The course will be part of the EAGE Masterclass on Geothermal Energy in November in Paris and GET 2025 in Rotterdam, The Netherlands.
Finally, reflecting the changing energy landscape, Shaji Mathew brings a new course to GET 2025 – Seismic Data Processing for Offshore Wind Farm Development. The course addresses the growing need for high-resolution seismic data in wind energy infrastructure development, guiding participants from legacy data reuse to state-of-the-art acquisition and processing techniques.
With more than 100 short courses now available across classroom, online, and in-house formats, EAGE’s training programme continues to grow to offer more depth and diversity for members’ continuous professional development.
EAGE members can benefit from special discounted rates for both online and in-person course registrations. Whether you’re looking to explore AI, support the energy transition, or refine your seismic expertise, these expertly developed courses offer practical tools to help you thrive in your geoscience career.
The EAGE Student Fund supports student activities that help students bridge the gap between university and professional environments. This is only possible with the support from the EAGE community. If you want to support the next generation of geoscientists and engineers, go to donate.eagestudentfund.org or simply scan the QR code. Many thanks for your donation in advance!
Canadian geoscientist Peter Duncan is best known as the founder of Microseismic, which brought an entirely new technology to market principally for shale oil and gas production. His career has also included many other achievements and innovative entrepreneurial ventures. A former president of SEG, he continues to be active inspiring a new generation of industry professionals, plus regular outings playing guitar at the Annual meeting.
Growing up in New Brunswick, Canada, I had really inspiring teachers and parents who encouraged curiosity and learning. My dad and I did physics experiments in the kitchen and constantly fiddled to keep the household gadgets working. My high school teachers steered me toward public speaking and debating. Those skills played a major role in my career.
University
I registered in geology to get a great paying summer job. That first summer hunting copper in Newfoundland I was introduced to geophysics, induced polarisation. Back at University of New Brunswick I switched majors to physics. The department designed a customised course that let me do geology and math for a hybrid geophysics degree. I continued with field summer jobs, including underground geology in Sudbury. Grad school at University of Toronto came next. It was a phenomenal learning opportunity.
I always imagined that I would be a professor, but my industry experience led me to Shell in Calgary. My first project was a continuation of my doctoral research. After two years of running EM models on Cray #2 I jumped to manage a tin exploration project in Nova Scotia. Shell decided to sell the deposit and retooled me as a seismologist, the one geophysics discipline that I had never touched. I became party chief on Shell’s first marine 3D seismic survey, Glenelg, offshore Nova Scotia. I was drinking from a fire hose.
I found Shell oil and gas a bit big compared to the minerals group. I joined Pulsonic Geophysical in Calgary to manage processing the Glenelg 3D. I even kept my Shell office to co-ordinate with the exploration team. Two years on I headed to Houston with Digicon, Pulsonic’s parent. At the time more 3D was being shot in Canada than the US. My role was to reverse that for the benefit of Digicon’s business. I told my wife we would be in the US for three years. It’s been 39. Rudy Prince, Digicon’s founder was a visionary. He asked me to start a new enterprise for Digicon providing multi-disciplinary field studies. ExploiTech was born. We got noticed by Landmark Graphics who acquired us to be their wet lab. An industry slowdown in 1992 allowed us to do a leveraged buyout and hang out our shingle as a non–operating 3D exploration company, 3DX Technologies. Success led to an IPO. I was an oilman now. At least on paper. The crash of ’99 forced us to sell out at much less than the IPO price.
I moved back into technology, participating in a couple of tech startups and serving a term as president of SEG. My SEG colleagues were worried about my work situation until one day I announced I was starting a new company, MicroSeismic (MSI). When I explained this would be a passive seismic business there was a collective groan. One friend suggested to my wife that she find a job to prevent us from losing our house. Fortunately, my timing was almost perfect. Riding the shale gale, we rapidly grew to 250 employees.
Frac monitoring work slowed as engineers became confident in their completion recipes and the oil business became increasingly cost conscious. Covid struck. Bankruptcy loomed. I furloughed myself and all but five employees. We survived and rebuilt, finding other markets beyond fracking: mitigating sinkhole hazards, monitoring CO2 sequestration, and enhanced geothermal field development.
I am pleased that my wife did not have to get a job to save our house. I am proud of the resilience of MSI over the last 22 years. I am proud of how the team has pushed microseismic technology forward. I feel that I have realised most of my desire to be a prof by teaching dozens of young graduates who have passed through MSI, presenting hundreds of lectures at schools and hosting the SEG Student Challenge Bowl quiz.
Geoscience is about the thrill of discovery. Geophysicists revel in their ‘toys’ Ahead I see bigger and better computers doing ever more complex calculations on larger and denser datasets. Geophysicists will never stop opening windows into the earth while relishing the challenge. I wish I could start all over again.
My work is my leisure but when not living the MSI dream I enjoy playing tennis, one of my guitars or my Yamaha Grand. When I grow up, I want to be a rock star.
BY ANDREW M c BARNET
It is reassuring, almost quaint, that in the geoscience community a discussion on what consitutes ethical behaviour and practice can be referenced and indeed appears to be gaining increasing traction.
If only the powers behind the worsening theatres of turmoil in the world could come under such scrutiny. The always quotable polymath Albert Schweitzer wrote, ‘Ethics is nothing else than reverence for life.’ The conflicts we are witnessing clearly flout the value of human life, the essence of ethics, and raise many other questions such as the concept of a just war and the value of international conventions. Blended in the background are further disturbing trends such as the rise of authoritarianism, contradications of capitalism and the accumulation of wealth, energy poverty, societal polarisation, etc, etc.
Such disturbing issues present more than a moral maze, rather a moral morass. They are distinctive in being way beyond our power as individuals to affect change, yet are ever present in our daily discourse. It raises the question as to whether a decline in the ethics of ordinary community and business life is an inevitable corollary to the appalling events happening around the world and the motivations that drive them. The answer may not be what we think.
moral behaviour, e.g., volunteerism, levels of cooperation, helping strangers, etc. found no meaningful change over time. In as much as it could be measured, daily morality (involving friends, communities, etc.) was said to be stable, with less than 0.3% variation in responses. These results were reflected in many other countries. The authors also point to the obvious decline over centuries – hopefully not prematurely – in violence such as slavery, murder, rape, and massacres plus in many societies better treatment for those with disabilities and tolerance for different sexual orientations.
‘There’s a strange dichotomy between perception and real life’
By way of explanation the authors show how a simple mechanism is responsible for this strange dichotomy between perception and real life. It is based on two well-established psychological phenomena – biased exposure to negative information and biased memory for information. The negativity stems from the fact that we tend to pay more attention to bad news – ‘if it bleeds it leads’ – and hence gain an impression that the moral state of the world is low.
An article in Nature (7 June 2023) by Adam M. Mastroianni (Columbia University) and Daniel T. Gilbert (Harvard University) entitled The illusion of moral decline attracted a great deal of attention when they published their findings that more than 12 million people in at least 60 nations around the world interviewed between 1949 and 2021 believed that morality (as in kindness, honesty, ethical behaviour, civility, and decency) had been going downhill for at least 70 years. Yet they revealed that the reality was strikingly different. ‘People say it just gets worse and worse – that moral decline has been happening their whole lives and it’s still happening today’ is how Mastroianni has described the phenomenon noting that young and old perceived the same rate of decline.
Belief is the operative word here. The authors found that over 100 surveys between 1965 and 2020 asking 400 million Americans about
Mastroianni suggests that ‘If something good and something bad happen to you today, in five years’ time the bad thing will seem less negative and the good thing will not have lost its positive aspect … The first bias makes the present seem like a moral wasteland, the second makes the past seem like a fabulously moral universe.’
Rather scarily these American researchers conclude: ‘If low morality is a cause for concern, then declining morality may be a veritable call to arms, and leaders who promise to halt that illusory slide – to “make America great again”, as it were – may have out-sized appeal. Our studies indicate that the perception of moral decline is pervasive, perdurable, unfounded and easily produced. Achieving a better understanding of this phenomenon would seem a timely task.’
If we accept plausibility of the authors’ premise, then lessons to bear in mind would be separating reality from perception and establishing a baseline for judging any improvement (the possibility for which Mastroianni and Gilbert leaves open). Such learnings
may be more simply applied to a specific field of activity such as geoscientific endeavour compared with the complications of our everyday lives in general when even the choice of breakfast coffee can have ethical implications.
Historically religions have tended to provide the community with its moral compass, obviously not so universal these days given the need to recognise the authority of a deity of some kind. Many professional geoscience organisations do promote a ‘10 Commandments’ style guidance for their members, for example, the International Association for Promoting Geoethics (IAPG). Endorsed by numerous international societies, IAPG was established in 2012 during the 34th International Geological Congress (IGC) in Brisbane Australia. It aims to provide an important platform for geoscientists to share experiences, ideas, reflections and information on geoethical issues. The rationale is that geoscientists have specific knowledge and skills, which are required to investigate, manage and intervene in various components of the Earth system to support human life and well-being, to defend people against geohazards and to ensure natural resources are managed and used sustainably. It follows they should embrace ethical values in order best to serve the public good, IAPG argues.
from Western Europe. ‘Between 2010 and 2019, women accounted for 50% of the United States workforce, but only one third of geoscientists and environmental scientists (AGI, 2019). While there have been steady gains in the number of women earning PhDs in the geosciences, reaching 45%, women are still only 27% of geoscience faculty. The percentage of women in faculty positions decreases with rank, and there is a higher rate of attrition for women than men from geoscience faculty positions (Ranganathan et al., 2021).
Unsurprisingly most literature on issues of race in the geosciences is based on the US experience. An indictment tempered with some positive solutions can be found in an Americal Geophysical Union article Combating Racism in the Geosciences: Reflections from a Black Professor in which Prof Vernon R. Morris, a professor of chemistry and environmental sciences at Arizona University and self-styled ‘advocate for STEM equality’, decries institutional racism based on his career experience and calls for geosciences to be diverse, equitable, and inclusive.
‘Disconnnect between everyday geoscience life and the global ethical issues in the resources field’
In 2016, the Association published its Capetown Statement on Geothics available in 38 languages, the product of an international effort to focus the attention of geoscientists on the ‘development of shared policies, guidelines, strategies and tools, with the long-range goal of fostering the adoption of ethical practices in the geoscience community’.
The Hippocratic-like nine vows (the Geoethical Promise) for adoption by early career geoscientists proposed by IAGC to promote respect for geoethics values in geoscience research and practice may be asking too much, but it does demonstrate a seriousness of purpose. With the same motivation of promoting awareness among engineering students, Prof Raffaella Ocone, current president of the UK Institute of Chemical Engineering (recently featured in our First Break Personal Record series), has been advocating the need for increased teaching of ethics in the academic engineering curriculum to supplement the profession’s established code of practice.
Putting aside our biased beliefs and assessing the reality, we may ask whether setting ethical standards for the profession has any measurable effect? Anecdotally we may feel that progress is being made regarding workplace issues such as racial discrimination and gender bias. On the latter, more women seem to be coming into the geoscience profession but, as EAGE’s Women in Geoscience Special Interest Group regularly attests, there are plenty of gender-related challenges and certainly a lack of women in senior management and leadership roles, pace Irene Basili and Sofia Zurquiya, CEOs of Shearwater Geoservices and Viridien respectively.
A position statement by the Geological Society of America paints the actual picture in the US reporting a trend not that different
In an unusually candid posting, the US Geological Survey (USGS) last year posted an article on its participation in a virtual 16-week virtual programme initiative Unlearning Racism in the Geosciences (URGE) programme, established in 2021 by a group of young professionals to counteract racism supported by the National Science Foundation, Woods Hole Oceanographic Institution, and Scripps Institution of Oceanography at UC San Diego. USGS was prompted by its struggle to diversify the geoscience workforce.
What such initiatives do not address is the disconnnect between such community action and everyday geoscience life and the global ethical issues in the resources field of oil and gas and mining for which geoscientists can be held accountable but can do little to influence. This is where we came in. The common strategy advice to cope with the kind of overwhelming news we are currently experiencing is to limit news consumption, practice self-care, and focus on what we can control, also perhaps acknowledge our feelings, seek support from loved ones, and engage in activities that bring us joy.
Such counsel may be a little touchy-feely not to mention impractical for geoscientists in a corporate environment. Many are engaged (without meaningful control) in energy industries widely held to be unethical in both their disregard of climate change and some of their industrial practices, yet oil and gas exploitation can legitimately be interpreted as providing the ‘greatest good for the greatest number’, the creed of Utilitarianism (Bentham). If philosophy is to help provide peace of mind, then we should sample the smorgasbord of ethical approaches making sure to include essentials such as deontology (Kant), virtue ethics (Aristotle) and natural law (Aquinas). Unfortunately every ethic is open to critique, so developing your own personal philosophy is really the only answer, the cue for a multitude of self-help books.
Views expressed in Crosstalk are solely those of the author, who can be contacted at andrew@andrewmcbarnet.com.
Just 29% of the Earth’s surface is covered by land, we cover the rest. We explore and analyse what’s beneath the seabed. This provides the knowledge needed to make informed decisions for responsible use of the Earth’s resources.
We’re explorers at heart.
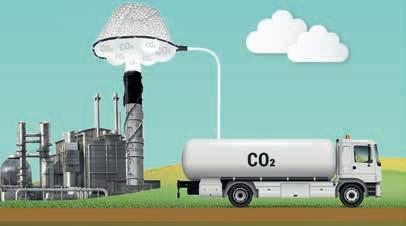
Global investment in carbon capture and storage (CCS) is expected to reach $80 billion over the next five years, according to DNV’s Energy Transition Outlook: CCS to 2050 report.
DNV forecasts that capture and storage capacity is expected to quadruple by 2030 owing to a sharp increase in capacity in the project pipeline. The immediate rise in capacity is being driven by short-term scale-up in North America and Europe, with natural gas processing still the main application for the technology.
‘In the longer term, CCS is crucial for addressing sectors that are challenging to decarbonise, such as steel and cement production,’ said DNV. ‘These hard-to-decarbonise industries are forecast to be the main driver of growth from
2030 onwards, accounting for 41% of annual CO2 captured by mid-century. Maritime onboard capture is expected to scale from the 2040s in parts of the global shipping fleet.’
As the technologies mature and scale, the average costs will drop by an average of 40% by 2050, said the report.
CCS will grow from 41 MtCO2/yr captured and stored today to 1300 MtCO2/ yr in 2050, which will be 6% of global emissions. However, CCS will need to scale to six times this level to reach the amount outlined in DNV’s Pathway to Net Zero Emission report.
Ditlev Engel, CEO, Energy Systems at DNV said: ‘For all this advancement, the trajectory of CCS deployment remains a long way off where it must be
to deliver net zero by 2050. Economic headwinds in recent years have put pressure on this capital-intensive technology and corrective action will need to be taken by government and industry if we are to close the gap between ambition and reality.’
DNV forecasts that carbon dioxide removal (CDR) will capture 330 MtCO2 in 2050 – one-quarter of total captured emissions. Bioenergy with CCS (BECCS) is generally the cheaper CDR option and will be used primarily in renewable biomass for power and manufacturing.
Direct air capture (DAC) costs on the other hand remain high at around $350/ tCO2 through to 2050, but voluntary and compliance carbon markets still ensure the capture of 32 MtCO2 in 2040 and 84 MtCO2 in 2050.
Jamie Burrows, global segment lead CCUS, energy systems at DNV, said: ‘CCS is entering a pivotal decade and the scale of ambition and investment must increase dramatically. It remains essential for hard-to-decarbonise sectors like cement, steel, chemicals, and maritime transport. But as DNV’s report shows, delays in reducing carbon dioxide emissions will place an even greater burden on carbon dioxide removal technologies. To stay within climate targets, we must accelerate the deployment of all carbon management solutions, from industrial capture to nature-based removal.’
Viridien has made a first quarter net loss of $28 million on IFRS revenues of $258 million, compared to a net loss of $3 million on IFRS revenues of of $249 million in Q1 2024.
Segment operating income was $65 million on revenues of $301 million compared to $28 million on revenues of $273 million in Q1 2024.
Sophie Zurquiyah, chief executive officer, Viridien, said: ‘The first quarter of 2025 was marked by two significant milestones for the group. The end of the vessel capacity agreement opens a new chapter of enhanced flexibility in our cost base and stronger cash generation, while our bond refinancing reflects the financial market’s confidence in the execution of our strategy and our long-term potential.
‘In parallel, our financial results for the first quarter of 2025 confirm the robust performance of our business, with commercial wins, solid profitability, and cash generation fully aligned with our long-term ambitions.
‘Assuming moderate fluctuations in the oil market, we expect to achieve our target of approximately $100 million in net cash
flow generation for the year and to continue our deleveraging journey.’
Digital, Data and Energy Transition (DDE) revenue was $214 million, up 16% with growth in Geoscience (+25%) and Earth Data (+7%). Geoscience revenue was $110 million (+25%), driven by adoption of Elastic FWI technologies worldwide.
Earth Data revenue of $104 million was up 7% with Viridien active on multiple reprocessing projects worldwide.
Sensing and Monitoring (SMO) revenue of $87 million is 2% down, although the company reported ‘sustained activities in Land with strong momentum on nodal systems’.
New infrastructure monitoring contracts were signed in North America. Viridien is pursuing several geotechnical monitoring opportunities in rail and mining sectors worldwide, it added.
During the quarter Viridien refinanced its April 2027 $447 million and €578 million notes, replaced with $450 million (10% interest) and €475 million (8.5% interest) senior secured notes, which are due October 2030.
Net debt is at $974 million and liquidity at $257 million.
TGS is partnering with Oseberg to bring its lease data attributes into TGS’ Well Data Analytics (WDA) platform for enhanced analysis WDA users can seamlessly access lease ownership data
ownership and leasehold constraints, said TGS. Key use cases include merger and acquisition analysis, project site planning, investment evaluation, and resource inventory management.
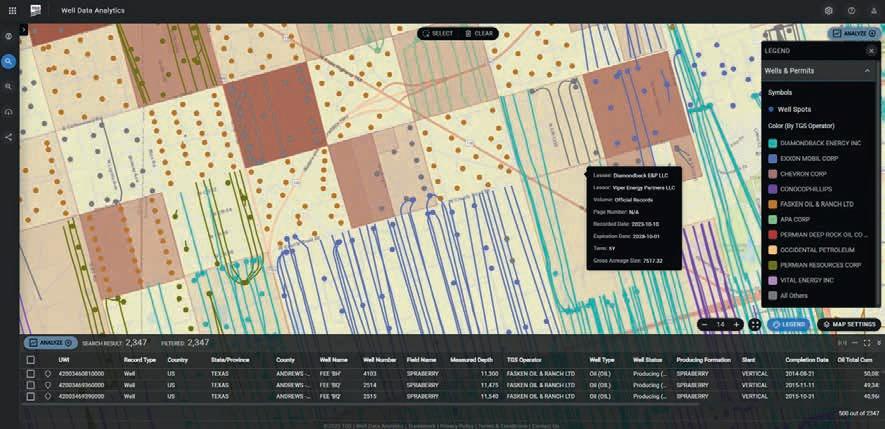
for Texas, New Mexico, and Oklahoma, as well as other subsurface well data. This combined offering enables E&P companies to plan wells more efficiently, reduce legal and operational risks, and optimise development strategies by aligning drilling programs with land
Carl Neuhaus, vice-president of Well Data Products at TGS, said: ‘Our partnership with Oseberg creates a full-service subsurface data offering combining the highest quality lease data with the most comprehensive geological and well database. Integrating Oseberg lease
ownership data empowers our users to verify land ownership in minutes and use TGS data to quantify resource deliverability, improve development planning accuracy, and quickly identify the most valuable opportunities. As always, these workflows are developed with customers to ensure seamless integration and hassle-free displacement of existing solutions.’
Evan Anderson, CEO/CO-Founder of Oseberg, added: ‘For our lease ownership data, we’ve chosen to focus on structuring the unstructured filings that underpin everything from the right to drill to the creation of proration units at the tract and formation level.
‘In a world where public data can obscure critical details like elevations, depths, perforations, producing formations, and drill stem tests, TGS’ unparalleled subsurface and well log library unlocks a level of understanding that few others can match. Together, we’re harmonising two bedrock layers of the upstream story, and we’re excited about what that enables for the market.’
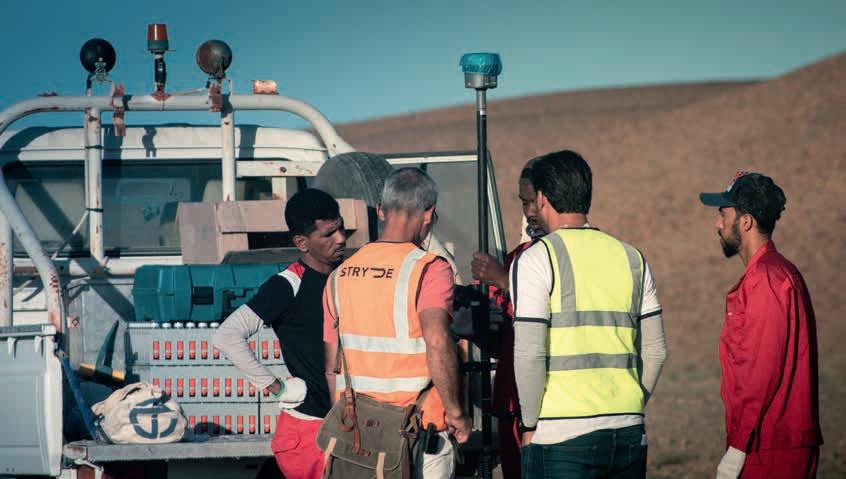
Getech and STRYDE have launched a geoscience screening solution to evaluate, and model resource potential.
The service has an end-to-end subsurface screening and targeting capability that enables companies to conduct early screening and identification of high value leads and prospects, to optimise new seismic survey design, and to reduce unnecessary seismic acquisition costs by focusing only where it matters most, said Getech.
The new service empowers companies to identify the most prospective zones using Getech’s global gravity and magnetic datasets and reduce geological risk through early-stage basin and play-scale analysis, leveraging Getech’s ‘Globe’ knowledge database. It will avoid unnecessary seismic acquisition in low-potential areas by quickly screening them out, optimise survey planning by identifying where to acquire seismic and how to design it for maximum data quality, enable faster, more informed decision-making and reduce uncertainty and guide drilling and investment action through reliable and validated geoscience intelligence.
‘The market has long lacked a streamlined, data-driven service that connects early lead identification to the delivery of direct targets,’ said Max Brouwers, chief business development officer at Getech. ‘Our partnership with STRYDE combines Getech’s expertise in basin evaluation and geoscience intelligence with STRYDE’s specialism in
nodal seismic acquisition for high-resolution subsurface imaging.’
At a recent regional and multiphase client project in the Middle East, Getech began by analysing gravity and magnetic data to map subsurface density and susceptibility contrasts. These datasets are particularly well-suited for identifying localised geological features such as positive structures, sub-basins, and depocentres, said Getech.
This analysis provided insight into the depth and extent of the petroleum system and helped to pinpoint areas with the highest prospectivity. Results included enhanced gravity and magnetic maps, a structural interpretation, reinterpretation of legacy seismic data, detailed lead descriptions, and a comprehensive lead summary map. Based on these findings, a targeted 3D seismic acquisition campaign was recommended in high-value zones. STRYDE then designed and planned the seismic programme to ensure an efficient acquisition process focused precisely where new data will deliver the greatest impact for decision-making.
Cam Grant, chief commercial officer at STRYDE, said: ‘There is limited internal expertise in the regional exploration challenges and a lack of insight into where to focus exploration efforts for the most ROI. Many operators rely on large, sparse surveys when they could achieve better results with targeted, high-density 3D seismic, once leads and targets are more clearly defined through existing data and analysis.’
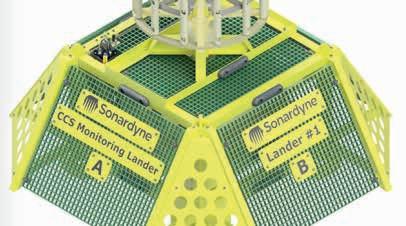
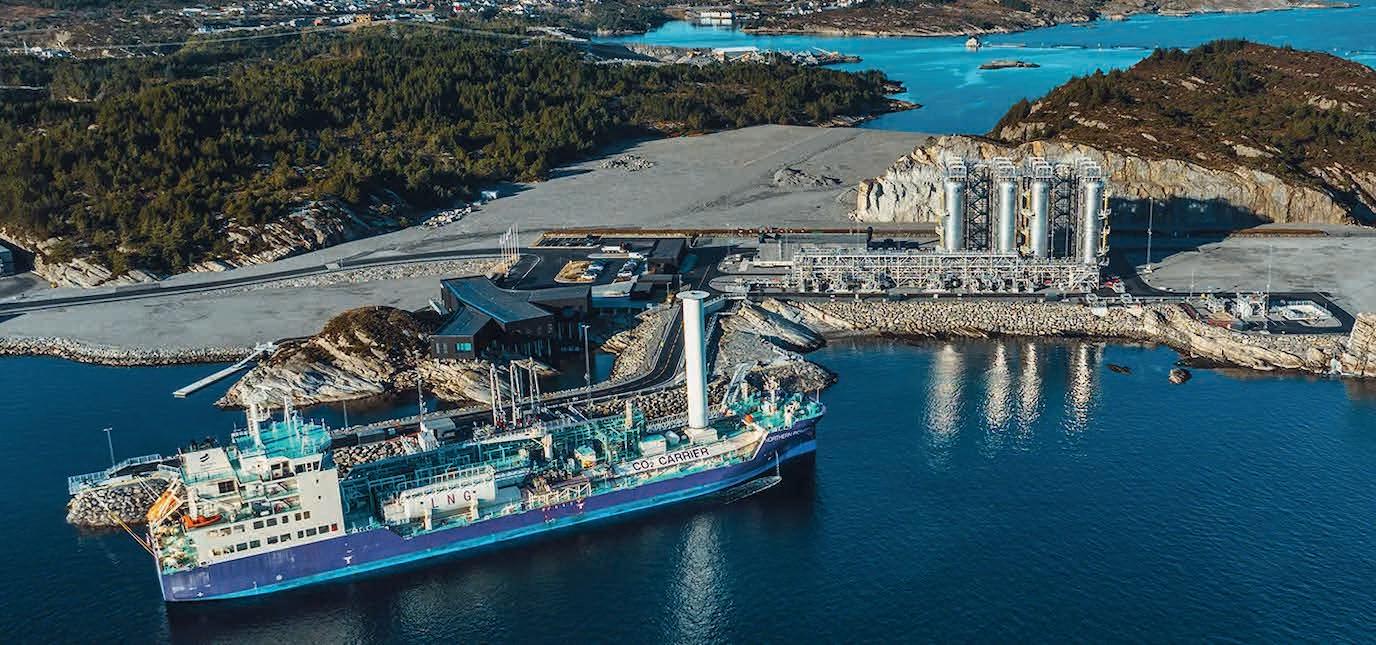
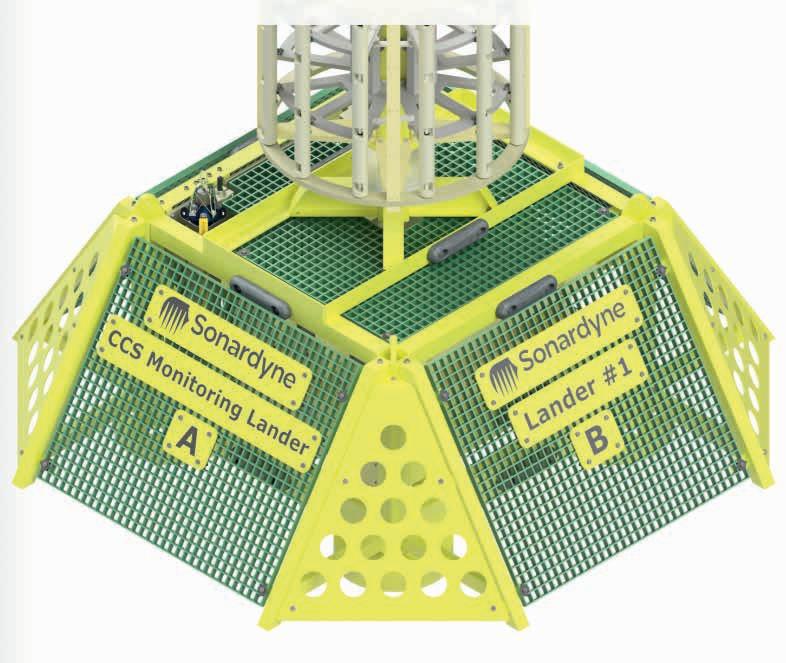
Sonardyne has been selected by the Northern Endurance Partnership to deliver baseline environmental monitoring services for the UK’s first offshore carbon capture and storage site under the North Sea. The company will deploy seabed landers at key locations above and around the subsurface Endurance site – the saline aquifer is located 145 km off the coast of Teesside where captured CO2 will be stored.
Monitoring will begin in the summer of 2026 to provide baseline data for two years before the transportation and storage of captured CO2 commences. Seabed landers will be equipped with Edge data processing application, power management and acoustic through-water communications. Each lander will also contain a suite of hardware including Origin 600 ADCP, Wavefront’s passive sonar array and multiple third-party sensors. ‘Together, this technology can detect small changes in water chemistry across a wide area, while the data can be harvested, without retrieving the lander, using wireless subsea acoustic communication techniques,’ said Sonardyne.
The Northern Endurance Partnership (NEP), is a joint venture between bp, Equinor, and TotalEnergies.
TGS has launched a geophysical survey for the Green Volt floating wind farm off the east coast of Scotland.
The work is scheduled throughout June will include an ultra-high-resolution 3D (UHR3D) seismic survey to deliver detailed subsurface data for the floating windfarm’s site characterisation.
The Green Volt project, 80 km off the east coast of Scotland, is a joint venture between Flotation Energy and Vårgrønn. As Europe’s first commercial-scale floating windfarm at 560 MW, the project is a catalyst for developing a highly specialised UK floating wind supply chain.
Utilising integrated Multibeam Echo Sounder, Side Scan Sonar, Sub-bottom Profiler and Magnetometer sensors, the advanced survey will enhance geological understanding and provide critical insights for the project’s site planning and risk assessments.
UHR3D data will provide detailed understanding of the subsurface conditions, revealing potential risks and challenges that are not always accurately captured through traditional 2D data interpolation, said TGS. The enhanced data collection will help the Green Volt project team to identify geological hazards and structural complexities, contributing to improved site assessment and risk mitigation strategies.
The SCAN geothermal research program in the Netherlands is continuing to acquire and reprocess seismic data, as well as advance its research drilling phase.
Funded by the Dutch Ministry of Climate and Green Growth and carried out by EBN in collaboration with TNO, SCAN aims to accelerate the implementation of geothermal energy by collecting data from lesser-known areas of the Dutch subsurface. In addition to the 2D seismic surveys, reprocessing and research wells, SCAN is also preparing a large-scale 3D seismic survey in the Metropolitan Region Amsterdam, set to begin in the autumn of 2025.
SCAN recently finished its sixth research well in the Eindhoven area where operations started in April on the Stad van Gerwen-01 research well. It focused on the almost 2 km-thick Cenozoic infill of the Roer Valley Graben. SCAN had moved operations here after the research well Ede-01 where the main target of the Slochteren formation was found to be 60-m thick and permeable. They were part of four research wells that were drilled in sequence, starting in November 2024 with the Heesch-01 well. At 2525-m deep this well targeted and cored the Triassic Main Buntsandstein Subgroup and Triassic Nederweert Sandstone Formation. The 2123m-deep De Bilt01 research well collected data and cores from three targets, the main target being the Permian Rotliegend Slochteren formation.
The SCAN team started the drilling campaign late 2023 in Ouder-Amstel with the the 2227m-deep Amstelland-01 well that showed the presence of a good Rotliegend reservoir of more than 100-m thickness. The 844-m deep Oranjeoord-01 well in Heijningen focused on the shallower Cenozoic deposits. The Brussels Sand Member, the main target investigat-
ed here, showed good permeability and an average temperature of around 31°C. In the summer of 2025, drilling operations will continue in Amsterdam with the Strandeiland research well. It will target the Permian Rotliegend Slochteren Formation. SCAN has also completed 2D seismic surveys in the Deurne and Kempen region to prepare for possible research wells in these areas.
The team is also gearing up for a large-scale 3D seismic survey in the Metropolitan Region Amsterdam. This survey will be the first in a series of additional 2D and 3D surveys intended to reduce geological uncertainty in areas that are promising for geothermal potential, but where the current subsurface data is too sparse to accelerate and optimise the development of safe geothermal projects. The large-scale 3D seismic survey in the Amsterdam area will be the first 3D seismic survey in the SCAN program. The final outlines are currently being determined together with the seismic contractor, Smart Seismic Solutions (S3).
‘We are working meticulously to prepare the 3D seismic survey in the Metropolitan Region Amsterdam, which will be the first 3D seismic survey in an urban area in the Netherlands since 2001,’ said Johannes Rehling, senior geophysicist SCAN.
The SCAN team has also been studying existing core material from wells drilled in the central and western parts of the Netherlands between 1950 and 2012. The goal of this study is to gain a more complete understanding of the depositional environment, diagenesis and aquifer quality of the Permian Rotliegend Slochteren Formation. Core study reports for 34 wells as well as an overview report are now available. All data that SCAN collects are made available at nlog.nl.
Shearwater GeoServices has reported first quarter net profit of $9 million on revenues of $189.4 million, compared to a net loss of $37 million on revenues of $123.4 million in Q1 2024.
Operating profit was $24 million, compared to an operating loss of $18 million in Q4 2024.
Cashflow from operations was $64 million compared to minus $18 million in Q1 2024. Backlog was $400 million compared to $469 million in Q1 2024.
Results were boosted by record-high 94% utilisation for the active fleet of nine vessels and a three-year global capacity reservation agreement with TotalEnergies. The company was awarded a major ExxonMobil OBN survey in Guyana.
Irene Basili, CEO of Shearwater, said: ‘We delivered strong operational
and financial results for the first quarter of 2025 with record-high 94% fleet utilisation and good cash generation. This reflects higher activity coming into 2025 as expected and diligent execution of Shearwater’s operational model with continuous matching of active vessels to the underlying market conditions.
‘The marine seismic market is expected to follow the same trend line as the past three years. However, the visibility for the coming quarters remains low due to fewer contracts awarded for the mid-year period and we will align active vessels with demand. Oil and gas companies’ investment budgets continue to reflect geopolitical uncertainty and market volatility, while capital discipline remains in focus. In response to the prevailing market dynamics, we are proactively assessing costs and investment levels to optimise cash flow. Considering the market outlook for the mid-year and due to higher working capital requirements resulting from back-end loaded payment terms with several clients, we have proactively initiated dialogue with key stakeholders to ensure balance sheet resilience.
‘The oil and gas exploration and production industry will need to invest more in marine seismic data acquisition, processing and imaging to rebuild reserves, maintain production and ensure energy security. In light of this, despite current short-term volatility, the tender pipeline is encouraging and is expected to support continued sustainable margins.’
Viridien has won a contract from a Sonatrach and PTTEP joint venture to reimage two legacy 3D seismic data sets totalling 2400 km2 in the Hassi Bir Rekaiz concession in the Berkine Basin, Eastern Algeria.
During the 13-month project Viridien scientists are completely reimaging and merging the two legacy seismic datasets, originally acquired in 2011 and 2013.
‘To meet the client’s challenging imaging objectives, Viridien is applying the latest technology to deliver more detailed seismic velocity modeling and improved reliability of seismic amplitude, phase and frequency attributes for quantitative interpretation and enhanced fault imaging,’ said Viridien in a statement.
The US Department of Interior is rescinding a rule put in place last year that added new restrictions on oil and gas development in the National Petroleum Reserve in Alaska. The 2024 rule created a presumption against oil and gas activity in approximately 13 million acres unless operators could prove minimal or no adverse effects on surface resources.
TotalEnergies and Mistral AI are collaborating on artificial intelligence innovation, especially in low-carbon energies. At a joint innovation lab, the companies will test and design advanced digital solutions. The aim is for TotalEnergies to design an assistant for its 1000 researchers and develop decision support solutions to enhance the performance of its industrial assets and lower its C02 emissions.
The Norwegian Offshore Directorate is launching an interactive map, Deep Sea Surveys, providing an overview of mapping and sampling carried out in on the Norwegian Continental Shelf. The data is published under the Norwegian Licence for Open Government Data.
Dave Hager has been appointed as a non-executive director at bp. Hager was executive chairman of Devon Energy between 2021 and 2023, president and CEO between 2015-2021. He spent ten years at Kerr McGee, including as chief operating officer and senior vice president exploration and production. He joined the industry in 1979 as a geophysicist. Hager is currently a non-executive director of MRC Global Inc.
Norwegian oil and gas company DNO has completed the acquisition of Sval Energi from HitecVision for a cash consideration of $450 million based on an enterprise value of $1.6 billion. The acquired portfolio comprises 16 producing fields in Norway, quadrupling DNO’s North Sea production to 80,000 boepd. The company’s North Sea proven and probable (2P) reserves increase to 189 MMboe, also a fourfold increase. Contingent resources (2C) total 316 MMboe.
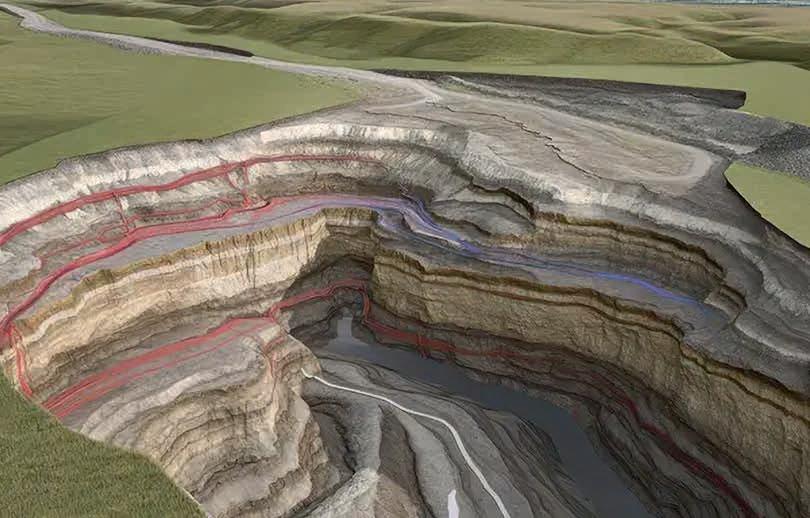
An independent geoscience evaluation offshore Namibia, has upgraded resources for Geo Exploration.
The company said that the study has ‘greatly enhanced’ understanding of the potential in the eastern portion of Licence PEL94 (Block 2011A) and identified two
new sandstone leads: Emerald (in the Albian) and Beryl (in the Cenomanian).
The evaluation concludes that Emerald and Beryl together contain 792 MMbbl of unrisked gross mean prospective resources, with 726 MMbbl attributable to Emerald and 66 MMbbl to Beryl.
These upgraded numbers lift the licence-wide unrisked gross mean prospective resources on PEL 94 to approximately 4.31 billion barrels, representing a 23% increase over the 3.52 billion barrels announced on 27 March 2023.
Seismic mapping has delineated robust, dip and fault-bounded structural closures. The seismic data interpretation has also highlighted direct hydrocarbon indicators in the area — including gas chimneys and flat spots — providing strong evidence for
an active petroleum system, migration of hydrocarbons throughout the section and therefore increasing the chance that the leads are charged with oil.
The 5798 km² licence area sits within the Walvis Basin ‘sweet-spot’, an area benefiting from improved charge maturity modelling, while recent world-class discoveries in the Orange Basin to the south (Venus, Mopane, Capricornus) highlight the prolific nature of Namibia’s Atlantic margin.
Omar Ahmad, chief executive officer of GEO Exploration, said: ‘The resource upgrade underscores the tremendous potential we see in PEL 94. With excitement building across Namibia, and particularly in the Walvis Basin, we are actively progressing farm-out discussions.’
The discovered volume from high impact exploration wells drilled in 2020-2024 fell by 62% compared to 2010-2014, according to research by Westwood.
Success rates from high impact exploration wells have improved, but since 2015 the exploration industry has roughly halved the number of high impact exploration wells being drilled, it added.
The contribution to replacement of global hydrocarbon production from conventional high impact exploration fell from 33% to only 11%.
Westwood said that high-impact exploration drilling has been remarkably stable in the last five years, averaging 77 wells per year and varying by less than 15% each year from 2020 to 2024 despite volatility in commodity prices with companies exercising capital discipline in the face of uncertainty in the long scale demand outlook. Seventy five high-impact exploration wells were completed in 2024, delivering 19 potentially commercial discoveries totalling 5.2 bn boe at a 25% commercial success rate. Key discoveries in 2024 were made in Kuwait, Russia, Cote d’Ivoire and Namibia.
The company landscape has been transformed since 2015 with half the number of companies drilling high-impact wells. National Oil Companies accounted for 51% of high impact well equity and 67% of the discovered resource in 2024. The
supermajors, however, had a difficult year, only delivering a 5% net commercial success rate with only one clear commercial success out of the 29 high impact wells that the five companies participated in.
High-impact exploration drilling has moved into ever deeper water, with 9% of wells drilled in >2500m water depth in 2020-24 compared to 6% in 2010-14. Results have been disappointing, however, with commercial success rates in ultra-deepwater >2500m falling from ~20% in 2010-14 to only 3% in 2020-24, with only a single success from 35 wells drilled in the period. ‘A rethink may be needed to address possible systemic flaws in the play concepts that were tested,’ said Westwood.
The industry delivered a 27% commercial success rate in 2020-2024, significantly higher than the 21% achieved in the 2010-2014 period despite exploration drilling declining by 49%.
This suggests that the increase in efficiency is due to only the best prospects being selected for drilling. The average discovery size, however, fell from 545mmboe to 320mmboe with fewer >1bnboe scale discoveries.
‘High-impact exploration drilling will remain stable in 2025 with ~75 wells expected to complete. ‘To turn around the decline in the volumes being discovered, success is needed in new basins and plays that will require creative thinking, use of new technologies and a continued appetite for risk,’ said Westwood.
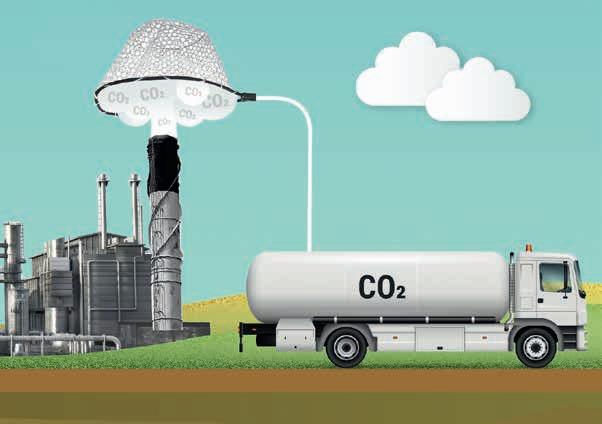
The Danish Energy Agency has selected 10 companies from a pool of 16 applicants to compete for $4.5 billion in funding for carbon capture and storage projects. The funding is expected to help reduce Denmark’s annual CO2 emissions by 2.3 million tonnes from 2030.
The companies are: Affaidplus; ARGO CCS; E.ON; Energist CaptureCo; Fjernvarme Fyn Fangst; Gaia ProjectCo; HOFOR DSS SPV; Kredsløb Holding; Ørsted Bioenergy & Thermal Power; and Aalborg Portland.
Funding will be paid out per tonne of CO2 captured and stored. To be included in Denmark’s climate targets, the CO2 must be captured within the country. The CO2 can be geologically stored either in Denmark or abroad.
In the next phase, the prequalified companies can submit detailed project descriptions and bids. The deadline for submission of initial offers is 26 August 2025. This will be followed by a negotiation phase between the Danish Energy Agency and the bidders. Deadline for final and binding offers is 17 December 2025. Contract awards are planned for April 2026.
DUG has appointed Dr Fabio Mancini as regional chief geophysicist.
Over his 20-plus year career he has worked at Hess Corporation and TotalEnergies, and was the chief geophysicist at Woodside Energy and Blue Ocean Seismic Services.
He has had roles in research and development as well as seismic processing, imaging and acquisition operations for land and marine projects, said DUG.
Dr Mancini said: ‘I have long been an advocate of full waveform inversion. I am very excited to work with DUG to drive a new era of advanced geophysical solutions.’
DUG’s managing director, Matt Lamont, said: ‘Fabio’s exceptional technical expertise and leadership, along with his extensive industry network, will be invaluable as we continue to expand and promote our capabilities across APAC and the Americas. Fabio has always had a focus on the development and implementation of new technologies. He is the perfect addition to our technical team as we
continue to deliver our MP-FWI imaging solutions.’
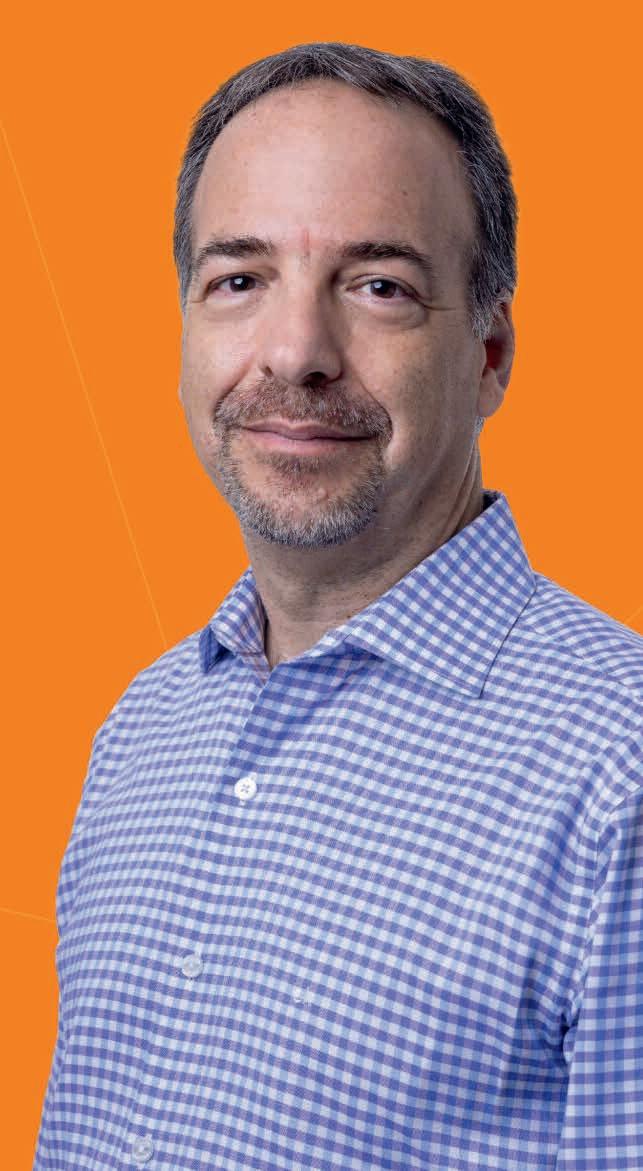
SSE has welcomed the decision by The Crown Estate to proceed with its Capacity Increase Programme to maximise existing offshore wind lease areas in the UK. The decision allows for potential capacity increases at seven fixed-bottom offshore windfarms. These include two SSE joint-venture offshore wind projects being developed off the east coast of England – unlocking up to 2GW at Dogger Bank D (SSE 50%, Equinor 50%) and an extra 900MW at North Falls (SSE 50%, RWE 50%).
Norway has launched a competition for three floating offshore wind projects at Utsira Nord. Each project area may have an installed capacity of up to 500 MW of floating offshore wind. One applicant will be awarded state aid, and the winner will be the bidder with the lowest support requirement. Application deadline is 15 September.
MODEC and Carbon Clean Solutions have sign an MOU to develop FPSO-based offshore post-combustion carbon capture technologies. The agreement seeks to accelerate the deployment of Carbon Clean’s On-Board Carbon Capture Solution (OCCS) for Floating Production Storage and Offloading (FPSO) facilities based on MODEC’s FPSO design.
Harbour Energy has confirmed a reservoir that is suitable for injection and storage of carbon dioxide. Well 0/6-1 was drilled in the North Sea around 30 km southeast of the Yme platform. The objective of well 9/6-1 was to investigate whether Middle Jurassic and Middle and Upper Triassic reservoir rocks in the Havstjerne project are suitable for CO2 storage. Well 9/6-1 encountered 115 m of homogeneous shale in the Tau Formation; the Egersund Formation encountered 58 m of sealing shale and dense siltstone; the Sandnes Formation encountered 97 m of sandstone of good reservoir quality; the Bryne Formation encountered 52 m of sandstone of moderate reservoir quality’; the Skagerrak Formation reservoir encountered 200 m of sand and siltstone of very poor reservoir quality.
SeaBird Exploration has changed its name to SED Energy Holdings after the merger of SeaBird Exploration Plc and Energy Drilling Ltd.
‘The name Energy Holdings marks our transition to a diversified energy investment company,’ said CEO, Kurt M. Waldeland. ‘As part of this evolution, we are pleased that Finn Atle Hamre will continue as CEO of the SeaBird business unit. Finn Atle has played a key role in SeaBird’s transformation in recent years, and his continued leadership will ensure continuity as SeaBird operates under the new group structure.’
Energy Holdings’ primary focus is on distributing all excess liquidity to shareholders, while also pursuing disciplined, value-accretive growth. Its current portfolio includes wholly owned subsidiaries Energy Drilling, an owner and operator of tender-assisted drilling rigs, and SeaBird Exploration, a global provider of marine seismic acquisition data to the oil and gas industry.
Petronas Carigali is deploying Halliburton Landmark’s DecisionSpace 365 Geosciences Suite and Unified Ensemble Modeling solutions with the objective to unify exploration and development workflows and accelerate time to first oil.
Halliburton Landmark’s scalable earth modelling and ensemble workflows will enable Petronas Carigali exploration and asset teams to collaborate in real time using a unified live earth model, with the aim of achieving more accurate reserve estimations through ensemble modelling.
The Geosciences Suite’s scalable earth modelling maintains geological fidelity across all scales — from basinwide views to individual fields — to ensure consistent data and models flow from exploration to development, said Halliburton. This integrated workflow supports faster project maturation through the Front-End Loading process, it added. Using the Unified Ensemble Modelling solution, asset teams can
automate the generation of multiple probabilistic geological scenarios while integrating real-time reservoir flow data. This approach is designed to enhance forecast precision, accelerate scenario analysis, and improve confidence in decision-making.
‘A harmonised, AI-assisted workflow anchored on a single live-earth model across the exploration and development phases is central to our strategy in achieving our ambitious project delivery targets,’ said Hazli Sham Kassim, CEO of Petronas Carigali.
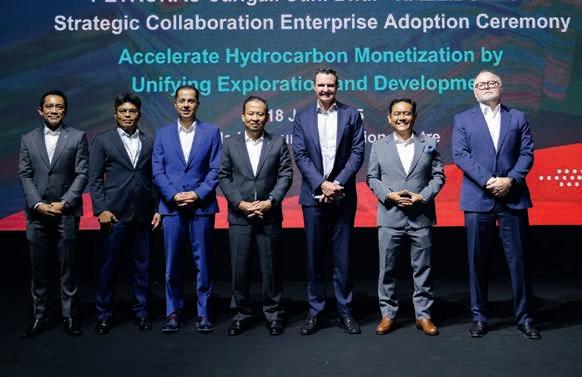
TGS and Viridien have launched the Laconia Phase III Ocean Bottom Node (OBN) survey in the Gulf of America. The latest phase of the program spans approx. 150 OCS blocks and follows the Laconia Phases I and II launched by Viridien in July 2024. The program will be acquired by TGS and provide Ultra Long Offset OBN data using TGS’ ZXPLR nodes and the Sercel Tuned Pulse Source (TPS). TPS is a low-frequency broadband marine seismic source that enhances geophysical imaging clarity by improving low-frequency, deep penetrating sound energy. The Laconia Phase III dataset, imaged by Viridien, will improve subsurface clarity, aiming to unlock further potential in the central Keathley Canyon area. The acreage is anticipated to be highly sought after in future lease sales for those companies targeting the Paleogene play, which is increasingly attractive following recent success in industry implementation of 20k technologies, said TGS and Viridien in a joint statement. The survey will also leverage Viridien’s advanced proprietary Elastic Full-Waveform Inversion (E-FWI) and Reverse Time Migration (RTM) imaging technologies.
Laconia Phase III OBN acquisition started in May and will continue through Q3 2025 with delivery of initial products scheduled for Q1 2026.
Kristian Johansen, CEO of TGS said of the contract that reflects TGS’ continuing focus on OBN: ‘Laconia Phase III represents another significant step forward in our ability to deliver advanced data products in one of the world’s most important offshore regions. Through cooperation with Viridien and the combination of our leading edge OBN acquisition and imaging technologies, we are confident this project will provide tremendous value to our customers.’
Sophie Zurquiyah, CEO of Viridien said: ‘By teaming up with TGS on Laconia Phase III, we are leveraging our respective strengths to deliver a high-impact dataset in one of the world’s most prospective offshore regions. The early-out results from Laconia Phase I have already attracted considerable industry attention, highlighting the effectiveness of our advanced imaging capabilities.’
DNV has launched a service specification for the verification and certification of carbon capture, utilisation, and storage (CCUS) facilities. DNV-SE-0696 provides a structured methodology to derisk CCUS projects across design, construction, and operation, said DNV.
With CCS projected to grow from 41 MtCO2/yr today to 1300 MtCO2/yr in 2050, mitigating 6% of global CO2 emissions according to DNV’s Energy Transition Outlook: CCS to 2050 report, SE-0696 will define risk-based verification levels (High/Medium/Low) for CCUS subsystems, from CO2 capture to temporary storage.
DNV-SE-0696 will align with existing DNV documents (e.g. DNV-SE-0479 for process facilities) while addressing CCUS-specific challenges such as material selection and CO2 liquefaction. It will support both onshore and offshore applications, including hybrid projects (e.g., blue hydrogen with CCUS).
Lucy Craig, senior vice-president, growth, innovation and digitalization, energy systems at DNV said: ‘SE-0696 gives developers a clear roadmap to verify facility integrity, reducing uncertainties that could delay final investment decisions.’
The specification covers all major CCUS subsystems, including CO2 capture and dehydration systems; compression and liquefaction units; emergency shutdown and relief systems; safety assessments and barriers; material selection and injection facilities.
DNV-SE-0696 complements DNV’s broader CCUS standards (e.g., DNV-SE-0473 for geological storage) and integrates with DNV’s risk-based verification philosophy (DNV-SE-0474).
Jamie Burrows, global segment lead CCUS, energy systems at DNV, said: ‘By applying our decades of process facility expertise and deep knowledge of CCUS, we’re helping clients mitigate risks whether retrofitting capture equipment at a cement plant or designing a new offshore injection facility.’
Ephesia Consult and Geomex Software
Solutions have launched the Apollo plugin Numerical Stress Modelling Suite on the SLB Ocean Store.
Developed to meet the increasing demands of high-resolution geomechanical simulations, Apollo Fault and Fracture Gridding Advanced meshes capabilities for complex geological structures, ensuring accurate stress distribution and orientation analysis. Boundary Conditions Modelling Flexible definition of stress,
strain, and displacement boundaries enable precise and realistic subsurface simulations, said the partners. High-resolution 4D Stress Simulation Time-dependent modelling will capture dynamic changes and evolve subsurface risks across the project lifecycle, they added.
Stress simulation and visualisation is fully integrated with Petrel, enabling seamless geomechanical workflows — including coupled stress, flow, and temperature modelling. Scalability and
Efficiency Optimised for large datasets and high-resolution models, delivered high-performance simulations across diverse geological environments.
‘With Apollo, geoscientists and engineers gain a powerful tool for enhancing geomechanical insights across a range of applications, including carbon capture and storage, geothermal development, subsurface storage well trajectory planning and reservoir integrity assessments,’ said the partners.
Shearwater Geoservices has won a contract from Equinor to perform a 4D towed-streamer seismic survey over the Tyrihans field in Norway in the Norwegian Sea. It is the first project awarded under the 2021 Equinor frame agreement, following a recent extension for an additional two years.
As part of the one-month survey starting in early August, Shearwater will deploy the vessel Amazon Conqueror , using Isometrix technology. The
survey follows previous 4D campaigns for Equinor, most recently at the Mariner and Heidrun fields in 2024.
Applying the same proven technology to capture repeat high-quality seismic data over the Tyrihans area will improve understanding of changes to the reservoir over time in the producing field and support future production strategies to optimise output, said Shearwater.
TGS has completed the Amendment Phase 4 ultra-long offset ocean bottom node (OBN) survey in the Gulf of America.
The project covers 49 outer continental shelf (OCS) blocks across the Mississippi Canyon and Ewing Bank protraction areas, delivering seismic data
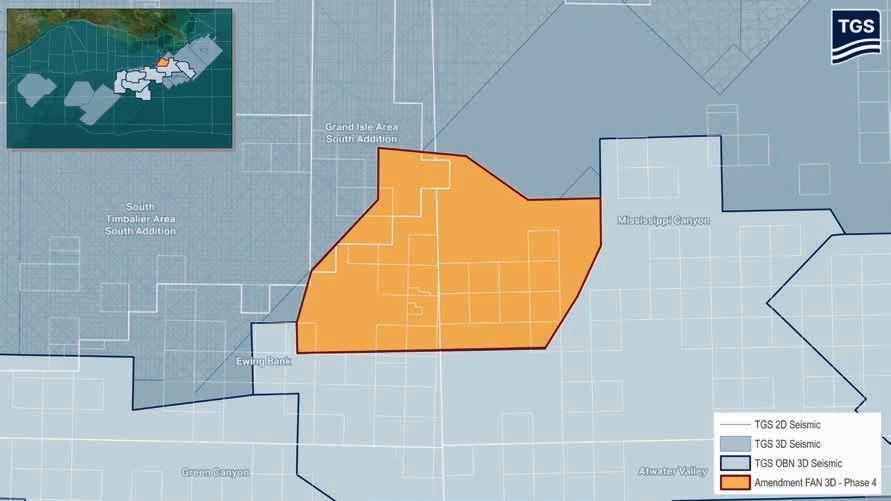
Aker BP has discovered oil in the E prospect near the Skarv field. The discovery in the Garn Formation is estimated to 3-7 million barrels of recoverable o.e. A minor discovery was also made in the Early Cretaceous estimated to 1-2 million barrels of recoverable o.e. The objective of well 6507/5-13 S was to prove petroleum in reservoir rocks in the Fangst and Båt groups. The well encountered a 14-oil column in the Garn Formation in 43 m of sandstone with moderate reservoir quality. Well 6507/5-13 S encountered hydrocarbons from the Early Cretaceous (Apt/Alba) in multiple sandstone layers. Wildcat well 6507/5-13 S was drilled to a measured depth of 4022 m and a vertical depth of 3998 m below sea level. The well was terminated in the Melke Formation.
OKEA has discovered oil along the eastern flank of the Brage field in the North Sea. The discovery was made in the southern part of the Prince prospect in wildcat well 31/4-A-23 G. The discovery is estimated to hold between 0.05 -0.44 million Sm3 of recoverable oil equivalent (o.e.), which corresponds to 0.3-2.8 million barrels.
The objective of A-23 F was to prove petroleum in Upper Jurassic reservoir rocks in the Sognefjord Formation. The objective of A-23 G was to delineate a potential discovery in A-23 F and to delineate the northern part of 31/4-A-13 E (Kim).
Well 31/4-A-23 F was drilled horizontally and encountered a sandstone layer in the Sognefjord Formation with a total measured thickness of 220 m along the wellbore and 12 m of vertical
to support exploration and development in one of the world’s most complex deepwater basins. ‘It also provides valuable insight for companies preparing for anticipated lease rounds as early as the second half of 2025,’ said TGS.
For the first time in the Gulf of America, TGS deployed its proprietary Gemini enhanced-frequency seismic source in an ultra-long offset acquisition setting. Gemini delivers a low-frequency, omnidirectional signal that, combined with advanced processing techniques, significantly improves illumination beneath complex salt bodies. The system offers an environmentally considerate approach to source design while advancing deep imaging capability.
thickness with good reservoir properties. The well was drilled to a measured depth of 6285 m and a vertical depth of 2153 m below sea level in the Sognefjord Formation, and was dry.
Well 31/4-A-23 G was drilled horizontally at a vertical depth of 2120-2171 m along the eastern flank of the Brage field. The well encountered a 3-4-m thick sandstone layer in the Sognefjord Formation, and the well was drilled to a total measured depth of 1138 m along this sandstone layer. The well proved a 20-m thick oil column in sandstones with moderate to good reservoir properties.
Perenco, operator of the Teak, Samaan and Poui (TSP) fields offshore Trinidad, has drilled the Onyx well and sidetrack in the eastern part of the Onyx field. The two legs encountered significant columns of natural gas in two separate geological compartments. The Onyx field is an undeveloped gas discovery within the TSP licence, in a water depth of 180 ft, between the Poui and Teak fields, off Trinidad’s south-east coast. TSP is a joint venture between Perenco, Heritage Petroleum Company Limited and The National Gas Company of Trinidad and Tobago Limited. Subsurface information is under review and development options will be evaluated to move the discovery towards final investment decision.
Sinopec has announced a shale gas exploration breakthrough at its Project Deep Earth – Sichuan and Chongqing Natural Gas Base. Its Tiebei 1HF well has been tested at a daily output of 314,500 m3 of industrial gas flow. The vertical depth of the well is more than 5300 m with a 1312m-long horizontal section, setting a new record for vertical depth of shale gas wells in China.
Romaric Limacher1*, Sophie Mann1 and Antoine Misse1
A common methodology consists in comparing seismic refraction and ERT (Electrical Resistivity Tomography) sections for general interpretation. In this paper, the numerical values and seismic refraction and ERT sections have been multiplied and divided. Dimensional analysis showed these operations related to capacitance. This is unexpected as Vp (a mechanical property) does not seem to be related to electrical charge storage. Utility databases have been used to analyse Vp and resistivity sections recorded in Ireland. Ratios and products of these sections effectively delineated culverts, water pipes, and possibly water tables. Two possible explanations have been considered for these delineations: one based on electromagnetic models, and the other on the second order partial derivatives of the resistance. The latter, linked to Poisson’s ratio, seemed more promising due to a lack of correlation with electromagnetic models. Future research can investigate karst detection using this approach, and potentially a retrieval of subsurface Poisson’s ratio through inversion.
Seismic refraction and ERT (Electrical Resistivity Tomography) are commonly combined in near-surface geophysical surveys. Velocity and resistivity ranges can be compared and correlated to identify bedrock type and strength, often with prior geological knowledge. Sometimes, both inversion sections may share similarities, but also differ in certain features. Physical parameters may exhibit unique characteristics for each section. Consequently, a pattern seen in the first section may be absent from the second. This observation prompted a question: can multiplying these sections improve identification of common features and the delineation of hidden patterns, or is it nonsensical to perform mathematical operations between incommensurable physical quantities?
When unsure, use a rigorous method like the dimensional analysis linked to Fourier (1822), perfected with the Buckingham-Pi theorem (1914), and applied by Taylor (1950) in the yield assessment of the Trinity nuclear Test. Wheeler (1991) even advised: ‘Never make a calculation until you know the answer.’ This method is thoroughly described by D. Louapre (2021).
As both seismic refraction and ERT inversion sections provide many numerical values comparable to each other, dimensional analysis will verify if a meaningful unit arises from a particular Vp and resistivity combination.
In this paper, we investigate both the P-wave velocity/ resistivity ratio , and the product’s inverse of these same
parameters . Both operations’ results share the unit farad. The
absence of an obvious link between P-wave velocity, a mechanical property, and electrical charge storage ability, make the result unexpected. Seismic refraction and ERT surveys in various Irish locations with diverse geology were conducted to validate these findings. Geological variations were crucial for assessing reproducibility in this initial experiment.
Moreover, utility surveys were conducted along with geophysical acquisitions in these areas, leveraging a-priori knowledge to emphasise correlation search for buried pipes and culverts. This approach connected charge storage near a pipe to a cylindrical capacitor model. Using this electromagnetic model as a guide, correlations between site information and computed sections are identified.
The same datasets have also been pondered under a paradigm different from the physics of chargeability, involving an equation system derived from second-order partial derivatives of the resistance. This second model establishes a relation between resistivity, P-wave velocity, second derivatives of electrical resistance, and finally, Poisson’s ratio. If true, this suggests the potential to invert subsurface mechanical properties from combined ERT and seismic refraction surveys.
The paper begins with a dimensional analysis of P-wave velocity and resistivity, linked to capacitance units. It then references simple capacitor models versus an equation system for resistance rate of change. Subsequent sections cover acquisition
1 Murphy Geospatial
* Corresponding author, E-mail: rlimacher@murphygs.ie, romariclimacher@hotmail.com DOI: 10.3997/1365-2397.fb2025050
sites, survey geometries, and field dataset results. The paper concludes by addressing the limitations of dimensional analysis and discussing potential models explaining most likely the computed section variations.
The paper explores the combination of P-wave velocity and resistivity, two unrelated physical properties. The first indeed relates to both mechanical property and density of a material, while the second expresses its ability to resist electrical current. This difference led us to consider dimensional analysis, using the international system of units, for establishing an equation, up to a dimensionless constant.
From different combinations involving products and ratios, two obvious options stood out:
A quick reminder, from undergraduate years, which can be reminded in classical textbooks like those of Halliday D. et al. (2014), defines how such a cylinder of length L has a capacitance of:
respective inverses of equations (1) and (2):
Equations (3) and (4) share a common unit, the farad, which describes the ability to store an electrical charge. Equation (3) represents a capacitance density, or areal capacitance. It measures how much electric charge a surface can hold per square metre. For instance, a surface of 1 farad.m-2 can store 1 Coulomb of charge on 1 square metre when 1 Volt is applied.
Likewise, equation (4) represents capacitance speed, measuring how fast an electrical charge accumulates. The question of whether this rate of change can be related to Induced Polarisation will be explored in the section on dimensional analysis.
As 1 coulomb is an important charge, smaller values are expected for both ratios. Now two values sharing a common unit are defined, and two basic physics model will be proposed:
• The first model describes the accumulation of electrical charge along a buried pipe, interpreting the capacitance unit at face value.
• The second model links resistivities, P-wave velocities, Poisson’s ratios, and second-order partial derivatives of electrical resistances.
Case 1: Cylinder’s capacitance across geophysical line plane.
Utilities and buried networks are generally cylindrical. They can be approximated as hollow cylinders with inner radius R2, and outer radius R1, where R2 < R1
where ɛ0 is the vacuum permittivity. Equation (5) depicts charge accumulation along a cylinder in an electrical field, where charge increases proportionally to cylinder length. Viewing the charge from a geophysical line intersected by the utility will reveal outof-plane effects. The surface of the hollow cylinder being:
The unit of (7) is , like in (3). It is then expected that the longer the utility, the higher its areal capacitance, the easier it will be detected on a geophysical section combining resistivity and P-wave velocity.
Likewise, if the prospecting plane obliquely intersects a cylinder obliquely, the resulting section will be an ellipse of minor axis a, with a major axis b proportional to the pipe’s length. If L is the length of the cylinder, and , the intersection surface of this ellipse will be:
The variable (k) represents the fraction of the cylindrical shell’s circumference intersected by a plane. For example, (k = 1) if the plane intersects the entire circumference, (k = 0.5) for half, and (k = 0) if there’s no intersection.
In the previous case, dividing (5) by (8):
Unlike(7), the ratio capacitance to elliptic section’s area of intersection is independent of the utility length. In equation (7), outer and inner radii are subtracted, while in (9), they are added. When a utility is fully intersected, (k = 1). The larger numerator (via (L)) and smaller denominator (difference of radii) in equation (7) result in a higher value than in (9). This suggests higher detection likelihood when orthogonally intersecting the section. However, resolution issues pertaining to electrode/geophone spacing are not accounted for.
Case 2: Equation system using the second order partial derivatives of the resistance
Consider a piece of resistive material of length L, base area A, resistance R and resistivity ρ. For a material with a uniform cross
section A, the physical relation linking these four parameters is:
In appendixes 1 to 3, different calculus steps based on this relation lead to the 1D system of equations:
for which 3D generalisation is:
This equation system describes plane wave propagation in a uniform, isotropic medium. P-waves do not depend on resistivity or resistance, and their propagation follows a uniform plane wave-equation with velocity V p. Both distribution changes caused by the wave propagation on the displacement (u) and resistivity (ρ) induce a temporal variation in the resistance, leading to a multiphysics approach similar to Zener (1948) in the study of anelastic propagation of waves in metals.
The first equation in systems (11) and (12) describes resistance variations in presence of a P-wave. This plane wave equation is inhomogeneous, with a source term related to both P-wave velocity and resistivity distribution. It is analogous to the electric field equation with charge density, and no current density.
The second equation depicts a non-static and time-variant electrical resistance, in which acceleration is constrained by:
• Poisson’s ratio
• P-wave velocity of the propagating medium and its resistance
• displacement u.
The equation’s form mirrors Newton’s second law, stating that net force equals acceleration. Similarly, a plane wave’s displacement pattern impacts resistance acceleration.
Moreover, each equation of the system contains parameters which are the subject of this paper:
• Vp to resistivity ratio is in the first equation of the system. If the model adequately describes the physical phenomenon, it therefore implies that this ratio, related to equation (4) plays a role like permittivity in the inhomogeneous electric field equation with charge density.
• In the second equation of the system, Vp and resistivity product’s inverse is positioned beside the second-order partial derivative of resistance. This arrangement hints at a potential indirect relationship with a sum involving Poisson’s ratio.
(13)
Excluding auxetic materials, the Poisson’s ratio typically ranges from 0 to 0.5. In geophysics, its value in porous media is affected by the presence of liquids, regardless of their nature.
If true, the inverse of V p and ρ product shall provide the ability to delineate buried water pipes, culverts, and potentially groundwater.
This second equation allows for a quick order of magnitude check to assess the relevance of the system. With strain amplitudes ranging from micrometres to nanometres in a seismic survey, similar magnitudes are expected on the equation’s lefthand side. Given resistivities from a few to many thousands of Ω.m and seismic velocities from a few hundred to a few thousand metres per second, the square of their inverse product ranges from 10-4 to 10-12. The common range of 10-6 to 10-9 suggests this system might be worth exploring. However, the non-overlapping upper 10-4 to 10-6 and lower 10-9 to 10-12 bounds indicate that this equation system either does not fully describe the system or does not describe it at all, making it potentially irrelevant. This latest point will have to be clarified with further tests in future. Finally, as no cylinder is considered in the equation system (12), resulting amplitudes would be regardless of the pipe obliquity with the geophysical plane, unlike the first proposed case. This difference between these two cases will be one of the three options for analysing V p and ρ ratios and products:
• When pipes intersect geophysical planes orthogonally, the expected amplitude is significantly higher than in cases with non-orthogonal sections. If this feature is observed, the capacitance unit shall be taken at face value, i.e., as the ability of a pipe to build up an electrical charge along its length.
• Amplitude variations near water pipes and groundwater, but not around electrical cables and telecoms, indicate the relevance of the second case.
Figure 1 Zoom on Line 9 in county Wexford, Ireland, which had devices south of the road along brown (seismic) and cyan (ERT) lines. A fuchsia line 5 m north marks an underground fibre distribution. Water mains circled in red intersect with the geophysical line, with a possible water pipe (blue) in the orange circle.
Figure 2 Line 11 in county Wexford, Ireland, shows the watermain (blue) obliquely crossing seismic and resistivity lines (green) oriented north-east to south-west. Fibre optics (fuchsia), road scars (orange), and drainage pipes (violet) are also indicated.
Aerial view of Line 4 in County Galway. Distinctive signs have been blackened for confidentiality reasons. In yellow, the geophysical line. In red, is the approximate location of the culvert, with its known outlet.
• If these features are not observed, the cases are not relevant, and a new physical model must be proposed.
Datasets are from two surveys in Ireland, in Wexford and Galway. The first site has volcanic bedrock, the second limestone, both covered with glacial till. The 250 km distance and geological differences help verify occurrences and reproducibility. The results will later reveal that divisions and multiplications of V p and ρ highlight man-made-buried objects over geological features, regardless of the bedrock type. Thus, site descriptions will focus more on buried utilities surveyed during geophysical acquisitions rather than on respective geologies.
The first site in Wexford is a roadside with survey Lines 9 and 11 running NE to SW. Geophones and electrodes were placed near a country road. GPR identified anomalies, including a possible water pipe. Two other known water mains cross this road and Line 9 (see Figure 1).
Line 11 (Figure 2), located south-west, is about 46 m long, with its first geophone and electrode planted on the north-east side. All devices are also on the southern roadside, with a watermain crossing the line obliquely, almost along its length. If the first case is true, this non-orthogonal section may be
challenging for utility detection, because the intersection angle influences amplitude according to equations (7) and (9). If false, amplitude variations might be better explained by Poisson’s ratio and resistance time derivatives in equations (11) (in 1D) and (12) (3D Generalisation).
Confirming water pipe delineation in different conditions ensures the phenomenon is neither random nor site-specific. This involves using results from another survey, unrelated to Lines 9 and 11, to assess repeatability. For this, Line 4 from a survey in County Galway, Ireland, was chosen for its location, about 250 km from County Wexford, with distinct limestone geology and detectable features such as a culvert and a billboard foundation, along with groundwater.
To summarise, the last line in Galway provides key insights. If the billboard’s foundation is well-defined in the sections, electrical chargeability physics may explain the phenomenon; otherwise, this hypothesis will be ruled out. Secondly, if amplitude variations are observed within the boulder clay layer, equation systems (11) (1D) or (12) (3D) will be considered. Indeed, water-saturated sediments typically have a higher Poisson’s ratio than dry sediments.
Both surveys used a common geometry: 2 m geophone and electrode spacing, 24 geophones for seismic refraction, and roll-along mode recording. A 10 kg hammer and plate served as the source, with shots near geophones 1, 6, 12, and 24. The Wenner-Beta array was used at both sites to enhance ERT dataset comparisons, providing balanced horizontal to vertical resolution
6 Line 9 sections include (a) resistivity and P-wave velocity inverse product, (b) P-wave velocity to resistivity ratio and (c) its root mean square. They are computed from inversion sections displayed on Figures 4 and 5. Water pipes stand out in the section, while the geological layers are filtered out. High amplitudes noticed after 550 m were recorded over a ditch.
and a good signal-to-noise ratio. After inversion, the seismic inversion section was under-sampled to match the ERT inversion grid size. The resulting sections were used for computing two parameters:
• The inverse of the P-wave velocity/resistivity product (Unit: Farad per square metre),
• The root mean square of the P-wave velocity/resistivity ratio. (Unit: Farad per second).
Line 9 – Wexford
Line 9 is about 550 m long, with few buried utilities widely spaced enough for keeping count of true positives, false ones and missed targets. This is especially true in Figure 6 part (a), where only water pipes stand out clearly, while geological features are filtered out.
In Figure 6 (b) and (c), maximum amplitudes are also near the water pipes. High amplitudes between 500 and 550 m were close to a ditch edge. Amplitudes two to four times smaller at distances 50 and 100 m remain unexplained. It is uncertain whether they relate to geological features, man-made structures, or just noise. Knowledge from utility survey and GPR dataset would suggest that it is likely noise, indicating that the P-wave velocity to resistivity is noisier than expected.
These could be a side effects related to the first equation of systems (11) (1D case) and (12) (3D generalisation), the term involving this ratio with the resistivity spatial variations; but this remains a speculation, not a deduction from any equation. Overall, the capacitance unit being proportionally inverse to impedance (up to a frequency term), all sections underline areas with lower electrical resistance.
Finally, other buried utilities were all completely missed in Figure 6 (a) to (c), leading to the conclusion that only water pipes are visible in those sections.
Line 11 – Wexford
Examination of Line 11 can determine if a pipe obliquely intersecting the geophysical section is detectable through the proposed processing, and if the intersection angle impacts the amplitude. This step will help in assessing the relevance of Equation (7) and (9), and therefore, confirming or refuting the proposed explanation in case 1.
The ratio of these two equations is:
Where L is the length of the ellipse, k a number between 0 and 1, and Ri are radiuses. Following this ratio, if the explanation is relevant, amplitudes near the water pipe would be significantly lower on Line 11 than on Line 9, potentially resulting in the utility being missed on a section.
In Figure 9 (a), the water pipe location can clearly be identified by the inverse of Vp/resistivity product. The maximum amplitude is two to six times lower than in Line 9, which is still significantly higher than the expected ratio of at least 20. Figure 6 (a) indeed delineates a pipe between 20 and 45 m, on a 20 to 25 m oblique crossing, above 25 m elevation.
Line 11. Location is blackened for confidentiality purposes. These sections will be used for generating the sections displayed
Figure 9 Sections of Line 11, computed from inversion sections displayed on Figures 7 and 8. (a) Resistivity and P-wave velocity inverse product section. (b) P-wave velocity resistivity ratio. (c) Root mean square of the precedent section. The high amplitude areas approximately delineate the location where the pipe obliquely intersects the geophysical section plane.
The similar amplitudes in the parts (b) and (c) of Figure 6 and Figure 9 contradict equation (14)’s prediction of diminishing amplitude. This casts doubts on the electrical chargeability explanation. Additionally, the deeper maximum amplitudes sug-
gest that Vp/Resistivity ratios represent the source term of an inhomogeneous wave equation.
For memo, the Vp/ρ ratio multiplied by the Lagrange operator of resistivity acts like charge in an electric field equation. Without charge, an electric field spreads uniformly. With charge, the propagation is non-punctual. Likewise, our model predicts resistance changes. In Figure 9 (b) and (c), numerical values near the water pipe suggest higher resistance variations above than below it, an inhomogeneity indicating a non-punctual propagation of a plane wave.
This comparison between lines 9 and 11 leads to several conclusions:
• The dimensional analysis suggests a potential phenomenon.
• Features in the dataset support the phenomena. However, some observations seem to contradict it.
• The explanation related to the computation of capacitances is considered less likely.
• The connection between the resistance time derivative and Poisson’s ratio gains credibility, particularly the term involving the product of P-wave velocities and resistivities.
This final line aims to check if the water pipe detection phenomenon is reproducible. Was it specific to Wexford, or can it be observed elsewhere under different conditions, and different geologies?
Then, the other two purposes are to confirm if the computation of capacitances is irrelevant, and if the equation systems (11) and (12) can be a representative model, reasonable enough for further investigating its potential practical applications.
The survey aimed to detect groundwater. As no feedback was given after the delivery, unconfirmed interpretations are highlighted in red on Figure 12. Known features from the utility survey are highlighted in green. Missed billboard foundations further invalidate the capacitance-based explanation. This suggests the method delineates water pipes, culverts, and groundwater, but filters out other features like utilities, foundations, and geological patterns.
Figure 12 (b) and (c) are also noisier than (a), especially between 140 and 160 m of abscissa, and then between 180 and 190 m. This noise pattern, a common point between Lines 9 and 11 in Wexford, then Line 4 in Galway, suggest lower signal-tonoise in the Vp/resistivity ratio.
Dimensional analysis revealed a physical law. Without physical knowledge or proof, Vp/resistivity ratios and products are only useful for magnitude assessment and scale reasoning. We initially assumed the unit’s validity, supporting the chargeability hypothesis for the observed patterns. The inability to detect utilities other than water mains and culverts challenges the chargeability hypothesis. Additionally, chargeability predicts lower amplitudes for non-orthogonal pipe intersections with the geophysical plane. Equation (14) suggested a 20-fold amplitude difference between lines 9 and 11, but actual amplitudes differed by only 10%. This further undermines the chargeability hypothesis.
Finally, the inability to detect the billboard further contradicts capacitance-based explanations.
The exclusion of this hypothesis suggests that observed amplitudes are unrelated to Induced Polarisation or Seismo-Electricity. We should explore other areas of physics to explain these changes.
Hence an effort to go back to basics with equation (10), for which time derivatives led to equation systems (11) in 1D, and then (12) in 3D. They describe resistance changes during a P-wave propagation which are constrained by Vp/resistivity. Likewise, Resistance change acceleration is proportional to Vp, resistivity, and Poisson’s ratio. Equation (13) shows V/resistivity is inversely proportional to Poisson’s ratio. This suggests processing Vp and resistivity could detect water pipes and potentially
groundwater. Prior utility surveys confirmed that both Vp and resistivity ratio, and the inverse of their product, effectively underlines water pipes and culverts, aligning with expected resistance and Poisson’s ratio changes in equation (13).
Sections showing parameter ratios have been inconclusive, with uncertainty over whether false positives or amplitude peaks below water pipes are due to poor signal-to-noise ratio or actual resistance variations. Similar variations occur with water saturation in porous media. Groundwater delineation in boulder clays on line 4 in Galway supports the relevance of the resistance-based equation system. Moreover, having only got access to utility information from past surveys, other potential causes have not been considered. For example, as mentioned by a reviewer, the very act of excavating a trench and back-filling may result in less consolidated material around the utility that would have a lower Vp than surrounding, undisturbed soil. The resistivity may be unaffected by such activity. If further geophysical acquisitions confirm this hypothesis, a new question will arise: why water pipes are detected, and not the buried telecom cables?
Future research should also:
• Confirm the validity of equation systems (11) and (12), and therefore, the possibility to compute Poisson’s ratio sections.
• Consider the effects of electrode and geophone spacing on resolution.
Vp*resistivity and Vp/resistivity have been analysed using dimensional analysis. SI units revealed two units related to Farad: one areal, the other temporal.
Taking the unit at face value, different chargeability models were used to predict variations, such as cylinders intersecting the geophysical plane at different angles. This choice was based on prior knowledge from utility surveys conducted during the geophysical acquisition. Direct comparison could then confirm, or refute, the ability of this processing step to underline features. To check further the reproducibility of what was observed, the processing was performed on two datasets 250 km apart, with totally different geologies.
A second explanation, based on resistance second-order partial derivatives, describes a material’s resistance change during an elastic wave propagation. The inability to detect utilities other than water pipes and the lack of significant amplitude variation with intersection angle eliminated the chargeability hypothesis. However, water pipes and culverts were consistently detected, filtering out geological features. Successful groundwater delineation in one line further supports the equation system linking Vp, resistivity, resistance derivatives, and Poisson’s ratio.
Further effort and tests shall be done for validating this equation system and confirming the initial interpretation on Vp/ resistivity product and ratio sections. After this step, inversion schemes extracting the subsurface Poisson’s ratio will be a reasonable next target.
We would like to thank Aidan Doherty, Daire Conlon, Zuzana Knotkova, and the surveyors of the Subsurface Engineering
Department at Murphy Geospatial for their help and contributions to this paper.
Appendix 1 (General case)
Consider a cylindrical material with base area A, length L. The formula relates its resistance, resistivity, length, and base area:
The natural logarithm maps multiplication into addition, and division into subtraction:
In the second volume of Seismic Data Analysis’ Annexes, Yilmaz (2001) uses time and partial derivatives for getting the Zoeppritz equations (1919). Introduction of resistances and resistivities lead to the following equation system:
By the law of small deformations:
Where ∆A and ∆L represent small variations in area and length, and ∆ shall not be confused with the Laplacian.
Assuming a small, homogeneous, and instantaneous strain along the x-axis, applying the previous equality to the system of partial differential equations yields:
Differentiating the system of equations twice yields:
Multiplying the first equation by the P-wave velocity and subtracting it from the second equation:
Assuming a small deformation u such that , the right
side of the latest equation represents P-wave propagation in a homogeneous, isotropic medium:
Leaving only the two leftmost terms:
If resistivity has no time variation, the second time derivative of (20) becomes:
Which generalisation in 3D is:
This one-dimensional wave equation has a plane-wave solution:
K is a constant. In (18), L/A is proportional to Poisson’s ratio. Therefore, (27) suggests that resistance to resistivity ratio might also be proportional to Poisson’s ratio.
Appendix 2 (P-wave velocity to resistivity ratio)
Resistivity is spatially sampled, but not recorded during seismic wave propagation. Therefore, it is reasonable to assume that resistivity has no time variation, and (23) becomes:
Using the P-wave equation for replacing the right-hand side:
Its generalisation to 3D leads to:
This equation relates P-wave velocity ratio and resistivity to resistance and resistivity variations. As V p and ρ come from the inversion sections, R is the only unknown. (28) and (29) describe how resistivity distribution limits resistance changes due to a plane wave, with this constraint modulated by the V p / ρVp / ρ ratio.
Buckingham, E. [1914]. On physically Similar Systems: Illustrations of the Use of Dimensional Analysis. Physical Review, 4(4), 345-376. Feynman R. et al. [2005]. The Feynman Lectures on Physics The new Millenium Edition. Basic Books.
Fourier, J. [1822]. Theorie Analytique de la chaleur. Paris, France.
Halliday D. et al. [2014]. Fundamentals of Physics 10th Edition. Springer. Louapre, D. [2021]. L’analyse dimensionelle – La technique secrète des physiciens. L’analyse dimensionnelle – La technique secrète des physiciens – Science étonnante (scienceetonnante.com).
Taylor, Sir G. [1950a]. The formation of a blast wave by a very intense explosion. I. Theoretical discussion. Proceedings of the Royal Society A., 201(1065), 159-174.
Taylor, Sir G. [1950b]. The formation of a blast wave by a very intense explosion. II. The Explosion of 1945. Proceedings of the Royal Society A., 201(1065), 175-186.
Wheeler, J.A. and Taylor E.F. [1991]. Spacetime Physics. W.H. Freeman and Company, New York.
Yilmaz, O. [2001]. Seismic Data Analysis. Society of Exploration Geophysicists.
Zener, C. [1948]. Elasticity and anelasticity of metals. The University of Chicago Press.
Zoeppritz, K. [1919]. Erdbebenwellen VII. VIIb. Über Reflexion und Durchgang seismischer Wellen durch Unstetigkeitsflächen. Nachrichten von der Königlichen Gesellschaft der Wissenschaften zu Göttingen, Mathematisch-physikalische Klasse, 66-84.
Mohamed Ahmed Abdelhay1*, Abdel Nasser Helal2, Abdel Aleem Elessawy3
and Amir Lala2.
Introduction
Abstract
Accurate pore pressure prediction is critical for safe and efficient drilling operations. However, conventional methods face challenges due to insufficient quality of seismic data and limited wellbore availability. This study explores the application of machine learning algorithms (decision tree, random forest and XGBoost) to predict pore pressure at the offshore Nile Delta Basin, especially in the Sapphire Field, which consists of a complex geological environment with vertically stacked reservoirs. The XGBoost model achieved the best performance with 99% accuracy on training data and 97% on test data, using 53,711 recorded data points from seven drilling records in four wells. The model has been adjusted to accurately predict pore pressure using existing drilling logs in the absence of direct measurements. Error analysis demonstrated a strong correlation with actual data. This approach has the potential to enhance pressure prediction operations and mitigate drilling risk.
For effective planning and execution of a safe and cost-effective drilling program, it is essential to predict abnormal pore pressure, including both overpressure and under pressure. The abnormal pressure occurs due to a number of geological factors, such as rapid sedimentation, high temperatures, and geochemical reactions. Therefore, reliable pore pressure prediction is essential for optimal well design and to reduce drilling risks (Hu et al., 2013; Law and Spencer, 1998; Sayers et al., 2002). The typical approach for predicting pore pressure while drilling relies on logging while drilling (LWD) data, particularly gamma ray and resistivity curves.
However, there are situations where these curves may indicate sand or silt layers that could affect pore pressure estimation. Additionally, there are instances when drilling tools experience issues that hinder data recording. In this paper, we propose utilising drilling data, generated from any drilling process, to develop a model for accurate pore pressure prediction while drilling. Machine learning, a subset of artificial intelligence, has become a powerful tool for tackling complex challenges across various disciplines, including geology. These algorithms excel at identifying patterns and relationships within large datasets, making them particularly well-suited for predicting non-linear phenomena, such as pore
1 Rashid Petroleum Company (Rashpetco) | 2 Ain Shams University | 3 SLB * Corresponding author, E-mail: Mohamed.Abdelhai.Saleh@Gmail.com DOI: 10.3997/1365-2397.fb2025051
Figure 1 Location of study area with the distribution of the available wells. (Abdelhay, 2025).
pressure. Machine learning is also increasingly being applied in geophysics, demonstrating its potential to enhance hydrocarbon exploration and production (Dornan et al., 2020; Song et al., 2020; Bai and Tan, 2021; Chen et al., 2020; Grana et al., 2020).
The Nile Delta is a vast alluvial plain formed by the deposition of sediments from the Nile River, with a complex geological history shaped by plate tectonics and ongoing sedimentation. The litho-facies in this region consist of a sequence of units spanning from the pre-Miocene to the Pleistocene and Holocene epochs. The Miocene sequence is dominated by open marine evaporites. Offshore, the Pliocene section, which exceeds 3,000 m in thickness, is subdivided into the Abu Madi, Kafr El Sheikh, and El Wastani formations. This study focuses on the Sapphire Field, located within the lower Pliocene Kafr El Sheikh formation. Figure 1 provides an overview of the field’s location, while Figure 2 presents the stratigraphic columns of the Nile Delta.
This study aims to use artificial intelligence applications for solving pore pressure estimation while drilling at Sapphire Field. A key aspect of our scientific contribution is the development of a model for pore pressure estimation during drilling, which can support decision-making in real time and assist with pore pressure prediction even in the absence of Logging While Drilling (LWD) data. ). The selection of a model is based on training and validation data error analysis and using a blind well to ensure its accuracy. Machine learning (ML) algorithms typically follow a layered architecture, consisting of an input layer, one or more hidden layers, and an output layer (Figure 3). The two main types of ML algorithms are supervised and unsupervised learning (Figure 4). In supervised learning, the algorithm is trained on a labelled dataset that includes both input features and corresponding output values, allowing it to identify patterns and make predictions on new, unseen data. On the other hand, unsupervised learning works with unlabelled data, focusing on clustering or identifying anomalies.
Three supervised learning algorithms were employed: Decision Tree (DT), Random Forest (RF), and Extreme Gradient Boosting (XGBoost).
The DT algorithm constructs a hierarchical model that iteratively splits data based on decision trees (Larestani et al., 2022; Lorena and de Carvalho, 2007). RF is a cluster-based method that leverages the combined intelligence of multiple decision trees to improve prediction accuracy and reduce overfitting (Hidayat and
Astsauri, 2021). XGBoost, an advanced algorithm, builds highly accurate prediction models for classification and regression tasks.
To optimise the performance of the XGBoost model, hyperparameter tuning was conducted, including adjustments to parameters such as n_estimators (which determines the number of boosting stages), learning rate (which controls the contribution of each new estimator to the ensemble prediction), and maximum depth (which limits the number of nodes in the decision trees) (Jason, 2021).
The following indicators were used to evaluate the prediction performance of each algorithm: root mean square error (RMSE), coefficient of determination (R²), and the correlation between the predicted pore pressure values and the actual values (Singh et al., 2019).
This study was carried out in three stages: (1) data generation and analysis, (2) model development and training, and (3) model evaluation. In the initial stage data were collected from four wells. 1. The first phase involves data generation and evaluation. Table 1 presents a sample of the imported drilling well logs, including Rate of Penetration (ROP), Weight on Bit (WOB), Round per Minute (RPM), Torque, Stand Pipe Pressure (SPP), Flow In, Pit Volume, and Pore Pressure (PP) as the target variable. Rigorous data quality checks were performed, as shown in
Figure 5 Heat Map for the relation between the input logs. A heat map is a graphical representation of data where values are depicted by colour. This allows for quick visual identification of patterns and concentrations.
Table 2, to ensure data integrity and identify any inconsistencies or outliers. Next, a correlation matrix was created and visualised as a heat map (Figure 5) to explore the relationships between the input features. It is essential to identify and address any strong correlations between the target variable and other input logs. Considering the data as a single dataset, the data from the five wells was combined into one dataset, one of the key advantages of machine learning models is their ability to efficiently handle complex relationships within the data. To improve model performance and ensure consistent data range, data normalisation is applied to all input logs except PP. Table 3 shows the results after data normalisation of the input data.
2. The second phase focused on developing a pore pressure (PP) prediction model using three machine learning algorithms: Decision Tree (DT), Random Forest (RF), and Extreme Gradient Boosting (XGBoost). To evaluate the models, two metrics were used: Root Mean Square Error (RMSE) and R-squared (R²) scores. Before training the models, the dataset was divided into training and testing sets, with 80% allocated for training and 20% for testing. The training set was used to train the model and identify the implied relationships between the input features and the PP target. The test set was then used to evaluate the model’s accuracy and assess its performance on
Table 3 Input data range after the normalisation process to be from -1 to 1.
blind data. PP predictions were generated for each algorithm, and the corresponding RMSE and R² values were calculated for both the training and testing sets. These results were further analysed by comparing the predicted PP values with the actual measured values to determine prediction accuracy.
a. The first algorithm used was the Decision Tree (DT), a supervised learning model that creates a hierarchical, tree-like structure of nodes and branches to predict target variables. When applied to the training data, the DT model demonstrated perfect performance, with an RMSE of 0.0 and an R² of 1.0. However, when compared to the test data, the model’s performance showed an RMSE of 0.04 and an R² of 0.96. This discrepancy between the training and test sets suggests that the model may be overfitting. In other words, while the model learns the training data exceptionally well, it may not generalise effectively to unseen or blind data.
Figure 6 The error percentage for Decision Tree algorithm determined at the four wells.
b. The second algorithm used was Random Forest (RF), a cluster-based learning method that aggregates predictions from multiple Decision Tree. Based on the training data, the RF model achieved high accuracy, with an RMSE of 0.0028 and an R² of 0.9967. While this high accuracy was observed on the training set, due to the nature of the RF algorithm, its performance on the test set remained strong, with an RMSE of 0.021 and an R² of 0.9747.
c. The third algorithm used was Extreme Gradient Boosting (XGBoost), an ensemble learning method known for its high performance. Hyper parameter tuning was performed to identify the most optimal set of parameters to enhance model performance. The key hyper parameters for XGBoost include: (1) n_estimators, which refers to the number of boosting rounds (i.e., the number of trees in the ensemble); (2) learning_rate, which controls the contribution of each tree to the final prediction; and (3)
max_depth, which limits the maximum depth of each tree and controls the complexity of the model.
The XGBoost model achieved an RMSE of 0.0028 and an R² of 0.9967 on the training data, and an RMSE of 0.0271 and an R² of 0.9673 on the test data. The model was trained with n_estimators set to 100.
At the data analysis stage, the error range between the actual pore pressure (PP) and the predictions generated by the three algorithms was evaluated. Error plots for the four input wells were generated to assess the accuracy of the three algorithms. The following figures illustrate the error estimation.
The error plots are useful for identifying the most effective prediction algorithm. The error plot for the Decision Tree algorithm shows that the maximum error percentage falls between -1% and +1%, with most of the data centred around 0%. This negligible error suggests a potential overfitting issue, where the model has
learnt the input data too well. In contrast, the error plot for the Random Forest algorithm displays a more typical normal distribution, with the maximum error percentage ranging from -5% to +5%, and most of the data falling between -1% and +1%. This indicates better accuracy compared to the Decision Tree algorithm. The third plot, related to the XGBoost algorithm, also exhibits a normal distribution of errors, with most of the data within the -1% to +1% range, similar to Random Forest, suggesting comparable accuracy to Random Forest and better performance than the Decision Tree.
3. The third phase involved model validation to assess the ability of the developed model to predict pore pressures in blind data. For this purpose, blind wells, which were separated from the training and initial testing datasets, were used for evaluation. This step was necessary due to the high accuracy (>95%) achieved on the training and testing sets, allowing us to identify the model that performs best in predicting pore pressures for blind wells. The validation process begins with
generating data for the blind well, which includes the same seven input features: Rate of Penetration (ROP), Weight on Bit (WOB), Round per Minute (RPM), Torque, Stand Pipe Pressure (SPP), Flow In, and Pit Volume. Data quality checks were conducted to identify and address any inconsistencies or missing values. Next, pore pressure predictions were generated for the blind well using the three trained models (DT, RF, and XGBoost). The predicted values were then compared with the actual measured pore pressure from the blind well. Tables 4 and 5 present the data imported for the blind well. Following this, the input data was standardised, which is an essential step in data preparation. Finally, the three developed
models (DT, RF, and XGBoost) were used to predict the pore pressure for the blind well.
At the data analysis stage, pore pressure at the blind well was estimated using the three algorithms. Error plots were generated to compare the actual pore pressure (PP) with the predictions from each algorithm. Figure 9 shows the pore pressure predictions from the three algorithms compared to the actual pore pressure. Figure 10 displays the error plots for the three algorithms applied to the blind well.
The error plots aid in analysing the most effective prediction algorithm. The error distribution ranges between +10% and
-10%. The Decision Tree algorithm shows some errors exceeding 10%, compared to the other two algorithms, which have most of their error distribution between +5% and -5%. This suggests that the Decision Tree algorithm has a higher error margin than the Random Forest and XGBoost algorithms.
Also, during the training and validation stages, both the XGBoost and RF models showed close accuracy. However, in the blind test, XGBoost betters RF, as shown in Figure 9, which indicates that the XGBoost model is closer to the actual values, especially from a depth of 1900 m.
On the other hand we encountered some models underperforming. The underperformance of the XGBoost model in predicting pore pressure may be related to various contributing factors.
Issues or inaccuracies in the input data, particularly in logging data, may significantly impact pore pressure prediction outcomes.
The model used five wells, with multiple readings for the input log at same depths. It may underperform the model. A complex geological setting may limit the development of an ideal predictive model. Lithology and different logging data are often key elements. If these are poorly represented, the model will encounter challenges.
XGBoost has a variety of hyper parameters that control its functionality. In this paper, we aim to optimise the hyper parameters to achieve accuracy and minimal error. Some depths are affected by this optimisation.
This study effectively demonstrates the feasibility of using machine learning algorithms, specifically XGBoost, to predict pore pressure accurately in the complex geological environment of the Sapphire Field. By utilising drilling data from four wells — such as ROP, WOB, RPM, torque, SPP, inflow, and pit volume — high accuracy was achieved. The model’s performance was validated using blind wells, showing a strong correlation between predicted and actual pore pressure, emphasising its ability to generalise to unseen or blind data. This approach offers a valuable alternative to traditional methods, which often face limitations due to insufficient seismic data or limited well log availability. The ability to predict pore pressure accurately with readily available drilling data significantly
impacts well planning and operations, not only in the Sapphire Field but also in similar geological settings. Moreover, this model helps to reduce risks associated with abnormal pressures (such as kicks and blowouts), ultimately enhancing drilling efficiency and safety.
References
Abdelhay, M., Hilal, A., Elessawy A. and Lala, A. [2025]. A novel approach to predict 3D pressure cubes, Sapphire Field, offshore Nile Delta, Egypt. First Break, 43(1), 43-49.
Bai, Y. and Tan, M. [2021]. Dynamic committee machine with fuzzy-cmeans clustering for total organic carbon content prediction from wire line logs. Comput. Geosciences, 146, 104626.
Chen, G., Chen, L. and Li, Q. [2020]. Comparison and application of neural networks in LWD lithology identification. IOP Conf. Ser. Earth Environ. Sci., 526(1), 012146.
Dornan, T., O’Sullivan, G., O’Riain, N., Stueeken, E. and Goodhue, R. [2020]. The application of machine learning methods to aggregate geochemistry predicts quarry source location: An example from Ireland. Comput. Geosciences, 140, 104495.
Grana, D., Azevedo, L. and Liu, M. [2020]. A comparison of deep machine learning and Monte Carlo methods for facies classification from seismic data. Geophysics, 85(4), WA41–WA52.
Hidayat, F. and Astsauri, TMS. [2021]. Applied random forest for parameter sensitivity of low salinity water injection (LSWI) implementation on carbonate reservoir. Alex. Eng. J.
Hu, L., Deng, J., Zhu, H., Lin, H., Chen, Z., Deng, F.C. and Yan, C. [2013]. A new pore pressure prediction method — Back propagation artificial neural network. Elect. J. Geotech. Engn., 18, 4093-4107.
Jason B. [2021]. Machinelearningmastery.com/xgboost-for-regression.
Larestani, A., Mousavi, S.P., Hadavimoghaddam, F. and Hemmati-Sarapardeh, A., [2022]. Predicting formation damage of oil fields due to mineral scaling during water-flooding operations: Gradient boosting decision tree and cascade forward back-propagation network. J. Pet. Sci. Eng., 208, 109315.
Law, B.E. and Spencer, C.W. [1998]. Abnormal pressure in hydrocarbon environments. In Law, B.E., Ulmishek, G.F., and Slavin, V.I., eds., Abnormal pressures in hydrocarbon environments. AAPG Memoir, 70, Tulsa, p. 1-11.
Lorena, A.C. and de Carvalho, A.C. [2007]. Protein cellular localization prediction with support vector machines and decision trees. Comput. Biol. Med., 37(2), 115–125.
Rio, D., Sprovieri, R. and Thunell, R. [1991]. Pliocene-lower Pleistocene Chrono-stratigraphy: a re-evaluation of Mediterranean type sections. Geol. Soc. Am. Bull., 103, 1049-1058.
Sayers, C.M., Johnson, G.M. and Denyer, G. [2002]. Predrill pore-pressure prediction using seismic data. Geophysics, 67, 1286-1292.
Singh, S.K., Tandon, R., Naithani, A.C. and Mishra, P. [2019]. Artificial intelligence in oil and gas exploration: A powerful tool for prediction, View project Reservoir characterization using deep learning View project Artificial Intelligent. In COER international conference on artificial intelligence and application, p.7.
Song, S., Hou, J., Dou, L., Song, Z. and Sun, S. [2020]. Geologist-level wire line log shape identification with recurrent neural networks. Comput. Geosciences, 134, 104313.
Taye, M.M. [2023]. Understanding of Machine Learning with Deep Learning: Architectures, Workflow, Applications and Future Directions. Computers, 12(5), 91.
In the past few years it has become increasingly clear that the world needs new sources of oil and gas to ease the transition to renewable sources of energy. Energy companies are exploring deeper waters and doing their utmost to enhance recovery from existing fields. As a result, geoscientists are continuing to apply ingenious reservoir engineering and geoscience solutions that are also required to prepare reservoirs for carbon capture, utilisation and storage schemes. This month we look at time-lapse gravity, deformation monitoring, new bandwith extension techniques and new methodology to determine gas saturation in low impedance sandstone.
Rasoul Sorkhabi chronicles the deepest and longest wells ever drilled for scientific research, oil and gas exploration, geothermal fields, and mining.
Gabriela Correa Godoy et al analyse the temporal evolution of atmospheric parameters, surface temperature, water vapour, aerosol optical depth and surface deformation patterns preceding seven major earthquakes that occurred between 2017 and 2023.
Mojtaba Moradi et al explore the potential application of FloFuse device application in geothermal energy systems, with an emphasis on modelling results and their implications for real-world deployment.
Wahyu Triyoso et al present a methodology to determine gas saturation in the low impedance sandstone using dispersion and attenuation attributes.
Endre Vange Bergfjord et al review the principles of time-lapse gravity and deformation monitoring and present the results of a recent pilot application of the Reach Remote platform.
Marianne Rauch et al showcase the effectiveness of a novel bandwidth extension technique applied to a newly reprocessed 3D dataset from onshore USA.
First Break Special Topics are covered by a mix of original articles dealing with case studies and the latest technology. Contributions to a Special Topic in First Break can be sent directly to the editorial office (firstbreak@eage.org). Submissions will be considered for publication by the editor.
It is also possible to submit a Technical Article to First Break. Technical Articles are subject to a peer review process and should be submitted via EAGE’s ScholarOne website: http://mc.manuscriptcentral.com/fb
You can find the First Break author guidelines online at www.firstbreak.org/guidelines.
January Land Seismic
February Digitalization / Machine Learning
March Reservoir Monitoring
April Underground Storage and Passive Seismic
May Global Exploration
June Navigating Change: Geosciences Shaping a Sustainable Transition
July Reservoir Engineering & Geoscience
August Environment, Minerals and Infrastructure
September Modelling / Interpretation
October Energy Transition
November Marine Acquisition
December Data Management and Processing
More Special Topics may be added during the course of the year.
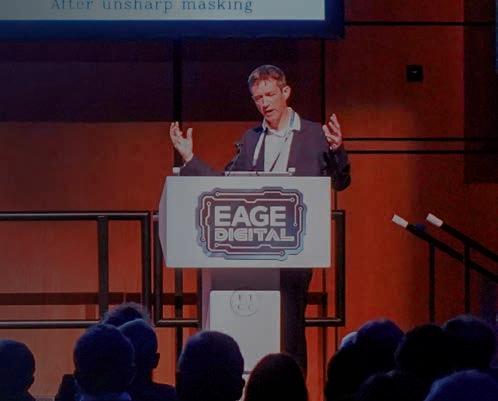
Rasoul Sorkhabi1* chronicles the deepest and longest wells ever drilled for scientific research, oil and gas exploration, geothermal fields, and mining.
Introduction
Mechanical drilling apparatus combining spring-poles, four-legged derricks, steam power, and metal drilling bits for brine and oil wells were developed in the 19th century. The first modern oil wells were drilled at oil seeps in 1846 (Bibi-Hayat) in Azerbaijan, 1854 (Bóbrka) in Poland, and 1859 (Drake Well, Titusville) in the USA. The technological change from percussion drilling to rotary drilling with diamond drill bits and fluid circulation powered by electricity made it possible to drill continuous and deep wells. This article reports on the deepest and longest wells drilled in the 20th and 21st centuries for scientific and resource exploration.
In the 1950s, sea-floor mapping revealed the dynamic nature of Earth’s interior. US scientists launched Project Mohole to drill into the mantle. In 1961, Project Mohole, using Global Marine’s oil drillship CUSS-1 (named after a consortium of Continental, Union, Superior, and Shell), drilled a hole through the Pacific Ocean floor off the island of Guadalupe. The hole penetrated 183 m of sediment at a water depth of 3600 m (Bascom, 1961). After soaring costs and controversies about the feasibility of the drilling, US Congress ceased funding Project Mohole in 1966. In 1968 the US National Science Foundation launched the Deep-Sea Drilling Project (DSDP). A new drillship, Glomar Challenger, was built for the new project, which conducted 96 expeditions in all oceans until 1983. As part of DSDP Leg 83, Glomar Challenger drilled Hole 504B in the Eastern Pacific Panama basin in 1979. The well penetrated 2111 m below sea floor
at water depth of 3460 m. The well cored pillow lava is underlain by sheeted magmatic dikes (Anderon et al., 1982). Hole 504B remains the deepest ocean-floor well drilled by the international ocean drilling project for scientific research. Another benchmark achieved by the DSDP was the 1978 drilling of Leg 60 Site 461 well in the Mariana Trench at water depths of 7034 m (Hussong and Uyeda, 1981) which remained the record for the deepest well in terms of water depth until 2021 when the Japanese research vessel Kaimei drilled a hole in the Japan Trench at a water depth of 8023 m and cored 38 m of sediments. The drilling was for earthquake studies and the coring site was close to the epicentre of Magnitude 9.1 Tohoku earthquake of 2011.
DSDP gave way to the Ocean Drilling Program (ODP, 1985-2003, using the drillship JOIDES-Resolution) which was, in turn, succeeded by the Integrated Ocean Drilling Program (IODP, 2003-2013) and International Ocean Discovery Program (IODP, 2013-). The longest mantle core ever recovered was accomplished by the IODP expedition 399 in 2023 when the JOIDES-Resolution drillship cored 1268 m of serpentinised peridotite and gabbroic intrusions from a hole drilled at water depths of 850 m atop the Mid-Atlantic Ridge at 30 degrees north (Lissenberg et al., 2024).
In 2024, the US National Science Foundation retired JOIDES-Resolution. Currently, Japan’s Chikyu and China’s Mengxiang are the most sophisticated research vessels for ocean drilling (Figure 1).
In their attempt to reach the Moho, the Russians took a more ambitious path. In 1970 the former Soviet Union began drilling
1 University of Utah
* Corresponding author, E-mail: rsorkhabi@egi.utah.edu
DOI: 10.3997/1365-2397.fb2025052
Figure 1 Major ocean floor drillships for scientific exploration: Global Mariner’s CUSS-1 (USA, 1955-1962, replaced by Glomar CUSS-II ); Glomar Challenger (USA, 1968-1983 for DSDP projects); JOIDES-Resolution (USA, 1985-2024; for ODP and IODP projects); Chikyu (‘Earth’, Japanese, 2002-present for IODP and other Japanese research projects); Mengxiang (‘Dream’, Chinese, 2023-present for IODP and other Chinese research projects). (Photo sources: Wikipedia Commons).
into the Precambrian granitic gneiss on Kola Peninsula near the Norwegian border. Using a specially constructed rig Uralmash-15000, the Russians drilled not one but five boreholes due to technical failures; the deepest hole was the 9-inch-wide Kola Superdeep Borehole SG-3 which in 1989 reached a vertical depth of 12,262 m (40,230 ft) and temperature of 180 °C. The Kola Peninsula drilling project was discontinued in 1994 due to lack of funding and technical difficulties in drilling hot, dense rocks (Figure 2). Although the project did not reach the crust-mantle Moho boundary, SG-3 remains the deepest well ever drilled vertically into the Earth’s crust. Moreover, the drilling generated valuable scientific information. For example, the well penetrated 2.7-billion-year-old Archean rocks under the Baltic shield; it found water-saturated fractured rocks in the deepest parts, plankton fossils at crustal depths of 6 km, and high levels of deep hydrogen gas, and contributed to our knowledge of mineralisation (Lobanov et al., 2021).
The German Continental Drilling Program, abbreviated KTB, drilled a borehole in Bavaria from 1987 to 1995 to a depth of 9011 m into metamorphic rocks reaching unexpectedly high temperatures of 265 °C which prevented further drilling. The KTB experience, however, led to the foundation of the International Continental Scientific Drilling Program (ICDP) in 1996.
Much scientific knowledge has been gained from drilling into geologically critical (but not necessarily deep) features such as fault zones and meteorite impact structures.
The first drill into a fault zone was made in 1995-1996 at the Nojima fault to a depth of 1800 m after the 1995 Kobe earthquake in Japan. Other fault zone drilling projects include the San Andreas Fault Observatory at Depth in California (2002-2007, two holes 2200 m and 3000 m deep), the Taiwan Chelungpu Fault Drilling Project (2004, two holes 1252 m and 2003 m deep), the Deep Fault Drilling Project at the Alpine fault in New Zealand
(2011-2014, two holes 150 m and 892 m deep), and the Wenchuan Fault Scientific Drilling Project (2008-2014, five holes 1201 m, 2283 m, 551 m, 1502 m, and 2295 m deep) in China.
The first meteorite impact structure to be drilled was the Siljan Rig structure (a 377-Ma impact within Devonian-Silurian sediments underlain by Precambrian granitic basement) in Sweden. This drilling project was led by the Nobel laurate physicist Thomas Gold who believed in the abiogenic origin of petroleum (Gold, 1999). The Siljan Rig crater was drilled beginning in 1986 to a depth of 6957 m, which is still the deepest well drilled into a meteor crater. Several other holes of 400-700 m deep were also drilled in 2011 for natural gas exploration.
In the past century, various onshore wells have been celebrated as the world’s deepest oil wells, including the following wells drilled in California (Rintoul, 1990): 1930 Standard Oil Company’s Mascot No. 1 well at a vertical depth of 2935 m (9629 ft); 1937 Union Oil’s Rio Bravo discovery well 3426 m (11,240 ft) deep; 1944 Standard Oil Company’s KCL No. 2013 well 4952 m (16,246 ft) deep; and 1953 Ohio Oil Company’s KCL-A No. 72-4 well in the Paloma field drilled to a vertical depth of 6657 m (21,842 ft). This last well was abandoned as uncommercial in 1954; however, it remains California’s deepest well on record.
The Bertha Rogers natural gas well in Oklahoma (Figure 3) drilled for Lone Star Oil Company in 1972-1974 to a depth of 9583 m (31,441 ft, where it struck molten sulphur) was the world’s deepest until 1979 when Kola SG-3 surpassed it. The Bertha Rogers well was drilled into the Cambrian-age Arbuckle carbonates in the Anadarko basin.
Chinese petroleum geologists classify onshore oil and gas reservoirs of more than 4500 m as ‘deep’ and those at more than 6000 m as ‘ultradeep’ In recent years, the Chinese have drilled ultra-deep onshore wells in the Tarim basin – geographically located in the Taklimakan Desert. In 2024, Shenditake 1 drilled
by China National Petroleum Corporation reached a vertical depth of 11,100 m where the reservoir rocks are at temperatures of more than 200°C and formation pressures over 130 megapascal. This is the deepest vertical petroleum well ever drilled.
Thanks to technological advances, drilling for oil and gas exploration has progressed from onshore to lakes, continental shelf, slope, and ultradeepwater plays (Leffler et al., 2013; Zhixin et al., 2023) (Figure 4).
Offshore well depths can be measured from either the sea level (water depth) or the sea floor (sediment depth). There is no consensus on how to categories offshore wells. In terms of water depth, the following categorise have been variously used by petroleum companies:
• Shallow water: <200 m (650 ft, almost continental shelf-slope break), <300 m (1000 ft) or <500 m (1600 ft)
• Deep water: >300 m (1000 ft) or >500 m (1600 ft)
• Ultradeep water: >1500 m (5000 ft), >1800 m (6000 ft) or >2100 m (7000 ft)
Although water depth does not necessarily reflect the subsurface geology of petroleum systems beneath sea floor, as we move away from the coastline toward deeper waters, the subsurface sediment package thins out toward the basaltic ocean crust.
The first offshore (near-shore) well was drilled by Henry L. Williams in 1897 in the Summerland oil field on the Santa Barbara Channel in California. The drilling was done off a wooden pier to a water depth of 11 m (35 ft). This well motivated drilling similar wells off Santa Barbara coast. However, it did not usher in offshore exploration. The credit for this goes to the 1947 Ker-McGee well in the Gulf of Mexico – the so-called ‘first well out of sight of land’ even though it was drilled to a water depth of only 7 m (22 ft). Tender Assist Drill, Frank Phillips, was used for this well which discovered the Ship Shoal Block 32 field. The first deepwater well was drilled in 1975 in the Gulf of Mexico by Shell at a water depth of 312 m (1,023 ft) which discovered the Cognac oil field (named after the fixed offshore platform
Figure 4 Evolution of offshore drill rigs from the shelf to ultradeepwater depths. (Image source: INDELAC Controls, 2014: https://www.indelac.com/blog/ introduction-to-oil-gas-offshore-drilling).
Cognac). The first ultradeepwater well at a water depth of 2900 m (9,500 ft) was the 2005 discovery well in the Stones oil field also by Shell in the Gulf of Mexico.
The deepest oil well by water depth ever drilled is currently Ondjaba-1 drilled in 2021 into Cretaceous targets offshore Angola to a water depth of 3627 m (11,900 ft) by Maersk Voyager for TotalEnergies. The previous records were held by Raya-1 well drilled by Maersk Venturer in 2016 offshore Uruguay at a water depth of 3400 m (11,155 ft) also for TotalEnergies targeting Cretaceous reservoirs, and the well 1-D-1 drilled by Transocean’s Dhirbubhi Deepwater KG1 drillship in 2005 in the offshore Krishna Godavari basin at a water depth of 3174 (10,411 ft).
In 2024 it was announced that Ecopetrol and Occidental Petroleum were planning to drill Komodo-1 well in Colombia’s Caribbean waters to a depth of 3900 m (11,156 ft) below sea level, but due to political conflicts between the USA and Colombia this drilling has not been made yet.
In terms of vertical sediment depths below sea floor, BP’s infamous Deepwater Horizon (or Miocene Macondo prospect) well drilled in the Tiber field in 2009 holds the record at 10,685 m (35,055 ft). The well was drilled by Transocean at a water depth of 1259 m (4,130 ft). Because Macondo is not operative, the credit for the deepest vertical well producing in the Gulf of Mexico is Chevron’s Knotty Head 1 with a depth of 10,421 m (34,189 ft) drilled in 2006 by Transocean’s Discoverer Spirit drillship.
Technological advances in offshore drilling and production, as well as novel geological concepts for petroleum exploration, have pushed the industry into deeper water depths and reservoirs. The invention of floating Spar platforms and FDPSOs (floating drilling, production, storage and offloading systems) have been instrumental in ultra-deepwater ventures. The first FDPSO drillship, Azurite, began operations in 2009 at Murphy Oil’s Azurite oil field offshore the Democratic Republic of Congo. The deepest Spar platform is Shell’s Perdido at water depth of 2450 m (8000 ft) in the Gulf of Mexico which began production in 2010. The world’s largest Spar platform is Equinor’s Aasta Hansteen in the Norwegian North Sea operating at water depths of 1300 m (4265 ft) since 2018.
Ultra-deepwater exploration has been largely motivated by toe thrust plays at the distal parts of major deltaic basins such as Nigher Delta, sub-salt plays such as those in the Gulf of Mexico, Cambos and Santos basins offshore Brazil, and offshore Angola, and more recently Cretaceous plays atop the sea-dipping reflectors (SDRs) in the offshore Guyana Suriname basins, and in the Orange basin offshore Namibia and South Africa.
The deepest and largest sub-salt oil fields discovered so far are in the Santos basin at water depths of 2000-2300 m and seafloor depths of more than 5000-5200 m. These fields (Tupi, Lapa, Sapinhoa, Jupiter, Iracema, Lara, Buzios, Libra, and Sagitario) were discovered from 2006 to 2013 by Petronas. They all have reservoirs in the 4200-m thick, Early Cretaceous sediments of the Guaratiba Group.
The SDRs are found in magma-rich continental margins such as the Orange basin. The deepest oil field sitting atop SDRs in the Orange basin is Shell’s 2022 Graff field at a water depth of 2900 m and sea floor depth of 6296 m.
The deepest wells are not necessarily the longest. Directional (or deviated) wells have shallow vertical depths but longer lateral lengths (Figure 5). Extended-reach wells are directional wells often drilled into conventional offshore reservoirs and penetrate the target formation at high angles. Horizontal stimulated wells are drilled into tight reservoirs.
The first directional well (without stimulation) was drilled in the USA in 1929 near Texon in Texas by Robert E. Lee for Big Lake Oil Company. In 1930 at Huntington Beach in California H. John Eastman drilled a directional well for Huntington Central Oil Company.
In 2008, Maersk Oil Qatar drilled an extended-reach well, BD-04A, in the Al Shaheen oil field to a total length of 12,289 m at a vertical depth of 1387 m. This record was surpassed in 2011-2015 when Exxon Neftegas drilled several extended-reach wells in Sakhalin-Okhotsk Sea: Odoptu OP-11 well (12,345 m), Z-44 Chayvo (12,376 m), Z-40 (13,000 m),
and O-14 (13,500 m) drilled into Miocene sands. In 2017, Rosneft, operator for Exxon Nefegas, drilled yet another longer extended-reach well of 15,000 m from the Orlan platform offshore Sakhalin into the Chayvo field. (In 2022, Exxon left the consortium because of Russia’s invasion of Ukraine.) However, in 2022, Abu Dhabi National Oil Company beat this record by drilling an extended-reach well of 15,240 m from the artificial island Umm Al-Anbar to the Upper Zakum field containing Lower Cretaceous-age Thamama carbonates.
The US shale revolution has hinged on drilling long horizontal wells, hydraulic fracturing monitored by microseismicity, and 3D seismic imaging of targeted tight reservoirs.
The first hydraulic fracturing was performed in 1947 Kelpeer Well No. 1, a gas well operated by Pan American Petroleum Corp. in the Hugoton field in Kansas. George Mitchell pioneered this technology on the Barnett shale gas of Texas during the 1980s and 1990s (Testa, 2016). Since then, it has been applied to a dozen tight formations in the US for enhancing fracture permeability and stimulating the productivity of horizontal wells.
The record for the longest horizontal stimulated well has changed rapidly with improved drilling technology. Today, four-mile-long ‘super laterals’ are not uncommon in tight plays. Several wells in the Big Bend field of Bakken exceed five-mile lengths. The Ordovician-age Utica shale in Ohio, in particular, has been drilled by record-breaking horizontal wells. In 2017, Eclipse drilled Outlaw C-11H for a total length of 8458 m (27,750 ft) including a horizontal section at 5944 m (19,500 ft). In 2022, Axis Energy and Ascent Resources announced the ‘largest lateral in North America’ with a well of 10,347 m (34,036 ft) total length and 7224 m (23,700 ft) lateral length into Utica Shale in Ohio. In the same year, however, ConocoPhillips completed a horizontal drill of 10,828 m in the Alpine field, a conventional onshore field in Alaska’s North Slope.
The earliest geothermal power plants date back to the early 20th century, including the Larderello plant in Tuscany in 1904 and the
well was a tragic blowout, these two photographs depict the remarkable strides the petroleum industry has made over the past 166 years.
Geysers in California in 1921 when John C. Grant successfully drilled a 200-ft well.
There are currently 198 geothermal fields with 673 individual power units in 32 countries with a combined capacity of 16,318 megawatts (Gutiérrez-Negrín, 2024). The vast majority of geothermal wells are conventional prospects drilled 2-3 km deep and produced from temperatures below 350°C.
The deepest geothermal well today is the St1 geothermal project in Otaniemi, Espoo in Finland that was drilled in 2018 to a depth of 6400 m. In April 2023 Poland began drilling a geothermal well, Banska PGP-4, in Szaflary, to a target depth of 7000 m but the drilling stopped at 5900 m in 2024, and the well has not been completed. The world’s longest geothermal well was drilled in 2021 in the UK; EG-1 Well is a deviated well with a total depth of 5277 m and vertical section of 4871 m.
Enhanced geothermal systems (EGS) require drilling directional wells into hot, dry granitic rocks. This concept and technology were transferred from the oil and gas industry to geothermal fields. A pioneer in this field is the FORGE project in Utah which has drilled and stimulated injection and production wells (McLennan et al., 2024). In 2020, FORGE drilled an injection well with a vertical depth of 2609 m (8,559 ft) and a total measured depth of 3321 m (10,897 ft). This was followed in 2023 by the drilling of a production well at a vertical depth of 2547 m (8357 ft, about 300 ft above the injection well) and total depth of 6080 (19,947 ft). The subsurface temperatures exceed 230 °C.
An interesting and novel drilling initiative for geothermal power development is Iceland’s Krafla Magma Testbed project, wich aims to drill about 2.1 km into Krafla volcanic caldera in northern Iceland. Kafka is an active volcano, and scientists have been able to map the underground position of its magma chamber from the volcano’s seismic activity. In 2009 and 2014, researchers in Iceland drilled into the crater but the hot acidic magma plugged the hole at 2 km depth. This time, scientists plan to use new alloys for drilling and cool the well depth. The project is planned to start in 2027 and if successful it will tap into high temperatures of 600 °C and superheated pressurised steam that holds ten times more energy than a normal geothermal steam.
Another new development is Quaise Energy’s plan to use a gyrotron to drill a 20-km deep well to geothermal temperatures of 500°C. The company’s plan is to use conventional rotary drilling to get to basement rock and then switch to gyrotron which vaporises rock at 11.5 ft per hour. Quaise Energy is an MIT spin-out, start-up company founded in 2018 in Houston.
Deep caves give us an interesting perspective to compare wells drilled for mining metallic deposits. The deepest known caves in the world are the Krubera and Veryovnika caves, both deeper than 2000 m located in the Arabika Massif, a glacially eroded karst topography in the Gagra Range in Georgia. There are 23 mines drilled by humans, which are deeper than these two natural caves.
There are 15 mines drilled to depths of greater than 3000 m below ground level. Of these, ten mines are located in South Africa, the deepest being the 4000-m deep Mponeng Gold mine which began operating in 1986. Adjacent to Mponeng are the world’s second and third deepest mines: Tau Tona (3900 m deep operating since 1968) and Savuka (3700 m that operated from 1962-2024). These three mines are interconnected by underground shafts at different levels. They were owned by Anglo-Gold Ashanti until they were bought by Harmony Gold in 2020.
The largest mine in terms of volume is the Bingham Canyon (Kennecott) Copper Mine in Utah which is an open pit mine measuring 4.5 km wide and 1.2 km deep, has been producing since 1906 and is now operated by Rio Tinto. This is the largest human-made excavation.
The first oil wells drilled in the mid-19th century were 20-30 m deep. Today we drill more than 10 km below the sea floor (Figure 6). Drilling deep wells, coring, and subsurface imaging were made possible largely by technological advances in the oil and gas industry. Deep drilling has contributed to scientific research as well as resource exploration. While ultradeep drilling will be useful, we should not overlook the importance of easily accessible rocks and resources at shallow depths. For instance, ophiolites
and xenoliths are valuable rock samples from deeper crustal levels. Alternatively, novel techniques in enhanced oil recovery can tap into already explored fields which still contain half of their oil in place. Major limitations in deep drilling, aside from financial restrictions, are from elevated temperatures (geothermal gradient) in the subsurface. Drilling technologies will continue to advance and take us deeper into the Earth’s crust. For instance, high-power laser drilling, which is faster and non-invasive, has caught some attention and may revolutionise the drilling industry by replacing the traditional rotary drilling practices.
Anderson, R.N. et al. [1982]. DSDP Hole 504B, the first reference section over 1 km through Layer 2 of the oceanic crust. Nature, 300(5893), 589-594.
Bascom, W. [1961]. A Hole in the Bottom of the Sea: The Story of the Mohole Project. Doubleday, New York.
Gold, T. [1999]. The Deep Hot Biosphere. Copernicus/Springer Verlag, New York.
Gutiérrez-Negrín, L.C. [2024]. Evolution of worldwide geothermal power 2020–2023. Geothermal Energy, 12-14, 1-60. doi.org/10.1186/ s40517-024-00290-w.
Hussong, D.M. and Uyeda, S. [1981]. Tectonics in the Marina Arc: Results of Recent Studies, Including DSDP Leg 60. Oceanologica Acta, special issue, 203-212.
Leffler, W.L., Pattarozzi, R. and Sterling, G. [2003]. Deepwater: Petroleum Exploration & Production. PennWell, Tulsa.
Lissenberg, C.J. et al. [2024]. A long section of serpentinized depleted mantle peridotite. Science, 385(6709), 623-629.
Lobanov, K.V., Chicherov, M.V. and Sharov, N.V. [2021]. The 50th Anniversary of the Start of Drilling the Kola Superdeep Well. Arktika i Sever (Arctic and North), 44, 267-284.
McLennan, J., Moore, J. and England, K. [2024]. Drilling, fracturing, and characterizing Enhanced Geothermal Systems. CEP, American Institute for Chemical Engineers, 8(June), 1-8.
Rintoul, W. [1990]. Drilling Through Time: 75 Years with California’s Division of Oil and Gas. California Department of Conversation, Department of Oil and Gas.
Testa, S.M. [2016]. From the Battle of Fredericksburg to Promised Land–an historical perspective on well stimulation and hydraulic fracturing. Oil-Industry History, 17, 7-27.
Zhixin, W. et al. [2023]. Analysis of the world deepwater oil and gas exploration situation. Petroleum Exploration and Development, 50(5), 1060-1076.
Gabriela Correa Godoy1* and Carlos Alberto Vargas Jiménez1 analyse the temporal evolution of atmospheric parameters, surface temperature, water vapour, aerosol optical depth and surface deformation patterns preceding seven major earthquakes that occurred between 2017 and 2023.
Abstract
Understanding pre-seismic gases and surface anomalies is crucial for improving earthquake risk assessment. This study analyses remote sensing data from Sentinel-5P, Aqua-AIRS, and Sentinel-1 satellites to detect potential pre-seismic anomalies associated with seven earthquakes (M > 6) between 2017 and 2023. Atmospheric variables (CO, CH4, CO2, O3, surface temperature, water vapour, and aerosol optical depth) and surface deformation patterns were evaluated two to five months before the main events. Results reveal consistent trends, particularly in gases, although differences between events suggest the influence of tectonic setting and seismic preparation processes. These findings support integrating multi-parameter remote sensing data into pre-earthquake monitoring strategies.
Introduction
Identifying reliable seismic precursors remains one of the most significant challenges in earthquake science due to the complexity and variability of tectonic processes (Wright, 2002). Recent studies have demonstrated that major earthquakes are often
preceded by atmospheric and surface anomalies, such as changes in gas concentrations, surface temperature, and ground deformation (Akhoondzadeh and Marchetti, 2023; Cui et al., 2024). Advances in satellite remote sensing have enabled systematic monitoring of these phenomena, offering new insights into lithosphere-atmosphere coupling before seismic events (Akhoondzadeh, 2024).
However, the behavior of atmospheric and surface anomalies across different tectonic settings remains poorly understood (Meng and Zhang, 2021). The release of gases such as methane (CH4), carbon dioxide (CO2), and carbon monoxide (CO) has been associated with rock fracturing processes and fluid migration within the Earth’s crust before seismic events (Cui et al., 2017; Pulinets and Ouzounov, 2010). These emissions can temporarily alter atmospheric composition, generating anomalies detectable by remote sensors. Additionally, tectonic stress accumulation can produce millimetric surface deformations that, while imperceptible to traditional ground-based methods, can be captured by satellite radar interferometry (Wright, 2002).
This study analyses the temporal evolution of atmospheric parameters (CO, CH4, CO2, O3, surface temperature, water
Table 1 Characteristics of the seven seismic events analysed (date, magnitude, depth, tectonic setting, fault type).
1 National University of Colombia
* Corresponding author, E-mail: gacorreag@unal.edu.co DOI: 10.3997/1365-2397.fb2025053
vapour, and aerosol optical depth) and surface deformation patterns preceding seven major earthquakes (M > 6) that occurred between 2017 and 2023. We use data from the Sentinel-5P (TROPOMI), Aqua-AIRS, and Sentinel-1 satellites to identify potential pre-seismic anomalies, evaluate their consistency across different seismic environments, and explore their implications for earthquake risk assessment.
This study analyses seven seismic events with magnitudes greater than 6 (M > 6), occurring between 2017 and 2023, in diverse tectonic environments (Table 1). Atmospheric parameters — carbon monoxide (CO), methane (CH4), carbon dioxide (CO2), ozone (O3), surface temperature, total column water vapour, and aerosol optical depth — were extracted from Sentinel-5P TROPOMI, Aqua-AIRS, and OCO-2 GEOS satellite products. Surface deformation data were obtained from Sentinel-1 SAR imagery.
The main characteristics of the analysed parameters, including satellite data sources, units, spatial resolution, and vertical sampling, are summarised in Table 2.
Atmospheric variables were processed using the Nasa Giovanni platform and Google Earth Engine (GEE), employing daily average values extracted from rectangular areas approximately 6° × 6° centered around each epicentre, defined by specific coordinate limits. The temporal analysis covered approximately five months before each seismic event.
Time series analysis was performed using log-log scaling to identify stability behaviours and slope changes in the analysed variables, which may indicate transitions in the physical processes preceding an earthquake. The interquartile range (IQR) method was also applied to complement the statistical identification of anomalies, considering outliers as values falling outside the Q1-1.5×IQR and Q3 + 1.5×IQR thresholds.
Surface deformation analysis using InSAR was conducted for two selected events, based on the availability and quality of Sentinel-1 data. The PyGMTSAR software, following the Small Baseline Subset (SBAS) approach, generated interferograms and deformation time series. Sentinel-1 SLC images were downloaded from the Alaska Satellite Facility (ASF) Data Search Portal, and topographic corrections were applied using SRTM DEM data.
Displacement maps covering the epicentral areas were produced. A point of maximum deformation (identified from the LOS displacement map) was selected to extract meaningful ground displacement time series. A reduced spatial buffer (approximately 3 × 3 pixels) centered on this point was applied to minimise noise and spatial averaging effects. This approach allowed for a more accurate monitoring of localised pre-seismic surface deformation preceding the Jiashi, China earthquake.
This combined analysis aimed to detect consistent pre-seismic anomalies in atmospheric parameters and surface deformation across different seismic environments.
To illustrate the results more clearly within the figure limitations, the case of the Jiashi, China earthquake (M6.4, 2020) is presented in detail below. Comparative analysis across all seven studied events will be discussed later in the Discussion section (Figure 1).
Surface deformation analysis before the Jiashi, China earthquake (M6.4, 2020)
Surface deformation was analysed using Sentinel-1 SAR data processed with PyGMTSAR software, following the Small Baseline Subset (SBAS) methodology. Due to data availability constraints, the analysis focused exclusively on the Jiashi, China earthquake (M6.4, 2020).
An interferogram covering the coseismic period was generated using a pair of Sentinel-1 images that included the date of the earthquake (19 January 2020). This interferogram (Figure 2a) revealed apparent deformation associated with the seismic rupture, showing coherent phase patterns and displacement fringes near the epicentral area.
The line-of-sight (LOS) displacement map (Figure 2b) indicates a differential ground movement, with cumulative displacements reaching approximately 80 mm. Zones of uplift and subsidence are visible across the fault rupture area.
To analyse surface deformation before the earthquake, a time series of LOS displacement was constructed from interferometric pairs covering approximately five months before the mainshock (from August 2019 to January 2020). A point of maximum deformation was selected based on the coseismic displacement map, and a reduced spatial buffer (approximately 0.3°) was applied for time series extraction (Figure 2c).
The displacement time series remained relatively stable throughout most of the monitoring window, showing fluctuations that did not exceed the typical uncertainty threshold for InSAR measurements (5–7 mm; Hooper et al., 2004). A sudden displacement was recorded exactly on the day of the earthquake, with no clear pre-seismic trend detected in the preceding months.
These results suggest that no conclusive pre-seismic surface deformation trend could be identified within the analysed fivemonth window. Extending the observation window to longer periods may be necessary to better evaluate the potential existence of pre-seismic deformation processes in similar tectonic settings.
Figure 2 InSAR-based deformation analysis of the Jiashi earthquake. (a) Interferometric phase map (Sentinel-1); (b) Line-of-sight (LOS) displacement map; (c) Time series of deformation at the point of maximum displacement.
Atmospheric Anomalies Detected Before the Jiashi, China Earthquake (M6.4, 2020)
The analysis of atmospheric parameters before the Jiashi earthquake revealed diverse behaviours across the studied variables, with several showing significant trends approximately 100 to 145 days before the mainshock. The raw time series and log-log transformations were analysed to identify changes in stability and slope, potentially associated with physical transitions during the seismic preparation phase. Figures 3 to 6 summarise the observed behaviours for each variable.
Methane concentration remained relatively stable during the early monitoring period but showed a clear downward trend starting approximately 135 days before the earthquake. In the log-log scaling (Figure 3b), a slope change becomes evident, suggesting a transition toward a perturbed state associated with decreasing CH4 levels.
Carbon monoxide levels exhibited a moderate decreasing trend that began about 107 days before the mainshock. The log-log plot (Figure 3c) confirms a slope shift in the same timeframe, reinforcing the interpretation of perturbations in atmospheric emissions potentially linked to tectonic stress accumulation.
The carbon dioxide time series initially displayed stability, but a notable downward trend started approximately 123 days before the earthquake. The log-log analysis (Figure 4b) highlights this change clearly, indicating alterations in CO2 emissions during the pre-seismic phase.
Ozone concentrations remained relatively constant until around 100 days before the earthquake, when a clear increasing trend was
Figure 3 Temporal evolution of atmospheric methane (CH4) and carbon monoxide (CO) concentration anomalies before the Jiashi earthquake. (a) Daily average time series (CH4); (b) Log-log trend showing deviation from stability (CH4). (c) Daily average time series (CO); (d) Log-log trend showing deviation from stability (CO).
Figure 4 Temporal evolution of atmospheric carbon dioxide (CO2) and ozone (O3) concentration anomalies before the Jiashi earthquake. (a) Daily average time series (CO2); (b) Log-log trend showing deviation from stability (CO2); (c) Daily average time series (O3); (d) Log-log trend showing deviation from stability (O3).
observed. The log-log transformation (Figure 4d) demonstrates a shift toward a positive slope, consistent with an atmospheric perturbation preceding the seismic event.
temperature
Surface temperature exhibited a prolonged decreasing trend throughout the monitoring window, with a significant drop starting approximately 145 days before the earthquake. This behaviour is visible in the raw series and the log-log scaling
(Figure 5b), suggesting surface cooling concerning pre-seismic processes.
Total column water vapour
Water vapour content remained relatively stable until about 109 days before the mainshock, when a significant decrease commenced. The log-log plot (Figure 5d) indicates an apparent change in slope, suggesting that atmospheric moisture dynamics were affected during the months leading up to the earthquake.
5 Temporal evolution of surface temperature and water vapour anomalies before the Jiashi earthquake. (a) Daily average time series ST; (b) Log-log trend showing deviation from stability ST; (c) Daily average time series WV; (d) Log-log trend showing deviation from stability WV.
Aerosol optical depth showed considerable variability throughout the period; however, aerosol values increased approximately 115 days before the mainshock. The log-log analysis (Figure 6b) reveals a pronounced positive slope, indicating enhanced atmospheric activity potentially linked to lithosphere-atmosphere interactions before the earthquake.
The trends detected in seven atmospheric variables were systematised for all studied events to compare the atmospheric behaviours prior to earthquakes in different tectonic contexts. Table 3 summarises the approximate number of days before the earthquake in which anomalies were detected, the direction of the trend (increase or decrease), the type of fault, and the focal mechanism associated with each event.
The results show that clear and measurable atmospheric anomalies were identified for all seven seismic events in at least some of the variables analysed. These perturbations were generally observed between 50 and 145 days before the main shock, indicating a consistent temporal window during which such anomalies can be detected.
Regarding the behaviour of specific variables, methane (CH4) and carbon monoxide (CO) exhibited decreasing trends in most cases, particularly in events associated with reverse faults in compressional settings. However, events like Mexico (Puebla) and Turkey showed opposite behaviour, with rising trends. Ozone (O3) and carbon dioxide (CO2) presented more variable patterns, with some events showing increases and others decreases. For example, CO2 increased significantly before the China (Jiashi) and Iran-Iraq events, while it decreased in Mexico (Puebla) and California.
Surface temperature predominantly showed a downward trend, except in Haiti, where a rise was recorded. Similarly, water
Figure 6 Temporal evolution of aerosol optical depth (AOD) anomalies before the Jiashi earthquake. (a) Daily average time series; (b) Log-log trend showing deviation from stability.
vapour content also exhibited mixed behaviour, with increases observed in Mexico (Puebla) and Haiti and decreases in China and Turkey. The aerosol optical depth (AOD) displayed diverse patterns, with rising trends observed before the China and Turkey events, and decreasing ones in the remaining cases.
These findings indicate that while the direction of atmospheric trends is not uniform across all events, the presence of detectable anomalies is consistent. It suggests a systematic relationship between seismic processes and atmospheric var-
Table 4 Qualitative scoring of anomaly clarity per atmospheric variable and seismic event. 0 = No anomaly, 1 = Weak trend, 2
Not available.
iability. The fact that some variables increase while others decrease does not diminish their potential as indicators. Instead, it reflects the influence of local geological, structural, and possibly biochemical conditions on gas migration and release dynamics.
Discussion
Relationship between fault type, tectonic deformation, and detected atmospheric trends
The results obtained in this study show that, although apparent atmospheric anomalies were identified before all the seismic events analysed, the direction and magnitude of these anomalies vary depending on the tectonic environment and fault type associated with each earthquake.
Recent studies, such as Cui et al. (2024), have highlighted that extensional deformation zones or transform fault environments facilitate the release of gases such as CH4 and CO2 into the atmosphere due to increased crust fracturing and higher fault permeability. In contrast, continental collision zones and intracontinental compressional settings tend to act as gas sinks or exhibit less efficient gas release.
Comparing these findings with the results of this study, it is observed that events associated with subduction zones or transform faulting, such as those in Mexico (Michoacán), California, and Turkey, exhibited clear and consistent trends in multiple atmospheric variables. However, significant atmospheric anom-
alies were also detected in events located in compressional environments, such as Iran-Iraq and China (Jiashi). It suggests that, besides the regional tectonic regime, local factors such as pre-existing fracturing, fault connectivity, hydrogeological characteristics, and near-surface biochemical processes play a critical role in gas migration and release.
The qualitative evaluation of trend clarity (Table 4) supports these observations. Variables such as methane (CH4), carbon monoxide (CO), and surface temperature showed anomalies across multiple events, confirming their potential as seismic precursor candidates. In contrast, variables such as ozone (O3), carbon dioxide (CO2), water vapour, and aerosol optical depth (AOD) displayed more heterogeneous behaviours among the analysed events.
The variability observed in the direction of the trends, whether an increase or a decrease occurred before the seismic event, can be explained by the combined influence of several factors. These include the type of tectonic deformation, crustal permeability, stress accumulation dynamics, and microbial activity in surface soils, as also proposed by Cui et al. (2024).
These findings highlight the inherent complexity of the seismic preparation process and reinforce the need for regionalised studies that consider both the broader tectonic environment and local geological characteristics to better interpret atmospheric anomalies as potential earthquake precursors.
The analysis conducted in this study allowed the detection of explicit and systematic anomalies in atmospheric variables before seven seismic events, with manifestations predominantly observed between 50 and 145 days before the mainshock. The variables that showed the most consistent performance as potential indicators were carbon dioxide (CO2), ozone (O3), and carbon monoxide (CO), reflecting greater stability and reliability in their trends.
According to the results, the average lead times for anomaly appearance were approximately 88 days for methane (CH4), 111 days for carbon monoxide (CO), 78 days for ozone (O3), and 81 days for carbon dioxide (CO2). These findings suggest that continuous monitoring of these variables could be valuable for identifying potential precursor signals across different seismic contexts.
Although events associated with subduction zones and transform faulting displayed more consistent trends, significant atmospheric anomalies were also detected in continental collision and intracontinental compressional settings. It highlights the influence of local factors, such as crustal fracturing, fault connectivity and hydrogeological conditions on atmospheric gas behaviour before earthquakes.
Regarding surface deformation, the analysis based on InSAR time series did not reveal conclusive pre-seismic trends within the five-month observation window. This result suggests that slow or cumulative deformation processes may require extended monitoring periods to detect reliably.
The development of multivariable analyses that integrate different atmospheric and lithospheric variables, tailored to the tectonic characteristics of each region, is considered crucial. Combining these observations with geophysical, geochemical, and satellite data could strengthen anomaly interpretation and enhance the predictive capability of monitoring systems.
Looking forward, the design of predictive algorithms that incorporate the specific dynamics of each tectonic environment represents a key step towards consolidating atmospheric variables as effective tools for seismic risk monitoring and evaluation.
References
Akhoondzadeh, M. [2024]. Earthquake prediction using satellite data: Advances and ahead challenges. Advances in Space Research
Akhoondzadeh, M. and Marchetti, D. [2023]. Study of the preparation phase of Turkey’s powerful earthquake (February 6th, 2023) by a geophysical multi-parametric fuzzy inference system. Remote Sensing, 15(9), 2224.
Cui, Y., Huang, J., Zeng, Z. and Zou, Z. [2024]. CO emissions associated with three major earthquakes occurring in diverse tectonic environments. Remote Sensing, 16(3), 480.
Cui, Y., Ouzounov, D., Hatzopoulos, N., Sun, K., Zou, Z. and Du, J. [2017]. Satellite observation of CH4 and CO anomalies associated with the Wenchuan MS 8.0 and Lushan MS 7.0 earthquakes in China. Chemical Geology, 469, 185-191.
Cui, Y., Sun, F., Huang, J., Jiang, L., Zou, Z. and Du, J. [2024]. Variations in CH4 and CO2 emissions linked to tectonic deformation: Insights from satellite observations. Geochemistry, Geophysics, Geosystems, 25(4).
Hooper, A., Zebker, H., Segall, P. and Kampes, B. [2004]. A new method for measuring deformation on volcanoes and other natural terrains using InSAR persistent scatterers. Geophysical Research Letters, 31(23), L23611.
Huang, Y., Cui, J., Zhima, Z., Jiang, D., Wang, X. and Wang, L. [2024]. Construction of a fine extraction process for seismic methane anomalies based on remote sensing: The case of the February 6th, 2023, Türkiye–Syria earthquake. Remote Sensing, 16(16), 2936.
Khan, M.M., Ghaffar, B., Shahzad, R., Khan, M.R., Shah, M., Amin, A.H., Eldin, S.M., Naqvi, N.A. and Ali, R. [2022]. Atmospheric anomalies associated with the 2021 Mw 7.2 Haiti earthquake using machine learning from multiple satellites. Sustainability, 14(22), 14782.
Meng, Q. and Zhang, Y. [2021]. Discovery of spatial-temporal causal interactions between thermal and methane anomalies associated with the Wenchuan earthquake. The European Physical Journal Special Topics, 230(1), 247-261.
Panchal, H., Saraf, A.K., Das, J. and Dwivedi, D. [2022]. Satellite-based detection of pre-earthquake thermal anomaly, coseismic deformation, and source parameter modelling of past earthquakes. Natural Hazards Research, 2, 287-303.
Pechnikov, A. [2025]. PyGMTSAR (Python InSAR) [Software]. INSAR.dev. Pulinets, S. and Ouzounov, D. [2010]. Lithosphere-Atmosphere–Ionosphere Coupling (LAIC) model – A unified concept for earthquake precursors validation. Journal of Asian Earth Sciences, 41(4-5), 371-382.
Velázquez-Bucio, M.M., Ferrario, M.F., Lacan, P., Muccignato, E., Pizza, M., Sridharan, A., Porfido, S., Gopalan, S., Núñez-Meneses, A. and Michetti, A.M. [2024]. Environmental effects and ESI-07 intensity of the Mw 7.7, September 19th, 2022, Michoacán, Mexico, earthquake. Engineering Geology, 343, 107776.
Wright, T.J. [2002]. Remote monitoring of the earthquake cycle using satellite radar interferometry. Philosophical Transactions of the Royal Society A: Mathematical, Physical and Engineering Sciences, 360(1801), 2873–2888.
Xu, X., Chen, S., Yu, Y. and Zhang, S. [2021]. Atmospheric anomaly analysis related to Ms > 6.0 earthquakes in China during 2020-2021. Remote Sensing, 13(20), 4052.
Zheng, C., Cui, Y., Jiang, L., Huang, J., Sun, F., Zou, Z. and Du, J. [2023]. Variations of multiple gaseous emissions associated with the great Sumatra earthquakes in 2004 and 2005. Chemical Geology, 618, 121311.
A new EAGE Special Interest Community is connecting geoscientists around the challenges of communication and public engagement, and developing skills that make a real impact on the conversation.
IAIN STEWART
EAGE Geoscience
Communication and Public
Engagement Community,
RSS/University of Plymouth
Modern geoscience needs better ‘Earth stories’ and geoscientists – the narrators of the planet’s ancient past – need to become better storytellers to translate dry, abstract technical information into compelling narratives that resonate with non-geoscience audiences and help them navigate future energy trajectories.
LAUNCHED IN 2025
STUDENTS CAN APPLY FOR A FREE FIRST YEAR OF MEMBERSHIP (RE)ACTIVATE YOUR MEMBERSHIP TODAY!
100% MULTIDISCIPLINARY SKILLS THAT MAKE A DIFFERENCE
Mojtaba Moradi1* explores the potential application of the FloFuse device application in geothermal energy systems, with an emphasis on modelling results and their implications for real-world deployment.
Introduction
As the global energy landscape transitions towards low-carbon and renewable energy sources, geothermal energy has emerged as a promising candidate due to its ability to provide stable, base-load power. Unlike solar or wind energy, geothermal power is not subject to weather variability, making it a reliable pillar for clean energy generation. However, geothermal systems are not without challenges. One of the most significant issues affecting their performance and longevity is thermal short-circuiting, where cold injected fluids bypass the hot rock matrix via high-permeability pathways and return to production wells prematurely. This undermines the efficiency of heat extraction, limits long-term sustainability, and affects project economics.
Drawing inspiration from advancements in the oil and gas sector, particularly in enhanced well completions, geothermal researchers and engineers are now exploring FloFuse, the world first Autonomous Flow Control device in the market. FloFuse offers dynamic, zone-specific flow regulation without requiring external controls or real-time data feeds. Originally used in oil and gas for managing water, steam, CO2 and gas injection and production profiles, FloFuse are now being considered for geo-
thermal systems to mitigate thermal short-circuiting and optimise reservoir heat sweep.
This article explores the potential application of the FloFuse device application in geothermal energy systems, with an emphasis on modelling results and their implications for real-world deployment.
Geothermal reservoirs often mirror characteristics of oil and gas fields. They range in enthalpy (thermal energy content), with low enthalpy systems having lower temperatures (typically <150°C) and high enthalpy systems reaching up to 350°C. Depending on geology, these reservoirs can be naturally porous or fractured, or in the case of Enhanced Geothermal Systems (EGS), require stimulation through hydraulic fracturing to improve permeability.
Regardless of the type, geothermal operations frequently face challenges such as:
• Thermal short-circuiting: Injected cold water flows preferentially through highly permeable fractures, bypassing the rock matrix and returning to production wells too quickly and when it’s too cool.
1 TAQA Well Completions
* Corresponding author, E-mail: mojtaba.moradi@tq.com
DOI: 10.3997/1365-2397.fb2025054
• Thermal drawdown: Long-term extraction leads to a gradual reduction in reservoir temperature as shown in Figure 1.
• Reservoir flow imbalance: Uneven flow paths reduce the effective sweep area of injected fluids.
The latest field data from major geothermal projects such as FORGE (Utah, USA) [0] and Soultz-sous-Forêts (France) have highlighted these problems. For instance, studies at Soultz indicated that one dominant fracture was responsible for transporting 70% of the injected fluid, drastically reducing the effectiveness of other available heat exchange zones.
The above are very well-known challenges for oil and gas operators. Advanced well completion is an important aspect of reservoir management nowadays and the utilisation of such completions leads to efficient zonal extraction thus increasing productivity and efficacy of the field [0,0&0].
FloFuse Autonomous Flow Control devices provide a technological solution to these problems. By providing zone-specific flow regulation without the need for intervention or diagnostics systems, such technologies can adapt in realtime to the evolving reservoir conditions, rebalancing the flow dynamically and improving the thermal contact between injected fluids and rock.
FloFuse offers all the function of conventional ICDs and also adjust automatically in response to local flow conditions as explained below.
FloFuse operates in two states:
1. Open state: Functions like a passive device, allowing normal fluid passage.
2. Closed state (tripped): When flow exceeds a threshold (due to a developing high-permeability path or ‘thief zone’), the valve closes automatically, diverting fluid to less conductive regions.
The closed state is permanent if the conditions are met. However, the reversibility of the device allows for returning to the open position autonomously if reservoir conditions stabilise or rebalance. The valve can reopen, maintaining dynamic adaptability throughout the well’s life.
This self-regulating mechanism relies solely on hydro-mechanical triggers, eliminating the need for downhole electronics, surface communication, or active intervention. The simplicity and robustness of the design make it particularly suitable for the harsh and unpredictable conditions found in geothermal environments.
Extensive flow loops tests have validated the FloFuse performance under geothermal conditions. Flow tests revealed that once a specific pressure drop threshold is crossed, the valve closes, limiting outflow into thief zones. Figure 3 shows an example of such performance curves for a combination of one FloFuse and a bypass FloExtreme devices. The Figure shows the combination allows production/ injection of up to 145 m3/d of water before FloFuse closes and the flow path would be limited to FloExtreme device only. The closure thresholds can be customised-based reservoir conditions, providing flexibility for various geothermal applications.
Parameter
Reservoir Dimension
Description (Value)
41*25 (m) in X, 80*25 (m) in Y, 40*5 (m) in Z
Reservoir Contact length 200 m
Reservoir Pressure
Wellbore 8.5-inch openhole, 6 5/8 inch completion
Injection/Production Rate 12000 SM3/d
Table 1 The model specifications.
Implementing FloFuse completion in geothermal fields involves following:
• FloFuse Completion design: Like other FCDs completion, these devices should be installed in several completion zones in the well by annular flow isolation tools like swell packers to provide independent control to each layer. The device could be mounted on screens and/or joints/subs in the wells as shown in Figure 4. Each zone normally comprises both FloFuses and ICDs to deliver optimum performance. When the autonomous valve shuts, the bypass ICDs will still deliver the minimum flowrate desired to the zone. If this is not required, the ICDs could be opted out.
• Customisation: Trigger points for each autonomous device would be tailored to reservoir-specific conditions and expected flow.
• Model-guided Optimisation Exercise: Although the devices are autonomous, further performance optimisation could be achieved by performing comprehensive simulations modelling to find the optimal number of devices and their placement reducing trial-and-error and the impacts of uncertainty.
• Dynamic Autonomous Function: Designed to operate proactively and without external intervention, the device
autonomously modulates flow based on the local pressure and fluid properties. When deployed along the wellbore or within specific reservoir zones, these devices respond dynamically to shifts in flow rate, selectively increasing resistance to flow in higher-permeability (thief) pathways. This effect forces fluid into lower-permeability regions, thereby increasing the residence time of the fluid within the geothermal reservoir and enhancing thermal exchange.
To understand the real-world impact of FloFuse in geothermal systems, a modelling study was undertaken. The simulation evaluated how FloFuse influences fluid distribution, temperature propagation and overall heat recovery across different reservoir scenarios.
The simulation model is set based on a sandstone reservoir with average temperatures around 57°C. Two vertical wells (injection and production) were placed 700 m apart, each completed over 200 m of reservoir contact (from 1000 mMD to 1200 mMD).
This is a representative of 1 to 1 pattern in a geothermal system – that an injection supports a production well directly with injection of 12 kSM3/d (~75.5 mSTB/D) of cold water with a temperature of 20C. The production well is also constrained to a constant production rate of 12 kSM3/d for 10 years. As the wells are vertical, a gradient was applied on reservoir temperature with an average temperature of 57C as shown in Figure 5. Table 1 lists the model’s properties with its layers.
Here we made few simplifications in the model to be able to showcase and explain the impacts of FloFuse completion in geothermal systems including disregarding the impacts of the hydro/thermos/chemo process on rock properties, improper well and fracture design as well as tortuosity of flow path due to heterogeneity far from the wellbore of such natural fracture networks, faults and shale layers. As explained previously, one of the most valuable contributions of FloFuse completion lies in its capacity to manage uncertainties, which would be the case for real geothermal projects, associated with the above phenomena.
The case simulated a reservoir with static and dynamic heterogeneities as reflective of real-world geothermal fields, where temperature and pressure gradients, fracture development and rock-fluid interactions dynamically alter permeability.
Here, the wells are divided into 8 zones with 7 packers and a uniform number of FloFuse and ICDs and are included in each zone to achieve optimal performance. In the event of the autonomous valve closure, the bypass ICD will continue delivering the minimum desired flow rate to the zone. Figure 7 shows the uniformisation of temperature front propagation for FloFuse completion against base case. It illustrates that FloFuse completion reduces the outflux and influx at the highest permeability zones and diverts the denied fluid toward into the low productivity zones. This will enhance the sweep of the heat towards the production well. The FloFuse wells and reservoir models are coupled using multisegmented wells options and nozzle-type ICD devices are modelled by Equation 1:
Results and key findings:
• The reservoir experienced severe flow channelling in the base case, leading to premature thermal decline as shown in Figure 7.
• High-permeability zones that previously dominated fluid intake were restricted once flow thresholds were surpassed as
Figure 6 Temperature profile propagation from injector towards producer for various completions, t=5 years.
Figure 7 Output fluid temperature at surface over time for basecase vs FloFuse completion.
shown in Figure 6. FloFuse significantly improved fluid distribution along the wellbores.
• FloFuse-equipped completions adapted to changing conditions by shutting off dominant flow zones as they developed. Delayed thermal breakthrough resulted in more sustained energy output.
• The FloFuse completion has resulted in four years delay for the cold front to reach the production well.
• Output temperature increased by up to 7.8°C, translating to a 16% improvement in heat extraction efficiency over a 10-year period as shown in Figure 7.
These results demonstrate the robustness of FloFuse in managing dynamic reservoir conditions and maximising thermal output, especially in challenging EGS environments.
Beyond improving heat efficiency, FloFuse completion deployment in geothermal energy projects presents several broader benefits:
1. Economic gains: Improved thermal efficiency leads to higher power output per unit of injected water, enhancing return on investment.
2. Sustainability: Extended reservoir life reduces the need for new drilling and associated surface disturbance.
3. Derisking geothermal investment: By mitigating common subsurface uncertainties, FloFuse make geothermal projects more attractive to investors and developers.
Moreover, as the geothermal sector continues to evolve towards more complex systems such as closed-loop geothermal and supercritical geothermal, tools like FloFuse will play a crucial role in managing flow behaviour and ensuring long-term reservoir performance.
Conclusion
The application of FloFuse Autonomous Flow Control Devices represents a significant advancement in geothermal reservoir management. These devices address a critical inefficiency in geothermal systems (thermal short-circuiting) by ensuring more balanced and adaptive fluid distribution. As demonstrated through laboratory validation and numerical modelling, FloFuse can improve heat extraction efficiency by up to 16%, extend reservoir longevity and boost economic performance. Given their proven success in oil and gas and their potential in renewable energy systems, FloFuse is well-positioned to become a standard technology in the next generation of geothermal developments. By incorporating smart, passive control at the reservoir level, geothermal operators can unlock deeper, more challenging resources, contributing significantly to the global push for sustainable energy.
References
McClure, M.W. [2025]. Preliminary Analysis of Results from the Utah FORGE Project. Proceedings of the 50th Workshop on Geothermal Reservoir Engineering, Stanford University, 10-12 February 2025, SGP-TR-229.
Controlling the Conformance of Injection Fluids. Paper presented at the SPE Conference at Oman Petroleum & Energy Show, Muscat, Oman, March 2022. doi: https://doi.org/10.2118/200177-MS
Moradi, M., Arlen, C. and Konopczynski, M. [2024]. Optimizing Ultra Heavy Oil Recovery by Enhancing Steam Injection Conformance Using Autonomous Outflow Control Devices. Paper presented at the SPE Thermal Well Integrity and Production Symposium, Banff, Alberta, Canada, December 2024. doi: https://doi. org/10.2118/223073-MS
Moradi, M., Kvilaas, G.F. and Konopczynski, M.R. [2024]. Performance Evaluation of Autonomous Outflow Control Devices in Various Injection Wells, Field Data Review of the Technology Deployments. Paper presented at the International Petroleum Technology Conference, Dhahran, Saudi Arabia, February 2024. doi: https://doi. org/10.2523/IPTC-23391-MS
Riyami, S., Moradi, M. and Marimuthu, R. [2024]. Achieving Optimal Injection Conformance with Autonomous Outflow Control Devices in Fractured Reservoirs: Case Studies in the South Oman Fields. Paper presented at the ADIPEC, Abu Dhabi, UAE, November 2024. doi: https://doi.org/10.2118/222323-MS
Xie, H., Sun, H., Yu, W., Leines-Artieda, J. and Sepehrnoori, K. [2021]. Efficient Modeling of Enhanced Geothermal System with 3D Complex Hydraulic and Natural Fractures. Paper presented at the SPE/ AAPG/SEG Unconventional Resources Technology Conference, Houston, Texas, USA, July 2021. doi: https://doi.org/10.15530/ urtec-2021-5526
Zhang, Q. and Taleghani, A.D. [2024]. Downhole flow control: A key for developing enhanced geothermal systems in horizontal wells. Renewable Energy, 237, Part A, 121578, ISSN 0960-1481, https:// doi.org/10.1016/j.renene.2024.121578
Moradi, M. and Todman, S. [2022]. The Dynamic Performance Evaluation of the New Generation of Outflow Control Devices Autonomously ADVERTISEMENT
E-Lectures, Distinguished Lecturer Webinars, How-to-Videos
Extensive, Self-Paced, Interactive, EAGE Education Tours
Online courses provided by EAGE partners
Explore all the courses in our catalogue!
Don’t miss out — register for the Sixth Borehole Geology Workshop and field trip by 21 August to grab the early bird rate and save your spot at this exciting geological adventure!
Early Registration deadline: 21 August 2025
Register now!
WWW.EAGE. ORG
STRUCTURAL EVOLUTION OF THE ARABIAN BASINS
2-5 NOVEMBER 2025 • RIYADH, SAUDI ARABIA
Unlock the secrets of the Arabian Plate —register now for the EAGE/AAPG Workshop on Tectonostratigraphy, featuring dynamic technical sessions, engaging discussions, and an unforgettable two-day field trip through the region’s geological wonders!
Register now!
Mokhammad Puput Erlangga1,2, Wahyu Triyoso2*, Sigit Sukmono2, Fatkhan2, Pongga Wardaya3 and Erlangga Septama3 present a methodology to determine gas saturation in the low impedance sandstone using dispersion and attenuation attributes.
Abstract
A porous low-impedance gas-saturated sandstone, can cause P-wave seismic signals to experience dispersion and attenuation. This phenomenon is commonly referred to as Wave-Induced Fluid Flow (WIFF). This paper discusses a methodology to determine gas saturation in the low impedance sandstone using dispersion and attenuation attributes. The Zoeppritz (AVO) approximation by Shuey is used to calculate the attributes from the partial angle stack seismic data. The methodology is applied to the seismic data from Sadewa Deepwater Field in, East Kalimantan, Indonesia. As it is observed that the density parameter also has a good relationship with the porosity of gas-saturated rocks, then the combination of dispersion, attenuation, and density attributes is used to determine the gas saturation. Based on cross-plot analysis at the Sadewa well, it can be concluded that the dispersion and attenuation attributes calculated from near-angle gather and mid-angle stack seismic data have a good correlation with the gas saturation log values. A more detail analysis shows that the best correlation is obtained when a combination attribute calculated by the equation of is used, where AVF is the attenuation attribute, Dp is the dispersion attribute, and Dn is density. Gas saturation values in this study were computed using the linear regression equation derived from the cross-plot analysis between the attribute and gas saturation (Sg),
which is expressed as
Keywords: amplitude, dispersion, frequency, partial angle gather, saturation, spectral decomposition.
Introduction
One primary objective of exploration geophysics is to identify the gas presence in the sandstone reservoirs, and the commonly used method is to look at the relationship between gas saturation values and elastic property values derived from the simultaneous inversion of the linearised Zoeppritz equation. However,
elastic property parameters such as acoustic impedance, shear impedance, and Poisson’s ratio resulting from the simultaneous inversion do not consider the influence of seismic wave frequency (Chen et al., 2016).
Waves will experience dispersion and attenuation when propagating through the medium (Winkler and Nur, 1982; Batzle et al., 2001; Wu et al., 2010; Chen et al., 2016). Dispersion and attenuation of seismic waves are caused by the fluid flow (in this case gas), triggered by seismic waves propagating through the medium. This phenomenon is called Wave Induced Fluid Flow (WIFF) (Liu et al., 2011).
Li et al. (2015) analysed attenuation using the Q parameter to detect the presence of hydrocarbons using the modified frequency shift method of reflection seismic data. Seismic wave attenuation, quantified by the Q value, serves not only to enhance the resolution of seismic data but also as a tool for lithology classification and gas reservoir characterisation (Zhou et al., 2010). Furthermore, Mandong et al. (2021) demonstrated that within hydrocarbon-saturated reservoir zones, the dominant amplitude exhibits lower values than zones without hydrocarbon saturation. In addition, the high-frequency amplitude content in the reservoir zone saturated by hydrocarbons has a relatively lower value than in other zones not saturated by hydrocarbons. Therefore, the attenuation attribute can also be expressed by multiplying the intercept and gradient of the non-linear regression of the amplitude spectrum curve in the high-frequency range.
Mandong et al. (2021) discussed one type of attenuation attribute called Amplitude Variation with Frequency (AVF). Erlangga et al. (2024) discussed the influence of the angle of the partial stack seismic data on the AVF attribute.
In addition to attenuation attributes, dispersion attributes can also be used to identify the presence of gas in the reservoir rocks. Ren et al. (2009) proposed the use of a poroelastic patchy saturation medium rock physics model to understand the relationship between dispersion and gas presence. The poroelastic medium used consists of three types, namely a consolidated sandstone
1 Institut Teknologi Sumatera | 2 Institut Teknologi Bandung | 3 Pertamina Upstream Research and Technology Innovation * Corresponding author, E-mail: wtriyoso@gmail.com DOI: 10.3997/1365-2397.fb2025055
reservoir model that has a high impedance value compared to the layer above it, a sandstone reservoir model that has an acoustic impedance value that is not too different from the layer above it, and a sandstone reservoir model that has an acoustic impedance value far below the layer above it. Based on the modeling, it is concluded that the change in phase velocity to frequency is very visible in the sandstone reservoir model, which has the lowest acoustic impedance value. Using the numerical modelling method, Liu et al. (2010) conducted a study on three types of reservoirs to observe the dispersion effect caused by fluid flow induced by seismic waves in a porous medium. The numerical modelling showed the characteristics of the influence of frequency on the AVO equation. Wu et al. (2010) estimated the value of dispersion attributes calculated from pre-stack seismic data. The pre-stack seismic data is first subjected to spectral decomposition using the Wigner-Ville distribution method. Furthermore, the value of the dispersion attribute can be calculated using the results of the inversion of the two-term AVO approximation reflection coefficient equation by Smith and Gidlow (1987). Chen et al. (2015) estimated the gas saturation value based on the dispersion characteristics of post-stack seismic data.
This paper discusses the effect of seismic partial angle gather data offset on dispersion and attenuation attributes to identify the presence of gas in low-impedance sandstone reservoirs. Rock physics poroelastic modelling is first carried out to see the relationship of dispersion attribute values to gas saturation values in low-impedance sandstone reservoirs. The results show that the dispersion attribute value is linearly related to the gas saturation
value. Erlangga et al. (2024) showed that based on poroelastic rock physics modelling, the AVF attenuation attribute value is also directly proportional to the gas saturation value in low-impedance sandstone reservoirs. The next step is calculating the dispersion and attenuation attribute values from the partial angle gather and partial angle stack seismic data at the well position. The dispersion attribute is calculated using an equation derived from the linear inversion of Shuey’s approximation of the AVO equation.
The partial angle gather seismic data used is divided into three types, namely near angle gather (1⁰-15⁰), mid angle gather (16⁰-30⁰), and far angle gather (31⁰-45⁰). The partial angle stack data is obtained from the stacking results of each partial seismic angle gather data. The value of dispersion and attenuation attributes calculated from each of the seismic data is convolved with the filter operator of least square inversion results and then cross-plotted against the log data of gas saturation values. The cross-plot analysis reveals the highest correlation between gas saturation log data and the dispersion attribute values (calculated from near-angle gather seismic data) along with the AVF attenuation attributes (calculated from mid-angle stack seismic data). Subsequently, the combination of the dispersion attribute (Dp), attenuation attribute (AVF), and density (Dn) obtained from AVO inversion can be used to calculate gas saturation values. Several mathematical forms of the combination were tested, including , , . Based on the cross-plot analysis between these attribute combinations and gas saturation values, the best correlation was achieved using the combination calculated with the equation Therefore, in this study, gas saturation values were calculated using the linear regression equation derived from the cross-plot analysis between the attribute and gas saturation (Sg), expressed as
The case study area is the Sadewa Deepwater Field in the Kutai Basin, East Kalimantan, Indonesia (Figure 1). The Kutai Basin is the second largest basin in Indonesia, with hydrocarbon reserves of 2.47 MMBO of oil and 28.1 TCF of gas (Rose and Hartono, 1987). Hydrocarbons are mainly produced from the Upper Miocene fluvio-deltaic sandstone reservoirs (Allen & Chambers, 1998).
Several studies have been conducted to map the presence of fluvial-deltaic reservoirs using seismic attributes. Alamsyah et al. (2008, 2023) and Sari et al. (2018) mapped the fluvial-deltaic deposits of the Talang Akar formation (TAF) in the South Sumatra Basin (SSB) using seismic attributes. Sukmono et al. (2017) use the amplitude attribute to map the young fluvial-deltaic deposits in the Gulf of Mexico. Ambarsari et al. (2020) show that TAF reservoir quality can be determined from critical porosity and clay volume.
The Upper Miocene fluvio-deltaic sandstone of the Sadewa field has also been studied by Ambarsari et al. (2021), who discuss the influence of lithology and facies type on anisotropy parameters and upscaling factors, and Oktariena et al. (2021, 2023) which use the core anisotropy and log anisotropy parameters to improve the quality of seismic data processing.
Figure 2 shows an example of seismic angle gather data passing through the Sadewa-4 well with an angle range of 1⁰-45⁰
The target zone in this study is a low-impedance sandstone gas reservoir in the 1010 formation in the two-way time (TWT) interval of 3017.81-3044.14 ms.
The rock physics modelling is based on the poroelastic analysis approach as suggested by Ren et al. (2009), with the main aim to understand the effect of seismic frequency and gas saturation to the seismic wave velocity. The model uses an assumption of a simple intercalating two layers of an upper isotropic elastic claystone and lower dispersive and attenuative sandstone layers. Furthermore, Carcione and Picotti (2006) show that the dispersion and attenuation effects caused by gas saturation in low-impedance sandstone reservoirs can be explained using a patchy saturation model.
Following Stern et al. (1985), the M, C, and H elastic moduli can be calculated using equations 1-3 below:
where K g is the bulk modulus of the solid grain, Kdry is the dry bulk modulus of the reservoir, Kf is the bulk modulus of the fluid,
φ is the porosity, and is the Biot coefficient.
The patchy saturation model consists of periodic layers filled by gas and water (labelled 1 and 2), with thickness di (i = 1,2) for each saturated layer of each fluid type and period d1 + d2 , where d1 and d2 are smaller than the seismic wavelength and larger than the rock grain size. The analytical solution for the periodic layer system describing the effect of frequency on the phase velocity of the P wave (VP) and the Quality Factor (QP) for given property values are discussed by White et al.(1975) and Carcione and Picotti (2006) as follows:
E is the complex modulus for waves propagating perpendicular to the bedding plane and is also often referred to as the plane wave modulus, is the viscosity of the pore fluid, and is the permeability of the saturated rock. Re (E) and Im (E) are the real and imaginary components of the complex modulus. V is the complex velocity of the seismic wave. ρb is the density of the porous layering medium. ρb1 and ρb2 are the density of porous medium 1 and 2. , where s = 1, 2. Based on the patchy saturation model, for each medium 1 and 2, we have
The attenuation of the seismic wave P or S (α2) in the sand layer associated with the quality factor (Q) can be defined as follows (Carcione and Picotti, 2006):
Where EG is the Gassman modulus. We can write the complex P wave number as follows.
and
The phase velocity of the S wave, VS, and Quality Factor, QS, which is affected by frequency for periodic layer systems, can be calculated using equations 10 and 11.
The subscripts P and S denote the seismic wave types P and S. In this study, we assume that the bulk modulus and density of the sandstone grain are 38 GPa and 2.65 g/cm2, respectively. Table 1 gives the low-impedance sandstone reservoir model’s rock frame and pore fluid property values.
To determine the value of the seismic wave reflectivity coefficient P in this study, the authors used an approximation of the Zoeppritz equation derived by Smith and Gidlow (1987) as follows.
where is the pore fluid density, μ is the shear
modulus of the saturated rock,
Where , , , , , dan . Subscripts 1 and 2 indicate the shale and gas-saturated sandstone layers.
Chapmann et al. (2006) modified Shuey (1985) AVO formula to accommodate the frequency effect as follows: (15)
where DP is the derivative of seismic wave velocity to frequency, DG is the AVO gradient affected by frequency, and f0 is the reference frequency, which is the dominant frequency of seismic waves when passing through a non-dispersive medium.
(16) (17)
In applying the frequency-dependent AVO method to real data, the time-frequency spectrum of the pre-stack data contains the information of the incident wavelet spectrum, so it is necessary to eliminate the incident wavelet effect.
(18)
(19)
where is the maximum value of the amplitude spectrum at the selected time window in the calculation.
Based on equation (15), we get
(20)
Where . Equation 20
can be written as a matrix equation as follows.
(21)
DP can be obtained by solving the linear inversion of the matrix. The calculation results of reflection coefficient values for each gas saturation value as a function of angle and frequency from the rock physics modelling is shown in Figure 3. The distri-
bution of reflection coefficient values as a function of frequency and angle is different for each given gas saturation value. The higher the gas saturation value, the maximum amplitude spectrum of the reflection coefficient shifts from bigger to smaller angle (Figure 3).
After the reflection coefficient value as a function of frequency and angle for each gas saturation value is calculated, then the next step is to create an angle gather synthetic seismic trace for each gas saturation value by performing a Fourier transform on the result of the algebraic multiplication operation between the reflection coefficient value as a function of frequency and angle for each gas saturation value with the wavelet amplitude spectrum. The dominant frequency in the wavelet amplitude spectrum used in this modelling is 25 Hz. Based on equation 21, dispersion attributes can be calculated from the synthetic seismic angle gather trace for each gas saturation value (Figure 4).
Figure 4 shows that in the case of low-impedance sandstone reservoirs, the dispersion attribute value is directly proportional to the gas saturation value. It means that higher gas saturation relates to the more dispersion of the waves passing through the reservoir. It is consistent with previous study results that the Amplitude Variation with Frequency (AVF) attenuation attribute is directly proportional to the gas saturation (Erlangga et al.,
2024). Therefore, this study combines the dispersion attribute DP derived from angle gather seismic data and the attenuation attribute AVF derived from partial angle stack seismic data to determine the distribution of gas saturation values in low impedance sandstone reservoirs in Sadewa Field.
The rock physics modeling result discussed in a previous section is applied to the partial angle gather, partial angle stack seismic and gas saturation log data in the Sadewa field with the workflow as shown in Figure 5. The partial seismic angle gathers and the partial angle stack data used in this study are near angle, mid angle, and far angle seismic data.
The first step to determine the dispersion attribute is to perform spectral decomposition for each trace on seismic partial angle gather data using Stockwell transformation. The result of
the spectral decomposition is the seismic trace as a function of time, angle, and frequency. These seismic traces as a function of time, angle, and frequency are substituted in the left part of equation 21. Then, the dispersion attribute can be calculated by solving the linear inversion matrix in equation 21.
The dispersion attribute calculated from the partial angle gather data is then convolved to the filter generated from the Least Square inversion. The filter is used to reduce the effect of seismic noise.
The filtered dispersion attributes are cross-plotted against the gas saturation log data. The results of the cross plot for each dispersion attribute derived from the seismic partial angle gather data are shown in Figures 6a, 6b, and 6c. The highest correlation value (0.9971) is obtained when the dispersion attribute was derived from the seismic angle gather data (Figure 6a). Furthermore, the partial angle gather seismic data used to derive the dispersion attribute is near angle gather data. Mathematically, this linear relationship follows the linear regression equation y = 0.5668x + 0.0589, where y is the dispersion attribute value derived from near angle gather data after filtering and x is the gas saturation value.
The attenuation attribute is derived using the same approach as discussed in Erlangga et al. (2024). However, the filtering process in this study was applied to a different two-way time (TWT) interval. Erlangga et al. (2024) filtered the dispersion attribute within the TWT range of 3004 ms to 3100 ms, whereas this study uses the TWT range of 3000 ms to 3140 ms. This difference resulted in variations in the filter operator values derived from the Least Square inversion and differences in the correlation values between the filtered attenuation attribute and gas saturation levels.
Figure 6 Cross-plots of dispersion attributes calculated from seismic data for (a) near, (b) mid, and (c) far angle gathers after filtering based on gas saturation (Sg) values in sand reservoir 1010 at well SADEWA-4 (TWT: 3000-3140 ms). Cross-plots of attenuation attributes calculated from seismic data for (d) near, (e) mid, and (f) far angle stacks after filtering based on gas saturation (Sg) values in sand reservoir 1010 at well SADEWA-4 (TWT: 3000-3140 ms).
The filtered attenuation attribute was then cross-plotted against gas saturation log data. The cross-plot results for each attenuation attribute derived from the partial angle stack data are shown in Figures 6d, 6e, and 6f. The highest correlation value (0.9995) was obtained when the attenuation attribute was calculated from the mid-angle stack seismic data (Figure 6e). Consequently, the mid-angle stack seismic data were used to derive the attenuation attribute. Mathematically, this linear relationship follows the linear regression equation y = 0.9908x + 0.0013, in which y is the attenuation attribute value derived from the filtered mid-angle stack seismic data, and x is the gas saturation value.
The next step is to combine the dispersion attribute derived from near-angle seismic gather data, the attenuation attribute derived from mid-angle stack seismic data after filtering, and the density derived from AVO inversion to map the gas saturation distribution. Density is inversely related to both rock porosity and gas saturation. Gas-saturated reservoir rocks tend to have high porosity, which results in lower density values. In this study, the combination of the dispersion attribute (Dp), attenuation attribute (AVF), and density (Dn) can be expressed
using three mathematical equations. They are , , and . The results from these three equations are then cross-plotted against gas saturation values
(Figure 7) to determine which equation best estimates gas saturation. Based on the highest correlation coefficient (0.9986), the equation is identified as the most accurate for determining gas saturation (Figure 7a). Mathematically, the linear relationship from the cross-plot follows the regression equation y = 0.3337x + 0.0086, where y is the value of and x is the gas saturation value. Consequently, gas saturation can be mathematically expressed by the following equation: (22)
The previous discussion explained the use of a combination of dispersion attributes, attenuation attributes, and density to identify and map gas saturation. This section discussed the comparison of the application of AVO density inversion with these three attributes (dispersion attributes, attenuation attributes, and density) to map the gas saturation in the sandstone 1010 reservoir of the Sadewa field.
Figure 8 shows the sensitivity analysis results in cross plots: density vs. acoustic impedance, Poisson’s ratio vs density, lambda-rho vs. density, and density vs. porosity. The z-axis (color)
using
represents the gamma-ray log data. Based on the petrophysical analysis, sandstone’s gamma-ray cut-off value is less than 65 API. Based on this gamma-ray log cut-off value, all cross plots show that the density values can also effectively distinguish sand and shale, with the sandstone density cut-off of < 2.42 g/cc. This
Figure 8 The crossplot between the density log data and acoustic impedance log data (a), the crossplot between the Poisson’s ratio log data and density log data (b), the crossplot between the lambda-rho log data and density log data (c), and the crossplot between the density log data and porosity log data (d) are shown in the range of TWT from 3004 ms to 3100 ms.
Figure 9 The results of the extraction include: (a) the average density value, (b) the average Sg value derived from the absolute AVF values after convolution with a filter, (c) the average Sg value derived from the absolute Dp values after convolution with a filter, and (d) the average Sg value calculated using Equation 22, in the Sand 1010 formation.
density value is closely related to the porosity value, where high rock porosity leads to low rock density. However, not all porous rocks are gas-saturated, so the density parameter itself is insufficient to determine the gas saturation value in the pore spaces of the reservoir rock.
Figure 9 shows the map of the extracted average values from density, gas saturation derived from the absolute AVF attributes after filtering, gas saturation derived from the absolute dispersion attributes after filtering, and the attribute combination within the sandstone 1010. Based on the density distribution map, the distribution pattern of the low-impedance sandstone reservoir can be observed. However, this does not yet show the distribution of gas saturation values. The gas saturation map can be derived from the AVF attribute, dispersion attribute, and the combination of AVF, dispersion, and density attributes. The three gas saturation maps produced from these attributes essentially have almost identical patterns.
The rock physics poroelastic modelling shows that there is a linear relationship between dispersion and attenuation attributes and gas saturation. The modelling is applied to calculate the gas saturation in the SADEWA-4 well which has gas saturation data as a control. Based on the cross-plot analysis and seismic angles sensitivity to the attributes, the dispersion attribute is best derived from near angle gather seismic data, in which the dispersion attribute has a correlation value of 0.9971 to the gas saturation. On the other hand, it is found that the attenuation attribute is best derived from mid-angle stack seismic data which have a correlation value of 0.9995 to the gas saturation.
The angle also influences the TWT window width under the maximum correlation condition between the filtered AVF attribute and gas saturation. It can be seen in previous research (Erlangga et al., 2024) where the maximum correlation between the filtered AVF attribute and gas saturation in the TWT range of 3004 ms-3100 ms is found in the AVF attribute derived from near angle stack seismic data. Meanwhile, the maximum correlation between the filtered AVF attribute and gas saturation in the TWT range of 3000 ms-3140 ms is found in the AVF attribute derived from mid-angle stack seismic data.
Based on the cross-plot sensitivity analysis between log data and the cut-off Gamma Ray value in the Sadewa-4 well, the density parameter can also differentiate between sand and non-sand lithology. Thus, the distribution map of the average density value of sand formation 1010 can be considered the sand distribution map information 1010. Low-density values are related to high rock porosity values, which generally have gas-saturated fluids. Therefore, we can combine the dispersion attribute, attenuation attribute, and density to improve the accuracy of identifying the presence of gas and determining gas saturation values. Gas saturation can be calculated using the equation
, where AVF is the attenuation attribute, Dp is the dispersion attribute, and Dn is the density value.
The authors thank Pertamina for permission to use Sadewa seismic and well data. The first author is grateful to Institut Teknologi Sumatra for providing financial support to complete his study at Institut Teknologi Bandung.
Alamsyah, M.N., Fitrianto, T., Sukmono, S. and Winardhi, S. [2023]. A preliminary analysis of natural CO2-saturated gas sands distribution in the Gemah Field-Jabung Block, South Sumatra Basin, Indonesia, by using simple seismic attributes. The Leading Edge, 42(11), 726788. https://doi.org/10.1190/tle42110748.1.
Alamsyah, M.N., Marmosuwito, S., Sutjiningsih, S., Marpaung, L.P. and Sukmono, S. [2008]. Seismic reservoir characterization of Indonesia’s Southwest Betara Field. The Leading Edge, 27(12), 1598-1607. https://doi.org/10.1190/1.3036958.
Allen, G.P. and dan Chambers, J.L.C. [1998]. Sedimentation in the modern and Miocene Mahakam delta. Indonesian Petroleum Association Guidebook, 1, 236.
Ambarsari, D.S., Winardhi, I.S., Prakoso, S., and Sukmono, S. [2020]. Reservoir quality determination by using critical porosity and volume of clay: a case study in the Talang Akar Formation in the NW Java Basin, Indonesia. First Break, 38(5), 63-70.
Ambarsari, D.S., Sukmono, S., Winardhi, I.S., Sanny, T.A., Wardaya, P.D., Septama, E., Setiawan, T., Mulawarman, A., Pratama, R.R., Rossa, V.I. and Murdianto, B. [2021]. The effects of lithology and facies types on the anisotropy parameters and upscaling factor of the sand reservoirs in the deep-water Sadewa field, Kutei basin, East Kalimantan, Indonesia First Break, 39(3), 85-91.
Batzle, M., Hofmann, R., Han, D.H. and Castagna, J.P. [2001]. Fluids and frequency dependent seismic velocity of rocks. The Leading Edge, 20, 168–171. https://doi.org/10.1190/1.1438900.
Carcione, J.M. and Picotti, S. [2006]. P-wave seismic attenuation by slow wave diffusion, effects of inhomogeneous rock properties. Geophysics, 71, O1–O8. DOI: 10.1190/1.2194512.
Chapman, M.E., Liu, E. and Li, X.-Y. [2006]. The influence of fluid-sensitive dispersion and attenuation on AVO analysis. Geophysical Journal International, 167(1), 89–105, doi:10.1111/j.1365246X.2006.02919.x.
Chen, R., Chen, X., Li, J., Wang, Z., Wang, B. and Xu, Y. [2016]. A new hydrocarbon indicator derived from FAVO inversion. Conference Paper of 86th Annual International Meeting SEG. Dallas, Texas, U.S.A., Society of Exploration Geophysicists, 516-520. DOI: 10.1190/segam2016-13839146.1.
Erlangga, M.P., Triyoso, W., Sukmono, S., Fatkhan, Wardaya, P., Septama, E. [2024]. The Application of Amplitude Variation with Frequency (AVF) Seismic Attribute to Map Gas Saturation Values in Low Impedance Sandstone Reservoirs. First Break, 42(9), 95-105. https://doi.org/10.3997/1365-2397.fb2024080.
Liu, L., Cao, S. and Wang, L. [2011]. Poroelastic Analysis of Frequency-dependent Amplitude-versus-offset Variations. Geophysics, 76(3). https://doi.org/10.1190/1.3552702.
Mandong, A.F., Bekti, R.P.A. and Saputra, R.L.A. [2021]. Amplitude Variation with Frequency as Direct Hydrocarbon Indicator for Quick Look and Different Insight of Hydrocarbon Delineation. Journal Geofisika , 19(02), 62-68. http://dx.doi.org/10.36435/ jgf.v20i2.517.
Oktariena, M., Triyoso, W., Sukmono, S., Fatkhan, F., Septama, E. and Wardaya, E. [2023]. Anisotropy-driven velocity log reconstruction in deviated wells: A case study from deepwater Sadewa Field. The Leading Edge, 42(10), 702-710.
Oktariena, M., Triyoso, W., Ambarsari, D.S., Sukmono, S., Septama, E., Wardaya, P.D., Murdianto, B.S., Raguwanti, R. and Pratama,
R.R. [2021]. The Use of Core & Log Anisotropy Parameters into Seismic Data Processing: A Case Study of Deep-Water Reservoir. IOP Conference Series: Earth and Environmental Science, 873(1), art. no. 012038,
Rose, R. and Hartono, P. [1978]. Geological evolution of the Tertiary Kutei-Melawi Basin, Kalimantan, Indonesia. Proceedings of 7th Annual Convention, Indonesian Petroleum Association. Jakarta, 225-252. https://doi.org/10.29118/ipa.2318.225.251.
Sari, V.M., Sukmono, S., Sanny, T.A. and Sapiie, B. [2018]. Seismic anisotropy estimation of the TAF in South Sumatra basin, Indonesia, using ultrasonic tomography in core plugs. First Break, 36(5), 61-70. http://dx.doi.org/10.3997/1365-2397.n0093.
Shuey, R.T. [1985]. Simplification of the zoeppritz equations. Geophysics, 50, 609–614. doi: 10.1190/1.1441936.
Smith, G.C., and Gidlow, P.M. [1987], Weighted stacking for rock property estimation and detection of gas. Geophysical Prospecting, 35(9), 993–1014. DOI:10.1111/j.1365-2478.1987.tb00856.x.
Stern, M., Bedford, A. and Millwater, H.R. [1985]. Wave reflection from a sediment layer with depth-dependent properties. The Journal of the Acoustical Society of America, 77(5), 1781–1063, doi:10.1121/1.391927.
Sukmono, S., Machado, V., Adelina, R. and Ambarsari, D. [2017]. Integration of 3D Seismic attributes for preliminary shallow geo-
hazard identification in deep water exploration area with no well data. First Break, 35(8), 91-97. http://dx.doi.org/10.3997/13652397.35.8.89810.
Thompson, P., Hartman, J.J., Anandito, M.A.A., Kumar, D., Magill, J., Noguchi, K. and Gunawan, B.K. [2009]. Distinguishing gas sand from shale/brine sand using elastic impedance data and the determination of the lateral extent of channel reservoirs using amplitude data for a channelized deepwater gas field in Indonesia. The Leading Edge, 28, 312-317. https://doi.org/10.1190/ 1.3104077.
Winkler, K.W. and Nur, A. [1982]. Seismic attenuation: effects of pore fluids and frictional sliding. Geophysics, 47(1), 1–15. DOI:10.1190/1.1441276.
Wu, X., Chapman, M., Wilson, A. and Li, X.Y. [2010]. Estimating seismic dispersion from pre-stack data using frequency-dependent AVO inversion. Proceedings of 80th Annual International Meeting SEG, Denver, U.S.A., Society of Exploration Geophysicists, 425-429. DOI:10.1190/1.3513759.
Zhou, Y., Zhao, W., Ge, Y., Gao, J., Wang, X. and Ge, C. [2010]. Seismic Quality Factor Estimation using Continuous Wavelet Transform 2010 IEEE International Geoscience and Remote Sensing Symposium, 3941-3944. Honolulu, HI, U.S.A., IEEE. DOI: 10.1109/ IGARSS.2010.5649272.
Endre Vange Bergfjord1*, Håvard Alnes2, Trond Arne Espedal1 and Lars Hille1 review the principles of time-lapse gravity and deformation monitoring and present the results of a recent pilot application of the Reach Remote platform.
Introduction
Time-lapse gravity and seabed deformation measurements have become a cornerstone of offshore reservoir monitoring in gas fields worldwide, where they replace or complement 4D seismic monitoring (Ruiz et al., 2022; Alsos et al., 2024; Hourani et al., 2025; Solbu et al., 2023).
The technology is also expected to play a pivotal role in monitoring, measurement, and verification (MMV) plans for carbon capture and sequestration (CCS) projects. In the frequent case of CO2 being injected into depleted gas-producing reservoirs, elastic properties are hardly affected by the injection of CO2 into the pore space already containing residual gas, leading to weak 4D seismic signals in these areas (Toh et al., 2024). In contrast, modelling shows that time-lapse gravity and deformation monitoring will provide the information required to efficiently and safely conduct the injection, as demonstrated in the case of the Morecambe fields (Borges et al., 2024).
Time-lapse gravity and deformation monitoring benefits from a significantly reduced cost and environmental footprint compared to 4D seismic. It is deployed from smaller vessels, with the main requirement being the ability to deploy a workclass remotely operated vehicle (ROV) to handle the survey instrumentation. Additionally, this technology relies on passive measurements rather than active seismic shots.
In 2025, a technological development further reduced the footprint of this reservoir monitoring technology: the introduction of Reach Remote vessels, which can deploy work-class ROVs with no personnel onboard, fully operated by personnel onshore. The use of Reach Remote will also strongly reduce the health, safety, and environmental (HSE) risks of the operations.
A pilot survey was conducted in April 2025, with all marine and survey personnel onshore, to demonstrate the operational efficiency and final measurement qualities attainable when deploying this monitoring technology from the Reach Remote vessels. The pilot survey featured two phases: the first at a fjord near Bergen, Norway, and the second over the Troll field. The long history of surveys at the Troll field, extending for 25 years (Vassvåg et al., 2025; Eiken et al., 2008), allows us to evaluate
the quality of the measurements through the complete time-lapse analysis workflow.
In this article, we briefly review the principles of time-lapse gravity and deformation monitoring. We then describe how the survey equipment is integrated into the Reach Remote platform. After that, we describe the series of measurements performed in the pilot deployment. We then report the resulting measurement quality, showing that it is consistent with that obtained from recent surveys utilising conventional vessels.
Hydrocarbon production and CO2 injection induce changes in the mass distribution and pressure regime of subsurface reservoirs. These changes manifest respectively as variations in the gravitational field at the seafloor and vertical seafloor displacement, which can be measured using time-lapse gravity and seafloor deformation surveys. This monitoring technology offers valuable insights into reservoir dynamics, including fluid movement, pressure depletion, and reservoir compaction.
The method involves periodic surveys, with one baseline followed by repeated measurements over the field’s lifetime. Relative gravity and water pressure are recorded at predefined
1 Reach Subsea | 2 Equinor Energy AS
* Corresponding author, E-mail: endre.bergfjord@reachsubsea.com DOI: 10.3997/1365-2397.fb2025057
CP layout at Troll. The background colour represents the producible hydrocarbon type: red for gas at Troll East and green for oil and gas at Troll West. Black dots mark the CP positions. Note the zero-level CPs located away from the reservoir outline. The area marked by the black square on the left contains the three CPs visited during the 2025 pilot survey (42, 70, and 69) and is shown in more detail on the right.
locations on the seafloor, each marked by a pre-deployed concrete platform (CP). The CPs, shaped as truncated cones with 80 cm-diameter top plates, ensure consistent sensor placement across surveys (Figure 1). Some CPs are placed away from the reservoir, serving as zero-level references to correct for non-reservoir-related effects such as sea level fluctuations (Figure 2).
A vessel equipped with a work-class remotely operated vehicle (ROV) conducts the surveys. The ROV carries a sensor assembly called the gWatch monitoring unit, typically outfitted with three gravimeters and three pressure sensors. The ROV lands close to a CP and, with the help of the manipulator arm, places the gWatch monitoring unit atop the top plate of the CP for a 15-minute measurement cycle. This process is repeated across all CPs, with at least two visits and hence measurements at each CP. To correct for tidal effects, tide gauges are deployed throughout the survey area. Multiple measurements at each CP enable correction for instrumental drift and provide repeatability-based estimates of measurement uncertainty (Ruiz et al., 2022).
Data from successive surveys are processed to extract time-lapse changes in gravity and vertical displacement. Gravity variations reflect changes in fluid mass and density, while vertical movement of the seafloor reveals compaction or expansion within the reservoir. The method has been applied extensively to major gas fields in Norway (Solbu et al., 2023; Ruiz et al., 2022; Alsos et al., 2024; Vassvåg et al., 2025), and is increasingly proposed for monitoring CO2 storage sites (Borges et al., 2024).
The Reach Remote 1 and Reach Remote 2 vessels (Figure 3) are the first in the world capable of operating work-class ROVs with all personnel placed onshore. The vessels are 24-m long and have a fuel autonomy equivalent to typically 30 days of operation. They are equipped with a fully electric ROV.
The tasks to be performed for a time-lapse gravity and deformation survey are: deployment of tide gauges, sequential transits to CP locations, landing next to the CPs, deployment of the gWatch monitoring unit on top of the CPs using a manipulator
arm, and recovering the tide gauges at the end of the survey. To perform these tasks efficiently, a dedicated skid has been manufactured. The skid provides a base platform to safely position the gWatch monitoring unit during transit, as well as the required storage space for the tide gauges (Figure 4).
The pilot campaign took place in April 2025. The gWatch equipment was mobilised and demobilised on the Reach Remote 1 vessel at the port of Gravdal, near Bergen. Marine personnel, including the vessel captain, were working from the remote operation centre (ROC) in Horten, while ROV operators, gWatch engineers, and geoscientists were working from portable container offices at Gravdal. Survey personnel were stationed at Reach’s office in Billingstad, near Oslo.
The pilot consisted of two phases: the first was performed at Byfjorden, a narrow fjord north of Bergen, and the second
at the Troll field, 65 km west of Bergen. Byfjorden provides a controlled environment with minimal current or wave action, and five CPs have been installed on the seafloor since 2014 for instrumentation testing, at depths ranging between 270 and 490 m (Figure 5).
The main focus of the first phase of the pilot was to fine-tune and optimise the operational aspects, including the procedures for tide gauge deployment and recovery and for placing the gWatch monitoring unit sequentially on top of the different CPs (Figure 6). Tide gauges were deployed at a single location for the duration of the test on the seafloor.
The Troll field is equipped with 104 CPs, with the gravity monitoring program extending back to 1998 (Vassvåg et al., 2025), and provides a perfect environment for evaluating the technology in a realistic setting. Three CPs were used: those labelled as 42, 69, and 70 in the southwest of Troll East (Figure 2), separated by 2-4 km, and with water depths ranging between 301 and 303 m. Tide gauges were deployed near two out of these three CPs.
The pilot phase at the Troll field was conducted under moderate sea conditions, with significant wave heights averaging 1.2 m during operations. The campaign began with the deployment of tide gauges near CPs 42 and 70, followed by test measurements at these CPs. The vessel then returned to port before heading back offshore for a continuous series of ten measurements, with the sequence CP 42, CP 70, CP 69, CP 42, CP 70, CP 69, CP 42, CP 69, CP 70 and CP 42. The results presented in this article are based on these ten repeat measurements, which provide a robust dataset to evaluate the performance of the remotely operated system.
During the pilot, the ROV achieved transit speeds of up to 2 knots, compared to the typical 0.8 knots with traditional ROVs. Consequently, Reach Remote enables more efficient subsea transits between CPs than conventional gWatch surveys from a manned vessel.
The processing of both relative gravity and depth data involves correcting for tides and sensor drift (Ruiz et al, 2022). The standard method for assessing the final precision of gravity and depth measurements from each survey involves a statistical comparison
7 Left: residuals for individual pressure sensors across the ten measurements at Troll vs the number of days since the start of the year. Right: histograms of the residuals showing the standard deviations. A pressure range of 10 Pa corresponds to a depth range of 1 mm.
of the multiple measurements taken at each CP, after all necessary corrections have been applied.
To evaluate the performance of individual gravity and pressure sensors, we define the measurement residuals rjk,l as the difference between the measurement mjk,l made with sensor l at a given visit j at a given CP k and the average m ~ k through all measurements with the three sensors at CP k:
rjk,l mjk,l - m ~ k (1)
Figures 7 and 8 show the residuals for the three pressure sensors and three gravimeters in the gWatch monitoring unit, respectively, for each of the ten repeat measurements. These residuals provide a direct measure of sensor consistency.
To evaluate the overall precision of a single measurement at a given CP, we compute aggregated residuals rjk, defined as the difference between the average measurement from all three sensors during visit j at a given CP k, mjk and the average through all measurements with the three sensors at that CP k, mk:
rjk mjk - m ~ k
The precision of a single measurement can then be evaluated using the standard repeatability estimator, defined as:
Table 1 Repeatability in depth and gravity surveys at Troll from Vassvåg et al, 2025, and the 2025 remote pilot. (*) Note that, for the case of the 2025 pilot, the three CPs lie at a short distance from the location where tide gauges are deployed, hence tidal extrapolation uncertainty is minimal.
Figure 8 Left: residuals for individual gravimeters across the ten measurements at Troll vs the number of days since the start of the year. Right: histograms of the residuals showing the standard deviations.
where NS is the number of CPs; Nvisits,k is the number of visits to CP k, N tot = Nvisits,k, is the total number of measurements at CP k; and M is the number of free parameters in the drift model of gravity or pressure sensors.
Table 1 summarises the repeatability for gravity and depth in the 2025 pilot compared to the three most recent full-scale surveys at Troll. Depth repeatability is expressed as equivalent water column height.
The repeatability achieved in the 2025 pilot using the remote platform is comparable to that of conventional surveys. The particularly low depth repeatability reflects the proximity of the three CPs to the deployed tide gauges, which reduces tidal correction uncertainty.
The three CPs monitored during the pilot lie within a region of Troll exhibiting strong time-lapse gravity changes due to aquifer influx (Vassvåg et al., 2025). Seafloor subsidence in this area is also significant, at a rate of approximately 1.5 cm/year.
Standard time-lapse processing includes in-situ calibration and zero-levelling based on stable reference CPs located far from the reservoir. These zero-level CPs are assumed to experience negligible changes over time (Agersborg et al., 2017). Their use helps to correct for sensor calibration differences and global offsets such as mean sea level shifts.
For this pilot, however, no zero-level CPs were visited. Consequently, zero-levelling and in-situ calibration could not be performed based on them. Nonetheless, because the three CPs are located within a narrow range of depths and local gravity values, calibration-related uncertainties in the time-lapse difference are small. Based on instrument specifications and previous calibration records, the expected contribution from calibration differences is estimated to be less than 1 mm for depth and 0.5 µGal for gravity over the range spanned by CPs 42, 69, and 70.
To address the absence of zero-levelling, we select CP 69 as a local reference, and we assume that both subsidence and gravity at that station continue the smooth trend with time observed in the last six time lapses. Figures 9 and 10 show the resulting relative time-lapse differences in depth and gravity for the last six time lapses plus the 2023-2025 time lapse using the results of the remote pilot. In the case of gravity, the values are corrected for the effect of subsidence and for the modelled effect of gas produc-
9
tion. The remaining signal is therefore directly interpretable as the effect of water influx in the reservoir.
Note that the results from the pilot perfectly align with the historical series for the two CPs that are not used as local reference. The different trends with time for the three CPs are caused by the waterfront moving northwards. While the southernmost CP (69) experienced the strongest signals a decade ago, the signal is still positively accelerating for the northernmost CP (42).
The first fully remotely operated gravity and subsidence survey has been successfully conducted at the Troll field using the gWatch system. The pilot campaign, conducted under moderate offshore conditions, confirms that fully autonomous deployment of this monitoring technology is feasible using the Reach Remote vessel platform.
The repeatability achieved in the pilot is 1 mm for pressure-derived depth and 0.61 µGal for gravity. These values are comparable to the results from recent full-field campaigns using conventional vessels and underline the readiness of the gWatch–Reach Remote interface and the survey protocols utilised for the remote operations.
Despite the absence of zero-level CPs in the remote survey, the use of a local reference allowed the accurate extraction of time-lapse signals from the pilot survey in Troll in 2025. The results are consistent with previous trends attributed to aquifer influx and reservoir compaction.
This successful demonstration paves the way for future reservoir monitoring campaigns using low-cost, remotely operated solutions. The ability to acquire high-quality time-lapse gravity and seafloor deformation data without a crewed offshore vessel opens opportunities for more frequent monitoring with a reduced environmental and operational footprint, both for hydrocarbon production and CCS projects.
The authors would like to thank Equinor and the Troll licence partners Petoro, Norske Shell, TotalEnergies and ConocoPhillips for their continued support and for granting access to the Troll field for the pilot deployment.
Figure 10 Time-lapsed gravity difference corrected for seafloor subsidence and gas production, for the CPs visited during the remote pilot. To address the level ambiguity in 2025, the value at CP 69 is assumed to be a smooth continuation from the series of measurements throughout surveys.
Agersborg, R., Hille, L.T., Lien, M., Lindgård, J.E., Ruiz, H. and Vatshelle, M. [2017]. Density changes and reservoir compaction from in-situ calibrated 4D gravity and subsidence measured at the seafloor. SPE Annual Technical Conference and Exhibition, Extended abstracts, PSE-187224-MS.
Alnes, H., Stenvold, T. and Eiken, O. [2010]. Experiences on seafloor gravimetric and subsidence monitoring above producing reservoirs. 72nd EAGE Annual Conference and Exhibition, Extended abstracts, L010.
Alsos, T., Osdal, B., Haverl, M., Skeie, S., Sørensen, H. and Holdahl, R. [2024]. Gravity and 4D sismic monitoring data in history matching of the Snøhvit reservoir model. 85th EAGE Annual Conference and Exhibition, Extended Abstracts
Borges, F., Basford, H., Calder, T., Lien, M., Vassvåg, S. and Ward, C. [2024]. Monitoring CO2 Storage in the Morecambe Depleted Gas Reservoirs through Seafloor Deformation and Time-Lapse Gravimetry Measurements. First Break, 42(3), 71-75.
Eiken, O., Stenvold, T., Zumberge, M., Alnes, H. and Sasagawa, G. [2008]. Gravimetric monitoring of gas production from the Troll field. Geophysics, 73(6), WA149-WA154.
Hourani, M.Y., Ghous, A., Sridaran, R., Lien, M., Vassvåg, S. and Ruiz, H. [2025]. Implementation of time-lapse gravity and subsidence monitoring for optimising the development of the Scarborough gas field. First Break, 43(3), 71-77
Ruiz, H., Lien, M., Vatshelle, M., Alnes, H., Haverl, M. and Sørensen, H. [2022]. Monitoring the Snøhvit gas field using seabed gravimetry and subsidence. First Break, 40(3), 93-96.
Solbu, Ø.H., Nyvoll, A., Alnes, H., Vassvåg, S. C., Lien, M. and Ruiz, H. [2023]. Time-Lapse Gravity and Subsidence Applied in History Matching of a Gas-Condensate Field. First Break, 41(9), 69-74.
Toh, S.Y., MacBeth, C. and Landa, J.L. [2024]. Evaluating the CO2 injection seismic modeling outcomes: a study of the Goldeneye, Hamilton, and Viking Fields. Fifth EAGE Global Energy Transition Conference and Exhibition (GET 2024), Extended Abstracts
Vassvåg, S., Halpaap, F., Andersen, C.F. and Jørgensen, L. [2025]. Twenty-five years of monitoring the Troll gas and oil field with time-lapse gravity and seafloor deformation surveys. First Break, 43(3), 41-46.
100+
80+
Marianne Rauch1*, Umberto Barbato1, John Castagna2 and Alex Fick3 showcase the effectiveness of a novel bandwidth extension technique applied to a newly reprocessed 3D dataset from onshore USA.
Abstract
Onshore seismic data is often challenged by high noise levels and limited resolution, even after thorough processing. In this study, we showcase the effectiveness of a novel bandwidth extension technique applied to a newly reprocessed 3D dataset from onshore USA. This approach delivers higher-resolution seismic images and more geologically consistent inversion results. The enhanced dataset improves the accuracy of landing zone selection and supports better planning and execution of the lateral drilling path, ultimately reducing out-of-zone drilling and increasing production rates. Before the bandwidth extension process, targeted data conditioning was carried out to minimise noise as much as possible. The bandwidth extension itself was achieved using the Multiscale Fourier Transform of the seismic trace, which performs time-frequency analysis across a range of window lengths. This variation in window length helps to capture both local and global amplitude relationships between events, enabling reflectivity inversion that is independent of the seismic wavelet’s amplitude spectrum. Since the temporal and spatial variation of the seismic wavelet in reflection data is often poorly understood, this method offers several advantages over traditional seismic reflectivity inversion. No wavelet extraction is required, meaning the inversion process can proceed without relying on well data, seismic ties, or timedepth functions. Additionally, the inversion is sparse and doesn’t require a starting model. Since no wavelet is necessary, the method can be applied directly to depth-migrated data.
This inversion technique is particularly valuable for multi-client seismic datasets because it doesn’t rely on well data and can be applied over large areas. It enhances the value of existing datasets and revitalises older ones, making them suitable for detailed interpretation and well planning. Well data can then be used to validate the results.
Introduction
TGS maintains an extensive library of both onshore and offshore seismic multi-client data. The dataset used in this study is from the Permian Basin, located onshore USA, and has recently undergone reprocessing for both time and depth using a state-of-the-art
1 Lumina Geophysical | 2 University of Houston | 3 TGS
processing sequence, which included onshore Full Waveform Inversion (FWI) (see Figure 1).
While this reprocessing was successful, the seismic resolution began to taper off around 40 wavenumbers, making it challenging to map thinner reservoir units accurately. Applying the DeepInvert™ bandwidth extension technique to the pre-stack depth-migrated stack data extended the bandwidth beyond 60 wavenumbers without introducing any artifacts (see Figure 2). The Figure demonstrates that the inversion process does not sacrifice low-frequency data to increase bandwidth at higher frequencies or wavenumbers.
* Corresponding author, E-mail: marianne.rauch@luminageo.com
DOI: 10.3997/1365-2397.fb2025056
2
Figure 3 Bandlimited impedance (left track) and absolute impedance (right track) from well logs and seismic inversion without a known wavelet. Inversion bandlimited impedance is converted to absolute impedance by adding the low frequency impedance structure from the well log. Pink = impedance from well log, Blue = impedance from seismic inversion of field data without a known wavelet.
Conventional seismic inversion relies on knowing the seismic wavelet in advance. Determining this wavelet can be a slow, error-prone process, especially when well data have imperfect impedance or time-depth information, or when the wavelet’s impedance structure and spatial variation between wells are unknown. Noise in well logs and seismic data, including the presence of interbed multiples, further complicates the extraction of a stable wavelet. Statistical methods for wavelet extraction often depend on assumptions that may not hold, such as white reflectivity or zero phase. However, through training neural networks to predict reflectivity from seismic traces, we found
that the longstanding assumption that the seismic wavelet and its variation in time and space are essential for inverting seismic reflection data is not necessarily true, if the inversion problem is structured correctly. In this paper, we describe our technology and demonstrate how it was successfully applied to a typical onshore dataset. Where interbed multiples couldn’t be removed, noise was still present, and some target zones fell below the desired frequency bandwidth.
Locci et al (2018) introduced the Multiscale Fourier Transform, which is a generalisation of the Wavelet Transform. The unscaled multiscale transform is simply a Short-Time Fourier Transform (STFT) over variable window lengths.
The variable window lengths of the STFT enable us to identify distinct tuning points of seismic facies variability while addressing one of the main shortcomings of STFT – energy leakage on frequency or time domain. Assuming the dataset to be originally zero phase, this process results in a reflectivity series whose time-frequency-scale analysis of the amplitude spectrum is accurate. The phase variability of the wavelet, which can change gradually both laterally and vertically (time or depth domains) is imbedded in the waveform and also presents variability in the amplitude spectrum; variability, which is also identified by the Multiscale Fourier Transform, and can be derived by combining the real and imaginary components of complex wavelets, as described by Portniaguine and Castagna (2004).
The method involves identifying wavelet-independent features from the multiscale transform by training a multilayer feedforward (MLF) convolutional neural network (CNN) to predict reflectivity series.
Any forward modelling approach can be applied during both the training and inversion processes. The synthetic data can be post-stack or pre-stack and may be 3D in either time or depth (with record times and time shifts replaceable by depths). Potential limitations in the forward model, well logs, or seismic processing can be identified later at validation wells, as no well data is used during the inversion itself. Importantly, once the relevant features are identified, classical geophysical inversion can be applied to these features without the need for retraining for each specific case. The theoretical feasibility of such inversion is demonstrated by Liu et al. (2022).
The seismic bandlimited impedance shows a strong correlation to the bandlimited impedance at wells obtained by removing the well log impedance low frequency trend. Adding this low frequency trend to the seismic bandlimited inversion at the well produces an absolute impedance inversion which compares very well to the measured well log, Figure 3.
The bandwidth extension process described above was applied to the recently reprocessed West Kermit dataset, located in the Permian Basin, onshore USA. The Permian Basin is a major unconventional resource area, but the seismic data in the region is often noisy, with bandwidth typically limited to 40 wavenumbers in conventional datasets. This limitation makes it challenging to accurately identify landing zones and generate lateral pre-drill
plots from seismic data. As most of the prime drilling locations have already been tapped, seismic data is increasingly used to help map and target overlooked zones with good rock properties. Acquiring new seismic data with a significantly higher frequency bandwidth is both time-consuming and costly. By applying a proven bandwidth extension process to existing datasets, many of these challenges can be mitigated.
The dataset was recently reprocessed using a state-of-the-art processing sequence that included pre-stack depth migration and Full Waveform Inversion (FWI). As a result, some additional weak conditioning was applied. Figure 4 shows the difference plot after applying a bandpass filter to remove very high-frequency noise, along with a structural filter. This process eliminated some minor random noise and vertically oriented high-noise bands. This reprocessed dataset served as the input for the bandwidth extension.
In addition to producing a higher frequency/wavenumber seismic dataset, the process also generates a band-limited inversion. As mentioned earlier, no well logs were used during the
Figure 4 difference plot between input PSDM stack and mild pre-conditioning PSDM stack. The displayed log represents the gamma ray.
process, but the results were validated at well locations. The seismic reflection and inversion events were then compared to the well logs to confirm the accuracy of the outcomes.
Figure 5a shows the input dataset, while Figure 5b presents the bandwidth-extended version at the same inline location. This line was chosen as it intersects a well location that has three horizontal well paths. The image in Figure 5a clearly highlights the challenges in resolving some of the thinner intervals within this geological unit.
Figure 5b shows the bandwidth-enhanced dataset for the same line as in Figure 5a. The improved processing has clearly resolved features that were not visible in the original data. The results align very well with the displayed horizontal well paths, with no artificial sidelobes present, and the events can be accurately mapped geologically.
The DeepInvert™ results were used as input for a band-limited inversion (BLI). Figure 6a shows the inversion results at a depth of 13,670 ft, near the Middle Wolfcamp interface. Figure 6b presents the bandwidth-extended results at the same depth interval. The
Figure 5 (a) Seismic reflectivity input data of an inline that intersects 1 well with 3 individual horizontal well paths. (b) Seismic reflectivity bandwidth enhanced data of the same inline as is displayed in Figure 5a.
bandwidth extension reveals more details and sharpens boundaries, which is the desired outcome and is very useful for choosing landing zones and designing horizontal well paths.
Reflectivity inversion of seismic data can be performed without the explicit a priori knowledge or extraction of the seismic wavelet. The process involves direct, sparse geophysical inversion of features derived from the Multiscale Fourier Transform. Since no training is required for application to a specific dataset, this method is particularly valuable for larger datasets.
The ability to invert seismic data without prior knowledge of the seismic wavelet significantly improves the inversion process. In conventional practices, synthetic ties and wavelet extractions are necessary before inversion, which is not only time-consuming and costly but also inherently inaccurate due to the wavelet’s poorly understood and variable nature in terms of time, position, and offset. Typically, constant wavelets are used, assuming that spatial and temporal variations in the wavelet are adequately addressed in processing. In contrast, the applied inversion method does not require the wavelet to be known in advance, making it immune to the effects of actual wavelet variations over time, spatial position, and offset.
Figure 6 (a) BLI depth slice at 13,670 ft of input data, middle Wolfcamp. (b) BLI depth slide at 13,670 ft of bandwidth extended data, middle Wolfcamp.
This method was applied to extend the bandwidth of the West Kermit onshore dataset, located in the Permian Basin, USA, an area known for its seismic challenges. Despite careful acquisition and seismic processing, the data are generally noisy and lack higher frequencies. By applying DeepInvert™, the bandwidth was increased from around 40 wavenumbers to over 60 wavenumbers. This enhancement revealed previously missing details in the image, and the subsequent BLI inversion clearly displayed sharper boundaries and improved resolution of smaller features.
Liu, Z, Zheng, Y. and Zhou, H. [2022]. Simultaneous inversion of layered velocity and density profiles using Direct Waveform Inversion (DWI): 1D case. Frontiers in Earth Science, Section Solid Earth Geophysics, 9, January.
Locci-Lopez, D., Zhang, R. Oyem, A. and Castagna, J.P. [2018]. The Multi-Scale Fourier Transform. SEG Technical Program, Expanded Abstracts
Portniaguine, O. and Castagna, J.P. [2004]. Inverse spectral decomposition. 74th SEG Annual International Meeting, Expanded Abstracts, 23, 1786–1789.
16-18 Sep The Middle East Oil, Gas and Geosciences Show (MEOS GEO) www.meos-geo.com
17-18 Sep First EAGE Workshop on Energy Transition in Latin America’s Southern Cone www.eage.org
22-24 Sep Sixth EAGE Borehole Geology Workshop www.eage.org
29 Sep1 Oct Second AAPG/ EAGE Mediterranean and North African Conference (MEDiNA) medinace.aapg.org
Aires Argentina
6-8 Oct Second EAGE Data Processing Workshop www.eage.org
6-8 Oct Empowering the Energy Shift - The Role of HPC in Sustainable Innovation: Ninth EAGE High Performance Computing Workshop www.eage.org
6-9 Oct GEOTERRACE-2025: International Conference of Young Professionals www.eage.org
14-16 Oct First EAGE Conference on the Future of Mineral Exploration: Challenges and Opportunities www.eage.org
15-16 Oct 3 rd EAGE/SUT Workshop on Integrated Site Characterization for Offshore Renewable Energy www.eage.org
21-22 Oct First EAGE Workshop on Geophysical Techniques for Monitoring CO2 Storage www.eage.org Toronto Canada
21-23 Oct First EAGE/ AAPG/ SEG Carbon Capture Utilisation and Storage Workshop (CCUS) www.eage.org Al Khobar Saudi Arabia
27-31 Oct 6th EAGE Global Energy Transition Conference & Exhibition (GET 2025)