VOLUME 43 I ISSUE 12 I DECEMBER 2025

SPECIAL TOPIC

VOLUME 43 I ISSUE 12 I DECEMBER 2025
SPECIAL TOPIC
EAGE NEWS GET 2025 sets standard for debate
CROSSTALK What environment history has to offer
TECHNICAL ARTICLE DAS VSP for vertical exploration wells
FIRST BREAK ®
An EAGE Publication www.firstbreak.org
ISSN 0263-5046 (print) / ISSN 1365-2397 (online)
CHAIR EDITORIAL BOARD
Clément Kostov (cvkostov@icloud.com)
EDITOR
Damian Arnold (arnolddamian@googlemail.com)
MEMBERS, EDITORIAL BOARD
• Philippe Caprioli, SLB (caprioli0@slb.com)
Satinder Chopra, SamiGeo (satinder.chopra@samigeo.com)
Anthony Day, NORSAR (anthony.day@norsar.no)
• Kara English, University College Dublin (kara.english@ucd.ie)
• Hamidreza Hamdi, University of Calgary (hhamdi@ucalgary.ca)
• Fabio Marco Miotti, Baker Hughes (fabiomarco.miotti@bakerhughes.com)
• Roderick Perez Altamar, OMV (roderick.perezaltamar@omv.com)
• Susanne Rentsch-Smith, Shearwater (srentsch@shearwatergeo.com)
• Martin Riviere, Retired Geophysicist (martinriviere@btinternet.com) Angelika-Maria Wulff, Consultant (gp.awulff@gmail.com)
EAGE EDITOR EMERITUS Andrew McBarnet (andrew@andrewmcbarnet.com)
PUBLICATIONS MANAGER Hang Pham (publications@eage.org)
MEDIA PRODUCTION
Saskia Nota (firstbreakproduction@eage.org)
Ivana Geurts (firstbreakproduction@eage.org)
ADVERTISING INQUIRIES corporaterelations@eage.org
EAGE EUROPE OFFICE
Kosterijland 48 3981 AJ Bunnik
The Netherlands
• +31 88 995 5055 eage@eage.org
• www.eage.org
EAGE MIDDLE EAST OFFICE
EAGE Middle East FZ-LLC
Dubai Knowledge Village PO Box 501711 Dubai, United Arab Emirates
• +971 4 369 3897 middle_east@eage.org
• www.eage.org
EAGE ASIA PACIFIC OFFICE
EAGE Asia Pacific Sdn. Bhd. UOA Centre Office Suite 19-15-3A No. 19, Jalan Pinang 50450 Kuala Lumpur
Malaysia
• +60 3 272 201 40
• asiapacific@eage.org
• www.eage.org
EAGE LATIN AMERICA OFFICE
EAGE Americas SAS Av Cra 19 #114-65 - Office 205 Bogotá, Colombia
• +57 310 8610709
• americas@eage.org
• www.eage.org
EAGE MEMBERS’ CHANGE OF ADDRESS
Update via your MyEAGE account, or contact the EAGE Membership Dept at membership@eage.org
COPYRIGHT & PHOTOCOPYING © 2025 EAGE
All rights reserved. First Break or any part thereof may not be reproduced, stored in a retrieval system, or transcribed in any form or by any means, electronically or mechanically, including photocopying and recording, without the prior written permission of the publisher.
PAPER
The publisher’s policy is to use acid-free permanent paper (TCF), to the draft standard ISO/DIS/9706, made from sustainable forests using chlorine-free pulp (Nordic-Swan standard).
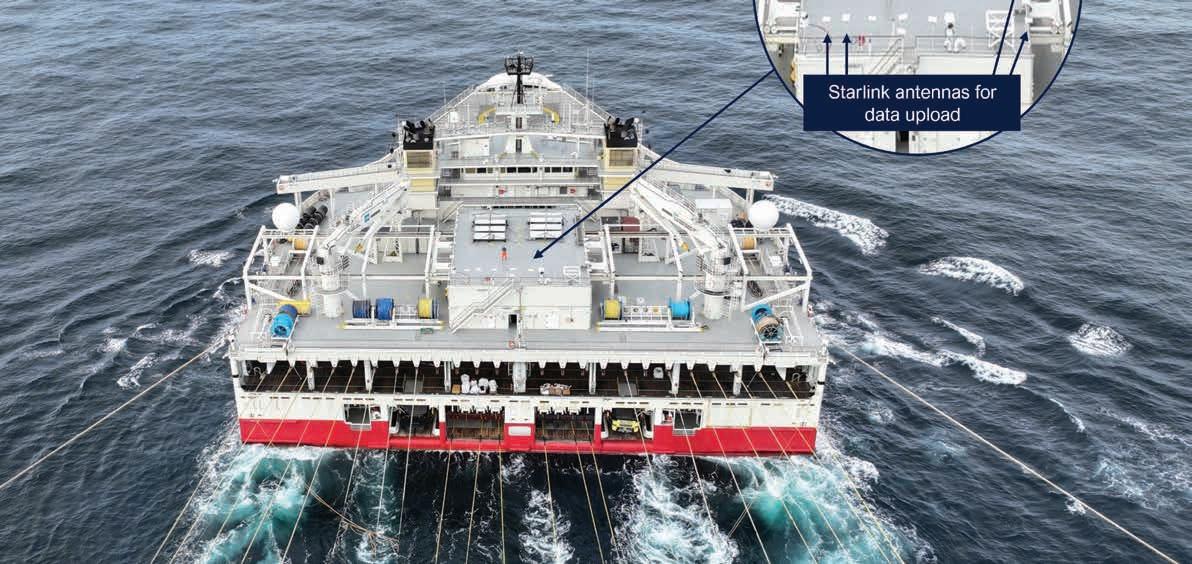
Connected workflows: The new standard in marine seismic data delivery
31 Breidablikk Field: Reducing reservoir uncertainties during field development by improving seismic data quality
Abdulhamit Akalin, Madjid Berraki and Wiebke Worthington
43 Qualifying wireline DAS VSP technology for vertical exploration wells
Rafael Guerra, Mark Ackers, Rogelio Rufino, Johan Leutscher, Alexandre Bertrand, Um Salma, Sara Sandvik and Matteo Gennaro
51 Unlocking new reservoir insights with FWI
Sylvain Masclet, Yasmine Aziez, Nicolas Salaun, Anais Montagud, Sulaim Al Maani and Vimol Souvannavong
59 Integrating Thomsen’s anisotropy with seismic-derived anisotropy Eta and rock physics model for reservoir quality assessment (case study: Sadewa Field, Kutai Basin, East Kalimantan)
Dona Sita Ambarsari, Madaniya Oktariena, Sigit Sukmono, Ign. Sonny Winardhi, Tavip Setiawan, Pongga Dikdya Wardaya, Erlangga Septama and Befriko Murdianto
73 Connected workflows: The new standard in marine seismic data delivery
Ed Hodges, Cerys James and John Brittan
79 Leveraging SEG-Y_r2.1 to increase efficiency and reduce risk
Jill Lewis and Mark Poole
85 Gilding the link: Least squares migration of multi-client 3D data, Orange Basin, Namibia Karyna Rodriguez, Helen Debenham, Neil Hodgson, Lauren Found and Sam Winters
90 Calendar
cover: Server computers. Data processing and management is being transformed by advances in high performance computing.


Environment, Minerals & Infrastructure Circle
Andreas Aspmo Pfaffhuber Chair
Florina Tuluca Vice-Chair
Esther Bloem Immediate Past Chair
Micki Allen Liaison EEGS
Martin Brook Liaison Asia Pacific
Ruth Chigbo Liaison Young Professionals Community
Deyan Draganov Technical Programme Representative
Madeline Lee Liaison Women in Geoscience and Engineering Community
Gaud Pouliquen Liaison Industry and Critical Minerals Community
Eduardo Rodrigues Liaison First Break
Mark Vardy Editor-in-Chief Near Surface Geophysics
Oil & Gas Geoscience Circle
Johannes Wendebourg Chair
Timothy Tylor-Jones Vice-Chair
Yohaney Gomez Galarza Immediate Past Chair
Alireza Malehmir Editor-in-Chief Geophysical Prospecting
Adeline Parent Member
Jonathan Redfern Editor-in-Chief Petroleum Geoscience
Robert Tugume Member
Anke Wendt Member
Martin Widmaier Technical Programme Officer
Sustainable Energy Circle
Giovanni Sosio Chair
Benjamin Bellwald Vice-Chair
Carla Martín-Clavé Immediate Past Chair
Emer Caslin Liaison Technical Communities
Sebastian Geiger Editor-in-Chief Geoenergy
Maximilian Haas Publications Assistant
Dan Hemingway Technical Programme Representative
Carrie Holloway Liaison Young Professionals Community
Adeline Parent Liaison Education Committee
Longying Xiao Liaison Women in Geoscience and Engineering Community
Martin Widmaier Technical Programme Officer
SUBSCRIPTIONS
First Break is published monthly. It is free to EAGE members. The membership fee of EAGE is € 85.00 a year including First Break, EarthDoc (EAGE’s geoscience database), Learning Geoscience (EAGE’s Education website) and online access to a scientific journal.
Companies can subscribe to First Break via an institutional subscription. Every subscription includes a monthly hard copy and online access to the full First Break archive for the requested number of online users.
Orders for current subscriptions and back issues should be sent to First Break B.V., Journal Subscriptions, Kosterijland 48, 3981 AJ Bunnik, The Netherlands. Tel: +31 (0)88 9955055, E-mail: subscriptions@eage.org, www.firstbreak.org.
First Break is published by First Break B.V., The Netherlands. However, responsibility for the opinions given and the statements made rests with the authors.


Aberdeen and its surrounding region offer exceptional teaching outcrops, classic North Sea analogues, and a striking granite city as the backdrop. For EAGE Annual 2026, several field trips are being prepared to bring conference themes to life through on-site learning. Each trip is run by experts, keeps a clear technical purpose and is designed to give you takeaways you can use back at work. This should suit geoscientists, engineers and anyone working in CCUS, geothermal, hydrogen storage or offshore wind who wants to understand strong Scottish analogues.
Arbroath geology
This is a full day on Devonian rocks to examine Lower and Upper Old Red Sandstone fluvial clastic reservoirs, well known as analogues for several North Sea fields, and to spend time on the major unconformity that separates them. Expect close work on facies, reservoir architecture and what those observations mean for subsurface models.
Heterogeneities across scales on the Moray Coast
A one-day trip to Burghead and Hopeman to see Triassic fluvial and Permian Rotliegend sediments that mirror reservoirs and potential storage sites in the East Irish Sea and the North Sea. The focus is heterogeneity from bed to field scale and how to upscale it for forecasting production and storage behaviour.
Full appreciation of Brent
A fully cored Brent succession of about 150 m will be laid out near the North Sea, slab by slab in drilling order. Walk-

ing the entire sequence gives a true sense of thickness and vertical stacking. A drone flight will document the layout and the imagery will be shared with participants. It is a rare chance to see a classic oilfield succession at full scale.
Golden age of granite
A short, one-hour walk through Aberdeen city centre that reads the city in stone. Bridges, façades and streets show how local granite shaped engineering and
architecture. We finish at a local café. Wear comfortable shoes and be ready for uneven pavements and steps.
Geology of the Highland Boundary fault zone, Stonehaven Field time at one of Scotland’s major structures, where metamorphic rocks of the Highlands meet Old Red Sandstone of the Midland Valley. We will study outcrops and fault rocks and discuss implications for compartmentalisation and fluid flow. If time and access allow after a
recce, we will include a visit to Dunnottar Castle and the geology beneath it.

St Cyrus and Crawton
A full day on Lower Devonian systems where fluvial sedimentation meets volcanism. We will look at how lavas influence channel architecture and preservation, with clear implications for lava–sediment interaction in the subsurface, for example west of Shetland.
Castle and whisky tour
A day that links coast, history and craft. We travel along the Aberdeenshire shore to the ruins of Dunnottar Castle, then on to Maryculter House for lunch. In the afternoon we tour Glen Garioch distillery
and taste a few drams before a short city tour on the way back.
We follow the Dee Valley to Balmoral Castle and its estate, then into the Cairngorms to Braemar for stories of royalty, clans, soldiers and writers. On the return we stop at local waterfalls where Atlantic salmon can sometimes be seen leaping.
Learn more
Taking the spotlight at the EAGE Annual 2026 in Aberdeen will be our first Engineering Theatre, a dedicated feature in the Exhibition hall.
The theatre will reflect the major transformation in the petroleum engineering field shaped by digitalization, decarbonisation and new approaches across the subsurface lifecycle. Artificial intelligence, automation and digital twins are redefining drilling, production and field management enabling smarter, data-driven operations. At the same time, engineers are leading on carbon management solutions such as CO2-EOR, CCUS, methane reduction, and subsurface
hydrogen storage, applying core skills to emerging low-carbon systems. Advances in completions, well integrity and enhanced recovery continue to extend technical limits, while mature field optimisation and life-of-asset strategies remain central to long-term value.
All these considerations will be brought together in the Engineering Theatre providing an extra dimension to the Exhibition hall activities.
EAGE is pleased to announce the creation of a new Technical Community on Radioactive Waste Storage, an initiative born from the enthusiasm and insight of members who led a dedicated workshop at the EAGE Annual 2024. The group highlighted a need for a stronger inter-disciplinary focus on this critical topic under the multi-disciplinary umbrella of EAGE.
The new Technical Community will serve as a platform for professionals across geoscience, engineering and related disciplines to share knowledge, exchange best practices and collaborate on the challenges and innovations surrounding the safe, long-term repository of nuclear waste materials. Those interested in joining the discussion can already con-
nect on LinkedIn, where plans will be announced. Looking ahead, the community already has ambitious goals for 2026.
Its first major project will be a workshop on Radioactive Waste Storage on 6 March 2026 in Münster, Germany. The event draws from a synergic co-operation with DGG and will bring together experts from academia, industry and government to discuss the future or this very vital area of geoscience.
More about the workshop
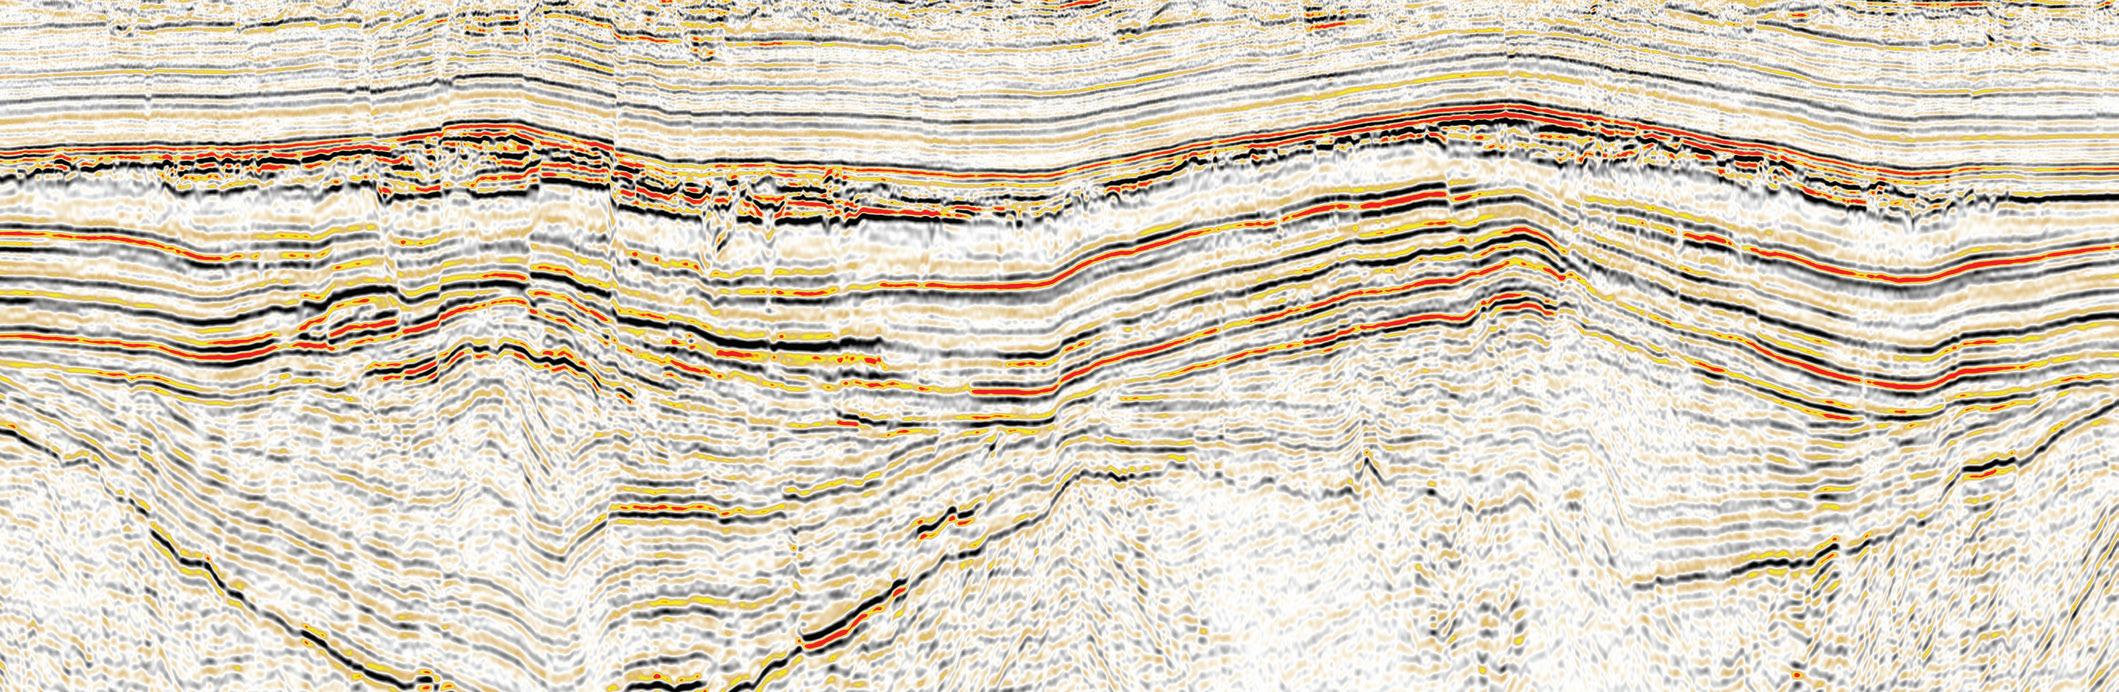
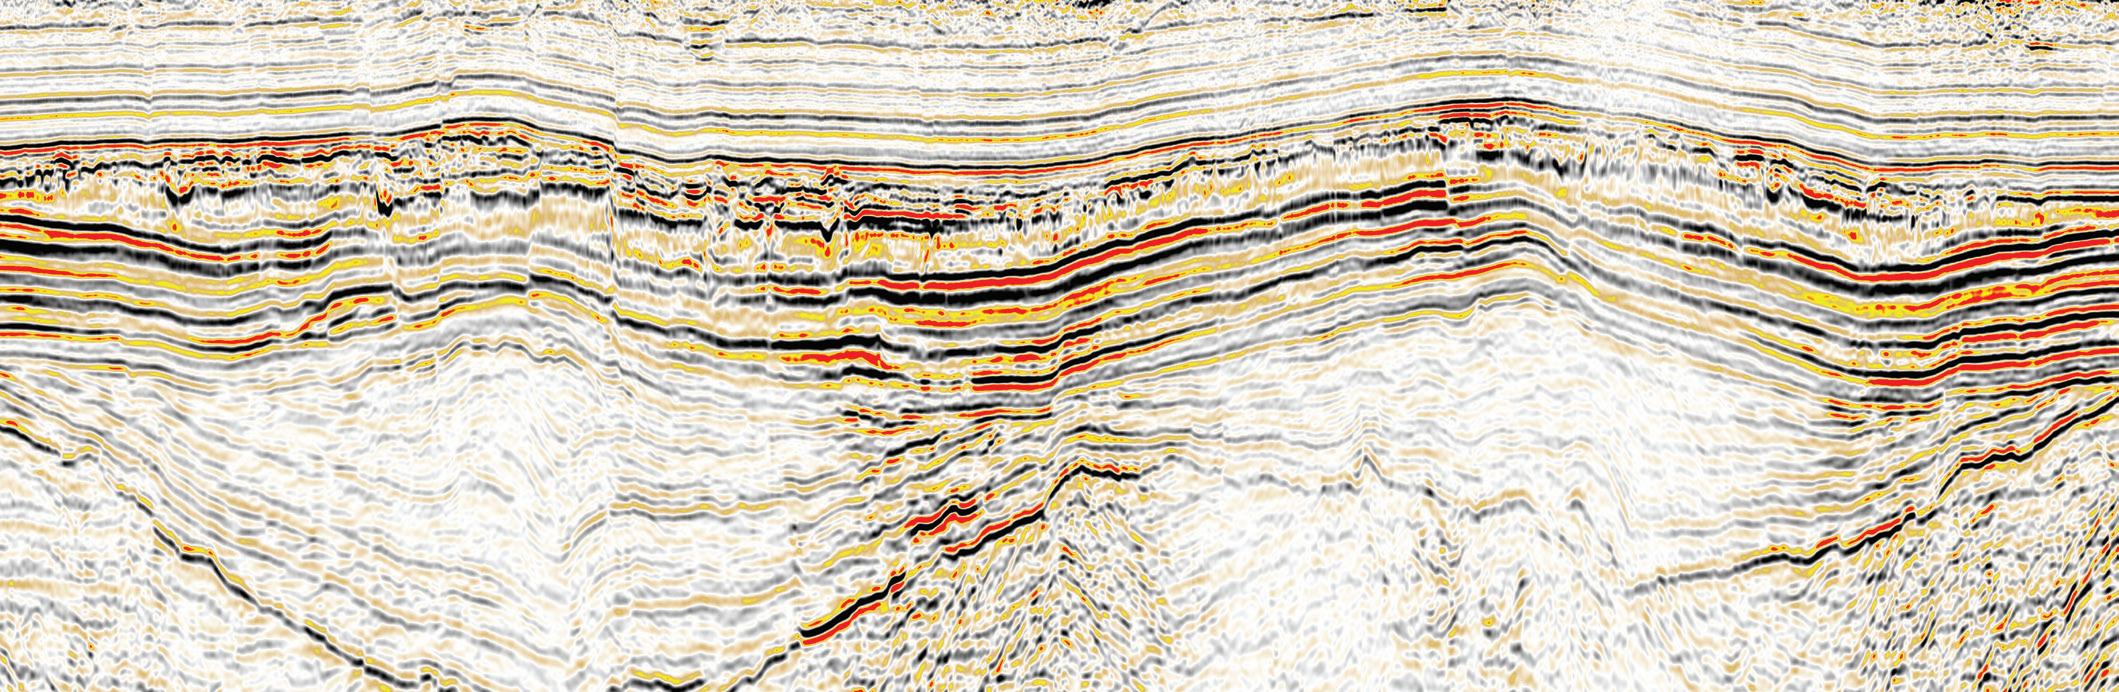
Land seismic data can often exhibit strong elastic effects that violate the assumptions of acoustic imaging.
In the example above DUG Elastic MP-FWI Imaging resolved subtle structural and stratigraphic features that were simply not imaged with a conventional processing and imaging workflow. Witness significantly better illumination and event continuity plus incredible near-surface detail.
A replacement for traditional workflows is no longer a stretch of the imagination!
info@dug.com | dug.com/fwi
An inside look at EAGE lifelong learning with education officer Maren Kleemeyer.

EAGE’s commitment to education drives our efforts to continuously evolve, integrate content on emerging technologies in geoscience and the energy transition, and expand opportunities for inter-disciplinary learning. According to EAGE education officer Maren Kleemeyer: ‘We try to help members stay ahead in the rapidly changing geoscience and energy sectors by offering regularly reviewed and updated course programmes, and a range of formats including frequent short expert-led webinars (free for members), as well as virtual and classroom-based training. For example, we recently added a short course on Geoscience communication & public engagement by Professor Iain Stewart to our catalogue. In today’s world, effective geoscience communication and meaningful public engagement are more vital than ever – helping to address global challenges such as climate change, natural disasters, the energy transition, and resource sustainability.’
EAGE courses are designed to support members at every stage of their careers. The extensive catalogue spans eight categories – Data Science, Energy Transition, Engineering, Geology, Geophysics, Near Surface, Reservoir Characterisation, and Training & Development – with offerings at foundation, intermediate and advanced levels. ‘This ensures members can find content tailored to their current expertise and career goals,’ says Kleemeyer. ‘Students and early-career professionals benefit from foundation courses that help them to build essential skills and knowledge, while experienced professionals can deepen their expertise through advanced courses that support mastery in their domain. All members have access to opportunities for personal and professional growth, whether preparing for a new role or exploring emerging fields. The growing importance of energy transition has led to increased demand for skills in newer domains such as carbon capture and storage (CCS), gas storage, and wind energy. Thanks to its broad and active community, EAGE has been able to respond quickly – often faster than traditional course providers or internal industry training
departments – by offering relevant, high-quality content in these areas.’
At the same time, we know learning preferences and available time vary from person to person, which is why EAGE offers flexible formats to suit different needs and schedules. A topic might first be introduced through a short, one-hour live webinar, ideal for sparking interest and providing a high-level overview. Kleemeyer notes: ‘These webinars are typically lecture-style and serve as a gateway to deeper learning. For those seeking more in-depth understanding, short courses are ideal. Whether delivered virtually or in person, they last one to three days and go beyond lectures by incorporating exercises, discussions or other interactive elements that enhance technical comprehension and engagement. On-demand online course programmes offer additional flexibility, allowing members to learn at their own pace without waiting for scheduled sessions. In addition to self-paced courses, EAGE provides a rich library of e-lectures, selected from top presentations at key events. These are perfect for getting a first introduction to a topic or preparing for an in-person course. And to help participants optimise their time and travel costs – especially those with a strong interest in specialised topics – EAGE has introduced master classes. These are structured learning weeks where multiple courses on a focused subject (such as CCS or geothermal energy) are combined to build progressive expertise.’
‘Because EAGE is a global association, we work to make education accessible and relevant by bringing learning directly to our members. The Education Committee plays a vital role in identifying qualified lecturers from diverse regions, ensuring that high-interest topics are taught by experts who understand local contexts. Regions such as Asia and the Americas particularly benefit from this model. By engaging local lecturers and adapting course schedules, EAGE reduces travel costs and offers more convenient virtual sessions – creating a more inclusive, flexible and cost-effective learning experience for its global community.’

Following the success of the conference in Naples, Near Surface Geoscience 2026 is gearing up for another highly anticipated conference and exhibition in Thessaloniki, Greece on 20-24 September 2026. The call for abstracts is now open, the conference welcomes submissions related to its various conferences.
Here is a brief description of the scope of each conference:
The conference will discuss the near surface challenges the world is currently facing in topics such as, geophysics monitoring the effects of climate change, near-surface geophysics for geothermal energy and much more.
Will delve into new discoveries of base metals and REE that are required for green technologies needed to meet decarbonisation targets. Recent advances, trending themes, and topics such as physical properties of critical raw materials and their mineral systems, magnetic and magnetic gradiometry methods in mineral exploration and more will be discussed.
As an important sub-discipline in hydrogeology and ecohydrology, it involves investigations of the structure and processes of the subsurface environment, at different spatiotemporal scales, by identifying key properties and state variables related to water flow and solute transport. After two successful Hydrogeophysics
conferences, the discussion will continue around water, environment, agriculture and natural resources in a rapidly changing climate and their implications to build a resilient society.
Will address the growing impact of geohazards, such as earthquakes, landslides, volcanic eruptions, floods, and coastal erosion, risks that have become more frequent and severe with climate change and rapid urbanisation. Topics such as applications of AI/ML in geohazards, geohazards case studies for detecting near-surface anomalies, cavities, karst, and weak zones and more will be explored.
You can find out more about each topic on the website www.eagensg.org. Submit your abstract by 15 April 2026 and be part of the Technical Programme.
An additional field trip with something for everyone has been added to the 6th EAGE Digitalization Conference and Exhibition taking place in Stavanger, Norway on 9-12 March 2026.
The field trip will begin at the University of Stavanger where participants will explore AI-driven innovation in the oil and gas value chain. Topics that will be covered include: emerging AI technologies for energy and petroleum, data-driven production optimisation – industry case, AI in subsurface resource management and more.
With these insights in mind, the field trip will then continue to the Stratum Reservoir core store, where participants can gain a detailed overview
of the advanced methodologies used to convert conventional core material into high-quality digital datasets that support enhanced reservoir evaluation. The focus will be on the Epslog CoreDNA multi-sensor continuous core scanning system and Stratum’s associated digital sample analysis workflows, e.g., automated mineralogy and digital petrography, demonstrating how these technologies enable more efficient data acquisition, improved core characterisation, and robust subsurface interpretation. A case study from Aker BP’s NCS portfolio will be used to illustrate practical implementation, data integration and interpretation within an operational context.
For a detailed overview of the field trip visit www.eagedigital.org. Registration is now open!
Call for late-breaking posters
As the application is rapidly evolving, now more than ever collaboration is needed to shape the future of digitalization within the oil, gas and energy sector. If you are interested in participating in the Technical Programme and showcasing your expertise to a global audience of geoscientists and engineers, take this opportunity and submit your abstract by 1 February 2026.
Understanding how to apply AI tools in geoscience has never been more essential. That’s why we have invited Dr Thomas Bartholomew Grant (Cegal) to present a course on Language models for geoscience applications at the 6th EAGE Digitalization Conference (EAGE Digital) coming next March in Stavanger, Norway. Here he tells us what he hopes to achieve.

What inspired you to develop this course?
In recent years, the accessibility and adoption of language models have surged, largely driven by the popularity of services like ChatGPT. This growth has been fed by an explosion of AI research and an increase in public discussions about AI’s potential and implications.
Though I didn’t initially appreciate the broader applications of large language models (LLMs), after some experimentation, it quickly became apparent to me that these highly versatile models have the potential to revolutionise how geoscientists handle and analyse data. Since then, I have undertaken several research and development projects using LLMs, presenting my findings at two previous EAGE Digital events. I have also co-chaired an AI interest group at my workplace.
While LLMs have attracted both hype and scepticism, I wanted to distil critical aspects of research on LLMs into a course that clearly explains how the models work, how they can be used and what their limitations are. Like other courses I have delivered, such as those in Python coding, I have tailored this one specifically for
geoscientists, featuring relevant domain examples.
How will this contribute to the future of our discipline?
The widespread integration of LLMs into everyday applications means that most people will encounter these technologies soon, if they haven’t already. However, very few people will design and develop LLM-based solutions themselves. This course aims to support those who will be end users of LLM tools and wish to deepen their understanding of how these models work. The course will explore how these models are trained, how they function and how to formulate appropriate requirements to address specific use cases. The material should help attendees to clarify how LLMs generate responses and recognise when and how to use them effectively.
Are there any special challenges to be aware of?
While the capabilities of LLMs are continually improving, there remain significant gaps between generic tools like ChatGPT and those that are tailored to geoscience workflows. Geoscience often involves
complex, variable and dynamic data. There are uncertainties and risks related to understanding Earth processes, characterising the subsurface and analysing environmental impacts. This complexity does not always translate smoothly into the language tasks for which most LLMs are designed.
LLMs are not infallible; they can make mistakes and possess inherent biases. Additionally, critical questions arise regarding the level of autonomy AI should possess and the accuracy required in decision-making processes that may have real-world consequences.
The course will address these challenges by teaching participants what features should be considered for specialised LLM tools that cater to geoscience needs. By gaining a deeper understanding of how LLMs function, participants will be better equipped to identify which tasks are feasible for LLMs and which are more problematic. The course also includes exercises for the participants to apply the core concepts to geoscience problems.
Register for this course at eagedigital.org and join Dr Grant on 12 March 2026.


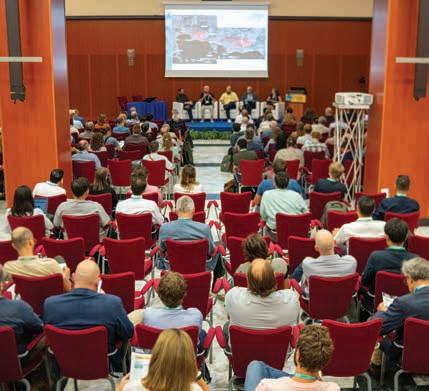
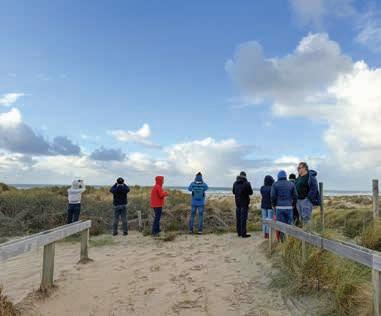
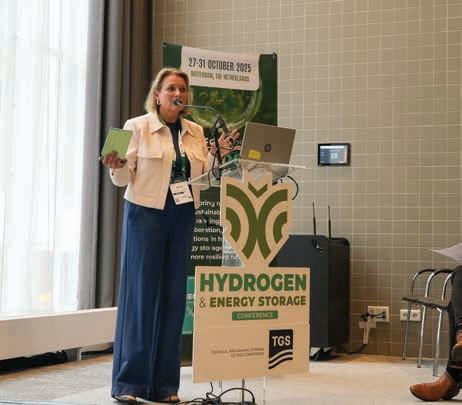
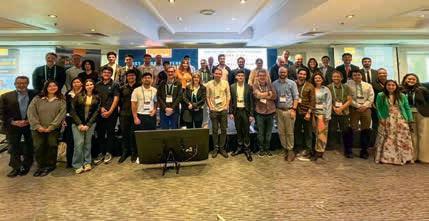
The varying challenges for industry as it focuses on the geopolitical tensions impacting energy innovation and competitiveness across Europe and the wider globe were highlighted at the opening on 27 October of the 6th EAGE Global Energy Transition Conference and Exhibition in Rotterdam. The event featured parallel conferences on carbon capture and storage, wind energy, geothermal and hydrogen energy and storage, an exhibition, field trips, short courses and workshops.
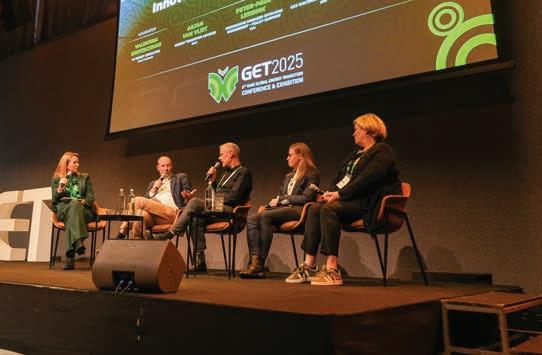


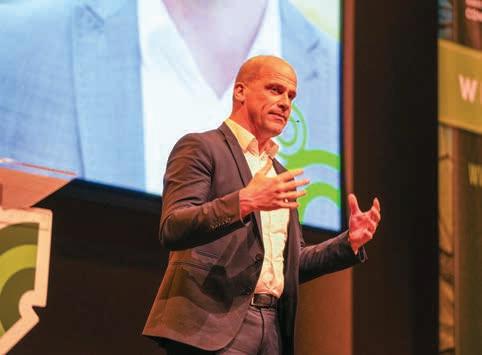
Diederik Samsom, former chief of staff to the European Commission’s Commissioner for Climate Action, in a keynote presentation called on geoscientists to keep a steady compass on developing technological solutions amidst the volatility of the current geopolitical situation. The panel on Europe’s geopolitical and energy future echoed this theme. The discussion highlighted how energy security, industrial strategy and climate goals are now inseparable. Europe must balance ambition with realism, simplify regulation, invest boldly at home and build resilience in an increasingly fragmented world where energy security, industrial strategy, and climate goals are increasingly intertwined.
The Energy Transition Strategic Programme, accessible to all delegates, examined how geopolitics, policy and markets are reshaping the transition, with discussion on Europe’s competitiveness and the Clean Industrial Deal. It paired market outlooks with North Sea system case work, then moved into domain deep

dives across CCS, geothermal, hydrogen and offshore wind, covering subsurface risk and modelling, MRV and multi-use of the seabed. Sessions on technology and digital, critical raw materials and the role of young professionals addressed capability and supply chain needs. Further panels focused on inclusion and public engagement and introduced shared data infrastructure such as the GeoEnergy Atlas to support planning and cross border coordination. Overall, the programme delivered alignment on near-term priorities, practical takeaways and contacts and a clearer path from policy to project delivery.
Once again, the GET technical conferences met expectations providing delegates with a broad range of topics focused on the energy transition journey. Post conference, Samson praised the approach: ‘An energy transition conference is always important, especially one focused on geoscience and engineering. We need that expertise in offshore wind, carbon capture and storage, geothermal energy, and white hydrogen.
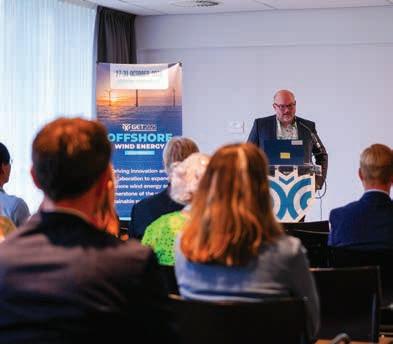
The engineers here could be key to our energy transition future.’
The event format was popular. Sigrid Borthen Toven, vice president low carbon solutions, Equinor, said: ‘What I really like about this conference is the mix between the technical aspects and the more political, high-level discussions. That balance makes it a truly unique and valuable event.’ This was echoed by Valentina Kretzschmar, vice president consulting, energy transition strategy, Wood Mackenzie: ‘It’s such a great platform that brings together the technical, regulatory, and financial aspects that truly matter for the energy industry. What I particularly appreciate are the honest and productive debates that take place here.’
Altogether, including the side activities and the Social Programme, this year’s GET 2025 reaffirmed its position as a leading platform for advancing the global energy transition. Make sure you stay tuned for updates on GET 2026 at eageget.org.
EAGE knows that every stage of your career comes with its own challenges and opportunities. That’s why we provide resources to support you at every step of your professional journey.

SAMUEL ZAPPALÀ
Marie Tharp Award
Recipient 2024
When you truly care about something, whenever there is an opportunity to work on it - it doesn’t matter if it is big or small - you just find a way and get it done. Especially to students, I say: always keep in mind that every single action we do in our work, even if small, can potentially have a huge impact for the whole community.
OPPORTUNIES AT EVERY STEP
STUDENTS CAN APPLY FOR THEIR FIRST YEAR OF MEMBERSHIP FOR FREE (RE)ACTIVATE YOUR MEMBERSHIP TODAY!


The latest Local Chapter Stavanger meeting heard how the power of multi-disciplinary studies can feature strongly in the understanding of the complex variability of stratigraphic and sedimentological features in reservoir sands. The message was in an inspiring talk titled ‘Our multi-disciplinary geological formulas: defining and addressing exploration uncertainties’ delivered by Alex DeJonghe, micro-palaeontologist and multi-client manager at PetroStrat.
DeJonghe shared insights from years of research into pore-lining chlorite in deeply buried Jurassic sandstones revealing how this mineral helps preserve primary porosity by resisting chemical and mechanical compaction. The talk also explored the challenges of predicting sub-seismic
Mid-Cretaceous sands, whose origins remain uncertain –potentially from Greenland, Mid-Norway or local highs. By integrating heavy mineral analysis with logging data and age-dating of reworked palynological specimens, innovative provenance proxies were developed to tackle these uncertainties. Interestingly, the study found that contourite facies – formed by bottom currents – were linked to the highest reservoir quality in the examined sections.
The presentation offered a valuable look into the intersection of geology, paleontology and sedimentology to provide a deeper understanding of the dynamic processes that govern the formation and preservation of crucial reservoir systems in Norway.
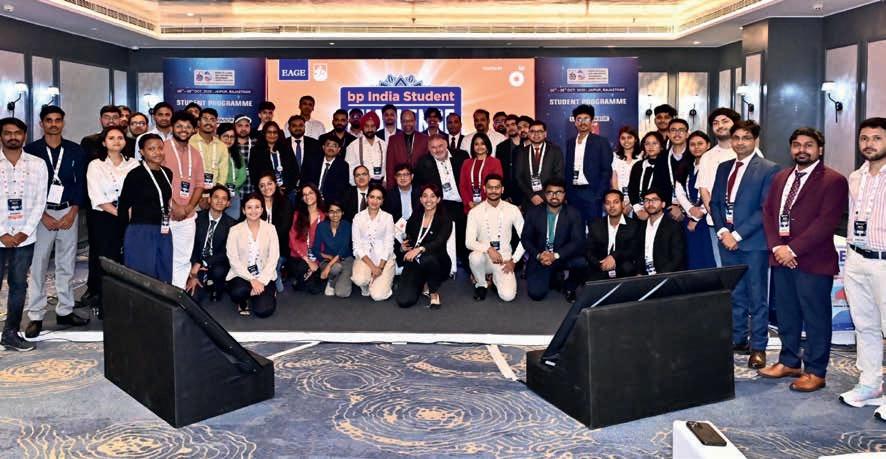
The first bp India Student Challenge was launched during the Society of Petroleum Geophysicists (SPG) Conference 2025, held on 26-28 October in Jaipur, India. The launch marked the beginning of an exciting new initiative designed to inspire and empower the next generation of geoscientists and engineers across India.
Organised by EAGE and hosted by bp India, the challenge provides a platform for university students to tackle real-world energy challenges through innovation, teamwork and applied technical knowledge. The initiative aims to strengthen industry–academia engagement while encouraging students
to explore cutting-edge approaches to energy exploration, sustainability and digital transformation.
At the launch session EAGE president Dr Sanjeev Rajput highlighted EAGE’s commitment to nurturing young talent and building a strong foundation for future energy leaders. Ajay Chauhan, geoscience discipline leader, bp Technical Solutions India (TSI) followed with a motivational talk for students, addressing career prospects with BP India and encouraging students to consider the company’s diverse pathways for professional growth and development.
Dr Richa, geohazard specialist, bp Technical Solutions India (TSI), outlined
the objectives, structure and opportunities for participants in the Student Challenge. The session concluded with an interactive dialogue between bp representatives, EAGE representatives and students, where participants exchanged ideas on the future of energy, technology and innovation.
The bp India Student Challenge will feature multiple competitive phases, culminating in a final presentation before a panel of industry experts from bp India. The winning team will receive the bp India Student Challenge Trophy, to be presented at an upcoming EAGE Conference in the Asia Pacific region with travel expenses covered by bp.
Beyond the competition, students will benefit from mentorship, industry exposure, and the chance to connect directly with bp India for potential internship and learning opportunities. Applications are open until 9 January 2026.
The launch at SPG 2025 marks another milestone in EAGE and bp India’s shared mission to foster innovation, education and sustainable growth in the energy sector.
participate
The promise and seemingly unlimited potential of further hydrocarbon riches provided the essence of the Second EAGE Conference and Exhibition on the Guyana-Suriname Basin held on 9-11 September 2025 in Georgetown, Guyana sponsored by ExxonMobil, Hess Guyana, TotalEnergies, TGS, EY and Viridien, with the full support of the Ministry of Natural Resources (MNR) of the Government of Guyana and Staatsolie Maatschappij Suriname. The three-day event was anchored by 30 innovative presentations and well attended by over 100 industry professionals, government officials and local stakeholders.
In the light of more than 11 billion barrels of oil equivalent discovered in the basin since 2015, the main conference themes spanned novel exploration methods applied to emerging/frontier play concepts, imaging technologies and enhanced modelling and production methods. Front and centre was the mutually recognised need for continued exploration in the basin, in particular for new opportunities outside of the ‘Golden Lane’, the term coined for the 30+ aligned fields stretching from the Stabroek Block in Guyana to Blocks 52, 53 and 58 in Suriname. In support of this aspiration, Staatsolie formally announced its new open door licensing round, which offers unlicensed areas offshore for direct negotiation with interested companies.
Thinking even bigger, conference participants were challenged to not only understand the geological uniqueness of the basin, but also how learnings from this tremendous decade of success in Guyana/Suriname can lead to the discovery of another super basin. Multiple presentations by operators highlighted the importance of ultra-high resolution imaging (nodes + FWI), real time 4D monitoring for field production, new reservoir modelling techniques and innovative applications of AI and machine learning for field development and well planning.
One of the most widely discussed themes at the conference focused on the future of exploration in the Guyana-Suriname Basin, specifically, whether the basin is nearing maturity or only just beginning its growth story. Attendees were reminded that prior to the landmark 2015 Liza-1 discovery, 40 unsuccessful wells were previously drilled in the basin. History shows that super basins rarely stand still: they grow and transform through
continuous advances in technology, innovation and investment to uncover new plays that sustain production for decades. One hotly debated issue was the role of a deeper ‘pre-ACT’ source rock in the basin, one that could charge Upper and Lower Cretaceous carbonate and clastic plays both inboard of the shelf break but also within the underexplored Demerara Plateau. Similarly, many opinions were shared on the untested ultradeep water play analogous to those currently being explored across the South Atlantic. The coming months will provide critical answers, as major IOCs prepare to drill a series of wells to test these promising play concepts offshore Suriname.
Another insight shared by multiple presenters was the role of pace, integration and iteration in the exploration process. The shift from the traditional linear upstream model – moving sequentially from exploration to development to production –toward ExxonMobil’s ‘Integrated maturation mindset’, which unites geoscience, reservoir, commercial and development teams in all stages of decision-making. It is said to have enhanced decision quality, broken down technical and commercial silos and accelerated project execution across the value chain. Most participants agreed that in this ever-changing energy landscape, decision-makers need to see a range of potential outcomes early in the evaluation process, plan for multiple scenarios and visualise a clear line to commerciality. The remarkable exploration and development achievements in the Guyana-Suriname Basin stand as a testament to this integrated approach, with many attendees advocating its adoption in future growth regions.
Geoscientists care deeply about using our work for the greater good and that our efforts have the potential to change for the better the daily lives of all people in the region. Thus, the final major theme was the overall recognition that the industry must collectively be responsible stewards of our communities and people, ensuring that our actions not only benefit the present, but also leave a positive legacy for generations to come. As part of the EAGE’s commitment to the future, the opening of the first student chapter at the University of Guyana was announced at the conference, with local students delivering both oral presentations and participating in the poster session.
A key panel session discussed the theme ‘Empowering locals to take ownership of exploration success in the Guyana/ Suriname Basin’. This dynamic session brought together industry leaders and regional experts to explore actionable strategies for positioning communities in Guyana and Suriname as key stakeholders in the region’s expanding energy landscape. The conversation focused on several critical areas such as capacity building: investing in local talent through education, training and mentorship initiatives; local content development: promoting policies and partnerships that prioritise local businesses and
workforce participation in exploration and production; community engagement: fostering trust and transparency between operators and communities to support long-term collaboration; and women in energy: showcasing the impact of women leaders in driving inclusive and sustainable development across the basin.
The panel was widely praised for its inspiring tone and practical insights, particularly its emphasis on strong female leadership and the importance of empowering the next generation of geoscientists and energy professionals. It highlighted prominent local women in the industry and their efforts to drive sustainable energy growth in their home nations. Attendees stressed the

need for even deeper engagement with young professionals, under-represented groups, local and international students, and home-grown companies in future conferences.
Finally, low carbon efforts are providing the world with a masterclass on how to responsibly explore and produce energy resources while simultaneously caring for lush forests, clean waterways and changing climate. Operators and community stakeholders showcased these efforts including those through the Greater Guyana Initiative and inventive use of REDD+ forest credits to offset CO2 emissions.
As the basin continues to mature and new discoveries test the limits of its geological and technological potential, the outcomes of this year’s conference will undoubtedly shape the direction of the next EAGE meeting in 2027. By then, the results of ongoing deepwater drilling campaigns and Staatsolie’s licensing initiative will offer new insights into the basin’s unexplored frontiers. Equally, the growing focus on integrated development strategies, local capacity building and low-carbon innovation will ensure that the next conference reflects a more diversified, collaborative and sustainable phase of the region’s energy journey. If this year’s event featured discovery and possibility, the 2027 conference may well mark a turning point, one where the Guyana-Suriname Basin moves from promise to enduring legacy.
LC Czech Republic dedicated the month of October to a focus on instrumentation joining with the Czech Geological Survey for two complimentary technical meetings.
The first talk took advantage of a rare opportunity: a visit to Prague by Ing Antonio Sanchez and Dr Václav Kuna, representatives of seismic instrument manufacturer Reftek Systems. Sanchez delivered a well-attended presentation covering a wide range of applications for broadband and short-period sensors ranging from earthquake monitoring and hazard assessment for critical infrastructures to microseismic monitoring.
The presentation sparked an animated discussion when Sanchez showed examples of structural monitoring in California and other earthquake-prone cities worldwide. He emphasised the importance of seismic monitoring not only for measuring damaging shaking, but also for determining whether the structural integrity of a building has
been affected during an earthquake. Building owners can use seismic array data to demonstrate that their structures did not experience damaging levels of shaking, potentially avoiding costly post-event inspections.
He also discussed various methods of sensor deployment. For a seismic prospecting audience, it was particularly interesting to hear how structural monitoring often relies primarily on horizontal components, which may not be even co-located – different sensors can be installed on separate floors. The discussion continued informally afterwards at a local brewery, a critical structure for all Czechs!
A second technical talk followed on 6 October, and was delivered by Martin Alexa MSc of the Czech Geological Survey (CGS). He presented a wide range of CGS geophysical projects united by a focus on shallow structures. Five of the six surveys he discussed deployed geoelectrical resistivity tomography
(ERT) to identify fault zones, search for groundwater, determine peatland depth, or assess the compactness of near-surface formations at a potential nuclear waste repository site.
The excellent review concluded with a special project investigating surface wave velocities along a planned
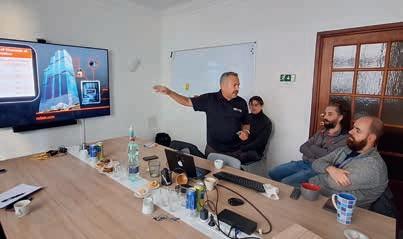
Presentation on structural monitoring and earthquake-prone cities.
high-speed railway corridor. The aim was to identify areas where trains might produce ‘supersonic’ effects and shock waves at high speeds. Encouragingly, the results suggest that the Czech rail network is unlikely to face such challenges, even if train speeds increase to 360 km/h.
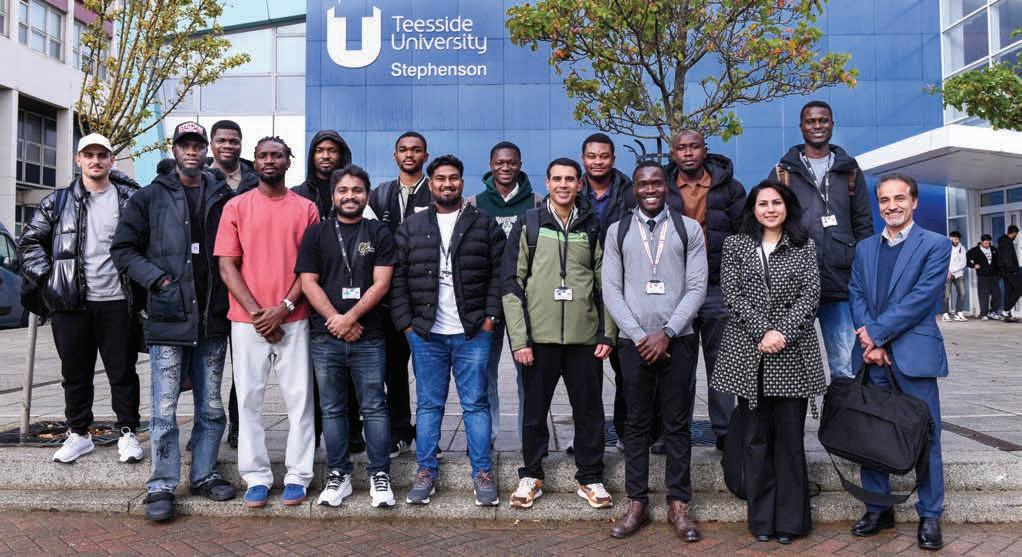
The Teesside University EAGE Student Chapter is proud to be one of the active chapters in the United Kingdom. Our Chapter brings together a dynamic group of MSc and PhD students from petroleum engineering, oil and gas management, geoscience, and environmental engineering disciplines, united by a shared commitment to advancing subsurface energy research and contributing to the global EAGE community.
energy transition. We apply experimental, observational, and digital modelling techniques to explore and solve complex subsurface problems.
Supported by Teesside University’s School of Computing, Engineering and Digital Technologies, the Chapter benefits from access to high-quality laboratories, industry-standard software, and the Energy Lab, a facility co-developed by Professor Sina Rezaei Gomari and used by
Our members are actively engaged in research across carbon capture and storage (CCS), hydrogen systems, geothermal energy, subsurface fluid flow, and low-carbon construction materials. These activities integrate geological, geophysical and engineering approaches to address real-world challenges in the
numerous postgraduate researchers. This infrastructure enables hands-on learning and fosters innovation in climate-positive technologies.
Professor Sina Rezaei Gomari, our Chapter’s Advisor, said: ‘Our Chapter is more than a student group, it’s a platform for capacity building, inter-disciplinary

collaboration and legacy-driven impact. We aim to empower students to become future leaders in sustainable energy and geoscience.’
We are committed to participating in flagship EAGE initiatives such as the Laurie Dake Challenge and the Minus CO2 Challenge, encouraging students to apply their skills to global energy and environmental problems. We also host seminars, guest lectures and field trips to contextualise subsurface research and promote professional development.
Vicent Kitenda, Teesside University’s Chapter chairman, says: ‘I’m proud to lead a team that’s passionate about research, outreach and innovation. We’re building a chapter that connects students locally and globally, and we welcome new members who want to make a difference.’
Among its other objectives, the Chapter seeks to provide guided access to discounted EAGE memberships and associated benefits including distinguished lecturer webinars, exclusive learning materials, research field trips, and career development events. By doing so, the Chapter will continue to foster a vibrant platform where students can connect, learn and contribute to the advancement of geoscience and engineering both locally and globally.
Contact Chapter chairman Vicent Kitenda, E4519588@tees.ac.uk, or Chapter advisor Professor Rezaei Gomari, s.rezaei-gomari@tees.ac.uk, to learn more and get involved with us.

Every month we highlight some of the key upcoming conferences, workshops, etc. in the EAGE’s calendar of events. We cover separately our four flagship events – the EAGE Annual, Digitalization, Near Surface Geoscience (NSG), and Global Energy Transition (GET).

in Carbonate Reservoirs:
to Development
7-9 April 2026 – Kuwait City, Kuwait
This workshop will bring together industry leaders, researchers, and professionals to explore the latest advancements and challenges in complex carbonate reservoir exploration, characterisation and development. Participants should gain practical insights into production optimisation, reservoir management strategies and innovative technologies shaping the future of carbonate resource recovery. The event offers a unique opportunity to exchange ideas, share best practices and collaborate on solutions that address both immediate and long-term industry needs. Don’t miss the chance to contribute to advancing efficiency and maximising recovery in carbonate reservoirs.
Early bird registration deadline: 2 February 2026

13-15 April 2026 – Maputo, Mozambique
Energy leaders, geoscientists, engineers and policymakers are expected to discuss the future of Sub-Saharan Africa’s energy landscape. Through engaging sessions and discussions, participants will explore the journey from frontier exploration to proven play development, focusing on how to maximise value, enhance operational efficiency and strengthen energy resilience. The forum will also spotlight innovative technologies driving smarter subsurface understanding and faster resource delivery. In addition, conversations on renewables, hydrogen, CCUS, wind and solar will highlight pathways toward a more sustainable and secure energy future.
Early bird registration deadline: 9 March 2026


9th EAGE Conjugate Margins Conference & Exhibition
27-31 July 2026 – St John’s, Newfoundland and Labrador, Canada
Now approaching 18 years since the first meeting in 2008, the Conjugate Margins Conference continues to unite industry, academia, and government to explore the geological evolution and energy resource potential of the Atlantic margin conjugate basins. The 9th edition will feature technical sessions, posters, and workshops focused on rifted margin processes, deepwater systems, geodynamics, and emerging energy themes. Join colleagues from around the globe to share new research, foster partnerships, and celebrate nearly 20 years of advancing the science and exploration of Atlantic conjugate margins while in North America’s oldest and easternmost city.
More information coming soon, stay tuned!
EAGE Workshop on Exploration and Opportunities in the Paleogene Play
28-29 July 2026 – Jakarta, Indonesia
With the theme Unlocking frontier potential in Asia Pacific’s upstream oil & gas sector, the workshop will serve as the official APGCE 2026 curtain raiser. The Paleogene succession (Paleocene, Eocene, Oligocene) is emerging as a promising, yet underexplored, petroleum system. Traditionally overshadowed by younger Miocene and Pliocene plays, recent discoveries and advancements in deepwater access, geophysical imaging and geological models are driving renewed interest. This workshop aims to highlight regional case studies, foster technical discussions and promote strategic collaboration to explore the Paleogene play.
Call for abstracts deadline: 13 February 2026
More than 90 scientists gathered in Bucharest for the Fault and Top Seals 2025 (FTS25) conference on 15-18 September 2025 to discuss CO2 and hydrogen storage, geothermal energy and hydrocarbon exploration. This is the report.
FTS25 combined technical sessions, networking events and a field trip to the Carpathian Foothills offering both theoretical insights and hands-on geological experience. The conference featured 44 presentations, including six keynote lectures, and eight poster presentations. PACE grants enabled early-career researcher participation through fee-waivers. Three dominant trends emerged throughout FTS25, signalling where fault and seal research is heading.
Most striking was the focus on energy transition applications. Greg Rock from OMV Petrom discussed E&P strategy beyond 2030, illustrating how operators are repositioning petroleum-focused fault and seal knowledge toward secure CO2 and hydrogen containment. Robert Gruenwald from ADX Energy highlighted complexities of predicting fracture permeability in deep hot rocks for geothermal extraction and tectonic brine mining, demonstrating that traditional hydrocarbon workflows require significant adaptation for high-temperature, high-stress environments. Presenters showed practical pathways for transferring expertise to new energy domains while ensuring storage integrity and reducing subsurface risk.
Several keynotes tackled fundamental uncertainties. Signe Ottesen from Equinor posed the provocative question, ‘What does a leaky fault look like?’ sparking debate about whether current methods adequately capture dynamic seal behaviour. Dave Quinn from Badley Geoscience countered with ‘Structure is still king’, arguing that structural complexity remains the dominant control on seal performance. Quentin Fisher from the University of Leeds outlined what the community knows and does not know about fault rock flow properties. These contrasting perspectives generated vigorous discussion about whether incremental refinement or fundamental methodological shifts are needed.
Data analytics and AI featured prominently. Auke Barnhoorn from Delft University of Technology presented laboratory-derived active-acoustic monitoring strategies for forecasting stress changes and fault reactivation, demonstrating how emerging technologies could provide early warning systems for storage projects. However, speakers consistently emphasised that AI must be paired with sound geological interpretation. The consensus was clear: algorithms accelerate workflows and identify patterns, but geological intuition remains vital to validate outcomes and avoid misleading correlations.
Global applicability, local complexity
Research spanned topics such as Mercia mudstone (UK), marl smear zones (Malta), Kazusa forearc basin (Japan), Carpathian foreland (Romania), Ionian zone (Greece), Wisting field and Svalbard (Norway), Santos Basin (Brazil), Niger Delta (Nigeria), Gulf of Thailand, Flemish Pass Basin (Canada), Vienna Basin (Austria), and many more. This geographic diversity revealed that while fundamental principles translate across regions, local geological complexity demands site-specific solutions.
The most contentious discussion centred on whether fault and seal expertise from hydrocarbon exploration can be directly applied to energy transition projects, or whether fundamental differences in fluid properties, timescales and risk tolerances require new paradigms. While presenters demonstrated successful adaptations, sceptics questioned whether analogies from oil and gas hold for hydrogen’s molecular behaviour or geothermal’s high temperatures. This debate will intensify as storage projects reach operational phases.
Dave Quinn’s assertion that ‘structure is still king’ resonated widely. Seismic resolution limits, subsurface heterogeneity and sparse well data continue to dominate uncertainty budgets. The community acknowledged that while improved fault rock property understanding helps, structural interpretation quality remains the primary lever for reducing seal risk.
Delegates welcomed AI and machine learning but firmly rejected any notion that algorithms could replace geological reasoning. The field trip to the Carpathian Foothills reinforced this perspective: participants examined fault and seal relationships in a major hydrocarbon-prolific region, visiting Buzău mud volcanoes on faulted anticline flanks. This hands-on experience with complex fold-and-thrust geometries and salt tectonics underscored that field observation and theoretical knowledge must work in tandem.
An unexpected but significant outcome was frank discussion about FTS conference sustainability. Delegates openly addressed financial challenges, difficulties attracting early-career researchers and concerns whether fault and top seal research importance will remain the same throughout the energy transition. This transparency reflects maturity but also urgency – decisions on conference format and support mechanisms will need to be made soon.
FTS25 successfully balanced technical rigour with practical application, reflecting a community in transition but not in crisis. The research demonstrates that fault and seal research is expand-
ing rather than contracting, finding renewed purpose in energy transition challenges. Future editions will likely see greater emphasis on CO2 and hydrogen storage, closer integration with regulatory discussions, and continued evolution of monitoring technologies. The conference reinforced that fault and seal research will remain at the intersection of subsurface science and global energy policy for decades to come.
The Technical Committee, co-chaired by Ioan Munteanu from University of Bukarest and Sarah Weihmann from RWTH Aachen University, gratefully acknowledge the invaluable contributions of all participants, session chairs, keynote speakers, and sponsors (Z-Terra North, OMV Petrom, Badleys Geoscience, PE Limited), and the EAGE event coordination team.
In a special webinar Geophysical Activities in Space Exploration – Moon, Mars and Beyond, EAGE members were invited on an extraordinary journey across the solar system. The session was presented by Bruno Pagliccia, senior acquisition geophysicist at TotalEnergies and space exploration advocate, and moderated by Simon Stähler of ETH Zürich, and offered insights on how geophysical methods are shaping exploration beyond Earth. Supported by the EAGE Seismic Acquisition Technical Community, the event was an example of EAGE’s commitment to bringing innovative, multi-disciplinary perspectives to members.
Pagliccia began by revisiting the pioneering days of lunar geophysics. During the Apollo missions of the 1970s, astronauts deployed seismic sensors, seismograms and gradiometers on the Moon’s surface, bringing mortar shells and grenades along for controlled seismic experiments. Those missions may sound like a ‘crazy time to travel’, but the data they produced was rich and is still studied nowadays, despite the harsh lunar conditions (temperatures swinging between -180°C and +130°C, intense radiation and abrasive dust) causing the instruments’ electronics to degrade. New studies continue despite these challenges. China’s recent missions have produced the first ground penetrating radar (GPR) profiles of the lunar subsurface revealing complex overburden structures and proving that lunar geophysics is far from a closed chapter.
On Mars, seismic science is ongoing. NASA’s InSight mission, equipped with a state-of-the-art seismometer, recorded Marsquakes for a couple of years that
provided insights into the planet’s interior. Yet, as Pagliccia explained, the greater challenge lies not in data collection but in logistics, as around 85% of the fuel used in a mission is just to escape Earth’s gravity. Using local resources in space – such as water for rocket refuelling or helium-3, a potential key ingredient for future nuclear fusion – will be critical for deeper exploration.
This quest for resources has ignited a new phase of activity known as In-Situ Resource Utilisation (ISRU). Over the past decade, agencies such as NASA and the Luxembourg Space Agency (LSA) have championed efforts to identify, extract and regulate extra-terrestrial resources. However, Pagliccia cautioned that current legal frameworks remain fragmented. The Artemis Accords, now supported by 56 countries, represent the most advanced initiative to date – yet notably, not all major spacefaring nations are signatories.
‘Without a globally recognised framework,’ he warned, ‘we risk a new kind of space gold rush’.
Looking ahead, a new era of space geophysics is emerging. One promising development is the Spider mission to the Moon by Fleet Space Technologies (planned for launch in late 2026), which will include seismic-grade MEMS-based sensors developed by Innoseis Sensor Technologies.
Innoseis Sensor Technologies CEO Mark Beker joined the webinar to comment on the objectives of Spider from a geophysical perspective. These include measuring lunar background noise, mapping water ice deposits and characterising the shallow lunar crust and meteorite impact zones. As Pagliccia pointed out,

true seismic mapping of the Moon will eventually require a significant number of such sensors, and MEMS technology may finally make that feasible.
Beyond the Moon and Mars, another exciting mission – Dragonfly – will bring an array of geophysical instruments to Titan, including spectrometers and geochemistry packages within the DraGMet toolkit, to study its dense atmosphere and methane-based liquid cycle as well as the seismic activity.
The key takeaway? Seismic instruments have consistently proven their worth, and many future missions are scheduled to carry them. Yet despite its strong scientific base, Pagliccia noted Europe still lags behind in fully integrating geoscientific expertise into space exploration. The space sector is only beginning to recognise the potential of geophysics for future resource exploration, and there is clear room for growth and collaboration.
At the close of the webinar, when asked what his ideal mission setup would look like, Pagliccia hinted: ‘That’s exactly what we’ll talk about at the EAGE Annual in Aberdeen’. This webinar was the first step in sparking interest. Those keen to continue this conversation are invited to join the dedicated session Geophysics for space resources exploration at the upcoming EAGE Annual and explore the next frontiers for geoscientists.
Students at EAGE’s Future of Mineral Exploration event on 14-16 October 2025 in Santiago, Chile reflect on their experience.
Universidad Andres Bello (UNAB)
Throughout the conference, various topics were addressed, including new technologies applied to geosciences, sustainability in mining and the role of innovation in exploration processes. Such discussions are essential for students, as they allow us to understand where the industry is heading and the role that new generations of geologists can play.
We were happy too that Natalia Ferrada and Diego Aballay from our chapter participated in the GeoQuiz, where we proudly achieved first place.
We would like to thank EAGE for organising this event and for promoting opportunities that connect future professionals with the modern world of mineral exploration. Without a doubt, this experience reinforced our motivation to continue learning and contributing, through geology, to the responsible development of mineral resources in Chile.
My participation was an extremely enriching experience. Given my background as an electronic engineer, it allowed me to get a closer look at the new technologies that are shaping the future of exploration. I would particularly highlight the presentations by experts in geophysics and geology, who showcased novel techniques for subsurface characterisation, leveraging
different acquisition physics and integrating artificial intelligence as a key complementary tool.
I also had the opportunity to be a speaker and contribute my own research to the discussion, and the feedback I received from the experts was very constructive. I also participated in the event’s GeoQuiz. It was an engaging and multi-disciplinary challenge that truly put our knowledge of geology and geophysics to the test, and I was pleased to win second place.
Chapter
Twelve students from the UM School of Geology attended, ranging from fifth to final semester, demonstrating great interest in the current and future trends of applied geosciences. The Congress offered a unique opportunity to listen to, question and be questioned by leaders in the field. The most valuable learning, as noted by many of our participants, was gaining exposure to the ‘non-academic’ side of the profession. Hearing from industry professionals about the innovative and contingent projects they are
currently working on, such as marine mineral resources, sustainable water management, lithium exploration, and new exploration techniques offered an invaluable perspective that complements our studies in hydrogeology, geo-environmental, hydrogeochemistry, and geophysics.
A highlight was the opportunity for our students to showcase their own research. Four final-year students had the chance to present their work to an audience of experts. Jorge Navarro on Integrating reactive geochemistry into unsaturated flow numerical models of waste rock dumps: Implications for acid generation and metal release, Guillermo Donoso on Application of intelligent iron alginate nanomaterials for the removal of arsenic from mining affected waters and Felipe Gutiérrez on Copper (Cu) recovery from leaching waste solutions using functionalised nanomaterial based on iron oxide nanoparticles FexOy and mollusc shells showed their technical work in poster format, covering highly relevant themes. Meanwhile, Genaro Barbato gave a presentation on stage, detailing his thesis Copper slag as a precursor in the synthesis of metal oxide nanoparticles. Presenting at such a high-level forum was both a challenge and a great satisfaction.
The competitive spirit of our delegation was fully manifested during the GeoQuiz when four of our students won third place in the competition.
The EAGE Student Fund supports student activities that help students bridge the gap between university and professional environments. This is only possible with the support from the EAGE community. If you want to support the next generation of geoscientists and engineers, go to donate.eagestudentfund.org or simply scan the QR code. Many thanks for your donation in advance!
Sathes Sandasegaran is five years into his career as a reservoir geoscientist at Petronas, Kuala Lumpur. A strong academic start and first job with analyst Rystad Energy belie his sometimes challenging upbringing. Throughout he says EAGE activities have provided constant support and encouragement.

Early life challenges
I grew up in a small town in Malaysia, known as Batu Caves, an area renowned for massive limestone cave backdrops. Living in a small multi-cultural neighbourhood, I was enrolled into a Chinese-speaking school although this wasn’t my native language (what were my parents thinking!). The upside was I came to master the four main languages in Malaysia, and enjoyed debating. More importantly I found myself increasingly aware of an environment where energy wasn’t always necessarily accessible, fuelling my life-long interest in energy issues.
Move to university
I began my studies at Universiti Teknologi Petronas (UTP) with an engineering foundation course but soon gravitated towards petroleum geoscience. By this time my mum was the sole bread winner after my dad passed away. To help pay my way, I took on multiple jobs (McDonald’s, transcribing, tutoring, etc). Fortunately I landed on a study scholarship that brought some relief. Another complication was the Covid outbreak in my final semester. For us students it did have the effect of improving our digital skills as everything went online. Some five years late at a long delayed graduation ceremony, I was happy to be recognised as valedictorian of my year with a Chancellor’s award. In my valedictorian address, I shared my experiences, gratitude to my mum for her immense sacrifices, and my philosophy to press forward and not ‘self-reject’, a tempting negative response during the pandemic.
I saw the value in EAGE involvement early on at university, served as the president of the UTP Student Chapter and actively organised numerous technical and career events. We even won the best student chapter at EAGE Annual. You could say that I grew my career with EAGE and am now currently actively working on young professionals activities in the Asia region.
I kickstarted my professional career as a regional E&P analyst with Rystad Energy in Kuala Lumpur. I was coached by great mentors to adapt a granular approach in carrying out data research and analysis. This sometimes required technically sound workflows, plenty of creativity and assumptions especially when dealing with limited public domain data. The experience allowed me to develop a big picture view of the global energy trends, as well as industry decarbonisation strategies.
Unexpectedly, immediately after my valedictory address, I was approached and offered the opportunity to join Petronas by a member of the company leadership team present. There followed a series of rigorous structured interviews and assessment which eventually landed me a job as a reservoir geoscientist.
As a reservoir geoscientist, I work with a multi-disciplinary team collaborating to deliver field development plans to produce company discoveries in a cost-effective manner and manage the carbon emissions
responsibly. I contribute to the geophysical assessments for building an integrated reservoir model. We deal with big data and cutting edge technologies, and every day we face different complexities and challenges. I find that really cool. Petronas also empowers us to drive our own career path. As an AI junkie, I am accorded plenty of opportunities to evaluate the applications of machine learning to our complex problems in geophysics and static modelling.
Five years into my career has been an incredible journey, and I am looking forward to continue the work reimagining how we approach energy. I recently completed an Masters at IFP School with a focus on integrated reservoir modelling through the Petronas Development programme. My next step will be to broaden my horizons through an MBA to develop a strong techno-commercial sense.
In my view, it’s imperative that we strive for a just transition, one that recognises the social and economical implications of a transition into a low carbon economy. In developed countries, energy is accessible and renewable energies are cost competitive. This is often not be the case for developing countries, where energy security and accessibility still remains a challenge. A successful transition would be a well-functioning, inclusive and low carbon economy.
I enjoy backpacking trips to immerse in nature and, more recently, I have hopped on the pickleball bandwagon!
BY ANDREW M c BARNET

Not unlike geoscientists, the job of historians is to provide a narrative and understanding of the past that can never be definitive. We can always question the selection and interpretation of the ‘facts’ upon which histories are built. Our views of the past inevitably tend to reflect contemporary preoccupations and prejudices.
In this regard academic history has seen an extraordinary evolution. For example, not that long ago in the UK education system, it was possible to be taught topics like the Tudor and Stewart eras of the 16th and 17th century several times over, at elementary, high school and university level focusing almost entirely on the political, i.e., the rulers, their governments, wars, diplomacy, etc. Ambrose Bierce, author of the satirical The Devil’s Dictionary, described such history as ‘an account, mostly false, of events, mostly unimportant, which are brought about by rulers, mostly knaves, and soldiers, mostly fools.’
Luckily we have moved on. Nowadays the addition of cultural, social and economic studies is introducing to today’s students a much broader historical perspective. As befits our times, the influence of science and technology is also receiving more prominence; and the evolution continues. A case in point is the relatively new discipline of environmental history, and books like The Burning Earth: An environmental history of the last 500 years by Yale history professor Sunil Amrith, recently announced the winner of the British Academy Book Prize 2025. In scope, it ranks with Jared Diamond’s much-debated Pullitzer Prizewinning Guns, germs, and steel: the fates of human societies, published nearly 30 years ago, in providing an outstanding, accessible global history framed by the turbulent relationship over time between human communities and the natural world.
local tribespeople – whom he considered every bit as intelligent and capable as himself – never developed writing, steel tools, centralised governments, or a complex society like that of the British colonists who annexed New Guinea in the 19th century.
‘Our views of the past reflect contemporary preoccupations and prejudices.’
The book made a strong case (subsequently challenged) against the notion that Eurasian hegemony was due to any form of intellectual, moral, or inherent genetic superiority. He concluded that global inequalities were due to geographical and environmental factors, not race. In the broad pattern of human history he argued that Eurasia’s east-to-west orientation was more conducive to the spread of agriculture and domesticated animals compared to the Americas’ north-south orientation. Food surpluses enabled societies to move away from hunter-gatherer lifestyles allowing societies to develop writing, technology and organised governments. This in turn led to the development of the guns, germs and steel that were used to conquer other societies. The germ factor was significant. Ironically, living close to domesticated animals resulted in Eurasian societies unintentionally weaponising the immunities they had developed from a variety of diseases.
Amrith covers some of the same ground but his purpose is different. It is a superbly written contemplation of unfolding human history over the last 500 years from an environmental perspective charting the devastation and human injustice highlighted by centuries of colonialisation around the world starting with the Mongol Empire; the excessive exploitation of natural resources at any cost; catastrophic outbreaks of disease, and the enforced mass population migrations that have occurred.
Diamond’s book stemmed from his research among the remote tribes of New Guinea and turned out to have a significant embedded agenda. He was intrigued by a New Guinean man named Yali who asked why Europeans had more ‘cargo’ (material goods) than New Guineans. It led him to question why Eurasian and North African civilisations have survived and conquered others, and why
Amrith recognises that everything appeared to change with the advent of fossil fuels beginning with coal in the 19th century and petroleum in the 20th century onwards. It seemed that anything was possible and that humans could finally take control of their environment. The upside has been the irrefutably improved prosperity and lifestyle experienced by many countries today, for the most part enjoying the freedoms of speech, worship, and freedom from
want and fear (first articulated by President Franklin D. Roosevelt in 1941). The post-war independence gained by colonised people as the European-dominated world order has collapsed is also signficant. The downside during this period has been two world wars, continued exploitation of underdeveloped, resource-rich nations, ongoing mass migrations and of course, front and centre, our anthogenically-generated heating of the earth.
This is not an angry tract: for that the 2024 publication Exhausted of the Earth: Politics in a Burning World by Ajay Singh Chaudhary, executive director of the Brooklyn Institute for Social Research, is a recent example of the genre. However, Amrith does have a message: ‘When I started out as a historian I saw environmenal concerns as secondary to political rights, economic empowerment and social justice. I now believe that they are inseparable.’ The book records as neutrally as possible a pattern over centuries of often shocking greed, savagery, spread of disease and climate change around the world and the interconnected harm to the environment. Particularly welcome is consideration of central Asian and Far Eastern civilisations too often neglected by western historians. Amrith’s account is brought to life with quotes from witnesses to events, and occasional illustrative references to contemporary fiction, poetry, and cinematic scenes. For example, during the horrors of the First World War that killed 10 million people, Amar Singh Rawat, in a hospital for wounded Indian soldiers in Brighton, England, wrote this moving observation: ‘The condition of affairs in the war is like leaves falling off a tree, and no empty space remains on the ground. So it is here: the earth is full of dead men, and not a vacant spot is left.’
in traditional European history teaching. For example, Amrith begins his narrative with the steppes grass which sustained the power of the nomadic Mongols. Each of the estimated 102,000 soldiers maintained at least five horses, this became unsustainable once invasion of neighbouring countries introduced them to agricultural production.
In the sweep of history, we encounter China’s rice revolution, the impact of abrupt climate change in the 14th century and the concurrent Black Death estimated to have claimed between 30-60% of the population of Eurasia and the Middle East.
The European craving for sugar had huge consequences. Amrith locates the Portuguese boom and bust sugar plantations in Madeira in the 16th century, worked by local Guanches and imported slaved labour, as the precursor to the much larger-scale laying waste of local vegetation and forests in the Caribbean islands and vast tracts of Brazil in order to return maximum profit for investors. Between 1492 and 1866, 12.5 million enslaved human beings crossed the Atlantic, possibly as many as two-thirds associated with sugar production.
The decimation of the indigenous population in the Americas (by the sword of Spanish/Portuguese conquistadors and imported disease) is another tale of ruthless exploitation of resources as is the account of the later history of South African mine development, the inhumane treatment of the labour force and the astonishing rise of Johannesberg as a prosperous city.
‘Themes never seriously included in traditional European history teaching.’
When we reach the period of post-war optimism, sometimes referred to as the ‘great acceleration’ when technology, medical and other developments including space travel seemed to offer human mastery over the environment, Amrith offers a discursive chapter on some thought leaders of the time. Noting that, by the end of the 1950s, a mass of data was demonstrating how thoroughly human activity had affected forests and rivers, oceans and the atmosphere, he observes how three remarkable women of the era viewed the moral and political issues involved, and measures how far their judgments are valid today. We meet German-born American-Jewish philospher Hannah Arendt, author of The Human Conditon and The Origins of Totalitarianism who warned against destructive growth; celebrated American science writer Rachel Carson, who in the highly influential The Silent Spring, exposed the dangers of the pesticide DDT against vicious and misogynist opposition, e.g., the politican who asked ‘Why is a woman with no children so concerned with genetics?’ and finally Indian Prime Minister Indira Ghandi who was ahead of her times in proclaiming that global inequality had its origins in ecological violence and theft.
In a work that reviewers have called magisterial in its scope and ambition, the themes are numerous, many never seriously included
Counterpoint to the promise of coal-fuelled industrialisation and rise of factories in the UK is an account of the choking smoke in Manchester. When we get to petroleum, its benefits and pollution, Amrith takes us first to Baku, Azerbaijan. It went from spectacular boom in the later 19th century with notable international investors like the Nobel brothers (inventors of dynamite), the Rothchilds and Shell, to catastrophic fall due to labour unrest, international tensions and regime change.
Of the recurrent famines discussed in the book, rarely mentioned are those of Bengal in 1942-43 claiming three million lives, in Henan (two million dead) plus further millions in 1944-45 in Vietnam and Java.
What are we to make of these and many other reminders of our fragile environment? Amrith’s final chapter entitled Roads to Repair, while hopeful, offers little by way of solutions, but in truth that may not be the historian’s task.
Environment history, according to Donald Worster, an early advocate of the subject, ‘was … born out of a moral purpose, with strong political commitments behind it, but also became, as it matured, a scholarly enterprise that had neither any simple, nor any single, moral or political agenda to promote. Its principal goal became one of deepening our understanding of how humans have been affected by their natural environment through time and, conversely, how they have affected environment and with what results.’
In other words, it is not down to historians to draw lessons from the past, always a suspect undertaking.
Views expressed in Crosstalk are solely those of the author, who can be contacted at andrew@andrewmcbarnet.com.


Second EAGE/ ALNAFT Workshop on Techniques of Recovery of Mature Fields and Tight Reservoirs

Submit your abstract now for the Second EAGE/ALNAFT Workshop on Techniques of Recovery of Mature Fields and Tight Reservoirs and share your latest insights and innovations with the community.

Submit your Abstract!


First EAGE/ALNAFT Workshop –Unlocking Hydrocarbon Potential of West Mediterranean Offshore Frontier Basin of Algeria
Be part of this pioneering event — submit your abstract today and join the conversation on unlocking the hydrocarbon potential of Algeria’s West Mediterranean Offshore Frontier Basin.
Submit your Abstract!
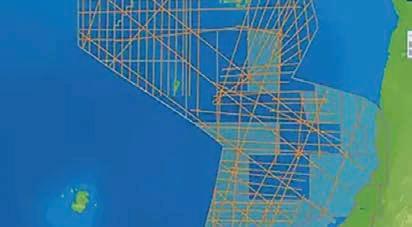
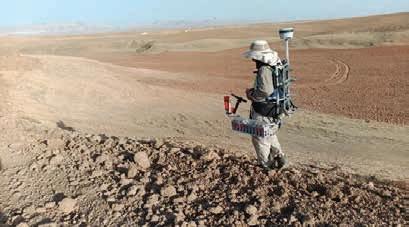
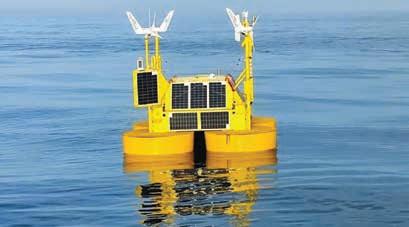
Two of the big seismic data companies have reported improved third quarter results, despite a continued challenging environment driven by oil majors’ continued cost discipline.
Viridien has reported third quarter net income of $31 million on segment revenues of $313 million, compared with a net loss of $10 million on revenues of $246 million in Q3 2024.
Operating profit of $77 million was up from $23 million in Q3 2023.
TGS reported net profit of $62 million on revenues of $388 million, compared to net profit of $37.5 million on revenues of $501 million in the third quarter of 2024.
Operating profit of $116 million compared to operating profit of $60 million in Q3 2024.
The result, which showed a 26% sequential revenue growth, were particularly encouraging after a ‘weak’ second quarter, said TGS.
Viridien’s Data, Digital and Energy Transition segment revenue of $244 million is up 31% year on year as a result of strong Earth Data late sales. Geoscience revenue of $108 million is up 5%, fuelled by large OBN projects offshore Brazil, the US Gulf and the Middle East.
Earth Data (EDA) revenue at $136 m is up 63% year on year, fuelled by market appetite for high-end data and
good progress on the Megabar Extension Phase 1 project in Brazil.
Sensing and Monitoring third quarter segment revenue of $69 million was up 16% year-on-year. ‘Activity remains
solid net cash flow generation. Our main focus on major offshore projects and close collaboration with leading energy companies continue to drive our performance.’
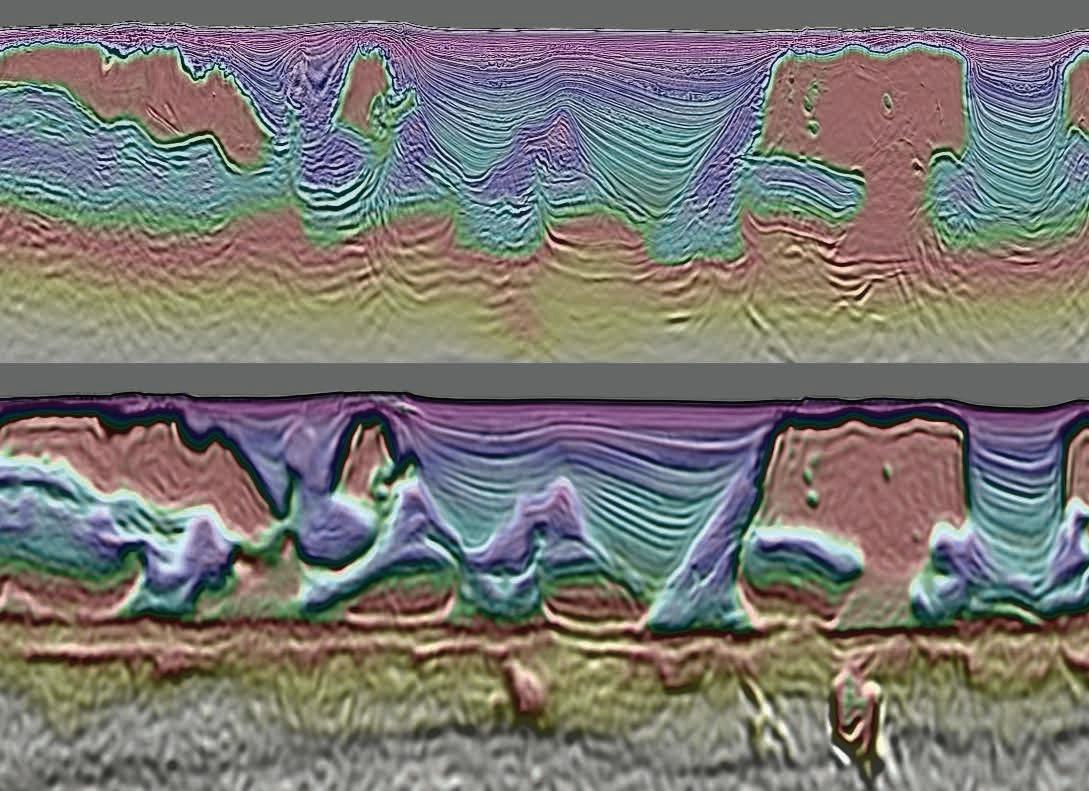
largely driven by the Land segment, with a mix of flagship high-productivity surveys ongoing in North America and medium-to-small crews ensuring business resilience across South America, the Middle East, and Asia,’ said Viridien.
Sophie Zurquiyah, chair and CEO of Viridien, said: ‘Viridien delivered a strong third quarter, contributing to
Meanwhile, at TGS order inflow was $436 million during Q3 2025 bolstering total order backlog to $473 million. Strong cash flow reduced net debt to $432 million, compared to $479 million at the end of Q2 2025.
TGS CEO Kristian Johansen said: ‘In a quarter marked by macroeconomic uncertainty and volatile oil prices,
we are pleased to report solid financial results. Our multi-client segment performed well, primarily driven by strong library sales. Higher-than-anticipated asset utilisation and continued robust growth in imaging activity contributed to contract revenues exceeding our initial expectations.’
Multi-client sales of $217 million were still considerably below the $280 million of Q3 2024 while contract sales of $170 million lagged behind the $221 million of Q3 2024. As a result, TGS reduced its capex guidance for 2025 to $110 million from $135 million.
‘While we continue to observe encouraging signals in ongoing client discussions, the short-term outlook remains uncertain due to pressure on E&P companies’ cash flows from low oil prices,’ said Johansen. ‘Nevertheless, we remain confident in the long-term outlook, as increased investments in new oil and gas resources will be essential to meet long-term demand forecasts.’
In its outlook, TGS said: ‘The rapid decline of existing production, coupled with rising costs, and increasing environmental and regulatory complexity highlights the need for more exploration, in both mature and frontier basins. High-quality subsurface data is critical for optimising production from existing assets and enabling efficient exploration. In Q3 2025 several oil companies announced exploration successes, reinforcing the importance of new discoveries to meet future energy demand.’
Despite oil price volatility, Viridien said in its outlook that exploration and seismic activities are expected to remain resilient, with potential spending cuts more likely to affect other parts of the value chain. ‘Exploration and seismic are supported by structurally positive fundamentals, as E&P operators increasingly recognise the risks to production sustainability in a context of accelerating field depletion and the need to secure long-term resource supply.’
Searcher Seismic has launched a major seismic reprocessing project covering 8500 km of offshore data in Equatorial Guinea.
The project aims to deliver high-resolution imaging of the country’s offshore basins ahead of the EG Ronda 2026 licensing round, with fast-track results available immediately and final deliverables scheduled for release before the round opens in April 2026.
Using the latest broadband Pre-Stack Depth Migration (PSDM) and Full Waveform Inversion (FWI) techniques, the reprocessing will transform legacy datasets into a high-definition view of the subsurface, ‘bringing unprecedented clarity to Equatorial Guinea’s offshore basins and revealing untapped exploration potential,’ said Searcher.
‘With the government preparing to offer up to 24 blocks in the upcoming licensing round, high-quality seismic imaging is essential for confident decision-making,’ said Searcher in a statement. ‘By delivering reprocessed data with enhanced
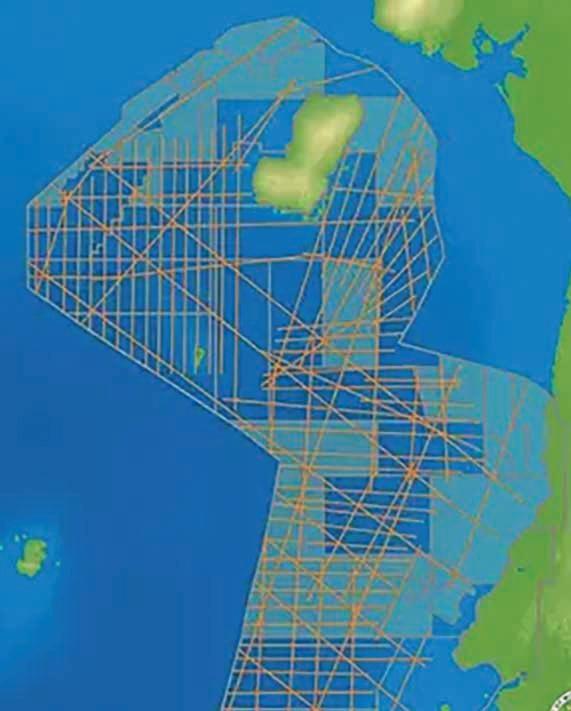
structural and stratigraphic resolution, Searcher is helping to de-risk exploration efforts and attract new investment to the country’s offshore domain.’
Alan Hopping, managing director of Searcher, added: ‘By combining cutting-edge imaging with fast-track delivery, we’re giving explorers a head start and helping Equatorial Guinea showcase the true potential of its offshore basins.’
Sercel has won a big contract from India’s Oil and Natural Gas Corporation (ONGC) to supply a large-scale 528 cable-based land seismic acquisition solution.
The order includes three 528 acquisition systems, representing a total of 24,000 channels, and 24,000 SG-5 geophones, with delivery scheduled before year end.
ONGC will deploy the systems on oil and gas exploration surveys across difficult-to-access terrain in India during the 2026 acquisition season.
‘Building on the commercial momentum of the 528 since its launch in 2024, this sale highlights industry recognition of its operational flexibility, reduced power consumption, and lightweight design,’ said Sercel in a statement. ‘With its scalable architecture, it can also be seamlessly adapted to the diverse requirements of ONGC’s upcoming survey operations. The SG-5 geophones, known for their high-sensitivity low-frequency performance, high signal fidelity and durability, will further enhance the quality of seismic data acquired during the surveys.’
DMT Group has selected STRYDE’s Nimble Seismic System to acquire high-density seismic data for an onshore 3D oil and gas exploration project in the Kurdistan Region of Iraq (KRI).
This collaboration will enable the acquisition of detailed, high-resolution subsurface data in some of the region’s most complex and challenging terrain. The seismic data gathered from this project will be instrumental in reducing geological uncertainty, improving reservoir characterisation, and enhancing well placement strategies.
STRYDE said that DMT will deploy 31,000 nodes with ‘minimal personnel, reduced health and safety risk, and less environmental footprint’. ‘We’re excited to see our technology supporting another
ambitious and strategically important exploration campaign in the Middle East,’ said Mehdi Tascher, sales director at STRYDE. ‘Achieving the resolution required for accurate subsurface imaging and confident exploration decisions relies on data density captured through nodes deployed in a dense receiver grid,’ he added.
Thorsten Mueller, manager of DMT’s branch office in KRI, said: ‘STRYDE’s system is a critical enabler for delivering the data density our client needs from this challenging area. The small, lightweight nature of the nodes will allow us to efficiently deploy a high number of receivers in remote and difficult-to-access locations. Coupled with the STRYDE’s high-capacity node harvesting and data handling system, this means we can operate with
TotalEnergies expects global oil demand to rise until 2040 before declining gradually in a revision of its previous forecasts as a result of energy security concerns and a lack of political co-ordination to slow efforts to cut emissions.

The company’s annual energy outlook showed that oil demand will rise nearly 5% to 108 million barrels per day in 2040 under current trends, driven mainly by India, with global consumption then dropping to 98 million bpd in 2050.
greater agility, lower logistics overhead, and acquire the high-quality seismic data needed for our customer.’
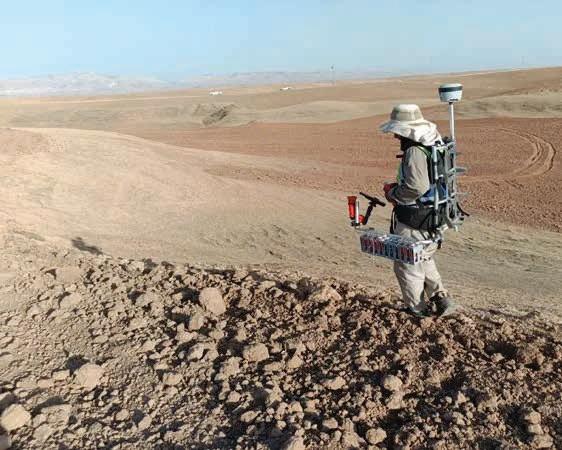
In STRYDE’s Nimble Seismic System, each harvesting Nest can charge and harvest 90 nodes through an optical link in less than less hours.
The report outlines three scenarios: current trends, a moderately ambitious ‘momentum’ scenario, and a ‘rupture’ scenario aligned to the Paris Agreement. Under TotalEnergies’ ‘momentum scenario’, oil demand would be 79 million bpd in 2050. The Paris-aligned scenario would see consumption fall to 55 million bpd in 2050.
TotalEnergies CEO Patrick Pouyanne said that the rupture scenario was becoming increasingly unrealistic. ‘Given the level of political fragmentation, the probability of its success is diminishing, even out of reach, because the international co-ordination required is not what we see today.’
Pouyanne added that since last year China had overtaken the US as the leader in setting the pace for energy transition as a result of President Donald Trump’s cancellation of green subsidies and offshore windfarm projects. ‘China in 10 years has become the clean tech superpower, the new energy supermajor, and it’s spectacular; they must have an 80% market share in all the technologies we need tomorrow.’
Global natural gas demand is expected to rise by about 10%, reaching 4620 billion m3 by 2050, driven mostly by demand in Asia. Electricity demand, meanwhile, is projected to nearly double to 57,140 terawatt hours in 2050, led by the transport and cooling sectors.
Power demand from data centres will account for 7% of electricity demand in 2050, as a result of the revolution in artificial intelligence, the report showed.
TGS and Chevron have signed a three-year capacity agreement for marine streamer and OBN acquisition services. The minimum firm commitment under the capacity agreement is 18 months for a combination of OBN and streamer acquisition services.
The parties plan to collaborate on seismic acquisition projects utilising TGS streamer and OBN crews for exploration and development projects. The CA will also drive collaboration on technology development in a wide range of geophysical areas from survey design, acquisition technology, data collection, and data integration. The previously announced St Malo 4D OBN reservoir monitoring contract in the Gulf of America, will be included in the agreement and will kick start the collaboration immediately.
Kristian Johansen, CEO of TGS, said: ‘This agreement not only provides crucial utilisation and visibility for both parties but also creates an opportunity for collab-
oration across our wider service portfolio. Our shared focus on new frontier areas makes us highly complementary, and we are excited to immediately begin supporting Chevron’s global exploration and reservoir management strategies.’
Meanwhile, TGS has won an OBN acquisition contract in Gulf of America. The 4D monitor survey is scheduled to commence in Q4 2025, and the acquisition duration is approximately 4.5 months.
Johansen said: ‘The Gulf of America is a core market for our OBN business, and we are very pleased to secure this contract for a repeat IOC customer. The client values our OBN technology, and in combination with our proven track record of project execution and timely delivery, they are confident we will deliver high-quality data and insights to optimise production from one of their highest producing facilities in the Gulf of America.’

Finally, TGS has won a streamer acquisition contract in Africa. Acquisition is scheduled to commence in Q4 this year and the contract has a duration of approximately 50 days.
Corcel has commissioned BGP to carry out a seismic survey onshore Angola after receiving final government approval.
The company has signed a contract with BGP to carry out a 326 line-km 2D seismic acquisition program within the KON-16 block.
Seismic processing is scheduled to occur during Q1 2026, with initial results expected to follow in Q2/Q3 2026. The
contract is expected to be awarded for the seismic processing by the end of 2025.
The government of Angola has issued an environmental licence covering both the seismic acquisition and exploration drilling within KON-16. Richard Lane, Corcel COO, said: ‘Receiving approval to conduct both seismic acquisition and exploration drilling activities is a major milestone for Corcel.’
Viridien has completed an integrated geological study to provide prospectivity insights into the underexplored Langkasuka Basin in Malacca Strait, offshore Peninsular Malaysia.
The company said that the 38,000 km2 study, in collaboration with PETRONAS, will provide explorers with ‘a competitive
advantage by better informing their licensing and investment decisions’.
Multi-disciplinary technical experts from Viridien’s Earth Data team have leveraged the company’s recent Selat Melaka multi-client 2D seismic dataset and datarich GeoVerse geological database to create ‘innovative methodologies that address and
overcome the unique challenges of this basin, delivering unparalleled insights into the unexplored Paleozoic interval’.
Dechun Lin, head of Earth Data, Viridien, said: ‘This study will enable confident, data-driven exploration decisions in Langkasuka and adjacent basins in the region.’
Geoteric has signed a deal to continue supplying Perenco with AI licences to support the energy company’s exploration and development projects across offshore Africa, South America, and beyond.
Perenco has accredited Geoteric’s solutions to its success in improved history matching and subsequent enhanced hydrocarbon recovery. Geoteric AI Fault Interpretation was attributed to detecting fault lineaments not previously interpreted to help explain fluid flow in a mature field, offshore Cameroon.
‘Geoteric’s AI and interpretation tools have become an integral part of our exploration and development workflow,’ said Max Shaw-Champion, chief geophysicist, Perenco. ‘They provide the clarity and efficiency we need to make confident decisions, no
matter the geology. This continuation of the partnership reflects our continued trust in Geoteric’s AI technology and the results it helps us to deliver.’
The renewal will enable Perenco’s asset teams to accelerate subsurface understanding, enhance reservoir characterisation, and improve production and reserves, said Geoteric.
David Macaulay, VP Sales and strategic partnerships, Geoteric, said: ‘Their confidence in our AI Seismic Interpretation suite highlights the growing role of AI in transforming geoscience workflows. Together, we’re enabling geoscientists to make faster, more accurate decisions and unlock greater value from their assets.’
Geoteric has delivered more than 500 AI projects.
Eliis and Searcher have announced a strategic partnership to analyse extensive seismic data from the Orange Basin, offshore Namibia. The project will leverage Eliis’s PaleoScan software to screen and interpret Searcher’s large-scale 3D multi-client seismic surveys.
The collaboration focuses on Searcher’s 20,000 km2 of 3D data in the prospective basin (in partnership with Shearwater) and South Africa. PaleoScan will be used to rapidly screen and interrogate the 3D seismic data. The software platform uses a patented Relative Geological Time (RGT) model and AI-assisted functionality to automate parts of the interpretation workflow. The approach accelerates stratigraphic modelling and provides valuable geological insights with greater speed and precision, which is ideal for frontier exploration projects, said Searcher.
‘We are partnering with Eliis to provide the industry with detailed insights
into the evolution of the prospective depositional systems, enabling prospect high-grading and shortening the exploration cycle,’ said Karyna Rodriguez, VP Global New Ventures at Searcher.
François Lafferriere, COO at Eliis, said: ‘The Orange Basin represents a frontier of hydrocarbon potential, and PaleoScan’s unique approach to seismic interpretation will provide valuable support in screening and evaluating this high-quality dataset. This collaboration underscores our dedication to advancing geoscience technology and helping our partners to accelerate their understanding of complex subsurface geology.’
Initial screening has already revealed promising geological features. The process has clearly defined large basin floor fan systems from the Cretaceous period, located above the Aptian source rock. The data also shows well-defined channels and evidence of reworking by contourite currents.
TotalEnergies and Data4 have signed an agreement to supply renewable electricity to Data4’s sites in Spain. The contract will begin in January 2026 for 10 years and will represent a total volume of 610 GWh. TotalEnergies will supply Data4’s facilities with renewable electricity generated by Spanish wind and solar farms.
The Scottish Government has unveiled its draft climate action plan, outlining how it intends to reach net-zero greenhouse gas emissions by 2045.
OMV (51%) and Masdar (49%) have signed a joint venture agreement for the financing, construction and operation of the 140 MW green hydrogen electrolyser plant in Bruck an der Leitha, Austria. The project will be one of Europe’s largest green hydrogen production facilities and marks a major step in OMV’s commitment to decarbonising its Schwechat refinery. The facility is expected to be operational in 2027.
Norway has drawn up guidelines relating to documentation in connection with storage of CO2 on the Norwegian Continental Shelf. Licensees will submit a status report to the NOD within three months after an exploration or exploitation licence is surrendered, lapses or expires. The status report will provide a summary of any collected data, implemented studies and associated results, as well as an overview of potential storage complexes in the exploration or exploitation licence. It will also provide an overview of all geotechnical material.
SLB and Ormat Technologies have agreed to develop integrated geothermal assets, including enhanced geothermal systems (EGS). The partners will streamline project deployment, from concept to power generation.
An independent report by economic consultant BVG Associates claims that Dogger Bank Wind Farm, which will become the world’s largest offshore wind farm once fully operational, will boost the UK economy by $8 billion during its lifetime.
The US Bureau of Ocean Energy Management (BOEM) has released the Final Notice of Sale for Lease Sale Big Beautiful Gulf 1 (BBG1) in the Gulf of America and Big Beautiful Cook Inlet 1 (BBC1) lease sale in Alaska’s Cook Inlet.
BBG1 is the first of 30 Gulf of America lease sales required by the One Big Beautiful Bill Act while (BBC1 is the first of six lease sales in Alaska’s Cook Inlet required by the One Big Beautiful Bill Act
‘President Trump’s signing of the One Big Beautiful Bill Act marked the beginning of a new chapter for oil and gas development in the Gulf of America and Alaska’s Cook Inlet,’ said BOEM acting director Matt Giacona. ‘BOEM is now moving forward with a predictable, congressionally mandated leasing schedule that will support offshore oil and gas development for decades to come.’
Lease Sale ‘Big Beautiful Gulf 1’ will make roughly 80 million acres available for leasing across the Gulf of America.
Certain areas are excluded, including blocks withdrawn on 8 September, 2020, blocks beyond the US Exclusive Economic Zone in the Eastern Gap, and areas within the Flower Garden Banks National Marine Sanctuary.
The Proposed Notice of Sale for BBC1 proposes to make approximately one million acres available for leasing in Alaska’s Cook Inlet. This is the first of at least six Cook Inlet lease sales required by the One Big Beautiful Bill Act, scheduled annually from 2026 to 2028, and from 2030 to 2032.
To encourage strong industry participation, BOEM has set a 12.5% royalty rate for both Big Beautiful Gulf 1 and BBC1 — the lowest rate allowed by statute—for both shallow and deepwater leases.
A Final Notice of Sale will follow, at least 30 days before the scheduled lease sale on 4 March 2026.
TGS and EOLOS have formed a partnership to offer wind and metocean measurement campaigns in Brazil.
TGS will manage client contracts, campaign design, deployment and operations while EOLOS will supply its FLS200 floating LiDAR systems for wind, metocean and environmental measurement services as a subcontractor.
‘TGS is an established partner of EOLOS, with a track record in regions that set the basis for our agreement in Brazil. Proven experience in the offshore sector, demonstrated through our joint competence, together with their existing infrastructure within Brazil and appetite for complementing their existing services with floating LIDAR technology, makes
TGS the candidate familiar to both our end-clients and our own team,’ said EOLOS sales director Julian Harland.
‘This partnership positions TGS to deliver the measurement backbone that Brazil’s offshore wind market needs at scale,’ said Will Ashby, executive vice-president of business development at TGS. ‘We are ready to mobilise multiple EOLOS FLS200 units, deliver fuse measurements with our metocean and geospatial data sets, and provide the clarity developers and investors require to commit capital with confidence.’
TGS and EOLOS have collaborated on wind and metocean measurement campaigns in multiple offshore wind markets globally since 2022.
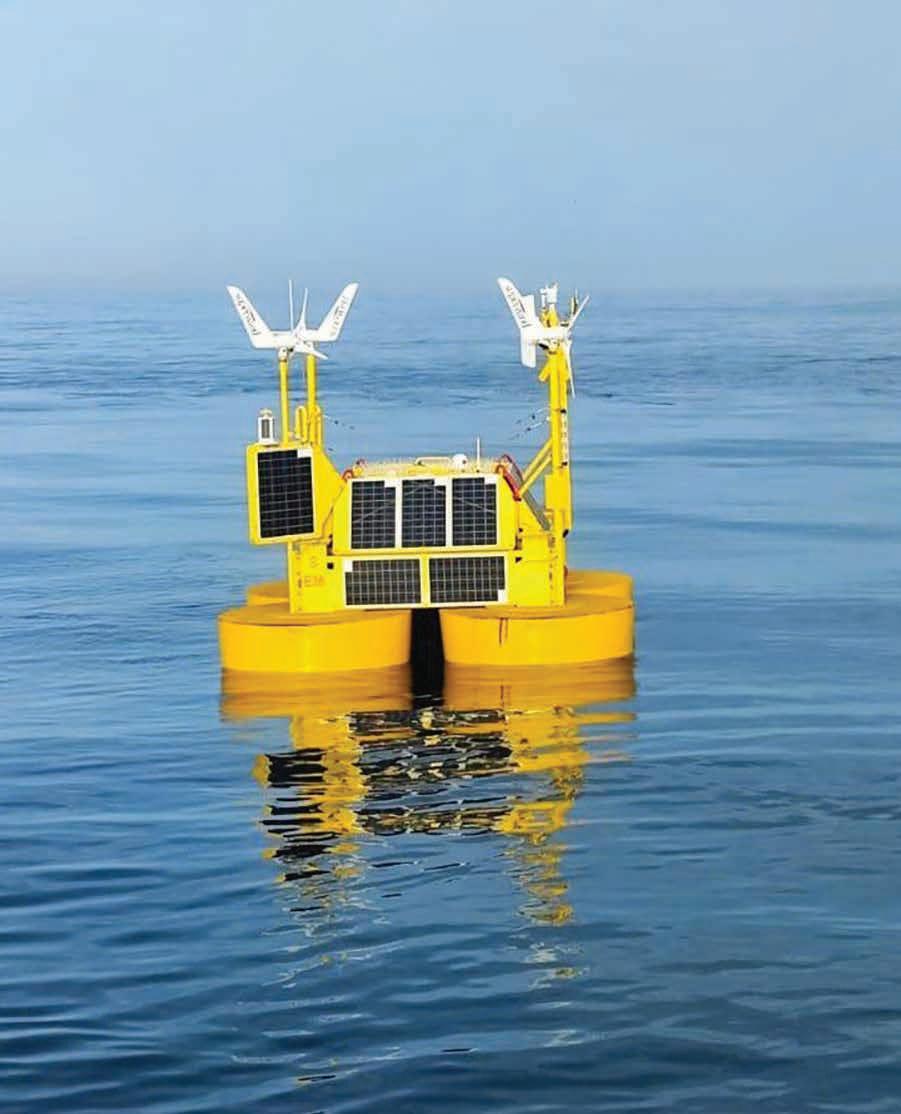
Petronas has formalised an agreement with Putrajaya Holdings Sdn Bhd (PjH) to develop the Petronas Geoscience Technology Centre (PGTC) in the city of Putrajaya, Malaysia.
This facility will serve as a national hub for geoscience excellence, dedicated
to advancing geoscience innovation and capability in Malaysia.
Datuk Ir. Bacho Pilong, senior vice president of Malaysia Petroleum Management, said: ‘PGTC will transform Malaysia’s geoscience landscape by integrating advanced data management, immersive
visualisation, and collaborative research. This vision is further strengthened by PGTC’s pivotal role as the centre of Malaysia’s subsurface heritage, safeguarding over a century of exploration data and ensuring its enduring value for future generations.’
ExxonMobil has reported third-quarter 2025 earnings of $7.5 billion. Cash flow from operating activities was $14.8 billion and free cash flow was $6.3 billion. Excluding acquisitions, the company expects full-year cash capital expenditures slightly below the lower end of the $27 billion to $29 billion guidance range.
Equinor has reported an adjusted third quarter operating income of $6.21 billion and a net operating income of $5.27 billion. Adjusted net income was $0.93 billion. The company reported 7% production growth with strong performance from Johan Sverdrup and Johan Castberg. Total capital spending for 2025 remains in line with announced level of around $9 billion.
Shell has reported adjusted third quarter earnings of $5.4 billion and cashflow from operations of $12.2 bil-
lion. Strong operational performance was driven by record production in Brazil and 20-year highs in the Gulf of America. Net debt has decreased to $41.2 billion.
BP has reported third quarter RC profit of $2.2 billion and operating cash flow of $7.8 billion. The company expects divestment and other proceeds received in 2025 to be above $4 billion. Full year capital expenditure guidance continues to be around $14.5 billion.
ConocoPhillips has reported third-quarter 2025 earnings of $1.7 billion compared with third-quarter 2024 earnings of $2.1 billion. Excluding special items relating to restructuring costs, third-quarter 2025 adjusted earnings were $2 billion compared with third-quarter 2024 adjusted earnings of $2.1 billion. The company expects $12 billion capital expenditures in 2026.
SLB has launched Tela, an agentic AI assistant purpose-built to transform the upstream energy sector.
Tela will be embedded in SLB’s portfolio of applications and platforms, and users will interact through a simple conversational interface.
Tela follows a common five-step agentic AI loop: observe, plan, generate, act and learn. This allows agents within Tela to proactively interact with their environment, adapt to new data, and continuously improve outcomes. Whether interpreting well logs, predicting drilling issues, or optimising equipment performance, Tela agents can work in collaboration with humans or autonomously to deliver faster, smarter decisions, said SLB.
‘Technology like Tela marks a paradigm shift in how AI supports the energy industry, from subsurface to operations,’ said Rakesh Jaggi, president, Digital and Integration, SLB. ‘Today, the industry faces a dual challenge: a
leaner workforce and increased technical complexity, and Tela can address both. Tela doesn’t just automate tasks – it can understand goals, make decisions and take action.’
Powered by SLB’s Lumi data and AI platform, Tela uses agentic AI – leveraging large language models (LLMs) and domain foundation models (DFMs) – to understand domain-specific contexts, generate insights and adapt workflows in real time based on observed outcomes. Lumi’s agentic framework allows customers to build and manage their own Tela agents, integrate partner-developed solutions, and tailor capabilities to their operational priorities.
‘The real promise of agentic AI isn’t just faster workflows – it’s the ability to see the whole system, anticipate what’s next, and act with confidence, learning through the process and transforming workflows for better enterprise-level outcomes,’ said Jaggi.
The UK North Sea Transition Authority’s latest Well Insights Report shows that Well interventions across the UKCS declined from 443 in 2023 to 425 in 2024. However, interventions delivered 37.5 million barrels of oil equivalent (boe) in 2024, equivalent to 34 days of average UK production. Efficiency also improved, as intervention costs fell from £11 per barrel in 2023 to £9.60 in 2024. The NSTA’ identified 200 wells with potential for reactivation. Within a year, there had been interventions at 56 wells, contributing more than 8 million boe of production over 12 months.
The Norwegian Offshore Directorate and Integrated Geochemical Interpretation (IGI) have renewed their agreement to update its geochemical database for the next five years. The database with released geochemical data is updated twice a year with data from recently released wells in Diskos. The database contains 128,000 samples from 1280 wells and is widely used by both industry and academia.
Sercel has won a five-year technical support and maintenance contract from ExxonMobil for the Marlin Vessel Tracking and Alerts (VTA) software solution to be deployed offshore Guyana. The company will provide technical support, system maintenance, and software enhancements for the Marlin VTA solution currently being deployed by the client to enhance operational safety and increase situational awareness of vessel movements offshore Guyana.
Eni and Petronas have established an independent company (NewCo) under equal ownership, by combining their upstream assets in Indonesia and Malaysia. The new entity will manage 19 assets: 14 in Indonesia and five in Malaysia and plans to invest $15 billion over the next five years, supporting at least eight new projects and the drilling of 15 exploration wells, with the aim of developing approximately 3 billion barrels of oil equivalent (boe) of discovered reserves. BRIEFS
TGS has launched the Roosevelt 3D seismic onshore survey in the Uinta Basin in the US state of Utah.
Covering 202 square miles of full fold data, the survey marks TGS’ first multi-client project in the region, targeting key formations including the Green River, Wasatch and Mesaverde formations.
The survey will employ an AVO and Phase Compliant processing flow, applying such techniques as Ray Based Image Correction & Optimisation (RICO), Dynamic Matching diving wave and reflection FWI, along with OVT PSDM and PSTM. Additionally, the survey covers 667 wells and includes 459 LAS logs and 2649 rasters, providing a comprehensive dataset that supports reservoir modelling and decision-making.
Kristian Johansen, CEO of TGS, said: ‘The Roosevelt 3D survey is a pivotal milestone in our expansion into the Uinta Basin. Through the application of advanced subsurface imaging technologies, we are delivering high-resolution data that enhances geological modelling, identifies critical subsurface features and supports informed reservoir exploration and development decisions.’
TGS has plans to integrate depth imaging capabilities in subsequent phases. To support exploration efforts, receiver tails have been implemented to allow continuous data acquisition, offering
Aker BP and DNO have entered into agreement to accelerate development of the Kjøttkake discovery in the Northern Norwegian Sea. The agreement includes an exchange of ownership interests across several licences and the transfer of operatorship for Kjøttkake to Aker BP in the development phase. As part of the agreement, Aker BP will divest its interest in the Verdande field to DNO. In return, Aker BP will increase its stake in the producing Vilje field, expand its position in the Kveikje discovery, and acquire additional interests in several exploration licences.
Staatsolie has signed production sharing contracts for offshore Blocks 9 and 10 offshore Suriname. For Block 9, Petronas (30%) will serve as the operator, alongside partners Chevron (20%), QatarEnergy (20%), and Paradise Oil Company (POC) (30%). For Block 10 Chevron (30%) will serve as operator alongside partners Petronas (30%), QatarEnergy (30%), and POC (10%). The initial exploration period will last three years, during which the
long-term adaptability for future exploration and development projects in the region.
Recording for the Roosevelt 3D will begin in late Q4 2025, with final acquisition expected to conclude in autumn 2026. Preliminary data will be available during 2026, and the fully processed dataset is scheduled for completion by year-end 2026.
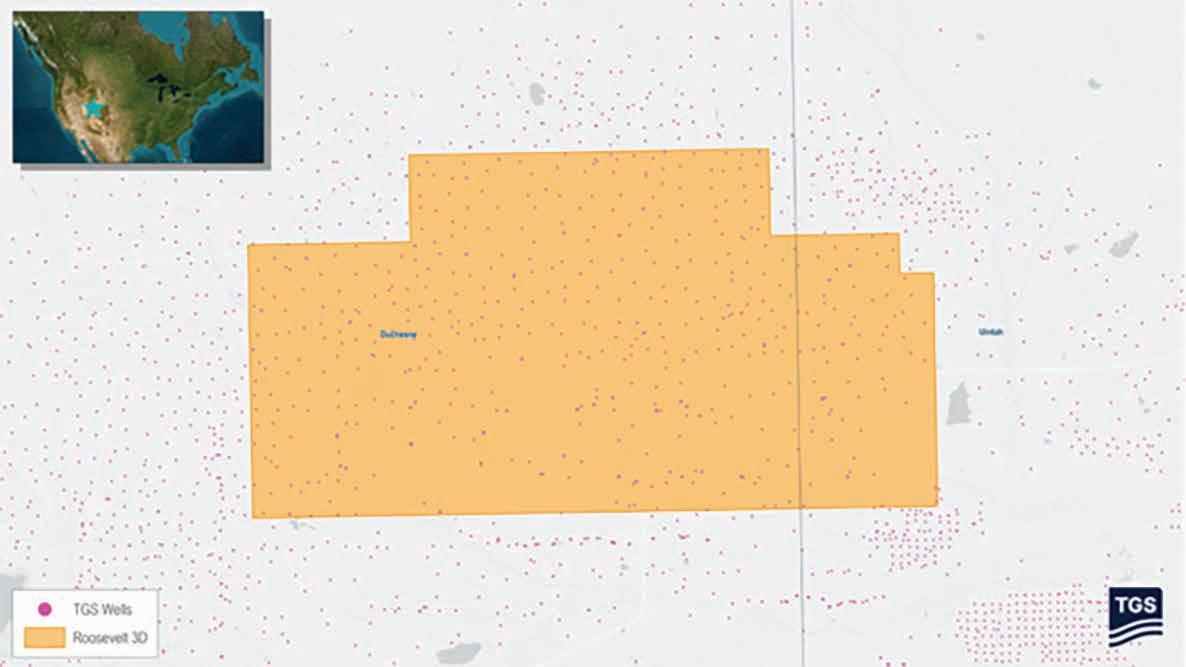
focus will be on acquiring and processing 3D seismic data to map the subsurface structure.
OMV has discovered oil in Block 106/4 in the Sirte Basin, Libya. Production tests show that the exploratory well, reaching a depth of 10,476 feet, is producing more than 4200 barrels of oil per day, with gas production expected to exceed 2.6 million cubic feet daily.
BP and Rhino Resources volans-1X exploration well in Namibia’s Orange Basin Petroleum Exploration Licence 85 (PEL85) has reached a total depth of 4,497.5m TVDSS (true vertical depth subsea) and penetrated the Upper Cretaceous target. The well encountered 26 m of net pay in rich gas condensate-bearing reservoirs, with the reservoir showing excellent petrophysical properties and no observed water contact. Initial laboratory analysis of two samples indicated a high condensate-to-gas ratio (CGR) of >140 bbl/mmscf with liquid density of approximately 40° API gravity.
Aker BP and its partners have drilled a dry well in the Yggdrasil area in the North Sea. Well 30/11-16 S was drilled in production licence 873, just over 1 m east of Fulla and 155 km west of Bergen. The objective of the well was to prove petroleum in the ‘Natrudstilen’ prospect in the Tarbert Formation in the Middle Jurassic. The well encountered the Tarbert Formation with a thickness of about 350 m, 197 m of which were sandstone with moderate to poor reservoir quality. The well is classified as dry with hydrocarbon shows. Hydrocarbon shows were observed in the Hardråde Formation and Tryggvason Formation in the Upper Cretaceous. Well 30/11-16 S was drilled to a vertical depth of 4327 m below sea level and was terminated in the Tarbert Formation in the Middle Jurassic. Water depth is 112 m.
The Norwegian Offshore Directorate has granted Equinor a drilling permit for well 7220/7-5 in production licence 532 in the Barents Sea. Partners are: Equinor (46%) Var Energi (30%); Petoro (24%).
Abdulhamit Akalin1*, Madjid Berraki1 and Wiebke Worthington1.
Abstract
The Breidablikk field, located in the North Sea, was initially considered as having insufficient resources for a viable economic development strategy. The field’s complex reservoir geometry presented significant challenges in subsurface characterisation. This paper illustrates how continuous improvement in data quality enabled a comprehensive understanding of the subsurface, leading to an effective development strategy. We implemented a structured approach in three distinct stages, contributing to enhanced seismic data quality.
In the first stage, we established an interpretation strategy for the Heimdal reservoir and injectite sands using regional well data and insights from surrounding fields. The focus was on analysing variations in acoustic rock properties within the sand injectites, which influence changes in seismic responses. Then the second stage consisted of maximising the value of all available geophysical information; to do so, multi-client seismic data was reprocessed and further preconditioned for quantitative interpretation. Finally, in the third stage, a dense 3D Ocean Bottom Node (OBN) survey was acquired in 2020; all available processing technologies like Time-Lag FWI and Up-Down Deconvolution were used for structural imaging.
The three-step approach enhanced confidence in the seismic interpretation of the reservoir and resulted in refined drilling targets.
Keywords
Sand injectites, field development, seismic data quality
Introduction
The Breidablikk field is situated in the southern Viking Graben, along the northwestern boundary of the Utsira High in the North Sea. The reservoir sands, mainly belonging to the Heimdal Formation, are of Palaeocene to early Eocene age, and are seen approximately 1600-1800ms two-way travel time (TWT).
The Heimdal Formation consists of a few tens of metres of clean sands, which are enclosed within mudstone of the Lista formation. The reservoir shows excellent properties, with an average porosity of 33-34% and multi-Darcy permeability. The development of the formation was greatly impacted by extensive sand remobilisation and injection, resulting in the formation of sand dykes and sills in the overlying strata. These processes have also led to significant structural complexities, presenting challenges for seismic imaging and drilling operations. When initially discovered in 1992 the Breidablikk Field was deemed non-viable for development as the exploration well only estimated a 1 m oil column. However, during 2013 and 2014 two additional exploration/appraisal wells were drilled, revealing a significantly larger oil column of approximately 20-25 m in the other parts of the field. This paper outlines the various steps taken
1 Equinor
* Corresponding author, E-mail: aaka@equinor.com DOI: 10.3997/1365-2397.fb2025090
to overcome the challenge of characterising the reservoir extent and fluid extent distribution in a complex geological setting, ultimately leading to the successful development of the field. The field was brought on stream, with the first oil on deck in October 2023, three months ahead of schedule.
The interpretation strategy was established by gaining a thorough understanding of the rock properties and conducting well-to-seismic calibration. Subsequently, the project focused on reprocessing the available seismic dataset to enhance its quality, leading to an increased number of identified well targets. For optimal field development well planning, a dedicated Ocean Bottom Node (OBN) seismic survey was conducted in 2020, utilising dense line spacing of 150 m and triple source for denser shot coverage. The results showed improved resolution and contributed to detailed well planning (Figure 1). The drilling of wells in 2022 and 2023 confirmed that the updated stock-tank oil initially in place (STOIIP) remained consistent with the Plan of Development and Production (PDO) results (Akalin et al, 2024).
The Breidablikk area’s geology has been reasonably well-understood since the late 1960s, with the drilling of exploration and development wells in the nearby Balder field to the west and Grane field to the south. The production experience from these fields
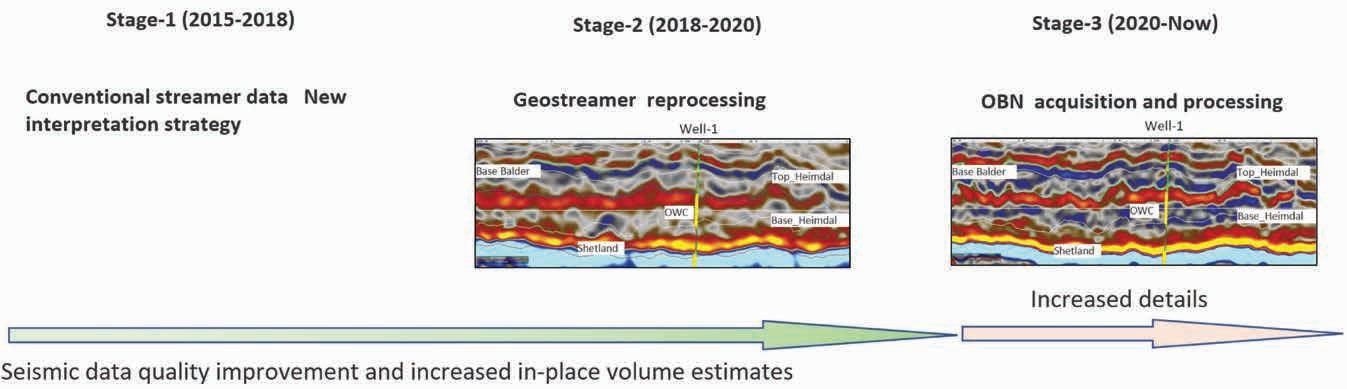
since 1999 and 2003, respectively, has further contributed to this understanding. Like these fields, the Breidablikk field’s reservoir comprises Palaeocene-early Eocene sandstones, primarily from the Heimdal Formation, which were deposited as distal parts of deep-marine fan systems. These sand deposits were affected by extensive remobilisation and fluidisation during the early Eocene period, leading to partial redistribution as injectites in the overlying strata. It is possible that additional volumes of sand were injected into the Palaeocene-early Eocene interval, sourced from the underlying stratigraphy or the Viking Graben, during these secondary processes. The injectites occur upward on different scales and with varying extent in the clay-dominated formations overlying the Heimdal, primarily the Lista Formation, but sporadically all the way up to the Balder Formation (Briedis et al., 2007, Wild and Briedis, 2010). Figure 2 illustrates the uplift of the East Shetland Plateau and subsidence of the Viking Graben, which played a crucial role in the deposition and remobilisation of the sandstones.
The Breidablikk field raised a significant question regarding the extent and distribution of sand remobilisation and injection, beyond the location where sand was fed into the area. Seismic observations have revealed discordant injection wings indicating the redistribution of sand volumes resulting in different depositional geometries. The development of mounds and saucer-shaped reservoirs is a common occurrence for this type of
field. The conceptual model of the Breidablikk field illustrates the various architectural elements that have resulted from extensive sand remobilisation and sand injections (Figure3). The model comprises a predominantly clean Heimdal sand unit, representing the primary reservoir, several tens of metres thick, and overlain partially with sandstone injectites (sills and dykes) of different scales. The Breidablikk field’s main reservoir is distributed across various stratigraphic levels of the Palaeocene interval, with its upper and lower boundaries represented by rugose surfaces that cut upwards across the host rock stratigraphy, highlighting the sand remobilisation and injection processes. The reservoir has a saucer-shaped geometry on an overall scale, with injected wing structures emanating from the edges of the sand body. The shallowest portions of the reservoir, occupied by large-scale wing features, are potential drilling targets. Another crucial element in the conceptual model is a complex zone associated with the uppermost part of the main reservoir. It is characterised by highly variable and uncertain volumes of small-scale injectites and other remobilisation-related features, which significantly affect the seismic imaging of the top reservoir.
Mapping these complex architectural elements in detail poses the biggest challenge due to the limitations of seismic resolution and imaging techniques. Therefore, the quality of seismic data and understanding of rock properties are crucial for mapping.
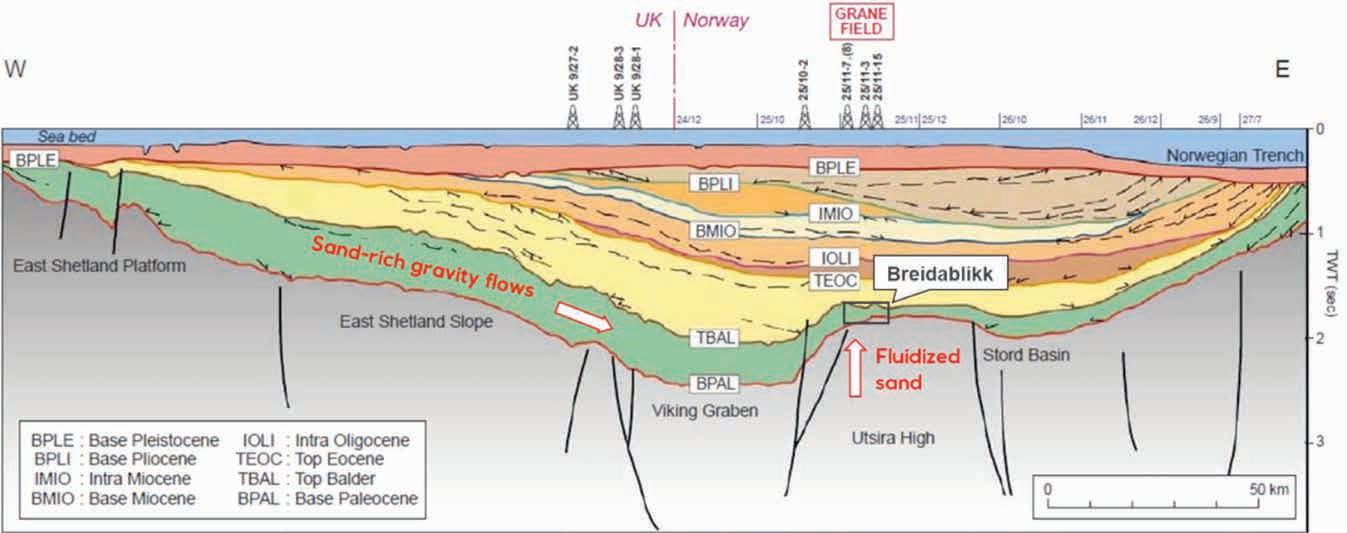
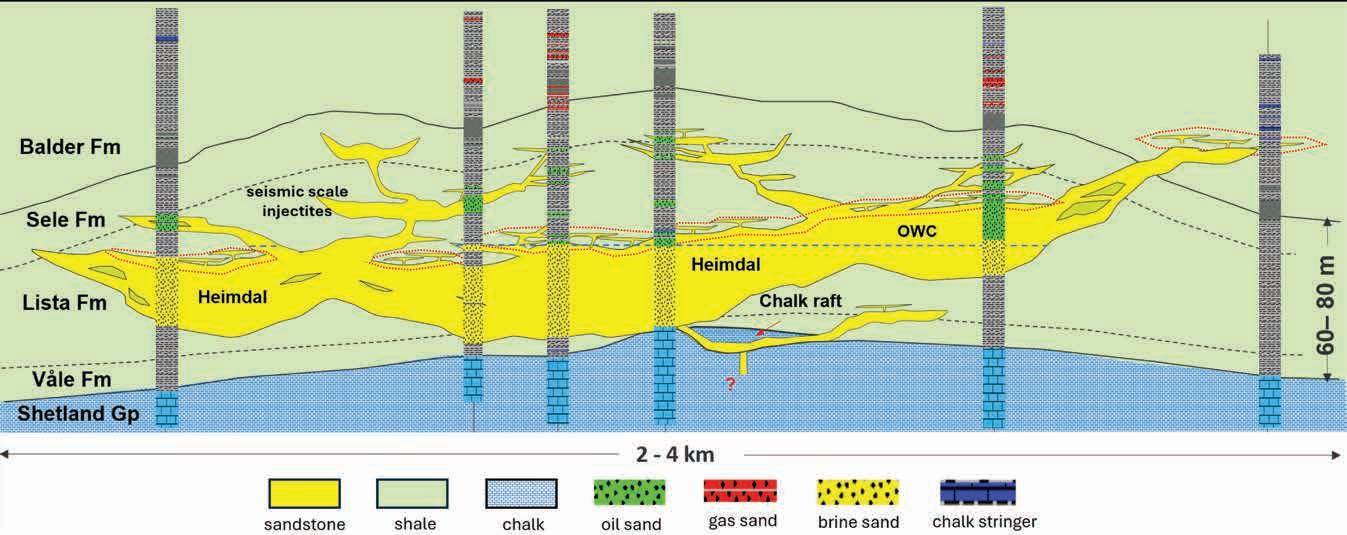
During the early stages of the Breidablikk project in 2014, the initial assumptions were based on the belief that the field shared geology and rock properties like the mature Grane Field. The Grane Field had been extensively explored and mapped by applying a seismic interpretation strategy of amplitude versus offset (AVO) Class I (Chopra and Castagna, 2014) for oil and brinefilled sand. However, translating this strategy to the Breidablikk field development resulted in limited commercial volume. By using subsurface studies, drilling and production insights from neighbouring fields, such as Forseti, a deeper understanding of the complex rock properties was achieved. This contributed to different AVO behaviour for Heimdal sands which were incorporated into a new interpretation strategy. The field STOIIP estimate increased by changing the interpretation strategy, which unlocked the development potential of the field.
The Heimdal sand and injectites are surrounded by Lista, Sele and Balder shales. The acoustic properties of these shales (Vp, Vs and Rho) are relatively consistent across the Breidablikk wells. Despite the Heimdal sand in the Breidablikk area being
characterised as very clean, with high net-to-gross (NTG > 95%) and excellent reservoir quality (32-35% porosity, and 4-12 Darcy permeability), there are significant elastic property variations both within and between wells in the area. The uppermost part of the Heimdal sand generally exhibits the lowest acoustic impedance, which often increases with depth. As illustrated in the well correlation presented in Figure 4a, there are significant higher-order vertical and lateral variations in acoustic impedance within the wells. The red arrows on the acoustic impedance logs highlight notable changes in trends. A cross-plot of acoustic impedance versus the Vp/Vs ratio (Figure 4b) serves as an effective tool for visualising the degree of variation in Heimdal sand properties within the acoustic impedance domain. This plot, derived from well observations, clearly indicates that the nearstack reflectivity of seismic data is influenced by the contrast in acoustic impedance between the Top Heimdal and Lista shale. Additionally, AVO analysis will reveal variability; for instance, the interface between low-impedance sand and Lista shale will produce a weak seismic response, complicating the interpretation of near-stack seismic data. In contrast, the far-stack seismic cube will be important in interpreting the Top Heimdal.
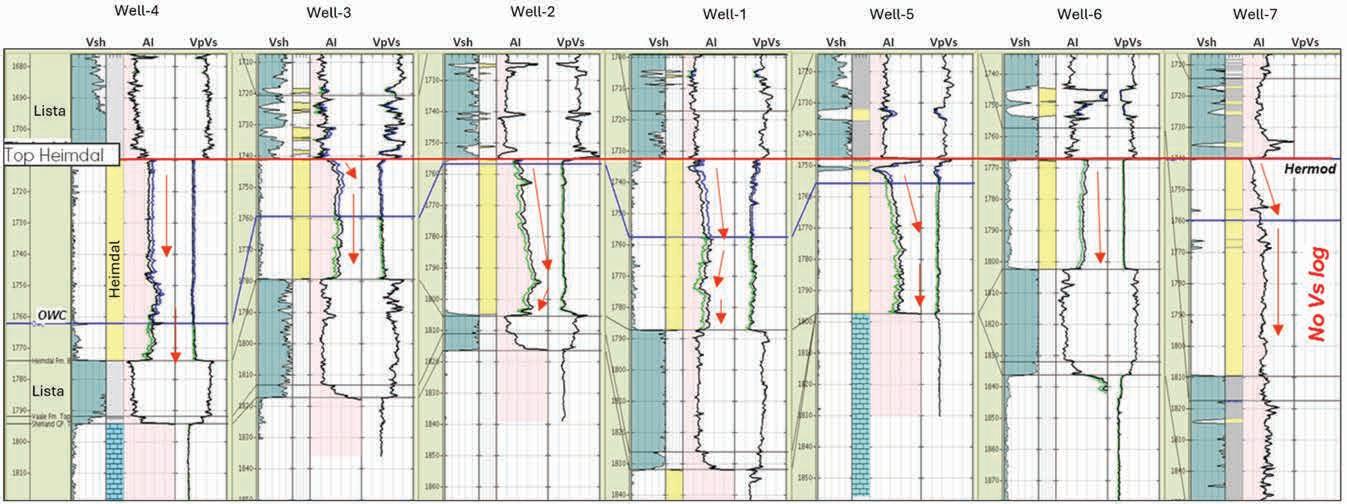
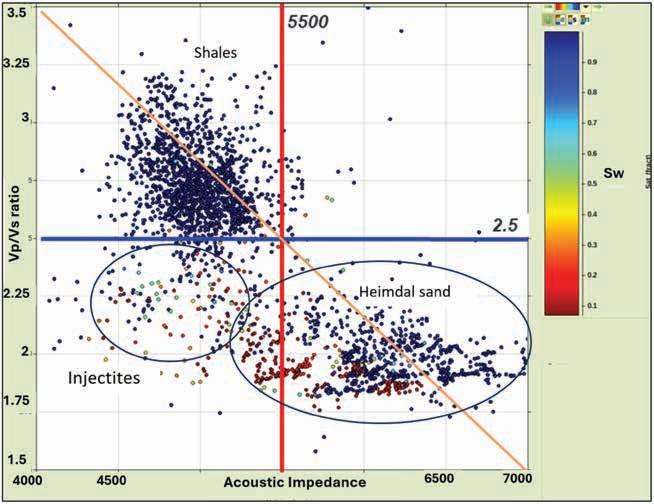
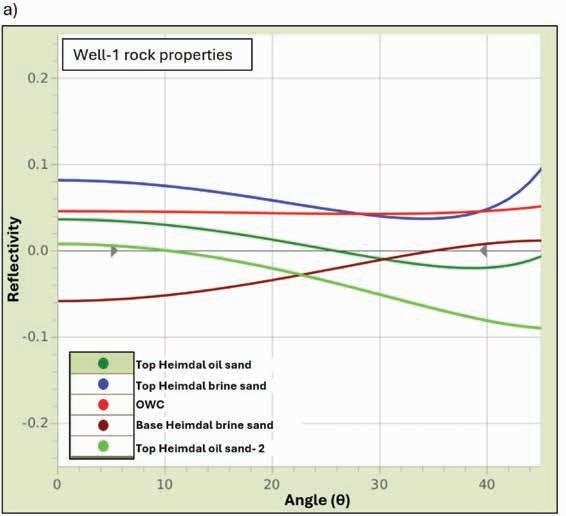
Half-space modelling was employed to analyse the variation in reflectivity response at the Top Heimdal interface. This method utilises blocky averaging of rock properties across various scenarios, allowing for the examining reflective changes in relation to property variations. Figure 5 presents models based on exploration wells, clearly demonstrating the reflectivity variability at the Top Heimdal interface.
As summarised, the Heimdal sand can generally be classified into two groups based on AVO characteristics: Class I and Class II/Class IIp AVO Oil Sands, with some variation. The Heimdal brine sand was represented by Class I AVO. It is worth noting that the suite of half-space models shows relatively weak far-stack reflectivity, which may pose a challenge in confidently identifying and interpreting Heimdal oil sand in the absence of high-quality seismic data.
The Base Heimdal is mainly an interface with waterfilled sand and Lista shale, leading to a decrease in acoustic impedance as represented by Class IV. In some areas, the Base Heimdal is situated near the Shetland reflector and is usually affected by the Shetland side lobe.
The seismic scale injectites have only been partially penetrated by wells, resulting in uncertainty regarding the rock properties. Seismically defined injectites often demonstrate Class IIp AVO, suggesting that they may be like low impedance Heimdal sand. Seismic scale injectites, which are mappable, are often in the tuning below seismic resolution. As a result, their thickness, NTG ratio, and continuity are generally uncertain. The tuning thickness is approximately 19 m, while the thickness of mappable injectites typically ranges from 7 to 15 m on average.
Table 1 displays a summary of the Breidablikk interpretation strategy for Heimdal and injectites sands. However, it should be noted that experiences from other fields exhibit variability beyond this summarised table.
Once the interpretation strategy was established, we focused on ensuring the quality and consistency of the available seismic data with the well observations.
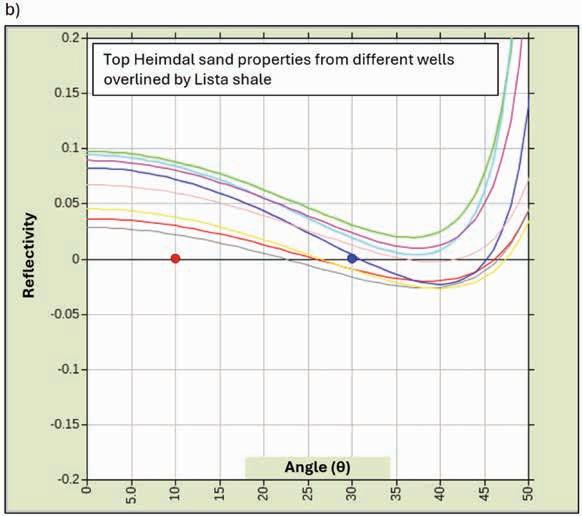
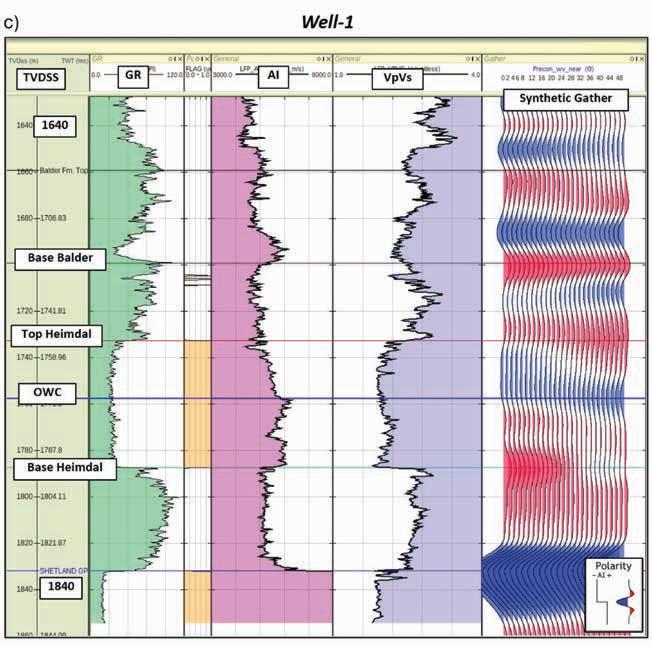
Figure 5 The AVO reflectivity for key interfaces is analysed using exploration well data. a) Rock properties from Well-1 were used to generate reflectivity plots for key interfaces. For instance, the Top Heimdal oil sand exhibits a Class II or IIp response, depending on the block averaging method employed. b) The properties of Heimdal sand from different wells, overlaid with Lista shale, indicate that the seismic response at the Top Heimdal shows a high degree of variation with Heimdal sand properties. c) Synthetic seismogram at Well-1. The prestack synthetic gather in angle domain, and Top Heimdal is zero crossing at near angles, brightening on far angles which represent Class II AVO.
Top Heimdal Brine
Top Heimdal Oil
Mappable Injectites
Base Heimdal Brine
Table 1 Summary of interpretation strategy of Heimdal sands and mappable injectites. Note that Breidablikk seismic data is reverse polarity. Positive values represent negative amplitudes; negative values represent positive amplitudes.
We started from Geostreamer multi-client data acquired by PGS (now TGS) between 2010 and 2011, covering an extensive area of the Norwegian Continental Shelf (NCS) which was processed in 2013. The workflow employed then utilised the Prestack Time Migration (PSTM). While the prestack seismic gathers demonstrated a clear Class IIp AVO signal at the target interval (Heimdal sands), the far offsets exhibited low frequency noise resulting in interpretation uncertainty of the top reservoir.
In 2017 a decision was made to reprocess multi-client seismic data for better seismic interpretation of Heimdal sands and to identify new well targets. The main objectives of the processing were a high-quality far-stack image and a better signal-to-noise ratio at the target. In addition, preserving low frequency in the data was important to minimise side lobes of the Shetland reflector for interpreting Base Heimdal confidently. The PSTM from legacy processing was first optimised to achieve these objectives, and a depth velocity model was built using Full Waveform Inversion (FWI) for shallow intervals
following reflection tomography for deeper intervals. The FWI had a 2-12 Hz band limit and time interval up to 400 m. Figure 6 provides a depth slice from seismic around 200 m, which demonstrates that the velocity model effectively captured the shallow channels. This velocity model was then used for 3D anisotropic Kirchhoff Prestack Depth Migration with tilted transverse isotropic (TTI) anisotropy; applying Q phase and amplitude compensation within migration gave better results than applying it outside.
The reprocessing met its objectives through noticeable improvement of the AVO signal at Top Heimdal on prestack gathers as displayed in Figure 7. The base Heimdal reflection was improved, and the results showed more continuity. Low frequency was kept in the data and helped to minimise Shetland side-lobes interfering with Base Heimdal reflection (Figure 8). The Base Balder reflection was also significantly improved. However, there was still remnant noise mainly from the Shetland refraction and dipping noise, related to migration, interfering with Top Heimdal at far offset.
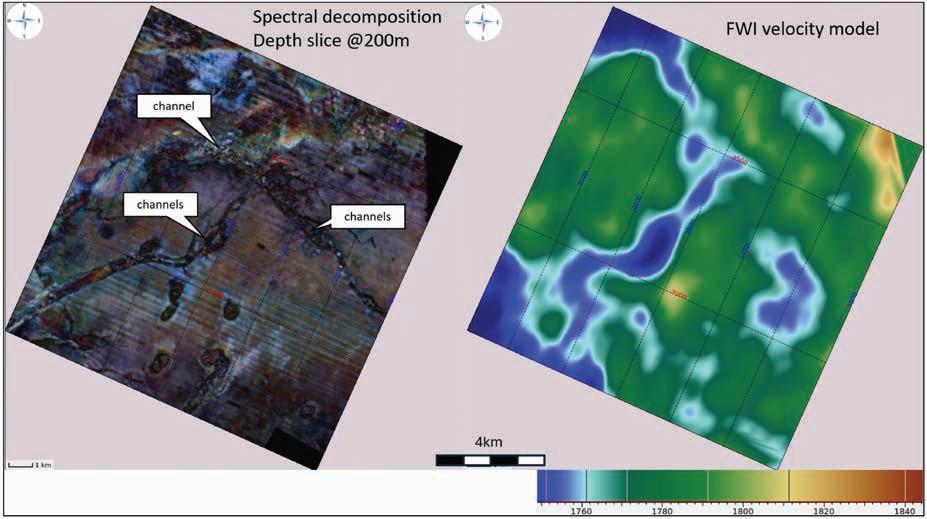
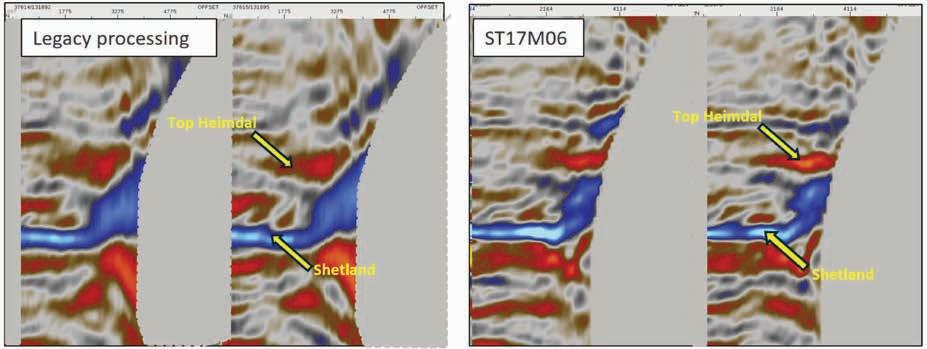
Figure 6 The depth slice at 200 m reveals shallow channels in the reflection seismic data (left) alongside the final FWI velocity model (right). The velocity ranges from 1700 m/s (indicated in blue) to 1840 m/s (indicated in red). Seismic data, courtesy of TGS, derived from multi-client (MC) seismic surveys.
Figure 7 Prestack seismic gathers before (left) and after (right) the re-processing. It shows an improved AVO signal of the Top Heimdal. The Shetland refraction (hockey stick) remains in the data and affects far-ufar offset data. Seismic data, courtesy of TGS, derived from multi-client (MC) seismic surveys.
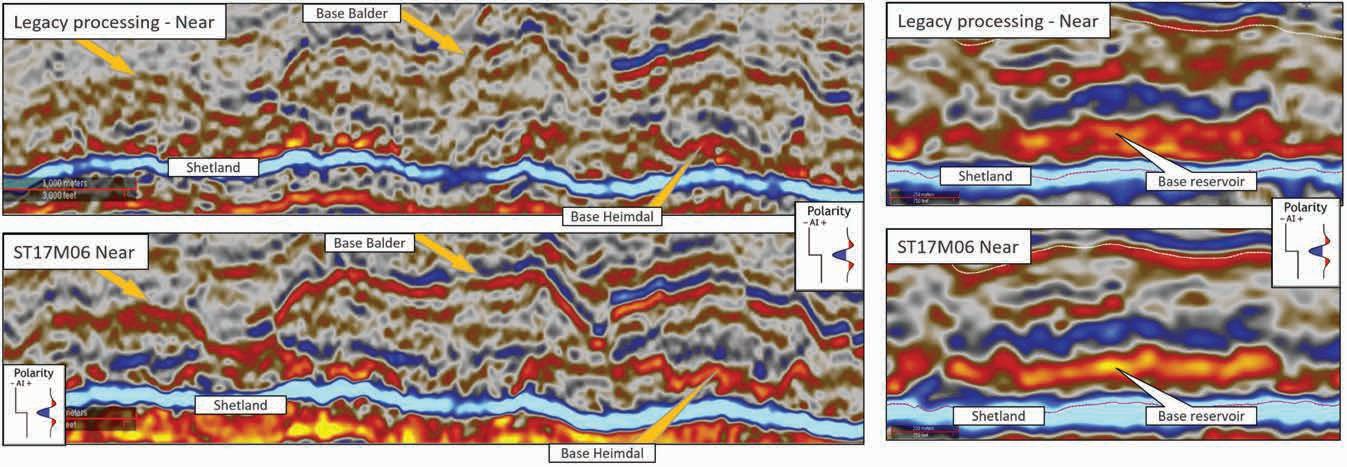
The study was conducted to enhance the quality of further quantitative interpretation analysis. Refracted energy from the Shetland formation is a limiting factor for higher-angle usage in the data. Minimising refracted energy allows for the inclusion of more angles in the stack, enhancing the quality. In addition, migration noise associated with Shetland reflectors is particularly noticeable on Far, Ultra Far (high-angle) stacks. A workflow was established to clean the gathers that consist of parabolic radon, linear radon and random noise attenuation (Yilmaz, Ö., 2001) as shown in Figure 9.
The evaluation of preconditioning final products showed promising results, as shown in Figure 10. The AVO signal at the Top Heimdal (reservoir) at Well-1 has been improved through the noise attenuation process, which reduces the jittering effect on amplitudes due to dipping noise. The Shetland refracted energy has also been effectively attenuated, resulting in minimised up-dip events. Furthermore, at Well-2, the Top Heimdal is represented by a Class I AVO brine sand response based on the synthetic modelling. Before preconditioning, the seismic gather did not have a correct AVO signal due to dipping noise. However, after preconditioning, the AVO signal at the Top Heimdal has been significantly improved, accurately representing the Class-I AVO brine sand response.
The interpretation strategy showed that the properties of Heimdal sand in Breidablikk exhibit significant lateral and vertical variations, complicating the confident interpretation of the AVO response. However, the Vp/Vs ratio effectively discriminates between shale and sand lithologies. Specifically, Heimdal sand and injectites display a Vp/Vs ratio of approximately 2, while Lista shales show higher values. This Vp/Vs ratio serves as a reliable lithology indicator for the Breidablikk reservoir, providing a strong rationale for conducting a prestack relative inversion. The enhanced quality of the prestack data gives confidence in employing the EEI workflow.
The EEI inversion workflow involves creating partial stacks with 5º increments. The frequency between the gathers was matched across the datasets, targeting a 25-30 degree spectrum. Intercept and gradient volumes were generated from these partial stacks, and a Chi angle volume at 62º was calculated. This angle was determined based on well log analysis, where the Vp/Vs ratio at the target level corresponded to the defined Top and Base of the Heimdal formation.
A seismic coloured inversion was then applied to generate the final cube demonstrating agreement with well observations. While the reflectivity seismic data is sensitive to fluid response and variability in AVO, the EEI relative inversion cube functions as a lithology cube that delineates the top and base of the
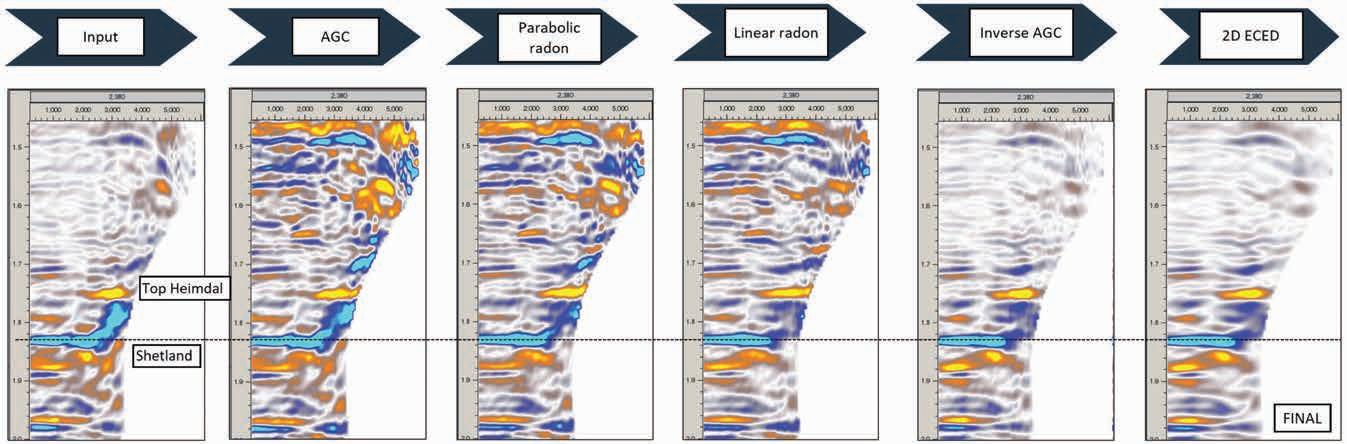
Heimdal sand in a single stack. This cube was utilised in the interpretation process to enhance confidence in the results. The final products from the gather preconditioning enabled more confident interpretation, resulting in a shallower Top Heimdal. As a result, the number of well targets increased from 12 to 23, and the Breidablikk development plan was delivered in 2020.
Unlocking the full potential with high-end seismic data acquisition and processing (Stage 3)
Changes in the quality of historical seismic data led to an increase in STOIIP of Breidablikk field and opened the door for a new seismic survey campaign in the field. This survey aimed to provide both structural imaging and a robust 4D baseline for future monitoring efforts. With these objectives in mind, Equinor conducted a dense
3D Ocean Bottom Node acquisition from May to July 2020. During this campaign, 58 receiver lines were deployed at 150-m intervals, resulting in a total of 8865 nodes distributed every 50 m along each line, covering approximately 67 km². The seismic acquisition utilised a triple source configuration, with a source separation of 37.5 m and a shot point interval of 12.5 m. Data processing commenced immediately after acquisition and continued until September 2021. This included PP and PS processing and imaging with a particular focus on AVO behaviour, employing cutting-edge technologies available at the time, such as Time-Lag full waveform inversion (TL-FWI) to minimise cycle skipping (Zhu et al., 2010) and Up-Down Deconvolution (UDD) for better multiple removal (Wang et al., 2010). The velocity model built during the 2017 reprocessing project was used as a starting point in the joint Vp/Vs TL-FWI.
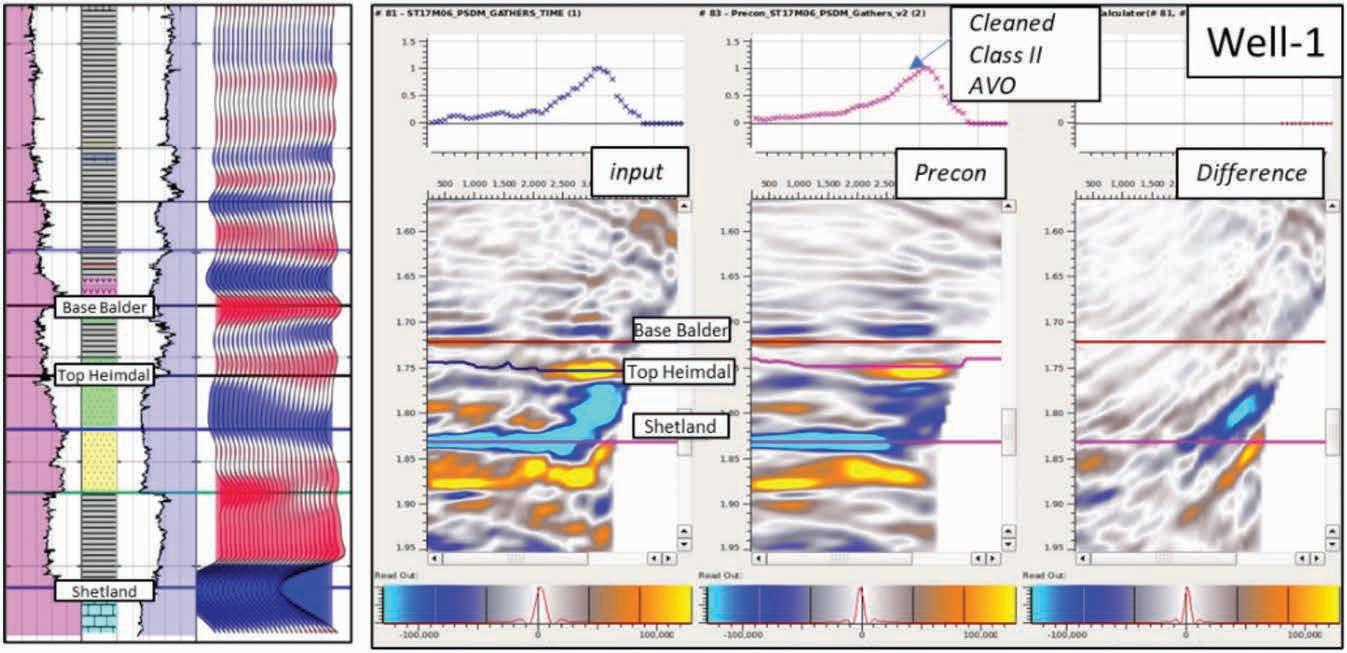
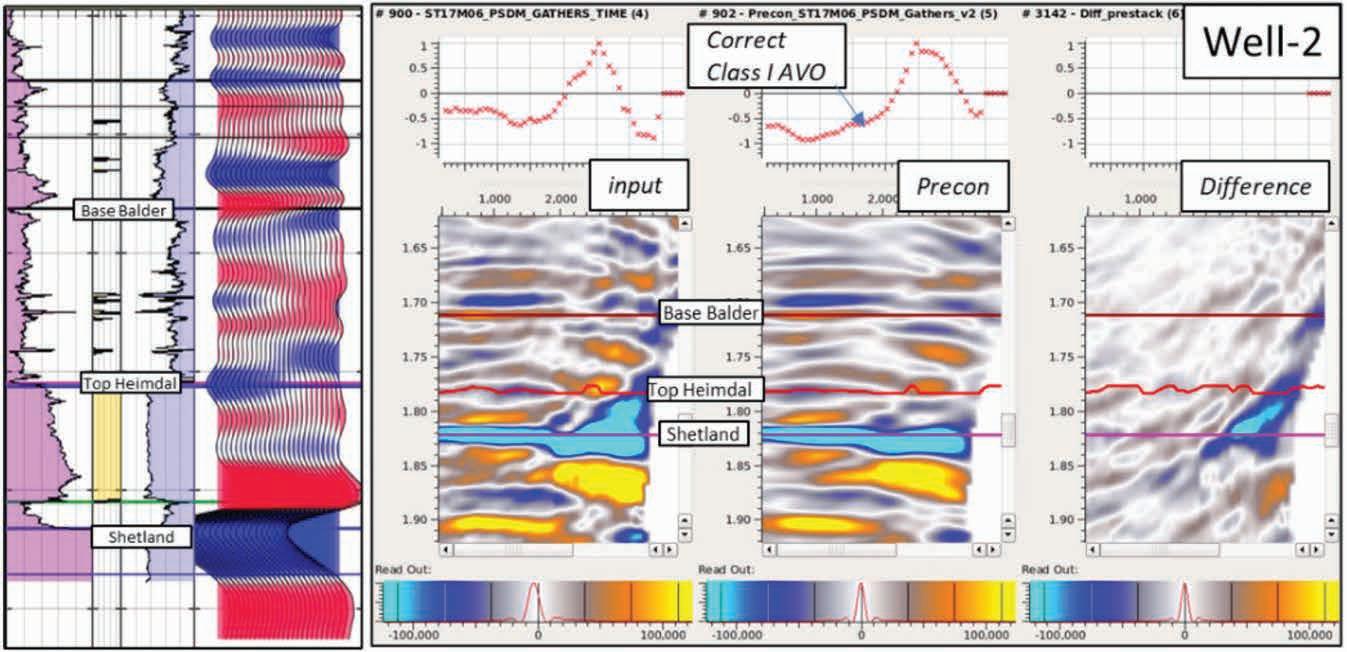
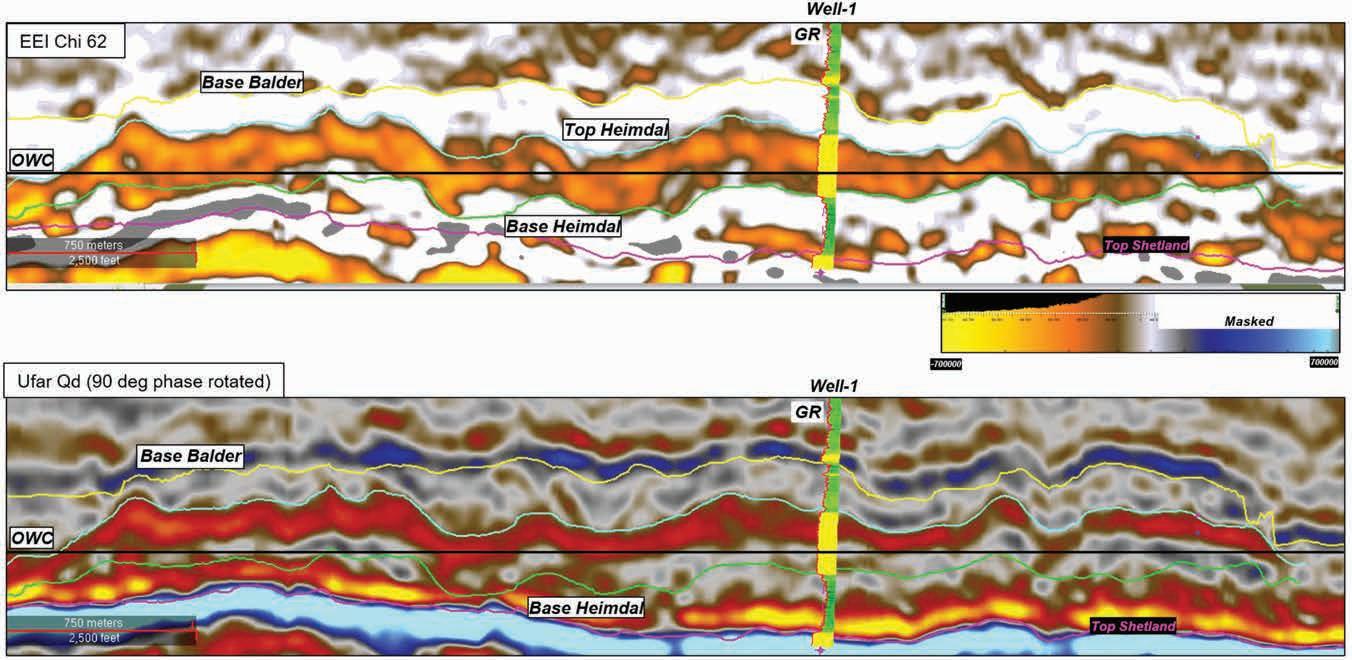
The FWI velocity model has significantly improved overburden details by capturing overburden cemented sands in the model. Overburden rms amplitudes maps around 1200 ms, and Base Balder show significant improvements in seismic imaging of polygonal faults (Figure 12). Moreover, the key AVO signal seen on the far and ultra-far stacks was protected throughout the processing flow and, through different denoise techniques. Wave fronting from Shetland was no longer a concern due to
the OBN survey design. The final prestack data output displays a higher quality, with better signal-to-noise ratio, flatter gathers, and a more consistent AVO response at the top of Heimdal. The project successfully delivered high-quality PP and PS seismic volumes and velocities after 14 months. Ultimately, the project achieved its primary objective of significantly improving imaging quality compared to the legacy towed-streamer dataset.
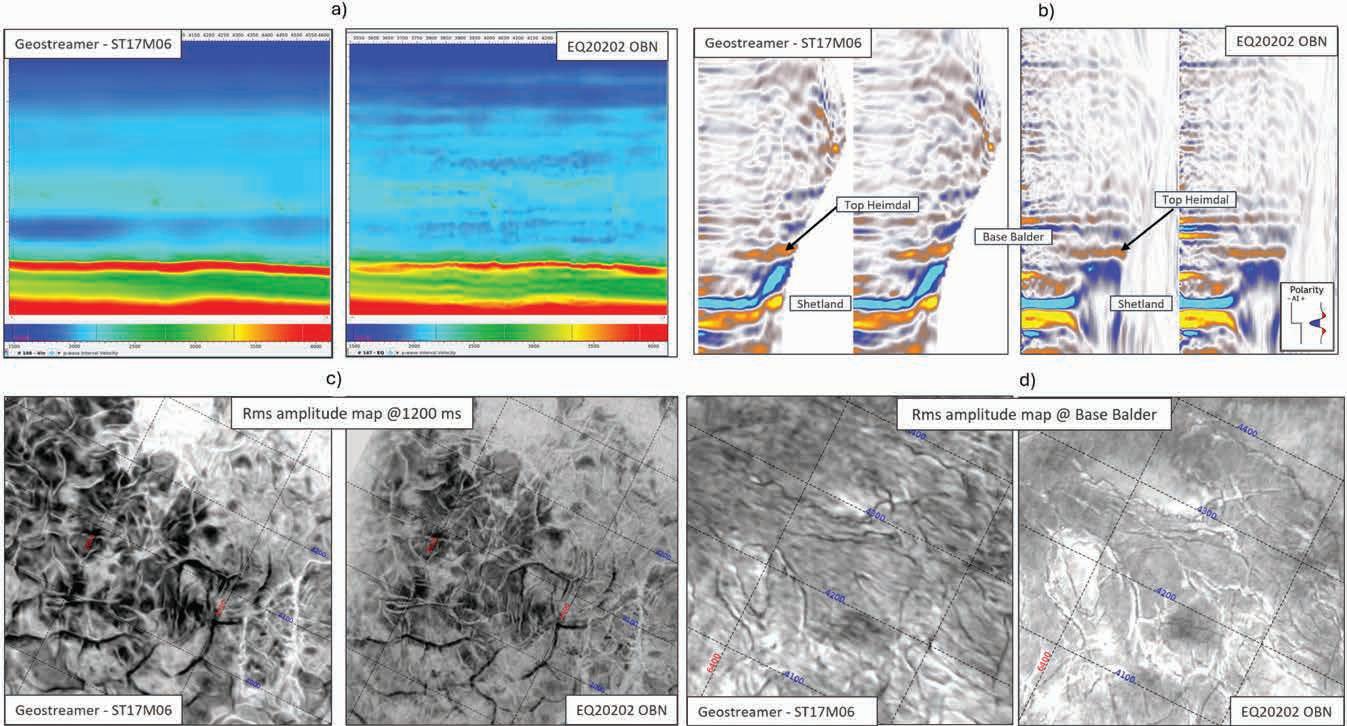
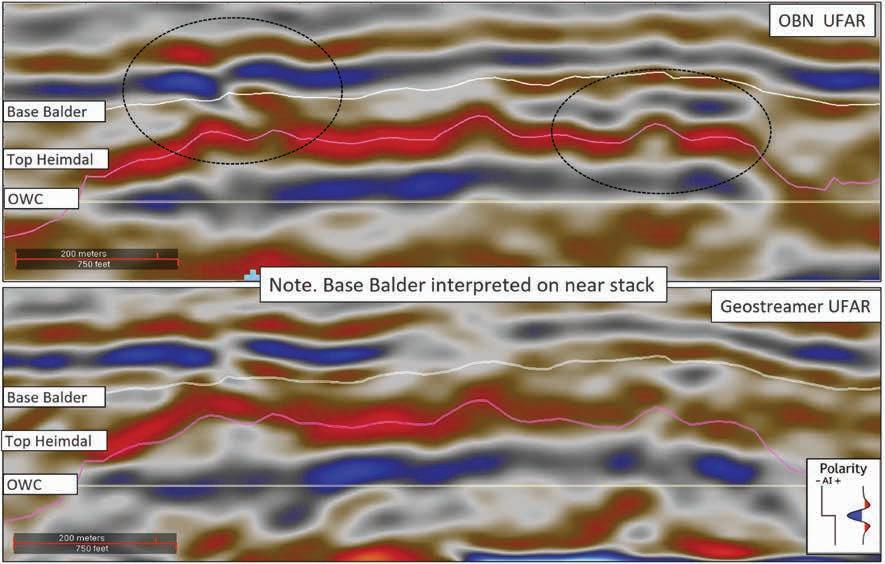
a) Seismic interpretation for detailed well planning
Breidablikk drainage strategy is pure depletion with support of a strong regional aquifer. The oil column thickness is around 15-25 m on average. The oil producers, which are horizontal wells (single or multilateral), need to be placed closer to the top of the reservoir, allowing oil drainage from bottom to top and avoiding early water breakthrough. Detailed top reservoir interpretation and uncertainty quantification play a key role in well planning on the Breidablikk Field.
Improved seismic data quality led to improved interpretation of Top Heimdal, including seismically mappable injectites. The seismic interpretation of OBN data revealed further details about Top Heimdal concerning structural complexity and irregularity (Figure 13). More seismic scale injectites were mapped confidently due to the better resolution. Existing well targets were revised accordingly, resulting in updated well placement planning and design. These changes were incorporated into the geomodel and dynamic model.
b) Data acquisition below seismic resolution: Pilot wells with geosphere tool and integration with seismic data
A pilot drilling strategy was developed to mitigate the risk of placing the wells too deep or too shallow in the Heimdal reservoir. Pilot wells were utilised to ensure safe casing shoe placement and to map the top reservoir geometry using GeoSphere, an advanced ultra-deep azimuthal resistivity tool (Seydoux, J. 2014). This tool utilises electromagnetic measurements to map resistivity contrasts shale-sand, fluid change and fluid contacts. Hence, it helps to provide a reservoir-scale model to optimise landing, reduce drilling risks, and maximise reservoir exposure. When combined with seismic data, the deep resistivity measurements can significantly refine the interpretation of a reservoir structure and geometry with higher resolution. By utilising this data, well placement can be optimised vertically and horizontally within the sensitivity range of the measurements. In addition to that the real-time mapping provides critical information to avoid undesired exits into non-productive layers or shale exposure. It allows geosteering of the well for better placement.
Figure 13 OBN seismic data reveals more detail of Top Heimdal irregularity and a seismic scale injectite connected to main Heimdal sand as shown on the left in black circle. The data allows mapping of this seismic scale injectite. Top Heimdal interpretation from Geosphere data was quite a smooth surface, but the OBN data captured a lot of details of the complex geology. Seismic data courtesy of TGS, derived from multi-client (MC) seismic surveys.
Figure 14 illustrates a well target interpreted from the seismic data. The top Heimdal seismic response exhibits Class IIp AVO characteristics, indicating the presence of oil-filled sand. This is evidenced by the dimmed signal in the near stack and the brightening observed in the far stack. On the left side of the figure, a mapped injectite is highlighted, representing additional potential alongside the Heimdal sand. The planned wells on Breidablikk included the execution of a landing and a reservoir pilot. The purpose of the reservoir pilot is to define the reservoir geometry prior to drilling the final production well. This pilot was also designed to penetrate the oil-water contact (OWC) to calibrate Geosphere data measurements, thereby enhancing our understanding of related uncertainties.
The landing pilot was drilled (Figure 15) but encountered limited sand exposure in the mapped injectite even though it had a good amplitude response on the ufar seismic data. The interpreted mapped injectites in Breidablikk are relatively thin with a 10-15 m thickness. Predicting the thickness, continuity, and NTG of mapped injectites is a significant challenge due to the limit of seismic data resolution. The drilled injectite was found to be connected to the main Heimdal sand. The top Heimdal appeared slightly deeper in the landing area than the seismic interpreted horizon (Figure 15). This highlights the importance of using additional data sources, such as Geosphere data, to calibrate locally before drilling the reservoir pilot.
Figure 16 demonstrates the main results from drilling the reservoir pilot. This well was intentionally positioned deeper to accurately map the top of the reservoir while allowing sufficient space for the production well drilling. A general guideline was established to maintain a 15-m margin below the interpreted top of the reservoir, reflecting the Geosphere tool’s resolution for reliably distinguishing between sand and shale boundaries. Maintaining an appropriate distance from the boundary is crucial, as increasing this distance may produce smoother images but at the expense of losing important details. Geosteering techniques were applied to optimally position the well at the correct distance from both the top of the reservoir and the oil-water contact (OWC).
The pilot mapped the hydrocarbon column at the target using ultra-deep resistivity measurements. It gave details of the top
reservoir geometry and the OWC. Notably, Geosphere resistivity readings appeared as flat features at the contact, with the well transitioning from oil-saturated sand to brine-saturated sand near the toe. This served as a calibration point for the Geosphere data, enhancing confidence in its accuracy with respect to contact definition. The results showed consistency with the regional OWC and align with simulation model predictions. This data is crucial in planning the producer’s location so that it is as close as
possible to the top reservoir to minimise shale exposure and avoid potential completion challenges. By utilising this information, the drilling team can optimise the well placement and improve the overall production performance of the reservoir.
The producer well was designed using data gathered from the pilot well. Drilling through the extensive shales in Breidablikk presents significant challenges in maintaining stable hole conditions. The drilling plan had to balance the need to avoid unstable shale
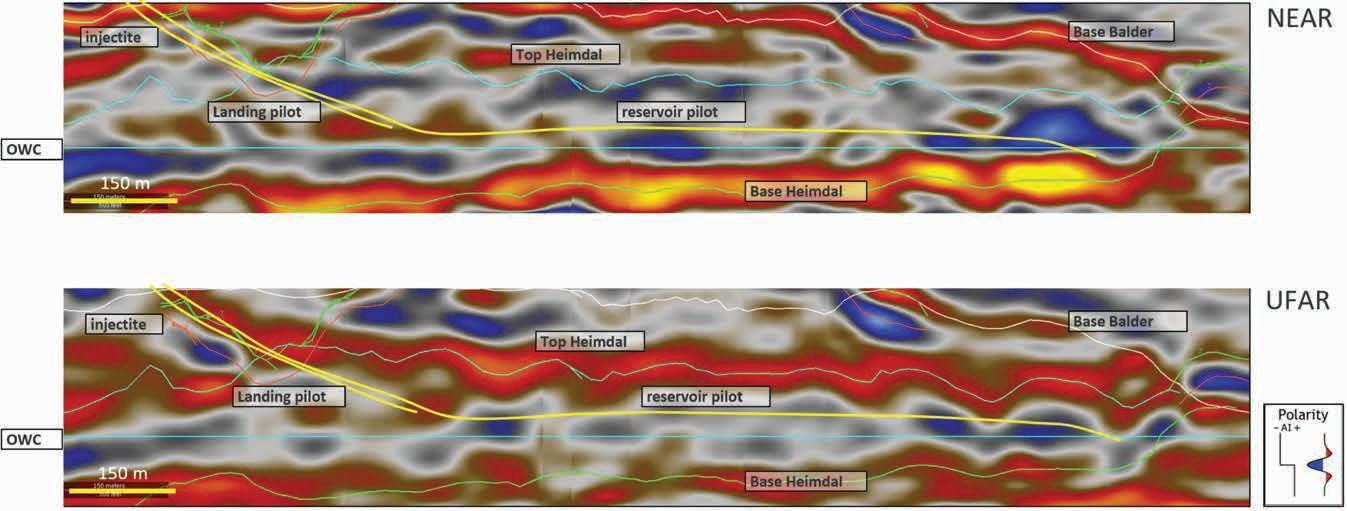
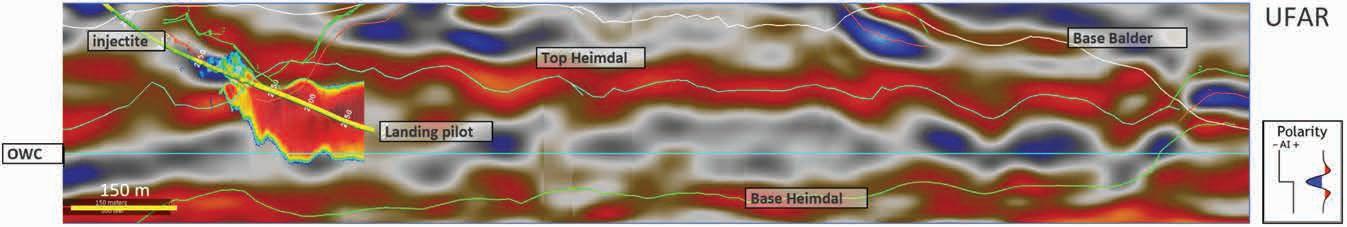
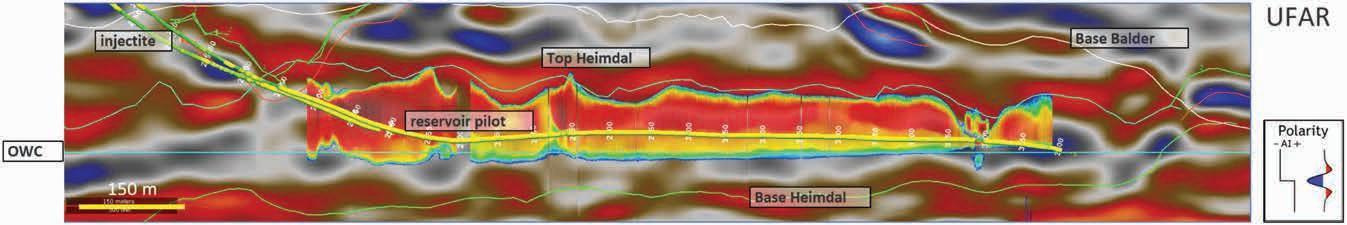
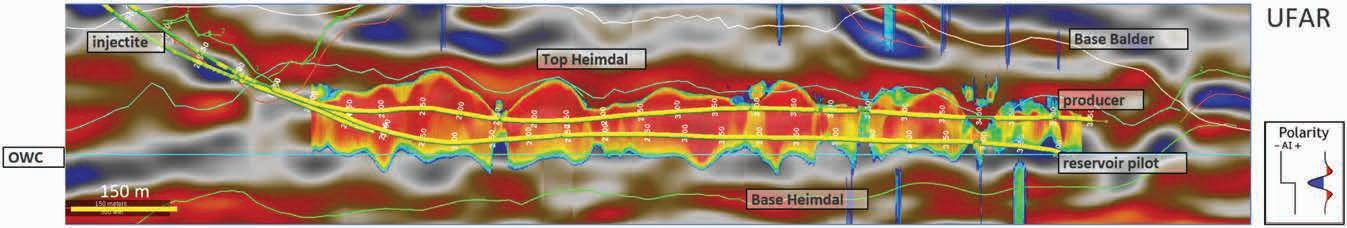
exposure while placing the producer as shallow as possible to the top reservoir. Figure 17 exhibits the producer and drilling close to Top Heimdal. By drilling close to the roof Geosphere data revealed more details of the top reservoir than the pilot due to the proximity to the interface and higher measurement accuracy. The seismic resolution is not good enough to capture these details, therefore the seismic interpretation of Top Heimdal is generally estimated by a smooth surface. Geosphere data serves as an excellent complementary resource for revealing detailed characteristics of the reservoirs.
The reservoir at Breidablikk exhibits significant geological complexity, primarily due to the processes of sand remobilisation. Accurately defining and mapping this reservoir presents considerable challenges. High-quality data is essential to fully understand the potential of the Breidablikk field. Each data type has its limitations. For instance, seismic data often lacks the necessary frequency content to capture details, leading to resolution constraints. Consequently, the complex geometry of the top reservoir can be obscured in seismic data, causing mapped injectites to appear seismically in tune but making it challenging to accurately determine their true thickness, continuity, and net-to-gross ratios. Incorporating additional data sources, such as the Geosphere ultra-deep resistivity tool, enhances the ability to resolve reservoir details beyond the reach of seismic data, thereby optimising well placement. However, it is essential to acknowledge that the tool has inherent resolution and measurement limitations that must be carefully considered during both the well planning and drilling stages. By integrating multiple data types, a more comprehensive understanding of the Breidablikk reservoir can be achieved, leading to improved well positioning and optimisation of well length.
The Breidablikk field serves as a valuable case study demonstrating how seismic data quality influences the understanding of field potential over time. Ongoing improvements, coupled with a focused attention to detail, have enabled accurate subsurface characterisation and the development of an effective field development strategy.
The Breidablikk project progressed through three stages to enhance seismic data quality, enabling updated interpretations and increased STOIIP estimates. The initial assumptions based on the Grane Field’s geology and rock properties were not equally applicable to Breidablikk without further adaptation. However, insights gained from other fields and exploration well data deepened the understanding of complex rock properties and guided the consideration of varying AVO behaviours in the Heimdal sands. This synergetic interpretation led to developing an interpretation strategy for Heimdal and injectite sands, which was further improved by reprocessing multi-client seismic data in Stage 2. The preconditioning of seismic gathers for quantitative interpretation resulted in an improved AVO signal quality and the identification of new well targets. Finally, in Stage 3, a dense 3D OBN acquisition was conducted to improve imaging and deliver high-quality PP and PS volumes. The project achieved its primary objective of improved imaging compared to the previous towed-streamer dataset.
The seismic interpretation of the OBN data revealed more details of Top Heimdal with respect to structural complexity and irregularity. As a result, more seismic-scale injectites were interpreted confidently due to better resolution and signal-tonoise ratio. A pilot drilling strategy was developed to mitigate the risk of placing the wells too deep or too shallow in the reservoir, GeoSphere data were integrated with seismic data to refine the interpretation of reservoir structure and geometry with higher resolution. The drilling results showed that the seismic quality with OBN data was good enough to capture details of complex reservoir geometry. Integrating both seismic and GeoSphere data revealed a better understanding of the limitations of seismic data. As a result, it is anticipated that future efforts will push the boundaries further to enhance the level of detail in the Breidablikk reservoir. By integrating both seismic and Geosphere data, the drilling team could optimise well placement and ultimately improve the reservoir’s overall production performance.
The authors would like to thank Breidablikk licence partners, Equinor ASA, Vår Energi ASA, ConocoPhillips Scandinavia AS and Petoro AS and TGS for permission to show pictures from multi-client data derivatives. The views and opinions expressed in this paper are those of the authors and are not necessarily shared by the licence partners.
Akalin, A., Berraki, M. and Worthington, W. [2024]. Breidablikk Field: Reducing Reservoir Uncertainties During Field Development by Improving Seismic Data Quality. 85th EAGE Annual Conference & Exhibition, Extended Abstracts
Briedis, N.A., Bergslien, D., Hjellbakk, A., Hill, R. E. and Moir G.J. [2007]. Recognition Criteria, Significance to Field Performance, and Reservoir Modelling of Sand Injections in the Balder Field, North Sea. In: Hurst, A. & Cartwright, J. (eds): Sand injectites: Implications for hydrocarbon exploration and production. AAPG Memoir, 87, 91-102 C&C Reservoir. [2011]. Field evaluation report “Grane Field Northen North Sea, Norway”, p 16. Chopra, S. and Castagna, J.P. [2014]. AVO. SEG publication, 204 p. Seydoux, J., Legendre, E., Mirto, E., Dupuis, C., Denichou, J.-M., Bennett, N., Kutiev, G., Kuchenbecker, M., Morris, C. and Yang, L. [2014]. Full 3D Deep Directional Resistivity Measurements Optimize Well Placement and Provide Reservoir-Scale Imaging While Drilling. SPWLA 55th Annual Logging Symposium, Paper LLLL, Transactions Wang,Y., Bale, R., Grio, S. and Holden, J. [2010]. The ups and downs of ocean-bottom seismic processing: Applications of wavefield separation and up-down convolution. The Leading Edge, 29(10), 1258-1265.
Wild, J. and Briedis, N.A. [2010]. Structural and stratigraphic relationships of the Palaeocene mounds of the Utsira High. Basin Research, 22(4), 533-547.
Zhu, H., Kumar, R., Vandrasi, V., Dobesh, D. and Vazquez, A. [2019]. Velocity model building with time-lag FWI: a Perdido area case study, Second EAGE Workshop on Deepwater Exploration in Mexico, Abstract
Yilmaz, Ö. [2001]. Seismic data analysis. SEG publication, 2065 p.


Rafael Guerra1*, Mark Ackers2, Rogelio Rufino3, Johan Leutscher 2, Alexandre Bertrand2, Um Salma1, Sara Sandvik 2 and Matteo Gennaro2
Abstract
In early 2025 a wireline vertical seismic profile (VSP) logging benchmark test was conducted in a hydrocarbon exploration well drilled offshore Norway. The test compared distributed acoustic sensing (DAS) data, which were recorded using a hybrid optical-electric logging cable, to conventional geophone array data. The objective was to determine if the DAS approach could eliminate the need for a dedicated geophone VSP logging run in future drilling campaigns. This approach would reduce rig time by approximately 12 hours and CO2 emissions by tens of tons per well, while meeting the geophysical objectives of recording reliable time-depth-velocity data and true-amplitude zerophase corridor stacks.
In this case study, we review some of the key aspects of the technology and of acquiring, processing, and interpreting DAS VSP data.
Keywords — distributed acoustic sensing (DAS), vertical seismic profile (VSP), geophones, well to seismic ties, vertical wells, wireline logging, finite element analysis (FEA), depth accuracy.
Introduction
Wildcat exploration well 7122/9-2 was drilled on the Elgol prospect on the central Finnmark Platform approximately 16 km northeast of the Goliat field in the SW Barents Sea (see Figure 1). The well was drilled as a nearly vertical well (see Figure 2a).
Late Permian age strata in the Barents Sea belong to the Tempelfjorden group. The siliciclastic Ørret formation and its time-equivalent spiculitic carbonate counterpart Røye formation
are described by several authors (for example Larsen et al., 2002), but with few details due to the lack of well penetrations. Most of the sedimentological knowledge on the Upper Permian strata in the Arctic basin are based on descriptions from Svalbard. Generally, it is interpreted to be a stable low relief, middle to deep shelf setting with a variety of facies such as sandy shoals and bars in the shallower part, brachiopodal and bryozoan limestones in the middle shelf and spiculitic cherts and shales in the deeper shelf (Blomeier et al., 2013). Only when the Lupa well (7122/9-1) was drilled in 2022, was it proven that the Ørret formation could consist of shallow marine and paralic deposits with good reservoir properties.
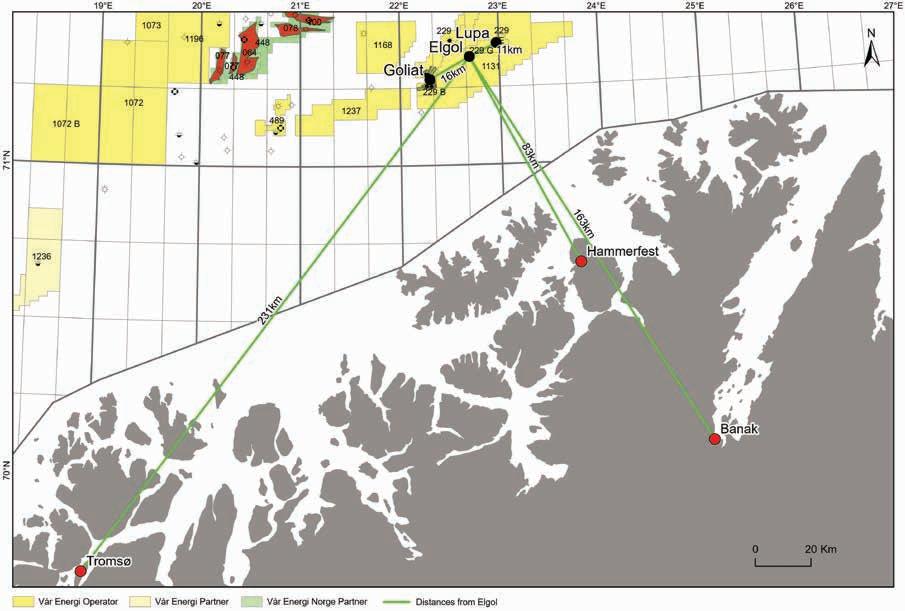
Figure 1 Location map of the exploration area.
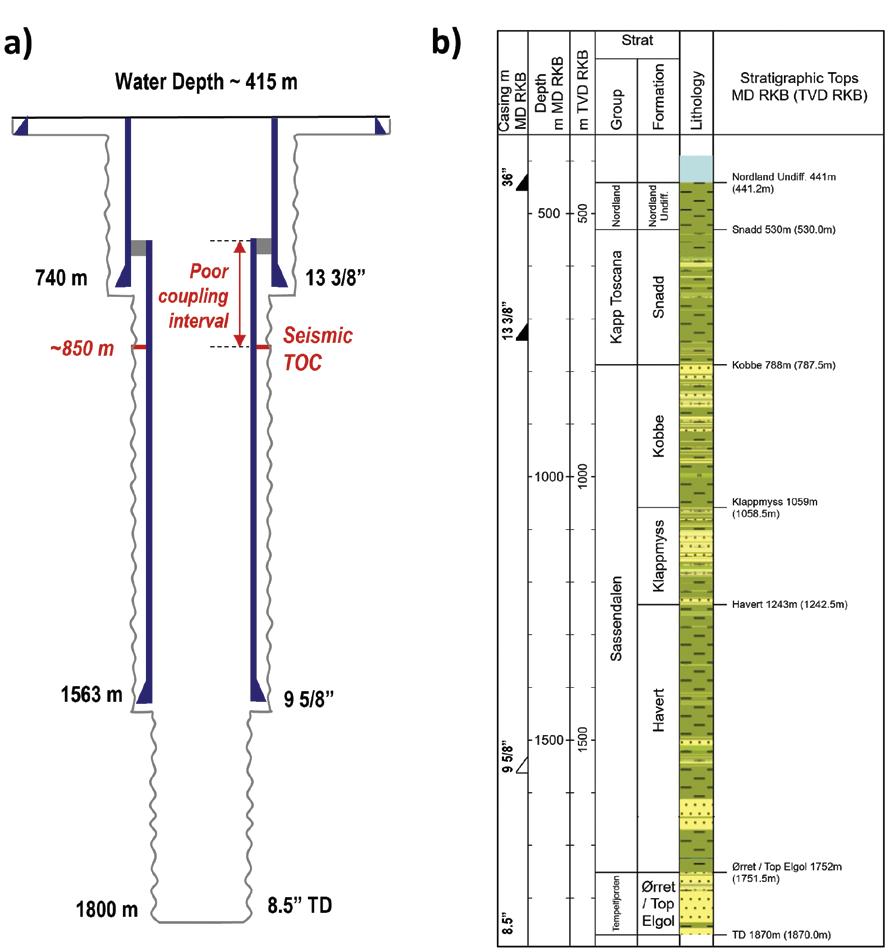
In well 7122/9-2, the target level was below a seismic intra-Ørret formation reflector. The Ørret formation consists of several lithostratigraphic units comprising siliciclastic rocks, mainly argillaceous sandstones, and siltstones with limestone stringers (see Figure 2b).
As part of the wireline logging program, a VSP was required. Encouraged by the results of using fibre-optic DAS for VSP acquisition in two wells in 2024, Vår Energi decided to conduct a benchmark test of the technology against the conventional VSP geophone array tool, which is considered the industry standard.
The DAS technology’s ability to record reliable time-depth-velocity data and corridor stacks in vertical exploration wells was to be assessed.
The business rationale behind the benchmark test is that the DAS approach could eliminate the need for a dedicated VSP tool run in the wireline program. This could reduce rig time by approximately 12 hours per well and associated CO2 emissions. Additionally, DAS offers the flexibility to select the optimal time to run the VSP within the operational weather window. This is of significant benefit when operating in marginal weather conditions.
DAS acquisition in vertical exploration wells
DAS VSPs are recorded in exploration wells using ultra-strength, torque-balanced, hybrid logging cables with two single-mode fibres (Varkey et al., 2008). These cables have a safe working load of 18 klbf [80 kN], a temperature rating of 375°F [191°C], and
2 (a) Elgol vertical well schematic; (b) Litho-stratigraphic column.
they enhance safety during high-tension operations and improve logging efficiency by reducing the number of runs involving heavy, long toolstrings. They also significantly reduce the need for drillpipe conveyance and fishing. They enable DAS seismic data to be recorded along the optical fibres during any logging run, saving 12 hours or more of rig time that would otherwise be required to run a VSP with a geophone array (Guerra et al., 2025b).
A quantitative phase-based DAS laser unit interrogates the optical fibres via an optical collector installed in the cable drum, at a high laser pulse frequency rate. The backscattered light is analysed to calculate the dynamic strain over a moving window along each fibre (Russel and Weld, 2021). The window’s size is referred to as the gauge length (GL). Shorter values bring the distributed measurement closer to a point sensor, albeit at the expense of the signal-to-noise ratio. Gauge lengths of 10–20 m are common in seismic surveys. The DAS interrogator simultaneously interrogates two fibres with different GLs. The dynamic range is 135 dB @10 Hz and the 1.5 pico-strain per root-Hertz noise floor is achieved with a GL of 6.4 m. Each fibre operates at a pulse frequency rate of 10 kHz, which is limited by the cable length. For each seismic shot, the DAS dynamic strain is recorded in SEGY format for subsequent data processing. About 30 shots are usually stacked during a wireline DAS VSP survey.
The end-of-fibre (EOF) depth at the toolstring rope socket is determined using gamma-ray correlation. A line wiper device acting on the logging cable at the rig floor level verifies the DAS zero depth. In vertical wells, the cable must be slackened or detensioned to buckle the cable and improve coupling with the
formation through friction. During this process, low-frequency DAS strain data are monitored to determine whether the cable is creeping or in a steady state, ready to record the seismic shots. The simplest method of correcting the depth for cable detensioning involves a linear distribution from the rope socket to the cable drum. However, this method can be inaccurate. Corrections based on nonlinear buckling finite element analysis (FEA) of cable detensioning are recommended, along with comparison to logs and synthetic seismograms (Guerra et al., 2025a).
The DAS interrogator measured a moving average of the dynamic strain over a window size equal to the gauge length (GL). Correcting for GL effects and converting the data from strain to particle velocity equivalent (Mizuno et al., 2019) is a key step for VSP applications such as estimating seismic attenuation, because the GL wavenumber filter affects frequency spectra differently depending on the rock velocities. However, this step is less critical for obtaining time-depth-velocity and corridor stacking results. In this case study, the strain-to-velocity conversion introduced minor artifacts, that were sufficient to mask the response of very weak target reflectors. For our purposes, better results were obtained by converting the DAS data from strain to strain-rate.
The need for travel time inversion regularization VSP interval velocities are obtained by differentiating the travel time curve with respect to depth. Relative velocity errors increase with time picking inaccuracies, short distances between sensors, and the presence of fast rocks. For densely spaced (~5 m) wireline DAS VSP data, automatic time picking yields erratic interval velocities. A similar situation can occur to a lesser extent in geophone VSPs recorded at 10-15 m spacing in very fast rocks (Vp > ~5000 m/s).
Lizarralde and Swift (1999) used an Occam inversion regularisation scheme to find the smoothest velocity model consistent with the data and their errors. A damping epsilon parameter, typically found iteratively, governs the tradeoff between minimising the data misfit and the least squares penalty function. The data signal-to-noise ratio significantly influences the choice of epsilon.
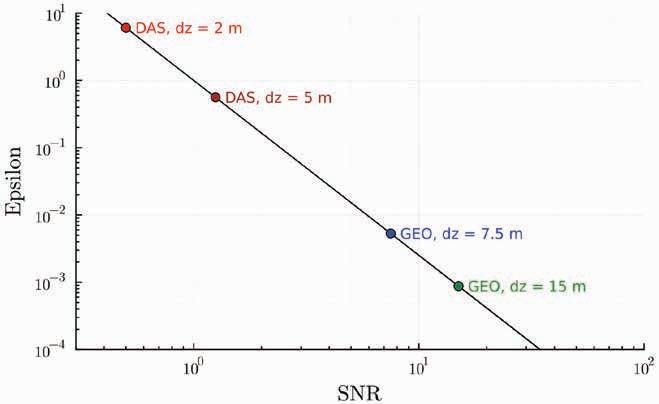
Figure 3 This is a plot of equation 1, which shows the empirical relationship between the regularisation parameter, epsilon, and the signal-to-noise ratio (SNR) parameter. The following assumptions were made: wireline DAS data were sampled at 2-5 m; geophone data were sampled at 7.5-15 m; there were 0.25 ms errors in geophone data time picking; there were 1 ms errors in DAS; and the mean interval velocity was 4000 m/s.
The noisier the data, the higher the epsilon value and the smoother the results. In this study, we provide an empirical formula for the epsilon parameter applicable to wireline VSP measurements.
Another key input to Occam’s scheme is the variance of the time picks. For wireline VSPs with anchored geophones, good signal-to-noise ratio and a bandwidth of ~6–90 Hz, the time picking errors do not exceed +/-0.25 ms. However, for wireline fibre-optic cable deployments, where the cable coupling to the formations is ensured by gravity or friction, the time picking errors can be of the order of +/-1.0 ms. The strong motion of the first P-wave arrivals may slightly decouple or slip the cable, contributing to larger errors than with geophones. Typically, some jittering is observed around wireline DAS first arrival times, but it quickly subsides. This situation improves with cemented fibres, for instance. Occam’s scheme allows different time picking errors for different VSP levels, but a single error value usually produces good results.
Based on our previous VSP experience, we propose a simple, empirical power-law formula for the parameter epsilon as a function of signal-to-noise ratio (SNR) parameter. The SNR parameter is defined as the ratio of the average time interval (dt) between traces to the time-picking accuracy (σt).
(1)
Figure 3 plots this equation for some nominal parameters. We will later apply equation (1) to densely sampled wireline DAS VSP data.
Quantitative borehole matching using VSP
White (1980) introduced partial coherency matching into quantitative well-to-seismic tie workflows. This technique is used to analyse the synthetic trace, determine the best match location, perform wavelet extraction and error estimation, and enable a quantitative assessment of the seismic tie around the well. This robust technique is widely used by the oil and gas industry because it is included in common seismic interpretation software. Ireson et al. (1996) built upon White’s work by incorporating additional well tie metrics and recommending the use of VSP corridor stack traces. With wideband VSP data, one can estimate a deterministic surface seismic wavelet without well logs and derive a spectral operator to match-filter the seismic data around the well. Unfortunately, most seismic interpretation platforms have not fully incorporated corridor stack data, and relatively few case studies have been published (Guerra & Gouveia, 2021). This technique derives a transfer function from the VSP and seismic data input. For white reflectivity and wideband, zero-phase VSP data with a wavelet w2(t), the derived transfer function, tf(t), is a proxy of the seismic wavelet, w1(t), obtained by spectral division of VSP and seismic data cross-correlation and autocorrelations: (2) where ‘ ’ stands for convolution and superscript ‘*’ for complex conjugation. The transfer function can be applied to the seismic
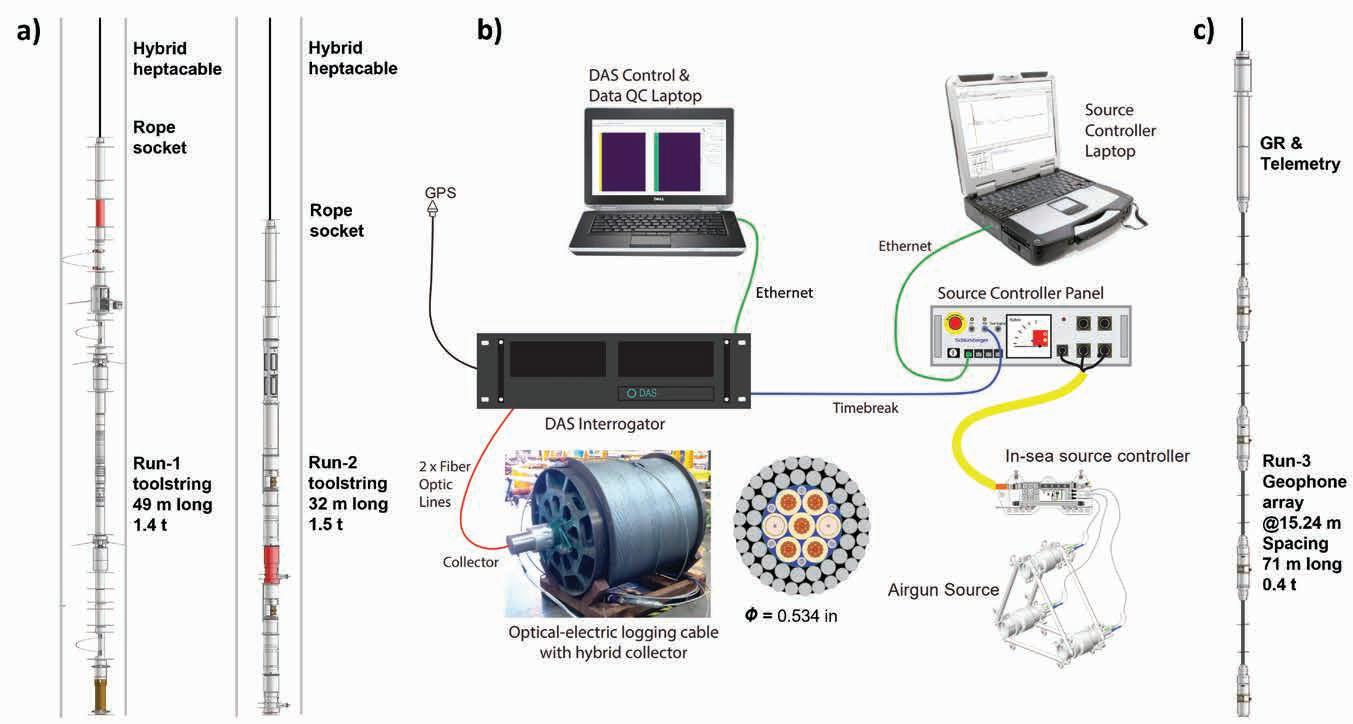
data to match the VSP around the well, improving the resolution, as well as the amplitude, time and phase match. The method scans the seismic volume around the well to estimate well-tie quality metrics, including frequency-dependent predictability (normalised cross-correlation of VSP and seismic) and its statistical confidence (a measure of the matching bandwidth).
We have used the extended quantitative borehole matching technique to compare the accuracy of the well-to-seismic ties, using wireline DAS and wireline geophone VSP zero-phase corridor stacks. This process has also provided valuable insights about the surface seismic data.
In early 2025 Vår Energi qualified the wireline DAS VSP service in a vertical exploration well drilled offshore Norway with a deviation less than 0.4°, by comparing the measurement to those of a dedicated VSP run using conventional geophone arrays. They used a quantitative phase-based DAS interrogator and an ultrastrength hybrid optical-electrical conveyance system (Figure 4). The VSP source was a 3x250 in3 G-gun cluster operating at 2000 psi [13.8 MPa] and at a depth of 5 m.
The hybrid logging cable was slacked at a speed of ~2 kft/h and was monitored using low-frequency DAS strain data to
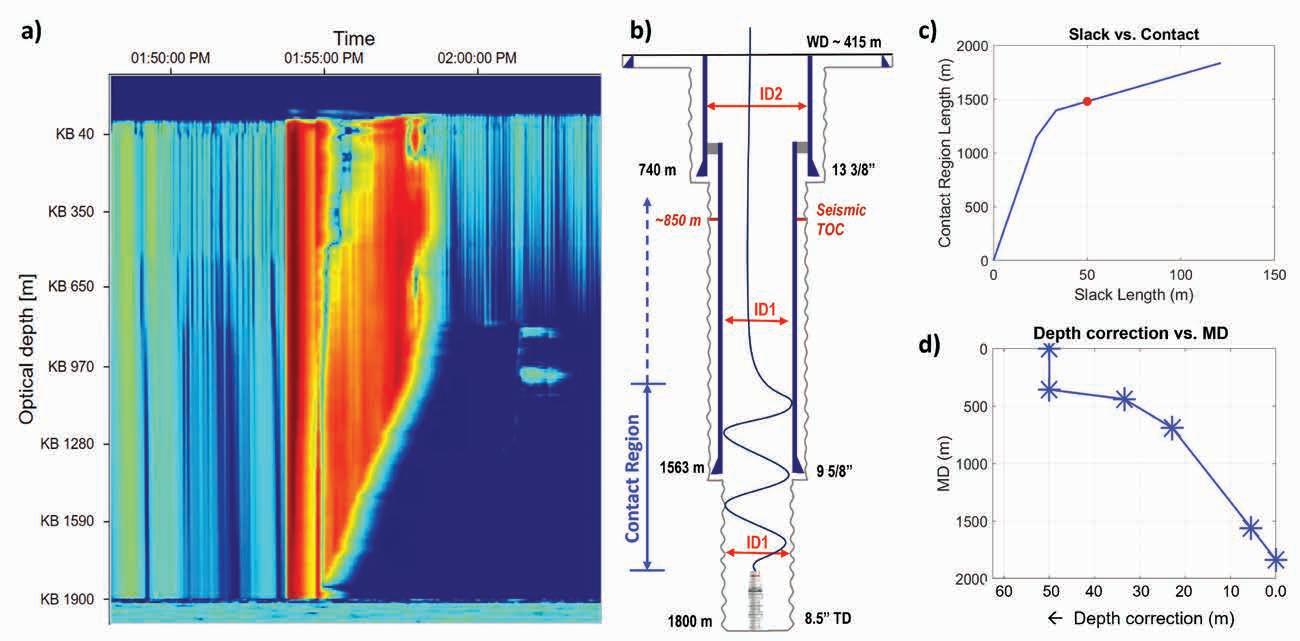
confirm that the cable returned to a steady state. This process took approximately five minutes (Figure 5a).
During the first logging run, which included resistivity, sonic, density and neutron porosity measurements, DAS VSP data were recorded with GL = 21 m and 11 m on each fibre. The wireline toolstring tagged TD and different amounts of cable slack were tested. The best results were obtained with 50 m of slack, after which 30 shots were recorded and stacked. The survey took less than one hour, and the data quality was monitored in real time. Fast LQC was performed on the recorded SEGY files. To enable a more thorough comparison with geophone point sensors, a second DAS VSP was recorded during the second logging run (formation tester tool). This time, 50 m of cable slack was used, as well as shorter GLs of 11 m and 5 m. This survey took half an hour.
Finite element analysis is used to perform the depth corrections due to the 50-m cable detensioning applied (Fig. 5c, (Figure 5d). These corrections are applied to the raw cable length depths to produce the measured depths along the borehole. The correction is zero at the EOF, where the toolstring is stationary and equal to the amount of de-tension length applied, at the top of the friction contact region.
On the third logging run, a conventional VSP was recorded using a triaxial geophone array tool with four shuttles spaced 15.24 m apart. This survey was efficiently completed in less than 10 hours because the well was not deep.
Good DAS and geophone VSP data were obtained from near the well TD to the seabed. Casing ringing was observed in both datasets between the top of the cement and the top of the 9 5/8” liner (Figure 6, (Figure 2a). Unlike the geophone data recorded at 15 m, the DAS denser depth sampling at 5-6 m does not exhibit aliasing of the wavefields. Furthermore, the smaller gauge length
brings the DAS data closer to point sensors. However, this is achieved at the expense of SNR. Final DAS data processing was carried out using GL=11 m data.
The DAS stacks, with clean first arrivals and coherent reflectors (Figure 7a), have a bandwidth of 5-90 Hz at the target level while the equivalent geophone (GEO) data have a bandwidth of 5–115 Hz (Figure 7d). However, we note that the usable bandwidth of the weaker upgoing reflected waves is narrower than this (DAS ~5–80 Hz and GEO~5–105 Hz). Real-time monitoring confirmed that coherent reflectors were recorded after removal of the downgoing P-wave energy (Figure 7b). The smooth transit times and velocities computed from the DAS data match well over the target interval with the sonic log recorded during the same run (Figure 7c). The regularisation parameter was estimated using equation 1 with an average time between DAS receivers of dt ≈2.5 ms (≈ receiver spacing divided by interval velocity) and a time-picking error of σ t = 1 ms. Then, the SNR was estimated to be ≈ 2.4, and the regularisation parameter, ε, was estimated to be ≈ 0.1. This method automatically corrects the original transit times to produce a smooth velocity profile that is consistent with data accuracy.
The DAS VSP data were processed in the strain-rate domain using a relatively standard workflow up to the corridor stack. This workflow considered the differences in polarity between DAS and geophones. The DAS corridor stack window was moved slightly away from the first break times to avoid the jittering mentioned earlier. Four-way well ties between surface seismic, geophone, and DAS VSP corridor stacks and synthetic seismograms over 5–70 Hz show a very good match (Figure 8). The correlation coefficient between the DAS and geophone corridor stacks over 5–70 Hz is 0.95. This demonstrates the accuracy of the DAS solution and the FEA-based cable-slack depth corrections applied
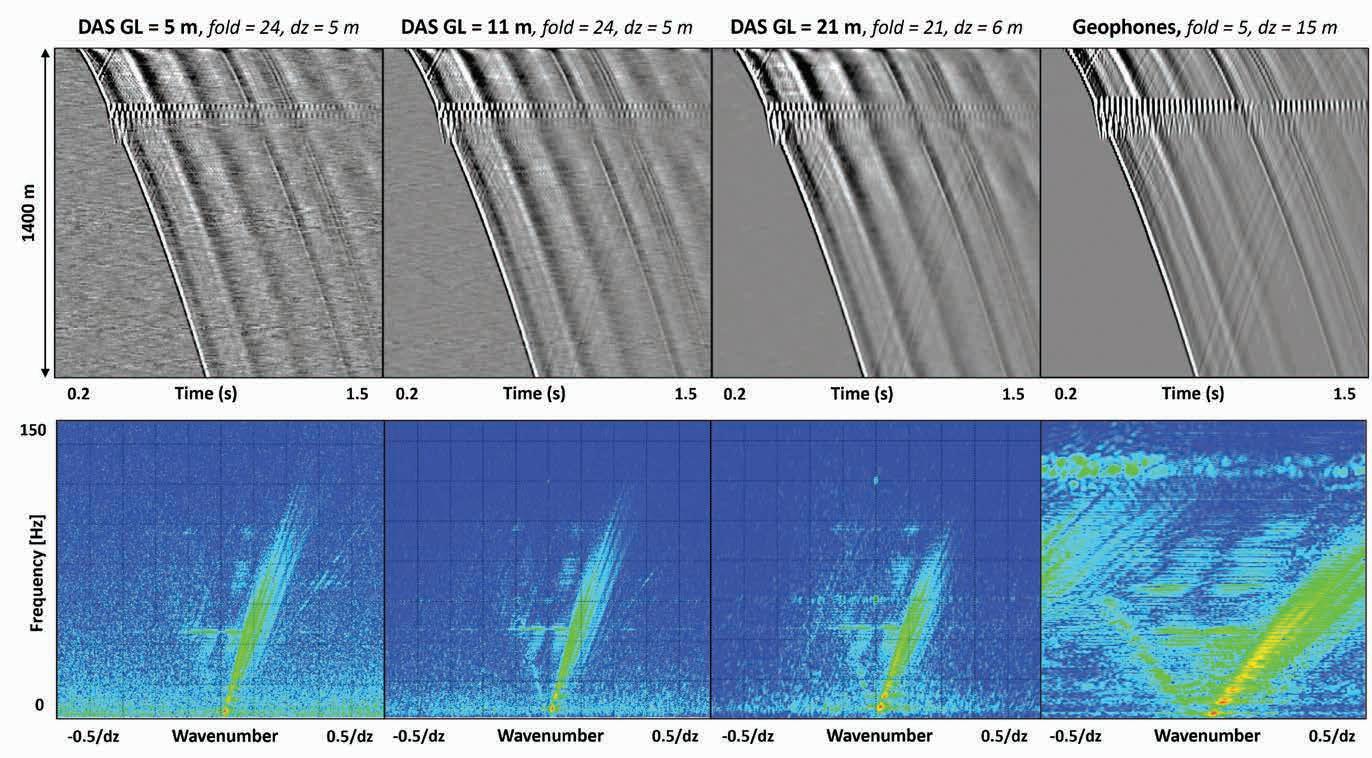
to the DAS data. Depth mismatches on the order of 2 m can be detected during the synthetic tie with the DAS corridor stack. We evaluated the quality of the seismic ties for the DAS and geophone VSP corridor stacks using the quantitative borehole matching technique. The results obtained were equivalent (Figure 9c, (Figure 9d), which further validates the quality of the DAS measurements. The predictability is good below 65 Hz (Figure 9a), reaching 74% at the well location and 87% at the best matching
location, which is 100 m north of the well. At the well location, the time shift is 12 ms and the phase rotation is 23°. The surface seismic wavelets estimated from the DAS VSP data around the well, confirm this slight departure from zero-phase (Figure 9b).
The wireline VSP logging benchmark test, which compared DAS data recorded with a hybrid optical-electric logging cable with
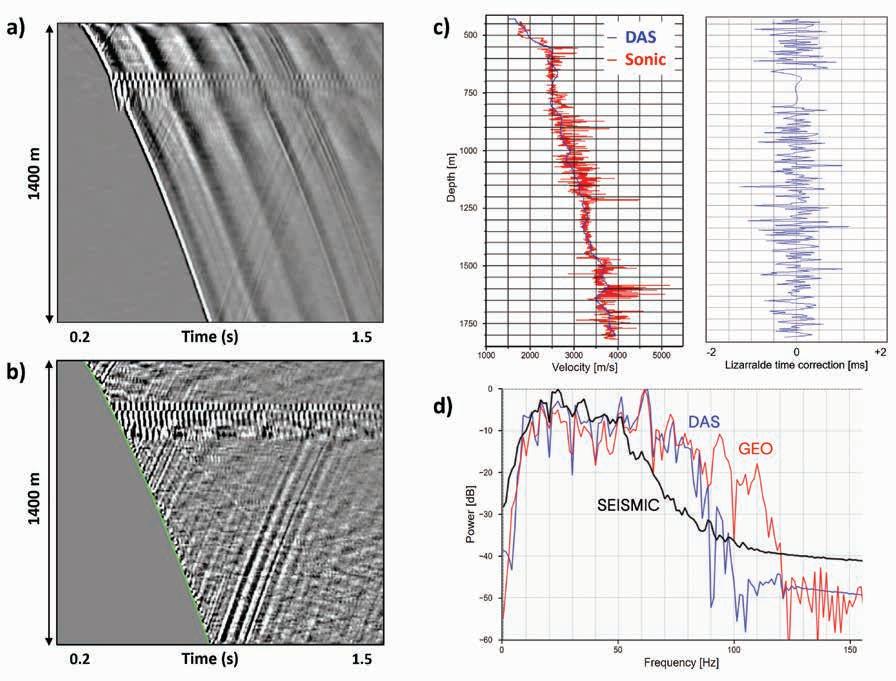
Figure 7 (a) Field DAS stacks (GL=21 m); (b) Realtime QC of DAS residual wavefield (only downgoing P-waves removed); (c) the processed DAS velocities match the sonic log and the regularised DAS times are well within the 1-ms time picking accuracy (Lizarralde and Swift, 1999) (d) DAS stacks’ spectra at target level shows 5-90 Hz bandwidth, wider than surface seismic but narrower than geophone-VSP.
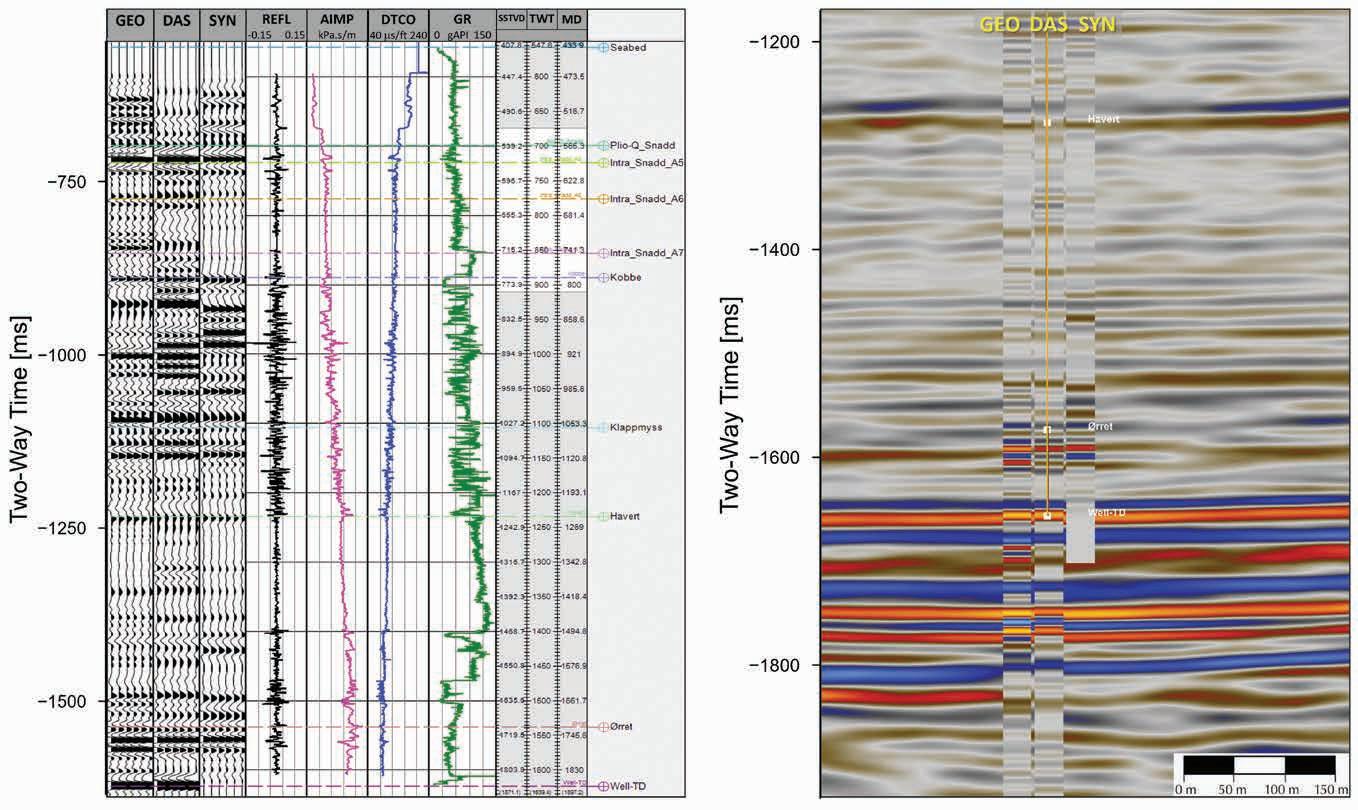
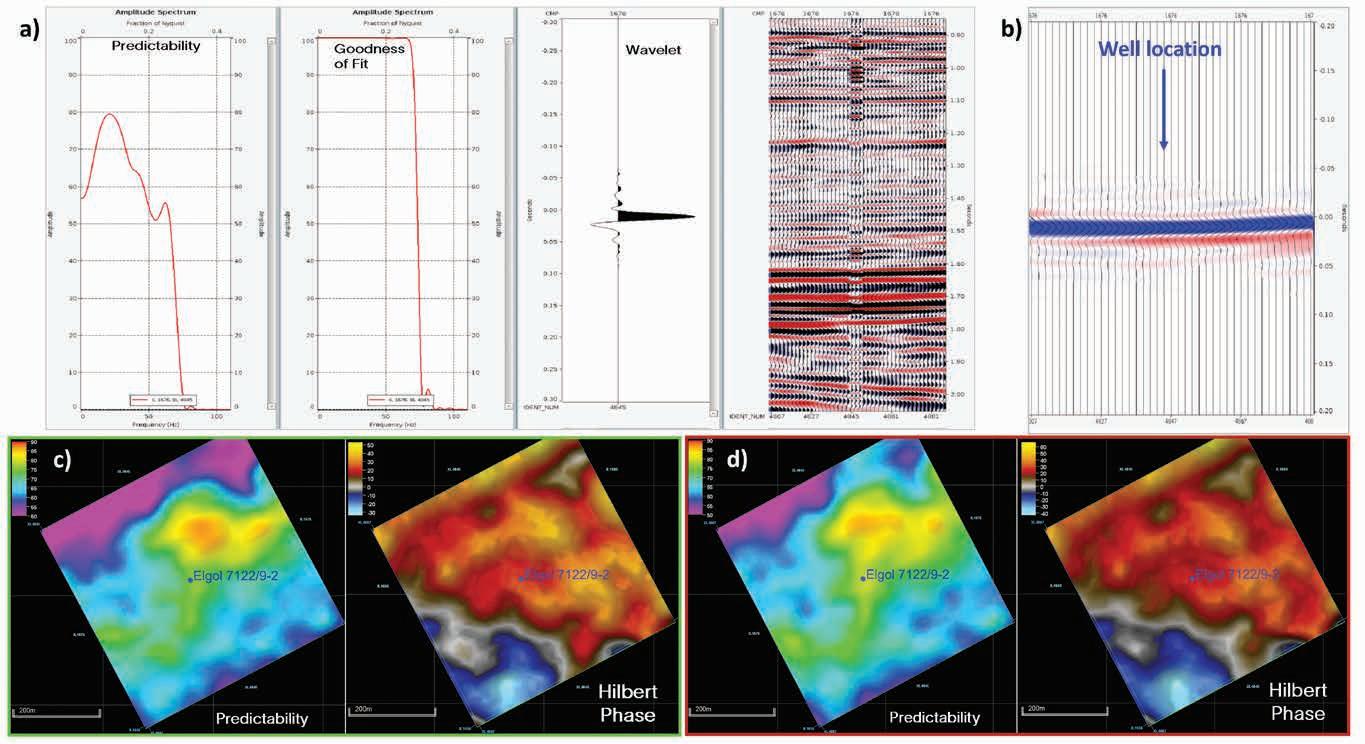
9 (a)
match analyses over 1.2-1.8 s using surface
and DAS 5-80 Hz
showing best predictability below 65 Hz; (b) The wavelet estimated around the well shows that the seismic is phase rotated (~23°); (c) DAS corridor stack best matching location is 100 m north of the well but the seismic is closer to zero-phase to the south; (d) Similar results obtained using the geophone 5–110 Hz corridor stacks.
data from a conventional geophone array in a vertical exploration well drilled offshore Norway, was deemed successful from the perspectives of data acquisition and processing. Reliable time-depth-velocity and quality VSP waveform data were cost-efficiently and safely recorded with a reduced carbon footprint and impact on marine life. These results confirm the viability of this technology for future vertical exploration and appraisal wells.
Acknowledgements
Vår Energi and its JV partners Petoro, Aker BP and Equinor, are gratefully acknowledged for permission to reproduce the data. Thanks also to the SLB wireline team: Les Dallas, Christoffer Soergaard, Thomas Lloyd, Erik Ayala, Ryan Bidyk, Peter MacLeod, Huynh Quang, Aida Hemmat and Gabriele Orbelli. The authors would like to express their gratitude to Phil Christie for his valuable manuscript review.
Blomeier, D., Dustira, A.M., Forke, H. and Scheibner, C. [2013]. Facies analysis and depositional environments of a storm-dominated, temperate to cold, mixed siliceous–carbonate ramp: the Permian Kapp Starostin Formation in NE Svalbard. Norwegian Journal of Geology, 93(2), 75-93.
Guerra, R. and Gouveia, W. [2021]. Quantitative borehole matching of surface seismic using zero-offset VSP data. Sixth EAGE Borehole Geophysics Workshop, Extended Abstracts
Guerra, R. and MacLeod, P. [2024]. A Step Forward in DAS VSP Acquisition in Vertical Exploration Wells: a North Sea case study. 3rd EAGE GeoTech Conference, Extended Abstracts
Guerra, R., Bajwa, H., MacLeod, P., Ji, R. and Lim, B. [2025]. Progress in Acquiring DAS VSPs in Vertical Exploration Wells. First Break, 43(1), pp. 35-41.
Guerra, R., ElGhandour, A., MacLeod, P., Rufino, R., Diesen, M., Brough, S. and Haynes, J. [2025]. Efficient DAS Vertical Incidence Walkaway VSP Offshore Norway. 86th EAGE Annual Conference & Exhibition, Extended Abstracts
Ireson, D., Armstrong, P. and Scott, I. [1996]. Using the Borehole to Quantify Seismic Data Quality. SEG 66th Annual International Meeting, Expanded Abstracts, 182-185.
Larssen, G.B., Elvebakk, G., Henriksen, L.B., Kristensen, S.E., Nilsson, I., Samuelsberg, T.J., Svånå, T.A., Stemmerik, L. and Worsley, D. [2002]. Upper palaeozoic lithostratigraphy of the Southern Norwegian Barents Sea. Norwegian Petroleum Directorate Bulletin, 9, 76. Lizarralde, D. and Swift, S. [1999]. Smooth Inversion of VSP Traveltime Data. Geophysics, 64(3).
Mizuno, T., Leaney, S., Calvez, J.L., Naseer, F. and Khaitan, M.L. [2019]. The significance of gauge length in particle velocity estimation from DAS data: VSP and microseismic cases. SEG International Exposition and 89th Annual Meeting, Expanded Abstracts
Russel, S. and Weld, A. [2021] Signal processing methods for an optical detection system: UK Patent GB 2610643 A. Applicant: Sintela Limited.
Varkey, J., Mydur, R., Sait, N., Wijnberg, W., Kunathikom, S. and Darpi, M. [2008]. Optical fiber cables for wellbore applications: US Patent 7324730 B2. Assignee: Schlumberger Technology Corporation.
White, R.E. [1980]. Partial coherence matching of synthetic seismograms with synthetic traces. Geophysical Prospecting, 28, 333-358.

Geoscientists are continuously reinventing data processing and reprocessing in order to extract more information and better-quality data and offer a more accurate and sophisticated picture of the subsurface – both for oil and gas projects and renewable energy schemes. Seismic data companies are competing to offer improved data processing and management packages for new acquisition and vintage data, enhancing their packages using machine learning and artificial intelligence.
Ever greater compute power, aiding geoscientist’s application of complex algorithms and integration with other data types, has enabled processing to take place much quicker and energy companies to get more from their existing fields. Geoscientists are processing more data than ever before and legacy datasets are offering valuable new insights.
Sylvain Masclet et al present two case studies demonstrating the benefits brought by high-resolution FWI results for seismic reservoir characterisation.
Dona Sita Ambarsari et al investigate the relationship between seismic anisotropy parameters (ε, δ, γ) and reservoir quality characteristics within interbedded sandstone-shale formations of the Sadewa Field, Kutai Basin, East Kalimantan.
Ed Hodges et al discuss how Low Earth Orbit (LEO) satellite constellations have revolutionised connectivity for marine seismic operations, offering high bandwidth and low latency at significantly reduced costs, and enabling near-real-time data transfer and remote processing.
Jill Lewis et al present an upgrade to the SEG and IOGP’s industry standard formats for the exchange of seismic trace data that are interoperable, increase efficiency and focus on standardisation and automation.
Karyna Rodriguez et al describe the data processing that has maximised the 2023 Link survey offshore Namibia.
First Break Special Topics are covered by a mix of original articles dealing with case studies and the latest technology. Contributions to a Special Topic in First Break can be sent directly to the editorial office (firstbreak@eage.org). Submissions will be considered for publication by the editor.
It is also possible to submit a Technical Article to First Break. Technical Articles are subject to a peer review process and should be submitted via EAGE’s ScholarOne website: http://mc.manuscriptcentral.com/fb
You can find the First Break author guidelines online at www.firstbreak.org/guidelines.
January Land Seismic
February Digitalization / Machine Learning
March Reservoir Monitoring
April Underground Storage and Passive Seismic
May Global Exploration
June Navigating Change: Geosciences Shaping a Sustainable Transition
July Reservoir Engineering & Geoscience
August Environment, Minerals and Infrastructure
September Modelling / Interpretation
October Energy Transition
November Marine Acquisition
December Data Management and Processing
More Special Topics may be added during the course of the year.
Sylvain Masclet1*, Yasmine Aziez1, Nicolas Salaun1, Anais Montagud1, Sulaim Al Maani1 and Vimol Souvannavong1 present two case studies demonstrating the benefits brought by highresolution FWI results for seismic reservoir characterisation.
Abstract
Full Waveform Inversion (FWI) has become a standard method for generating high-resolution subsurface velocity models. Advances in FWI now allow the use of the full recorded wavefield, including diving waves, primary reflections, and multiples, leading to improved velocity updates even below the maximum penetration depth of diving waves. These detailed velocity models enhance seismic imaging and provide valuable input for Quantitative Interpretation (QI), which is essential for reservoir characterisation.
We present here two case studies that illustrate the benefits of FWI for QI purposes. The first study, offshore Norway, applies elastic FWI to handle strong velocity contrasts beneath thick chalk layers, demonstrating how high-resolution velocity and seismic images improve fault detection and stratigraphic amplitude-versus-angle (AVA) inversion. The second case study, onshore Oman, showcases recent advances in land FWI and FWI Imaging, leading to sharper fault imaging and better stratigraphic
AVA inversion when combining high-frequency velocity models with improved seismic images.
These two case studies highlight the importance of retrieving velocity models within the same frequency bandwidth as the seismic images to accurately capture thin geological features. They also demonstrate the added value of using FWI-derived velocity models to enhance subsequent stratigraphic AVA inversion.
Full Waveform Inversion (FWI) is now a widely adopted technology for estimating the seismic wave propagation velocity in the subsurface. Through the inversion of recorded seismic data, FWI builds high-resolution velocity models directly in the data domain, in contrast to stratigraphic elastic inversion which relies on the 1D convolutional modelling assumption between reflectivity and the seismic trace (Coulon et al., 2006). Over the past few decades, significant advancements have been made to
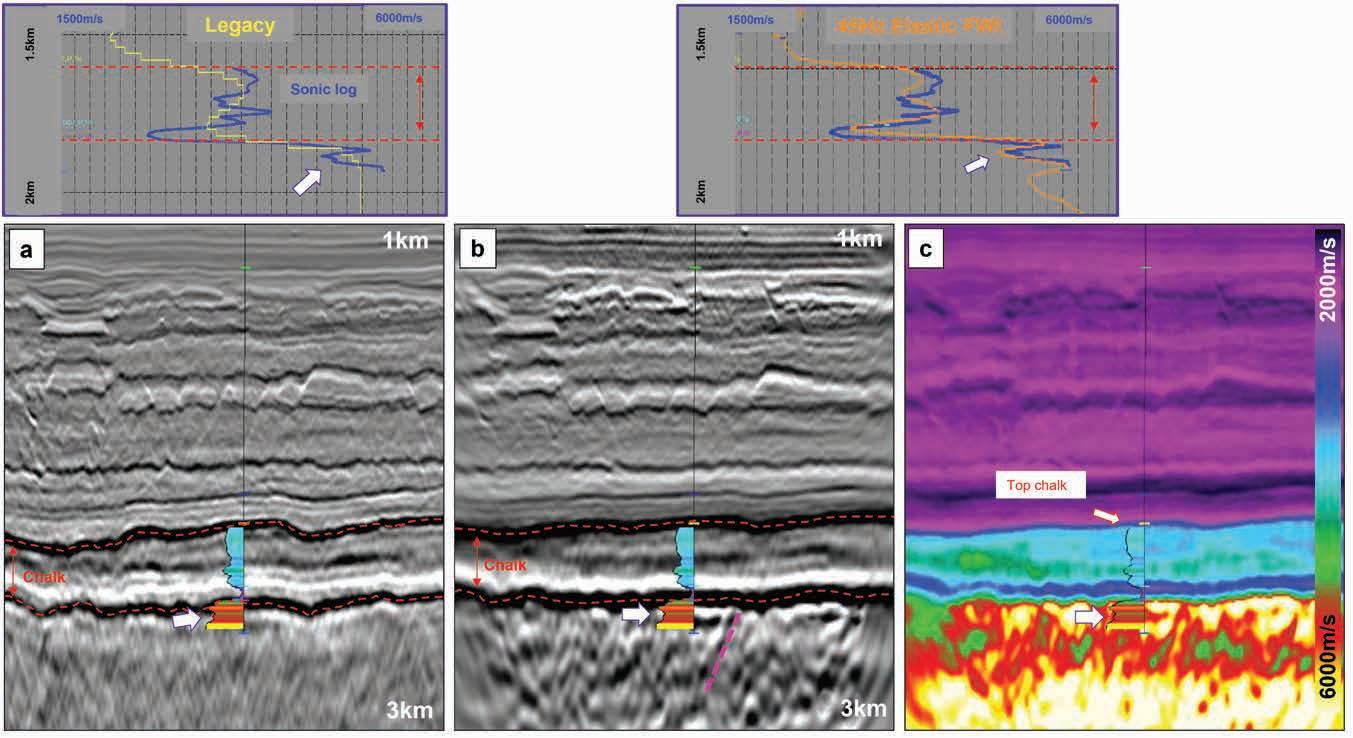
1 Viridien
* Corresponding author, E-mail: sylvain.masclet@viridiengroup.com
DOI: 10.3997/1365-2397.fb2025092
reduce the risk of cycle skipping and to fully leverage the whole recorded wavefield (Zhang et al., 2018).
Industrial FWI approaches now incorporate the entire recorded dataset, including diving waves, primary reflections, and multiples (Zhang et al., 2020). As a result, FWI not only contributes to a more accurate velocity field but also improves seismic imaging by addressing both long and short wavelength velocity errors.
Quantitative interpretation (QI), usually carried out after seismic imaging to estimate reservoir properties such as P-impednce, S-impedance, Poisson’s ratio, and P-wave velocity (Vp)/Shear velocity (Vs) ratio, plays a critical role in both exploration and development by providing estimates of rock attributes (lithofluid properties, porosity, etc.) and, consequently, the reservoir volume.
While detailed velocity models improve the migrated image and reveal valuable geological information about the subsurface (Lu et al., 2016; Shen et al., 2018; Salaun et al., 2021), using accurate subsurface velocity models derived from FWI makes it possible to generate more reliable amplitude-versus-angle (AVA) attributes. This, in turn, enables clearer discrimination of fluid indicators in intercept-gradient cross-plots (Russell et al., 2003). Moreover, these FWI-derived velocity models enhance the accuracy of stratigraphic AVA inversion results when used as the initial model, because they provide robust low-frequency (geological-trend) information that is essential for QI. A second advantage of the FWI-derived velocity models is that they help bridge to the gaps in information between wells, especially in areas where the geology is highly variable and complex, improving both lateral and vertical resolution.
In this paper, we present two case studies demonstrating the benefits brought by high-resolution FWI results for seismic reservoir characterisation.
The first case study is located in the southern Norwegian Sea, around the Utsira High platform. In this area, the known reservoir lies just beneath a thick and highly reflective chalk package, making imaging particularly challenging. This dataset was acquired using towed streamers with a maximum offset of 6 km. The chalk package presents a strong Vp contrast that limits diving wave penetration and generates converted waves. Additionally, sand injectites located above the chalk layer in the overburden create fast velocity contrasts. These sands, whether water- or hydrocarbon-filled, produce strong anti-correlations between Vp, Vs, and density, as explained by Aziez et al. (2024). Elastic FWI (E-FWI) was applied in this study to leverage a modelling engine capable of fully capturing the complex wave phenomena characteristic of this geological setting. During E-FWI, the Vp model is inverted while the Vp/Vs ratio and density are refined iteratively using stratigraphic AVA inversion to properly decouple Vp, Vs, and density parameters for the sand injectites (Masclet et al., 2025).
The workflow begins with an E-FWI update of Vp only; starting from an initial Vp/Vs derived from well data, yielding a reliable low-frequency Vs velocity model. The density model is at this stage passively updated using a single Gardner’s law. After migration, stratigraphic elastic inversion is performed to obtain an updated density and Vp/Vs. This updated Vp/Vs and density
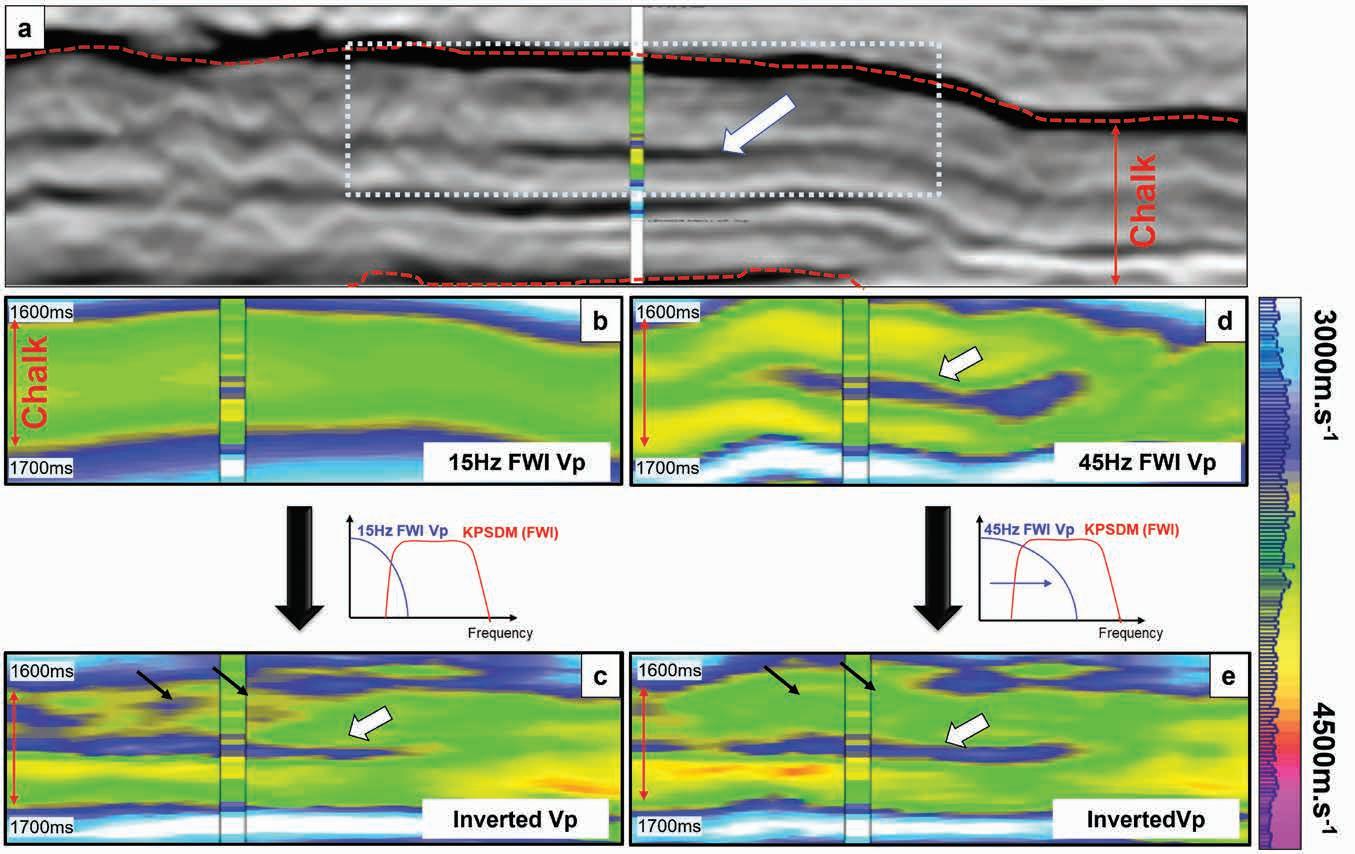
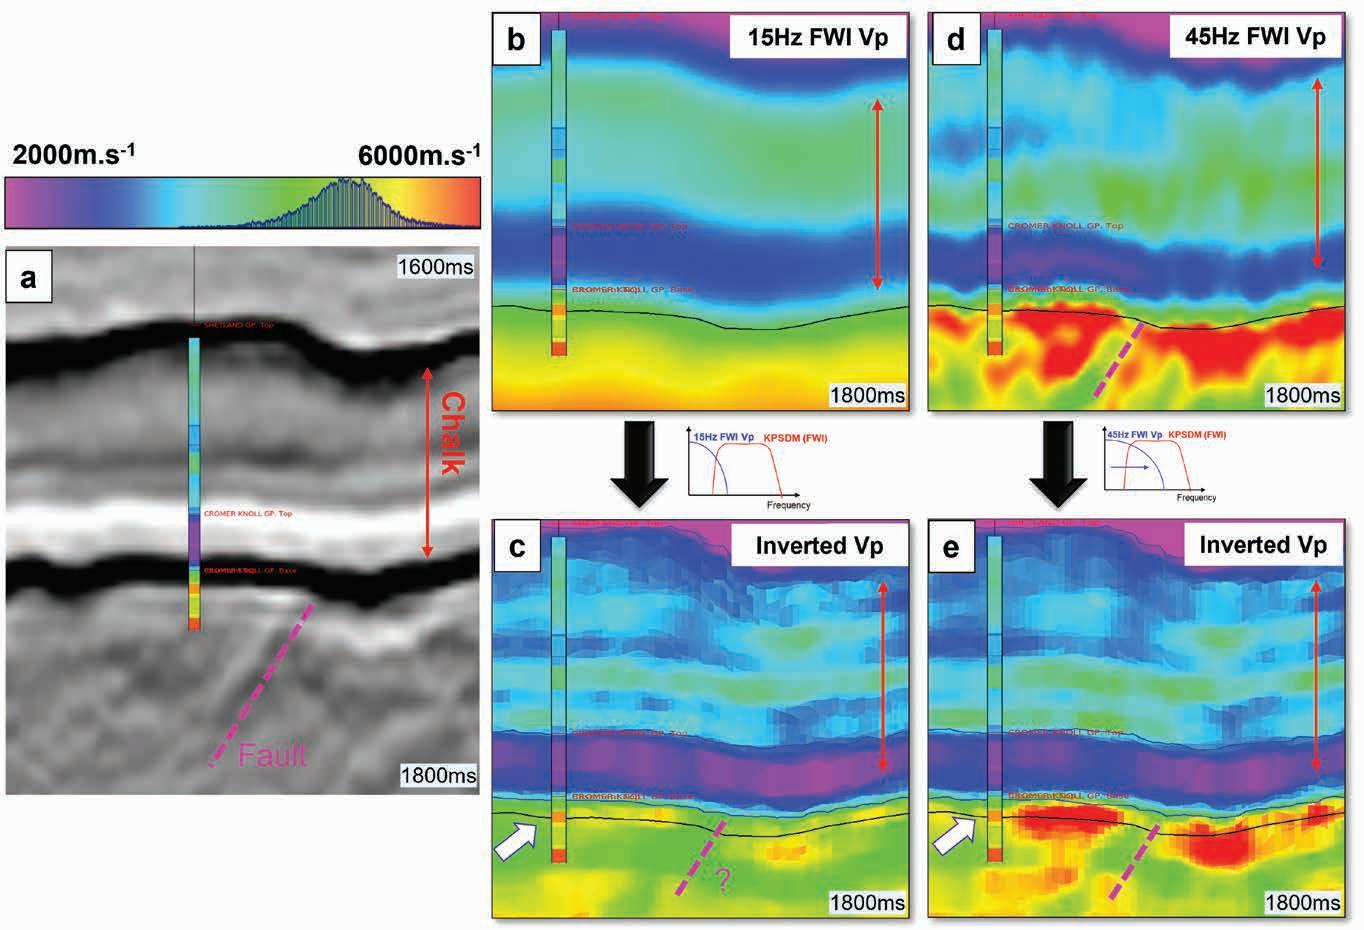
exhibit lateral and vertical resolutions. They are then used as the initial model for a subsequent E-FWI run, again updating Vp only with passive updates of Vs and density. Elastic FWI was applied up to 45 Hz (Figure 1) because analysis of well sonic logs identified that a minimum frequency of 45 Hz was necessary to capture the velocity variations at the reservoir level. Figure 1 compares the legacy Kirchhoff Pre-Stack Depth Migration (KPSDM) image with the FWI Image (Zhang et al., 2020), derived from the 45 Hz FWI result. The FWI Image exhibits a higher signal-to-noise ratio (S/N) and supports more accurate structural interpretation by better highlighting the reservoir location, notably delineating the faulting that limits the reservoir laterally.
Given the high-quality seismic image, the next step is to evaluate the benefits for QI. Here, we analyse the impact of the velocity resolution by considering the same seismic data migrated with the 15 Hz E-FWI velocity model (Figure 2) but using two different initial velocity models for the acoustic stratigraphic inversion: scenario 1 uses the 15 Hz FWI velocity (Figure 2b), while scenario 2 uses the 45 Hz FWI velocity (Figure 2d). As anticipated by the well log analysis exercise, the 15 Hz FWI velocity (Figure 2b) lacks sufficient details to recover the prospect embedded within the thick chalk layer.
When performing stratigraphic inversion to estimate Vp, both scenarios retrieve the velocity inversion with the information contained in the seismic image itself (see white arrow in Figures 2c and 2e). With the 15 Hz model, we observe a low-velocity halo that does not align with the well velocity profile (black arrows
in Figure 2c). In contrast, the 45 Hz-based result shows a much more confined and well-delineated anomaly, matching the well data more accurately. This example illustrates that the migrated seismic data alone cannot fully recover all necessary information, due to imperfections in primary-only migration, which makes an accurate velocity model essential.
In the second test, we compared similar scenarios, this time focusing on the main reservoir area (Figure 3), where the seismic response is more challenging and AVO response more limited, suffering from refraction energy contamination of the mid/far offset ranges. In this case, the Vp inverted from scenario 1 using the 15Hz FWI model as the initial model failed to properly recover the velocity contrast at the chalk and basement interface (white arrow in Figure 3c) and more importantly to capture the critical fault information below the chalk layer, which is needed to understand the lateral extent of the reservoir. In contrast, we can see in Figure 3e how the added detail from the 45 Hz elastic FWI-derived Vp model brings significant improvement at the chalk/basement interface. It helps to support and better constrain the inversion in areas where the quality of the migrated seismic data is limited.
This case study demonstrates the significant benefits of employing an initial velocity model for stratigraphic inversion that reaches the expected frequency of minimum resolution in the reservoir. While seismic imaging provides important information, it cannot compensate for low-wavenumber velocity models, especially in complex geological settings where imaging issues may degrade the seismic AVO response.
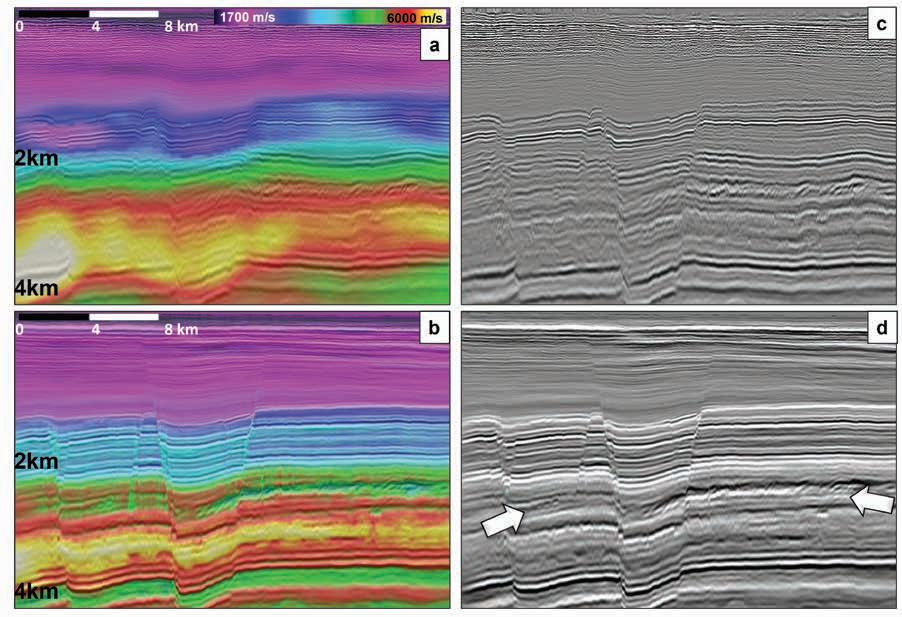
The second case study is located onshore in the Sultanate of Oman. Obtaining high-resolution velocity models in onshore environments has long been a challenge due to the complexity of seismic data affected by near-surface complexity and elastic phenomena (Guo and Aziz, 2024). However, in recent years there has been increasing success in producing onshore high-resolution FWI velocity models and FWI Images (Guo et al., 2025; Culianez, 2025; Reinier et al., 2025). This progress is primarily due to advances in near-surface velocity estimation (Bardainne et al., 2018; Masclet et al., 2019), the use of interferometry to recover ultra-low frequencies (Masclet et al., 2021; Le Meur et al., 2021), and improvements in FWI algorithms.
Figure 4 illustrates how high-resolution FWI velocity models and FWI Images can significantly enhance the interpretation of geological structures compared to conventional KPSDM.
Figure 4 Power of FWI and benefits of FWI Imaging.
a) Legacy velocity from tomography and c) the KSPDM migrated with the tomography velocity. b) 40Hz FWI and its associated FWI Image d). White arrows indicate the thin channel details that are more visible on the FWI Image.
Indeed, the FWI Image provides better illumination in shallow intervals thanks to full-wavefield illumination, and better low frequency thanks to the long-wavelength components updated by FWI, helping with fault definition. The FWI Image also exhibits much more balanced amplitude thanks to iterative least-squares fitting and consideration of transmission effects and multiples, all contributing to more accurate geological interpretation.
Similarly to the first case study, our goal here is to demonstrate the benefits of high-quality velocity models for QI. We compare three scenarios described in Figure 5: (SET 1) using a lower-quality velocity model derived from tomography for both migration and as the initial model for acoustic stratigraphic inversion; (SET 2) using a 40 Hz FWI velocity model and its associated seismic migration; and (SET 3) using the same 40 Hz velocity model but replacing the seismic image with the FWI-derived image.
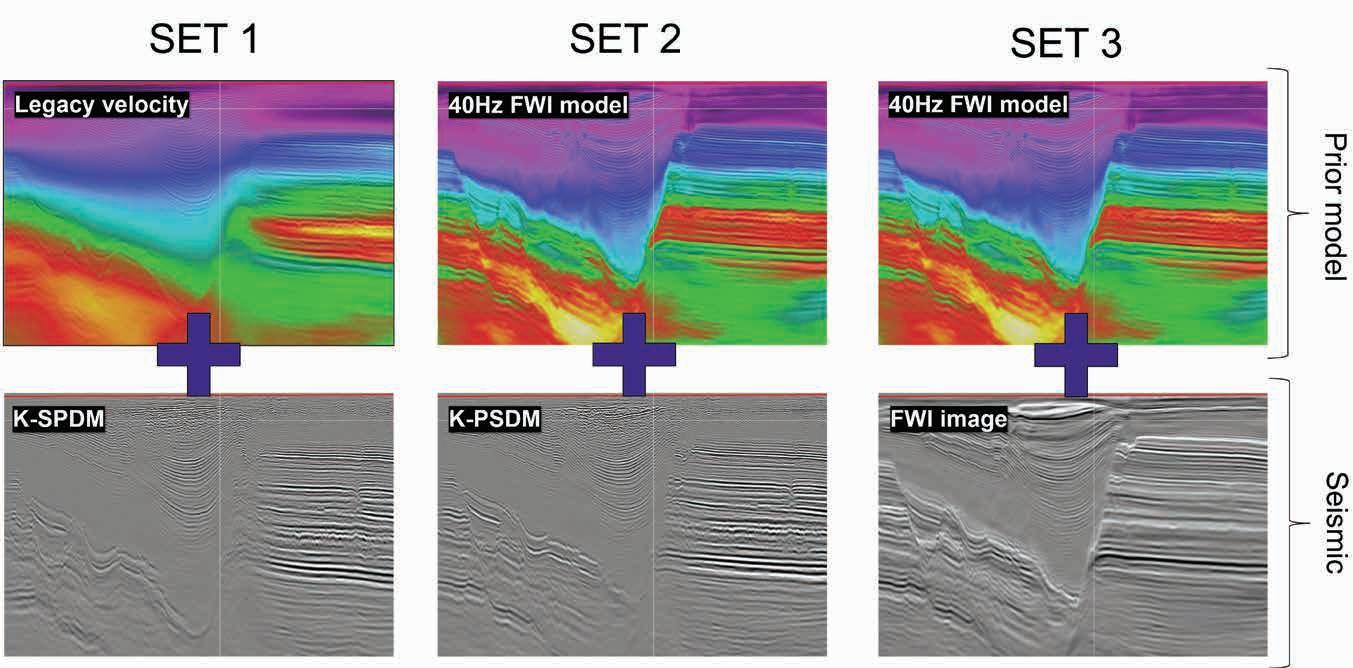
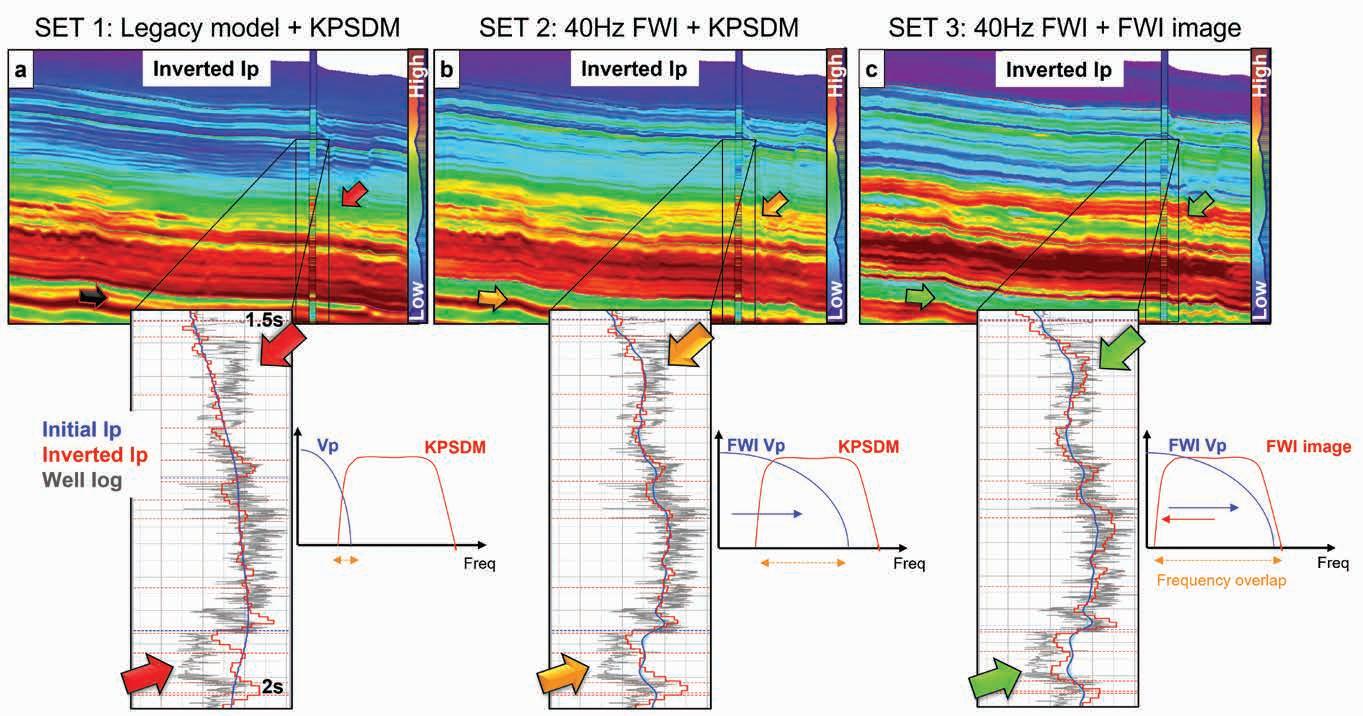
6 Impedance from stratigraphic acoustic inversion, as a section (top) and extracted at well (bottom), using as input a) tomography velocity and its associated migrated seismic, b) FWI velocity and its associated migrated seismic, c) FWI velocity and its associated FWI Image. For each scenario, a scheme indicates the frequency overlap between initial velocity models and seismic. Arrows indicate the improvement from using better velocity and better reflectivity as input.
The purpose of SET 3 is to evaluate how the extra low-frequency energy present in the FWI Image influences the acoustic stratigraphic inversion results, especially in the presence of strong velocity contrasts. The conversion of a FWI impedance model into an FWI-derived reflectivity can be done through a normal derivative of FWI velocity against local reflectors but its interpretation through stratigraphic inversion may still suffer from its oversimplified 1D time convolution modelling. By deconvolving the FWI Image from its wavelet and then performing acoustic stratigraphic inversion, we obtained an Ip attribute that is indeed limited to 40 Hz high-frequency content but appears better resolved and more consistent with the expected reservoir properties.
Figure 6 shows the inverted attributes for the Ip result for each scenario, with a zoom on the well data for detailed comparison. A statistical wavelet was extracted from each seismic dataset using enough traces to capture the seismic characteristics and a sufficiently large vertical-time window to include the low-frequency information.
In Scenario 1, Figure 6a, the initial Ip model (blue line at the well, where density is derived using Gardner’s law) deviates significantly from the measured logs in some intervals, making it difficult for the stratigraphic inversion (red line) to recover the elastic properties accurately from the seismic reflectivity. This is highlighted by the red arrows pointing at two targeted intervals. Scenario 2, shown in Figure 6b, demonstrates the importance of having a good velocity model as input, producing an inversion that better matches the well data. However, at the deeper interval, where a stronger contrast is observed, a mismatch remains between the inversion results and the well log, likely due to the lack of usable very-low-frequency content in the migrated seismic, a common issue in land data. Finally, scenario 3, Figure 6c,
shows how incorporating better low-frequency content in the seismic image, here using the FWI Image, can overcome this limitation and improve the capture of those stronger contrasts. This emphasises the importance of combining a high-frequency velocity model with a seismic image containing accurate low-frequency information to achieve improved inversion results. It also shows the benefits of frequency overlap between the a-priori model and the seismic used for stratigraphic inversion.
To emphasise the importance of frequencies below 5 Hz, the low-frequency content (< 5 Hz) was removed from the FWI Image, the wavelet recomputed, and the acoustic stratigraphic inversion rerun. The results, shown in Figure 7, demonstrate that the match between the inversion and the well log in both intervals (indicated by the arrows) is reduced when the FWI Image’s low frequencies are omitted.
Finally, by comparing the lowfrequency content (<5 Hz) of the migrated seismic with the 40 Hz FWI model (Figure 8a) and with the FWI Image of the same model (Figure 8b), we see that the FWI Image exhibits superior quality in terms of S/N, event continuity, and amplitude balance. This observation suggests that the high-quality lowfrequency component of the FWI Image can serve as an effective alternative for land data, where reliable low-frequency information is often lacking.
While FWI is becoming increasingly powerful and already offers multi-parameter updates of Vp and Q (Xiao, 2018), Vp and Epsilon, or Vp and Vs (Cao et al., 2025), a truly robust multi-parameter FWI for Vp, Vs, and density updates without parameter leakage has yet to be achieved. In the meantime, QI through stratigraphic elastic inversion remains a critical step for extracting essential subsurface properties from the seismic image.
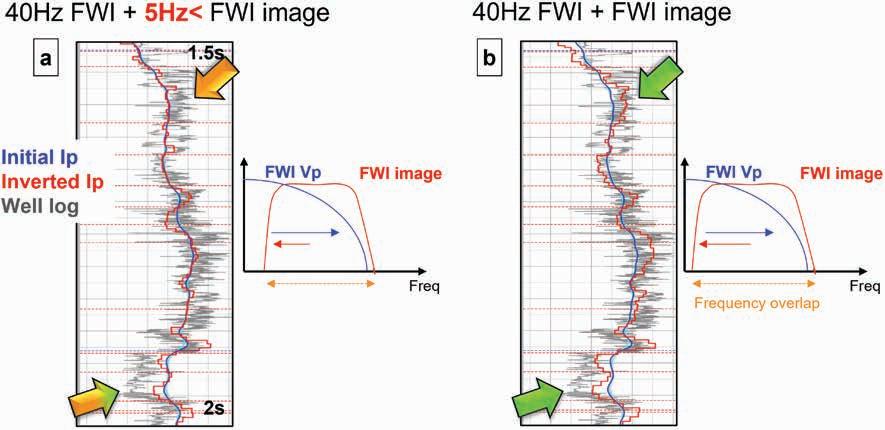
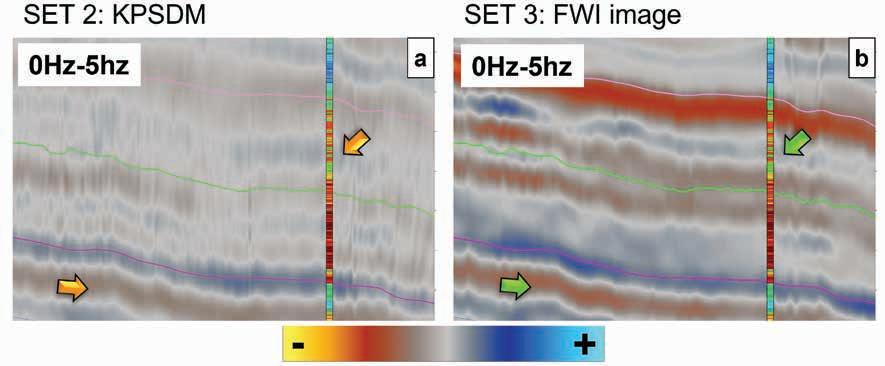
As demonstrated through these two case studies, maximising the frequency bandwidth’s overlap between the seismic image and the velocity model appears to be crucial for stratigraphic inversion. Velocity models extrapolated from well data are often insufficient for stratigraphic inversion, because they are limited vertically and laterally by the log coverage, the quality of the logs, and the number of available wells, which markedly increases the uncertainty of the model away from the wells. Therefore, stratigraphic inversion has to rely on the seismic data itself which can be risky when interpreting thin geological features such as channels and stratigraphic traps.
Additionally, here the very low-frequency (<4Hz) components in the seismic image have been filtered out due to their poor quality prior to stratigraphic AVA inversion. Our results indicate that this can lead to suboptimal stratigraphic inversion outcomes. Therefore, improving the quality of low-frequency information in the seismic image is a key factor for successful QI. Moreover, for seismic imaging, in addition to accurate velocity models, preprocessing plays a critical role in removing noise and multiples while preserving AVA information from primary reflections.
While the results presented here provide valuable insights, it is worth noting that the obtained velocity models, particularly for the second case study, could be further improved by using elastic FWI rather than acoustic FWI. Moreover, although the impact of density has been touched upon, it warrants further refinement. Finally, the use of the FWI Image, considered as a reflectivity, for AVA inversion, highlights the potential of its full-bandwidth content and opens the door to further investigation into the impact of FWI Imaging on reservoir characterisation.
Figure 7 Inverted Ip using FWI velocity and its associated FWI Image. a) results after removing low frequencies below 5Hz, b) with keeping the full frequency content in the image. Arrows indicate the targeted intervals.
Figure 8 Low-frequency panels for two seismic sets used for the inversion. a) KPSDM seismic migrated with the 40 Hz FWI model. b) FWI Image derived from the 40 Hz FWI model. Embedded in sections, the well with P-Impedance log displayed: red intervals corresponding to high Impedance, blue intervals to low Impedance.
FWI remains an active research field with promising developments, such as angle-restricted FWI (Espin et al., 2024) and independent inversion of Vp and Vs (Rest et al., 2025), which continue to advance the integration of FWI with reservoir characterisation.
FWI has now moved from a velocity model-building tool in complex areas to a highly accurate imaging tool. It not only enables improved migrated seismic images, it also offers significant benefits for reservoir characterisation. Through two case studies, we have demonstrated the advantages of using high-resolution velocity models as input for stratigraphic inversion. The velocity details obtained from FWI, taking advantage of a full wavelength update and incorporating not only information from primary reflections but also multiples, ghosts, and diving waves, complement the migrated seismic image information. Furthermore, we have shown the importance of using the low-frequency content recovered by FWI in the stratigraphic inversion process.
Since a robust decoupling of Vp, Vs, and density in FWI is still an ongoing challenge, using QI in combination with FWI remains a crucial step for improving reservoir understanding. Compared to present-day FWI, QI relies on a simplified physical modelling (1D time convolution) but compensates for this through a global optimisation framework that enables a much better decoupling of model parameters and provides greater flexibility for incorporating a priori information. To ensure an effective integration of FWI and QI, it is essential to maintain the highest possible S/N and bandwidth in both seismic images and velocity models.
We thank Equinor, AkerBP, Petoro and the Ministry of Energy and Minerals of the Sultanate of Oman for kind permission to use the data and to show the results
Aziez, Y., Colnard, O., Souvannavong, V. and Tatat, J. [2024]. Optimized inversion for Density and P-wave Velocity, for better fluid discrimination in Caran remobilized in-situ sand deposit, Central North Sea. 3rd EAGE Conference on Seismic Inversion, Extended Abstracts.
Bardainne, T. [2018]. Joint inversion of refracted P-waves, surface waves and reflectivity. 80th EAGE Annual Conference & Exhibition, Extended Abstracts, We-K-02.
Cao, J., Sedova, A., Reinier, M., Donno, D. and Lambaré, G. [2025]. Towards high-resolution land elastic FWI? 86th EAGE Annual Conference & Exhibition, Extended Abstracts
Coulon, J.-P., Lafet, Y., Deschizeaux, B., Doyen, P.M. and Duboz, P. [2006]. Stratigraphic elastic inversion for seismic lithology discrimination in a turbiditic reservoir. 76th SEG Annual International Meeting, Expanded Abstracts, 2092-2096.
Culianez, G. [2025]. When onshore FWI imaging delineates unseeable outcropping salt body: a case study from Sultanate of Oman. 86th EAGE Annual Conference & Exhibition, Extended Abstracts
Espin, I., Michou, L., Salaun, N., Donno, D., Wergeland, Ø., Gotliebsen, K., Carotti, D., Mispel, J. and Høgden, S. [2024]. Angle-restricted FWI for shallow reservoir characterisation. First Break, 42(12), pp.31-36.
Guo Y. and Aziz, A. [2024]. New geological understanding with land FWI Imaging, a Sultanate of Oman case study. 85th EAGE Annual Conference & Exhibition, Extended Abstracts
Guo, Y., Aziz, A., Sedova, A., Reinier, M., Donno, D., Lambaré, G. and Carotti, D. [2025]. Unlocking onshore imaging challenges with FWI: Case studies from the Sultanate of Oman. The Leading Edge, 44(1), pp.22-32.
Le Meur, D., Donno D., Courbin, J., Solyga, D. and Prescott, A. [2020]. Retrieving ultra-low frequency surface waves from land blended continuous recording data. 90th SEG Annual International Meeting, Expanded Abstracts
Lu, R. [2016]. Revealing overburden and reservoir complexity with high-resolution FWI. 86th SEG Annual International Meeting, Expanded Abstracts, 1242-1246.
Masclet, S., Bardainne, T., Massart, V., Prigent, H., Le Meur, D. and Song, H. [2019] Near surface characterization in Southern Oman: Multi-Wave Inversion guided by Machine Learning. 80th EAGE Annual Conference & Exhibition, Extended Abstracts
Masclet, S., Bouquard, G. and Prigent, H. [2021]. Multi-wave and full-waveform inversion in southern Oman. 82nd EAGE Annual Conference & Exhibition, Extended Abstracts
Masclet, S., Pintus, A., Wright, A., Montagud, A., Beigbeder, C. and Cao, J. [2025]. Reservoir-based Elastic Full-waveform Inversion: Maximizing Streamer Data Potential in Exploration. 86th EAGE Annual Conference & Exhibition, Extended Abstracts.
Reinier, M., Pellerin, S., Sedova, A., Dupinet, C., Afonso Monteiro, A., Aldairi, A., Mitschler, J.-B., Retailleau, M., Al Haddabi, A., Al Adawi, R., Blymyer, D., Li, T., Urazimanova, A., Warren, G. and Millis, K. [2025]. High-resolution land FWI under dunes in the Sultanate of Oman: taking advantage of continuous recordings. 86th EAGE Annual Conference & Exhibition, Extended Abstracts
Rest, C., Cichy, K. and Ratcliffe, A. [2025]. High-Resolution Shear-Wave Velocity Model Building with Elastic Full-Waveform Inversion of Multi-Component Ocean-Bottom Data. 86th EAGE Annual Conference & Exhibition, Extended Abstracts
Russell, B.H., Hedlin, K. and Hilterman, F.J. [2003]. Fluid-property discrimination with AVO: a Biot–Gassmann perspective. Geophysics, 68, 29–39
Salaun, N., Reinier, M., Espin, I. and Gigou, G. [2021]. FWI velocity and imaging: A case study in the Johan Castberg area. 82nd EAGE Annual Conference & Exhibition, Extended Abstracts
Shen, X., Jiang, L., Dellinger, J., Brenders, A., Kumar, C., James, M., Etgen, J., Meaux, D., Walters, R. and Abdullayev, N. [2018]. High resolution full-waveform inversion for structural imaging in exploration. 87th SEG Annual International Meeting, Expanded Abstracts, 1098–1102.
Xiao, B., Ratcliffe, A., Latter, T., Yie, X. and Wang, M. [2018]. Inverting for near-surface absorption with full-waveform inversion: a case study from the North Viking Graben in the northern North Sea. 80th EAGE Annual Conference and Exhibition, Extended Abstracts
Zhang, Z., Mei, J., Lin, F., Huang, R. and Wang, P. [2018]. Correcting for salt misinterpretation with full-waveform inversion. 88th SEG Annual International Meeting, Expanded Abstracts, 1143–1147.
Zhang, Z., Wu, Z., Wei, Z., Mei, J., Huang, R. and Wang, P. [2020]. FWI Imaging: Full-wavefield imaging through full-waveform inversion. 90th SEG Annual International Meeting, Expanded Abstracts, 656660.


Dona Sita Ambarsari1*, Madaniya Oktariena1, Sigit Sukmono1, Ign. Sonny Winardhi1, Tavip Setiawan2, Pongga Dikdya Wardaya3, Erlangga Septama3 and Befriko Murdianto 4 investigate the relationship between seismic anisotropy parameters (ε, δ, γ) and reservoir quality characteristics within interbedded sandstone-shale formations of the Sadewa Field, Kutai Basin, East Kalimantan.
Abstract
This study investigates the relationship between seismic anisotropy parameters (ε, δ, γ) and reservoir quality characteristics within interbedded sandstone-shale formations of the Sadewa Field, Kutai Basin, East Kalimantan. Utilising integrated rock core data and well log measurements from wells DSA-4 and DSA-5ST1, anisotropy parameters were derived from ultrasonic velocity measurements and correlated with petrographic, porosity, and permeability analyses. Two distinct rock types, Rock Type A (RT-A) and Rock Type B (RT-B), were identified based on anisotropy trends and reservoir quality indicators such as clay content, quartz percentage, grain size, and porosity. RT-A samples exhibited significantly higher anisotropy values and reservoir quality, attributed primarily to the presence of hydrocarbon-bearing interlayers confirmed by petrographic observations. Critical porosity and flow zone indicator analyses further supported the classification and quality differentiation of the rock types. The study demonstrates that anisotropy parameters, combined with Gamma Ray log data, providing robust diagnostic tools for discriminating lithological variations and assessing reservoir heterogeneity in complex sedimentary environments.
Introduction
A study of seismic anisotropy was conducted by Postma (1955), who demonstrated that a macroscopically isotropic Earth can exhibit anisotropic behaviour if the rock layering occurs at a scale smaller than the dominant seismic wavelength. Subsequently, Jolly (1956) reported the observation of SH waves with horizontal propagation velocities approximately twice as high as those in the vertical direction, further emphasising the presence of anisotropy in layered media.
Thomsen (1986) introduced the anisotropy parameters ε, δ, and γ to describe weak anisotropy in transversely isotropic media. Although initially overlooked, these parameters later became essential to practical seismic applications. Significant advancements in the application of anisotropy to field data were made by Grechka et al. (1999), Alkhalifah (1995), Tsvankin et al. (1994, 1995, 1996), and Dayley et al. (1977, 1979, 2004). Grechka reformulated wave propagation equations to accurately describe seismic velocity behaviour in vertically transversely isotropic (VTI) media. Thomsen’s parameters — ε, δ, and γ — are now widely used to quantify elastic anisotropy and to identify the combinations of elastic moduli that influence normal moveout (NMO) velocity and amplitude variation with offset (AVO) responses.
The effect of anisotropy on seismic data can be detected during the normal move-out step in the seismic data processing. The vertical velocity parameter V0 and the Thomsen parameters (ε, δ) are factors that influence wave propagation in VTI media (Tsvankin & Thomsen, 1994). The seismic anisotropy parameter Eta (η) refers to the phase heterogeneity in the P-waves seismic velocity. The seismic anisotropy parameter Eta (η) determines anisotropic and isotropic conditions through a combination of the Thomsen anisotropy parameters Epsilon (ε) and Delta (δ), which are its constituents. The seismic anisotropy parameter Eta (η) is the main component in residual move-out correction as a component of anisotropic VNMO
Azimuthal anisotropy measurements are performed at the laboratory scale to capture anisotropic behaviour across a broad range of azimuths (Chandra and Hanson, 1988; Vernik and Nur, 1992; Wang, 2002). However, the reliability of these measurements may be compromised if rock samples are damaged during the coring process. Owing to such measurement limitations,
1 Seismology Exploration and Engineering Research Group, Geophysical Engineering, Institut Teknologi Bandung
2 Geological Engineering, Pertamina University | 3 PT Pertamina Research, Technology, and Innovation
4 PT Pertamina Hulu Kalimantan Timur
* Corresponding author, E-mail: donaambarsari@itb.ac.id
DOI: 10.3997/1365-2397.fb2025093
numerous rock physics models have been developed to simulate anisotropic behaviour. These models often represent stress-induced anisotropy by incorporating fracture discontinuities modelled as penny-shaped inclusions, as well as accounting for the critical porosity of the rock (Nur, 1971). Despite their utility, the development of rock physics models remains challenging due to the inherent heterogeneity in mineralogy, crystal orientation, grain size distribution, and fracture networks across different rock types. Ambarsari et al. (2018, 2020, 2021) demonstrated that selected rock physics parameters, such as critical porosity and pore space stiffness, can serve as indicators of reservoir quality.
To reduce the complexity associated with the heterogeneous mineral distribution in reservoir rocks, the relationship between anisotropy parameters and reservoir quality is approximated using the sand-volume ratio as a representative variable. Seismic anisotropy is derived from well log data and utilised to establish a correlation between the sand-volume ratio and the anisotropy parameter γ (Gavin and Lumley, 2017). A comparable methodology is applied at the rock core scale. Anisotropy measurements conducted on core samples indicate that the velocity parameters Vp, Vs, and the Vp/ Vs ratio do not exhibit a meaningful correlation with sand-volume ratio. In contrast, the anisotropy parameters δ and γ demonstrate a clear relationship with sand-volume ratio (Sari, 2018).
Kendall et al. (2007) performed a petrofabric analysis utilising laboratory measurements of ultrasonic velocities in core samples obtained from sandstone reservoirs, correlating these results with field-scale seismic anisotropy observations. Their findings suggest that seismic anisotropy is primarily governed by the intrinsic structural fabric of the rock. Specifically, rock anisotropy is influenced by the crystal-preferred orientation (CPO) of mica minerals, as well as the alignment of feldspar and quartz grains. The sub-horizontal alignment of mica minerals exerts the greatest influence on the development of CPO-induced anisotropy. In samples with elevated mica content, microcracks and intergranular features are frequently observed to align parallel to mica cleavage planes. These intergranular structures further amplify the CPO-related anisotropy associated with mica. Consequently, seismic anisotropy may serve as a proxy for evaluating reservoir quality.
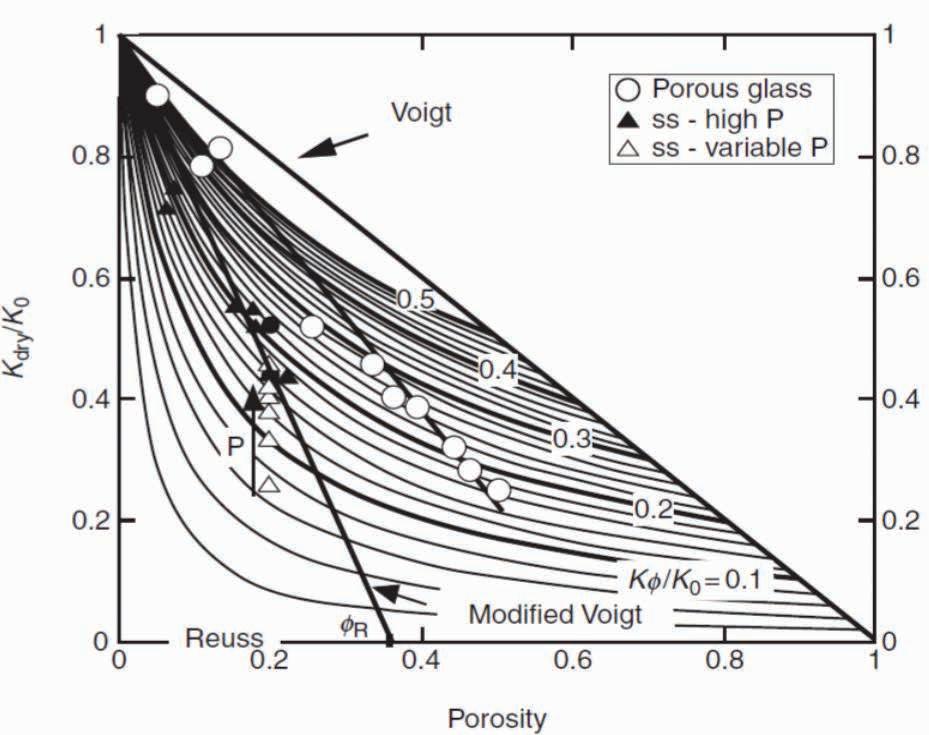
An analytical anisotropy model was developed using two primary data sources: rock core samples and well log measurements, both acquired from sandstone reservoir formations exhibiting varying sand-volume ratios. Anisotropy parameters were subsequently evaluated in relation to key reservoir quality indicators, including lithology, grain size, porosity, and permeability, to identify the parameter most sensitive to variations in reservoir quality. Given the availability of data across both core and log measurement scales, a scaling factor analysis is undertaken to assess the systematic differences and trend variations in anisotropy between these two data domains.
The primary objective of this study is to examine the relationship between seismic anisotropy parameters and reservoir quality indicators through the integration of rock core sample data and well log data. This objective is addressed through several key components, including: (1) evaluating the correlations between anisotropy parameters (ε, δ, γ) and elastic properties derived from ultrasonic velocity measurements on core samples; (2) performing analogous analyses using anisotropy parameters calculated from dipole sonic log data; and (3) assessing the relationships between these parameters and key reservoir quality attributes, such as lithology, grain size, porosity, and permeability. The study aims aim to support the development of an analytical framework for identifying reservoir quality in formations composed of interbedded sandstone and shale sequences.
Zimmerman’s pore modelling
The dry-rock compressibility at constant pore pressure, Kdry-1, as (Walsh, 1965; Zimmerman, 1991)
where,
is the effective dry-rock pore-space compressibility, defined as the ratio of the fractional change in pore volume, vp, to an increment of applied external hydrostatic stress, σ, at constant pore pressure. This is related to another pore compressibility,
which is the ratio of the fractional change in pore volume to an increment of applied pore pressure, at constant confining pressure, also expressed by (Zimmerman,1991)
Figure 1 shows a plot of normalised dry bulk modulus, Kdry/ K0, versus porosity, computed for various values of normalised pore-space stiffness, Kϕ/K0
Critical porosity model
Nur et al. (1995) proposed that the velocity of P- and S-waves traveling through a rock is related to the mineral grains at the minimum
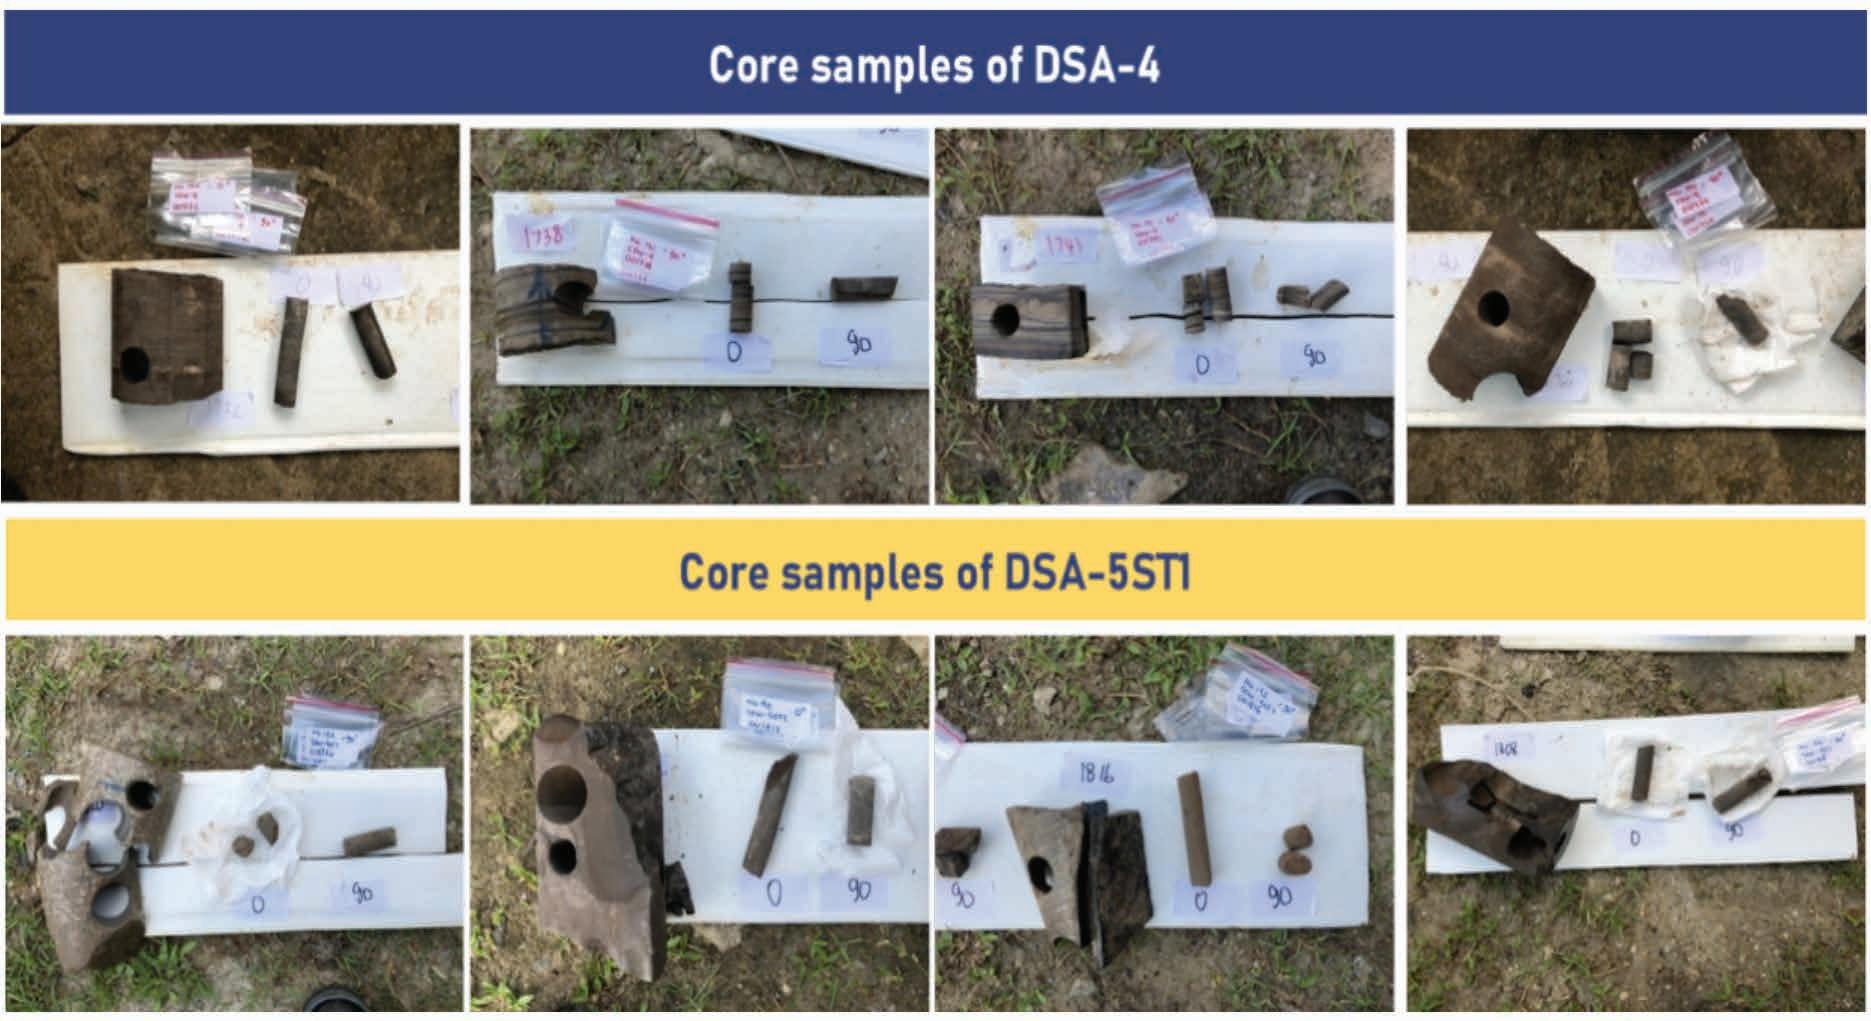
porosity limit and to the pore-fluid suspension at the maximum porosity limit. This idea is based on observations indicating that porous materials exhibit a critical porosity threshold, which separates mechanical and acoustic properties into two distinct domains.
For rocks with porosity below the critical porosity, mineral grains are in a load-bearing sediment state. When porosity exceeds the critical porosity, the rock transitions into a suspension phase, or fluid phase, from a load-bearing sediment state. The higher the critical porosity value of a rock, the greater its capacity to maintain high porosity.
For dry rocks, the bulk and shear moduli can be expressed as the linear functions,
Owen, 2005). The move-out velocity VNMO and the an-elliptical parameter Eta (η) are formulated as follows:
where K0 and µ0 are the mineral bulk and shear moduli, respectively. Thus, the dry rock bulk and shear moduli trend linearly between K0, µ0 at ϕ = 0 and Kdry = µdry = 0 at ϕ = ϕc
VNMO and seismic anisotropy Eta (η)
The VNMO and seismic anisotropy Eta (η) parameters, which are widely used in the time domain seismic data processing step, are obtained from the non-hyperbolic moveout process. The Alkhalifah and Tsvankin (1995) non-hyperbolic moveout equation has been widely adopted to estimate VNMO parameters and seismic anisotropy Eta (η) in layered VTI media and to construct anisotropic interval velocity models (Alkhalifah, 1997; Grechka and Tsvankin, 1998; Alkhalifah and Rampton, 2001; Tsvankin, 2005).
In laterally homogeneous media, the P-wave seismic travel time reaching the reflector depends only on two combinations of parameters, which are the move-out velocity VNMO and the an-elliptical parameter Eta (η) (Alkhalifah and Tsvankin, 1995; Xu and
The seismic anisotropy Eta (η) as a component of the NMO equation (Alkhalifah and Tsvankin, 1995) is required to correct for long-offset and VTI effects in seismic data. Both of these effects are corrected through the same Eta (η) parameter, making it difficult to determine whether a seismic dataset is VTI simply because the data requires effective seismic anisotropy Eta (ηeff) in the NMO process. When seismic data is isotropic or there is no VTI occurrence, the effective seismic anisotropy parameter Eta (η) is still required to correct for the long-offset effect (Alkhalifah, 1997).
Compensating for errors associated with the Taylor series simplification in non-hyperbolic NMO and errors due to VTI, Alkhalifah and Tsvankin (1995) proposed an alternative simplification of the 4th order Taylor series as follows:
The primary dataset comprises ultrasonic velocity measurements from rock core samples alongside well log data acquired from wells DSA-4 and DSA-5ST1, utilised to calculate anisotropy parameters (ε, δ, γ). Reservoir quality characterisation incorporates petrographic analysis in addition to measurements of porosity, bulk density, and permeability derived from the core samples. The study area is in the Sadewa Field (operated by Pertamina Hulu Kalimantan Timur), located approximately 5 km
from the shelf edge offshore in the Kutai Basin, with water depths ranging between approximately 1500 and 2500 ft (Thompson et al. 2009). The details of the collected core samples are as follows:
• DSA-4: MD 10644 – 10803 ft
Total samples: 15
• DSA-5ST1: MD 13601 – 13706 ft
Total samples: 10
Figure 3(a) illustrates the conventional approach to measuring anisotropy using three core plugs oriented at vertical, 45°, and horizontal angles relative to the axis of anisotropic symmetry. However, this methodology presents challenges when applied to fragile or fractured core samples (Wang, 2002a). To address these limitations, Wang (2002a) proposed an alternative anisotropy measurement technique utilising a single core plug, as depicted in Figure 3(b).
In this method, P-wave velocities Vp0, Vp45, and Vp90 are measured, corresponding to wave propagation directions parallel, at 45°, and perpendicular to the anisotropy symmetry axis, respectively. Additionally, S-wave velocities Vs1,90 and Vs2,90 are obtained, representing shear waves polarised parallel and perpendicular to the symmetry axis. Given that the anisotropy symmetry axis is oriented perpendicular to the bedding plane, Vp0, Vp45, and Vp90 correspond to P-wave velocities propagating perpendicular to, at 45°, and parallel to the bedding plane, respectively (Wang, 2002a).
P-wave (Vp) and S-wave (Vs) velocities of rock core samples were measured using ultrasonic transducers operating at a fre-
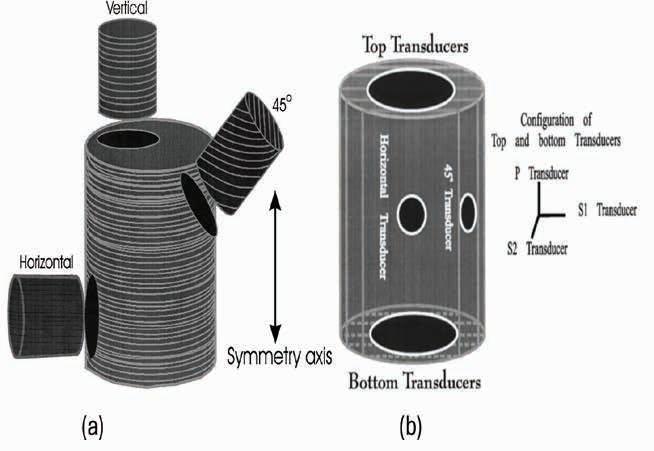
quency of 1 MHz (Figure 4) under ambient atmospheric pressure and temperature conditions. Anisotropy measurements followed the methodology proposed by Wang (2002a), employing a single core plug approach. Each sample was measured in triplicate to ensure reproducibility and accuracy in delay time picking, which is critical for precise velocity determination. An example of the delay time picking process for both P- and S-wave measurements is illustrated in Figure 5.
Reservoir property characterisation included petrographic analysis performed at the Petrology Laboratory of Geology Engineering ITB. This analysis focused on compositional components (grains, matrix, cement), texture, fabric, micro-layering, and sedimentary rock classification. The results indicated that the predominant lithology in the samples is greywacke sandstone, characterised by poor-to-moderate sorting, subrounded to subangular grain shapes, parallel bedding structures, and intergranular porosity. Porosity and permeability measurements were conducted at LEMIGAS using a Coreval 700 instrument, employing helium gas injection techniques to quantify porosity and permeability of the core samples.
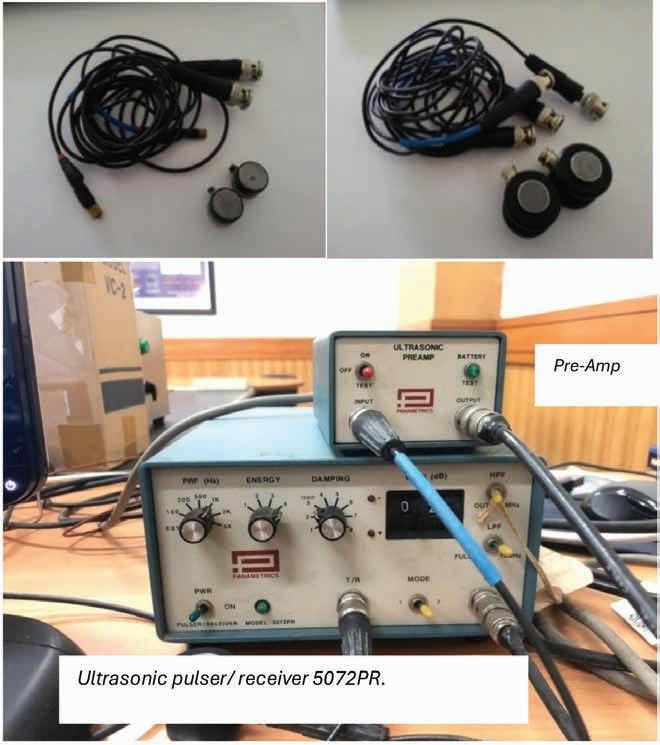
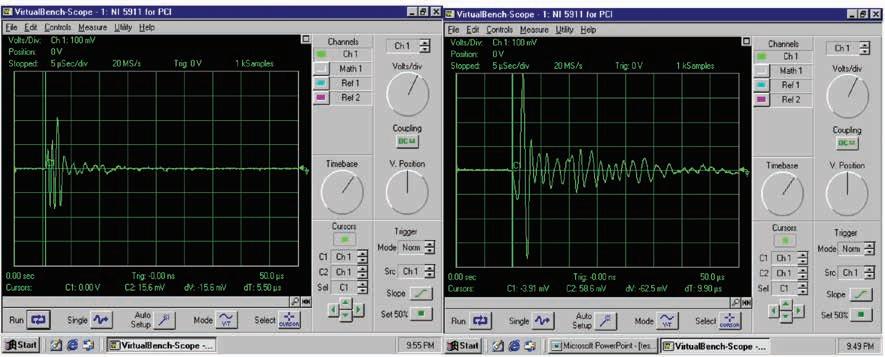
Figure 5 Delay time picking of P-Wave example (DSA2 CICO-002549) and S-wave for sample (DSA-5ST1 CICO-001786).
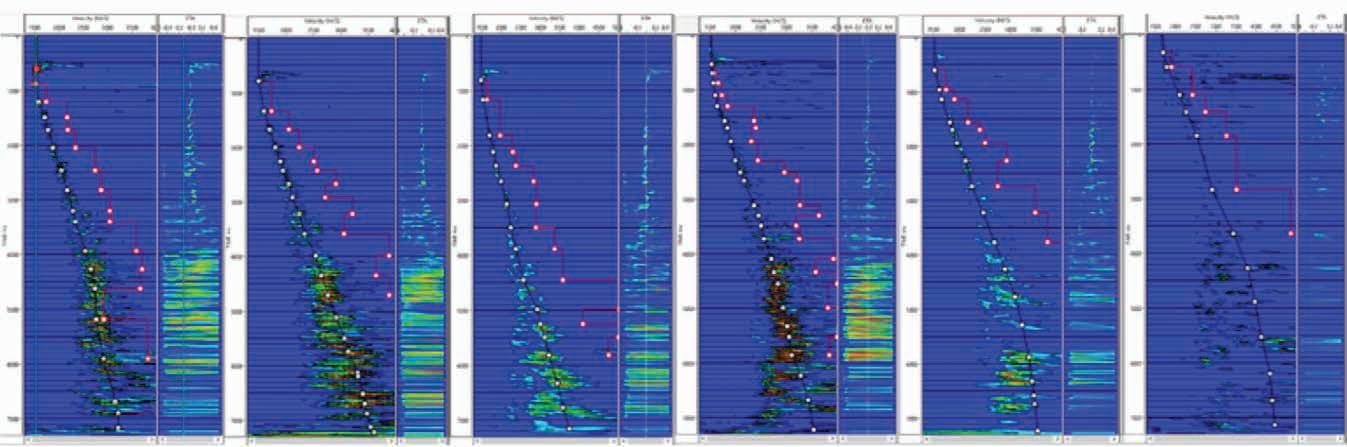
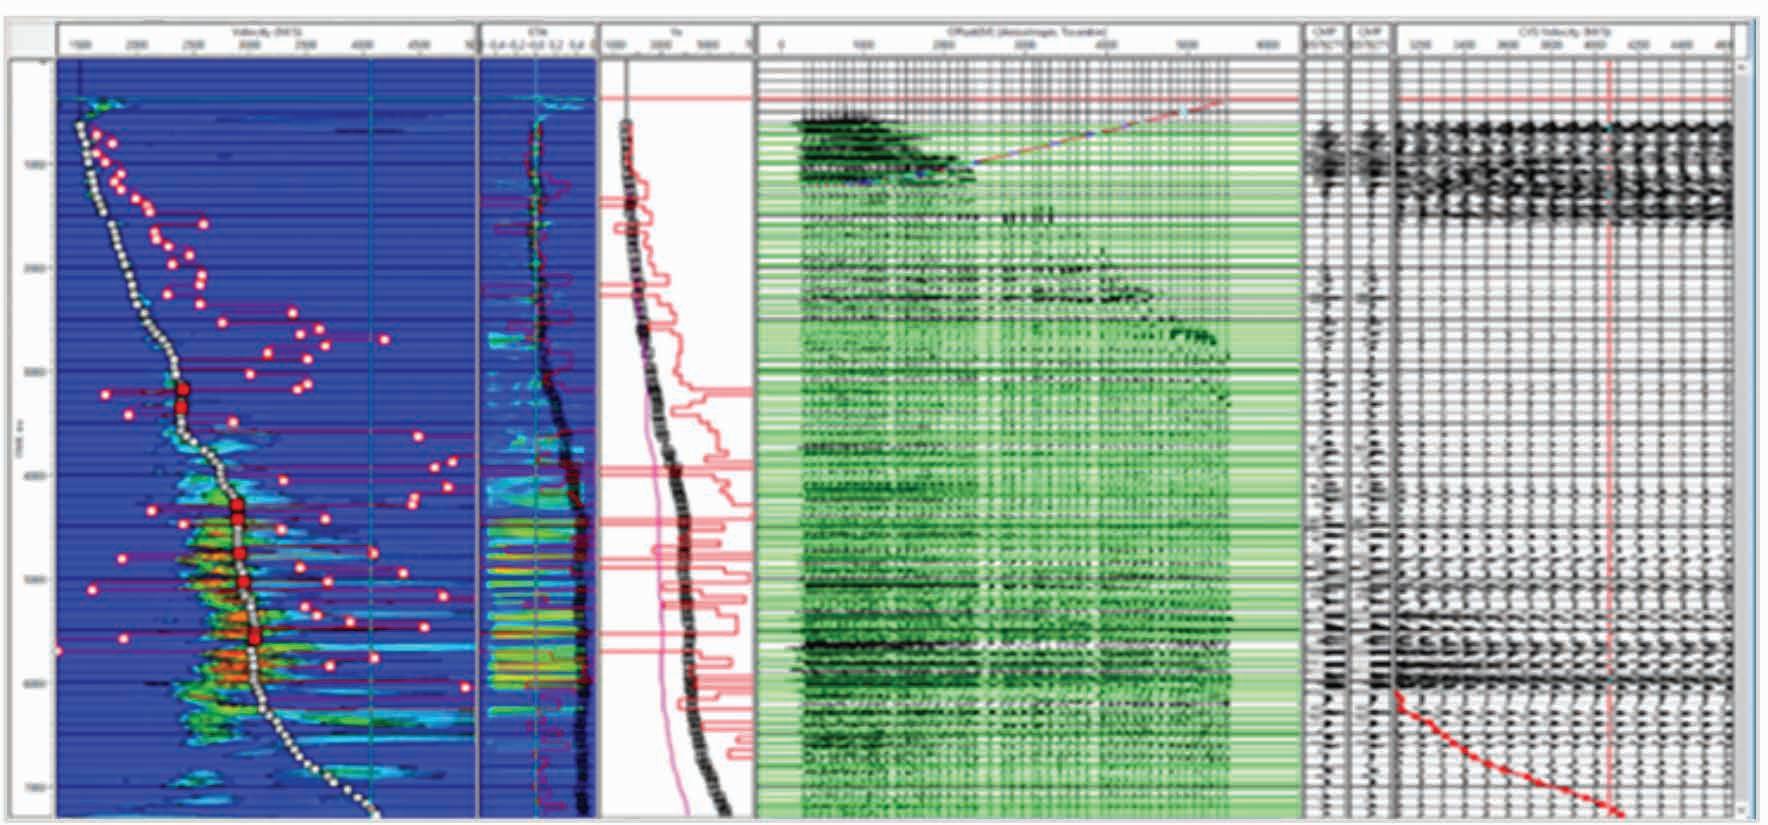
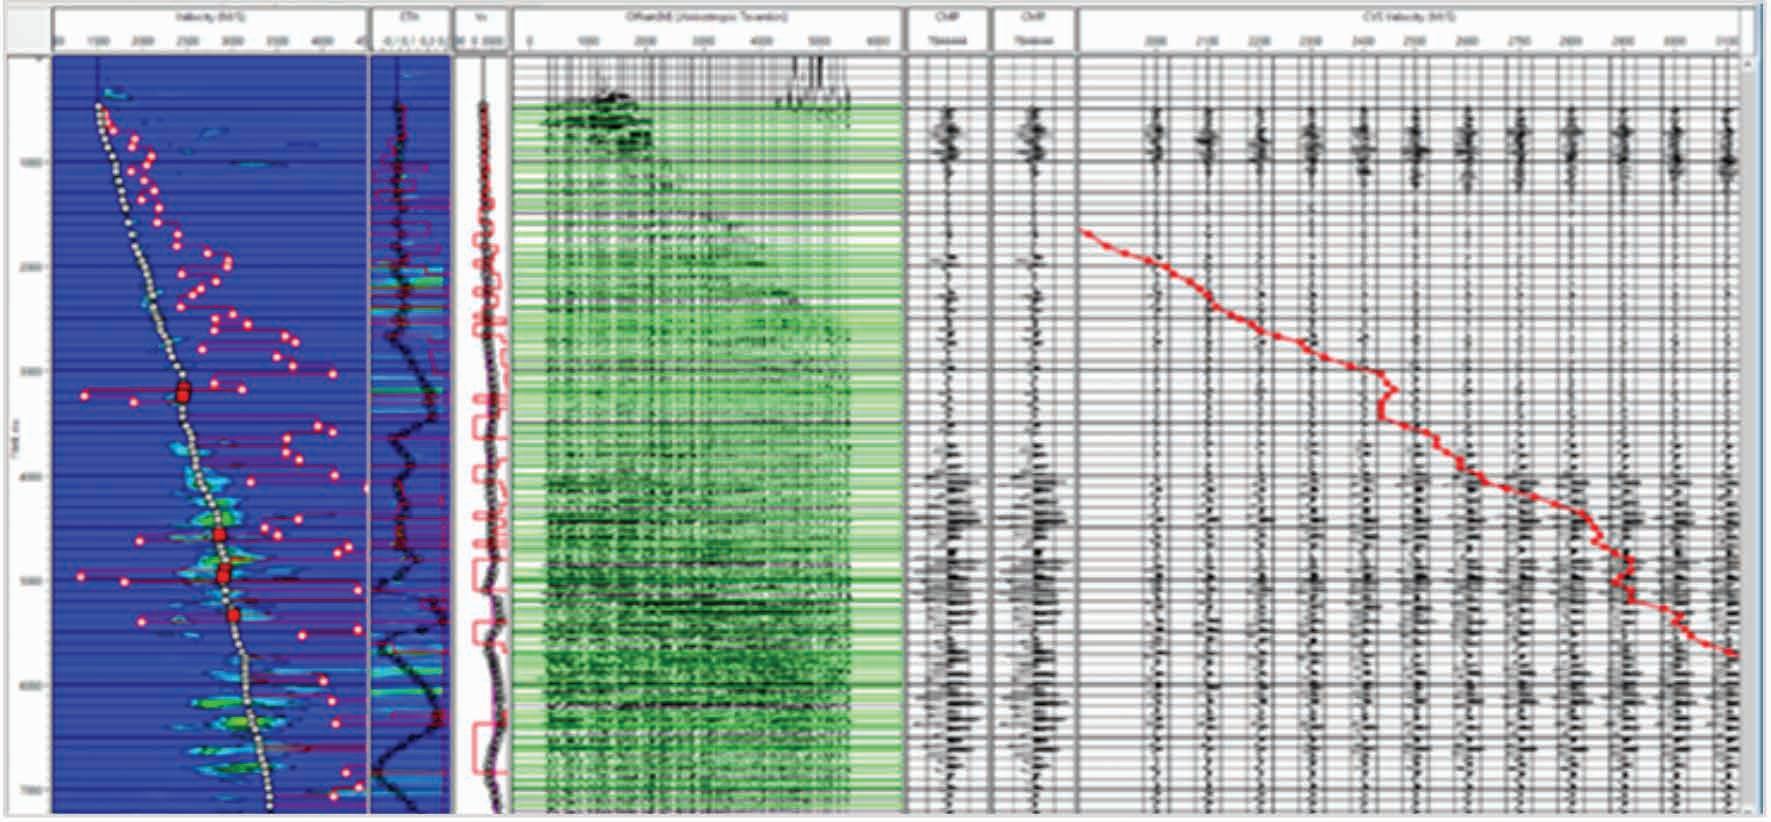
Anisotropic velocity analysis
This study calculates the Thomsen’s anisotropy parameters Epsilon and Delta from both core data and well log data measurements. The Eta anisotropy parameter connects the anisotropy observed in the three data sets, namely core, log, and seismic. The seismic anisotropy Eta (η) is then derived from the Thomsen’s anisotropy parameters Epsilon (ε) and Delta (δ) using simplified NMO equation by Alkhalifah and Tsvankin (1995) obtained from V0 and V90 of core and log data measurement. The value of seismic anisotropy Eta (η) will be compared to the value obtained from the 4th order NMO as a result of anisotropic velocity analysis during seismic data processing.
Anisotropic velocity analysis is performed on HPSTDM seismic gather data from the Sadewa Field. This process was analysed on full offset seismic data to obtain the seismic anisotropy parameter Eta (η). Anisotropic velocity analysis is conducted at the CDP gather seismic data near the DSA-4 and DSA-5ST well location (Figure 6).
Anisotropic velocity analysis was conducted in a secondary iteration, continuing from the first iteration that had just started picking the general trend. The secondary iteration had a denser
vertical grid compared to the first iteration. The delta time used for velocity sampling during semblance picking affected the vertical resolution of the resulting Effective Eta (ηeff). Therefore, an attempt was made to increase the density to 25 ms, whereas previously it was sampled in interval of 300-500 ms. With increased sampling, it is expected that comparison and integration with other data, such as core and log data, can be more apples to apples, and the trend of the Effective Eta (ηeff) can be more visible (Figure 7-8).
Anisotropy parameters relationship with reservoir attributes
Anisotropy parameters (γ, ε, δ) were analysed in relation to reservoir quality indicators derived from petrographic analysis— specifically clay content, quartz content, grain size and porosity. Crossplot analyses of anisotropy parameters versus reservoir attributes (Figure 9) reveal trend separations consistent with those observed in the anisotropy analysis of well log data (Figure 10). The boundaries defining high-quality samples (denoted by dashed green and purple circles) correspond to clay content < 40%, quartz content > 50%, and grain size > 0.15 mm.
Figure 10 illustrates crossplots of anisotropy parameters Gamma (γ) and Epsilon (ε) versus Gamma Ray (GR) values
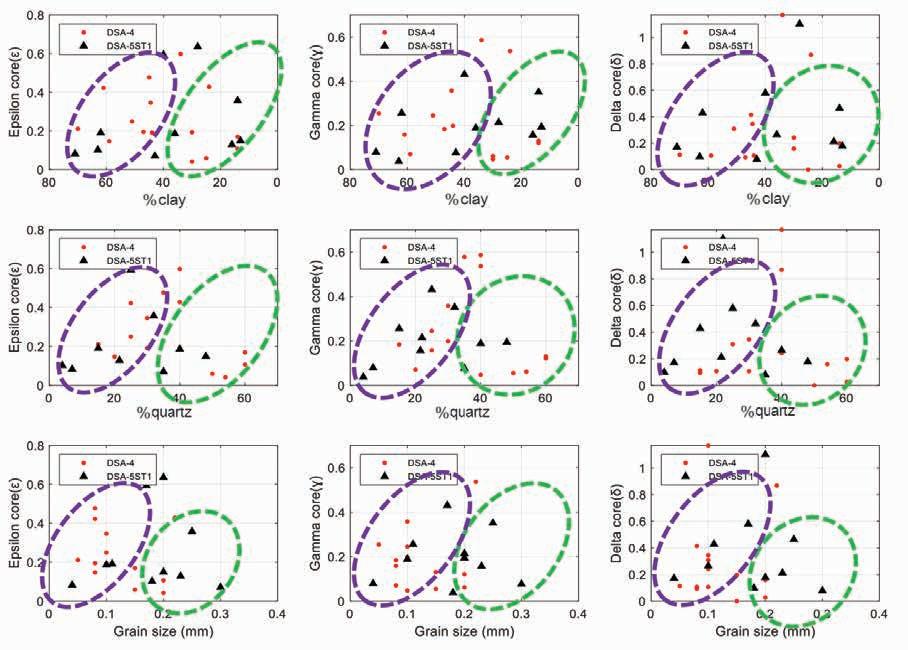
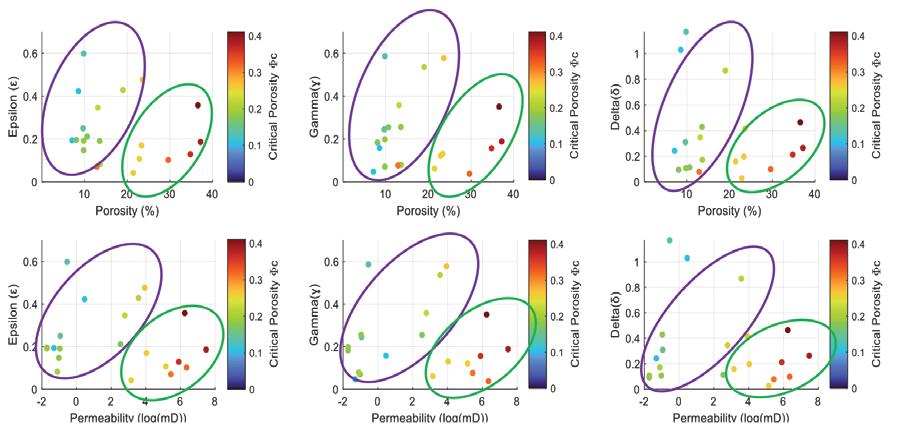
Figure 9 Crossplot of Anisotropy Parameters Gamma (γ), Epsilon (ε), Delta (δ) to Clay Content, Quartz Content, and Grain Size in Core Sample Data from Wells DSA-4 and DSA-5ST1.
Figure 10 Anisotropy cross plot of Gamma (γ) and Epsilon (ε) to Gamma Ray and Volume of Shale from log data with wider zone from core sample interval of (a) DSA-4 well and (b) DSA-5ST1 well.
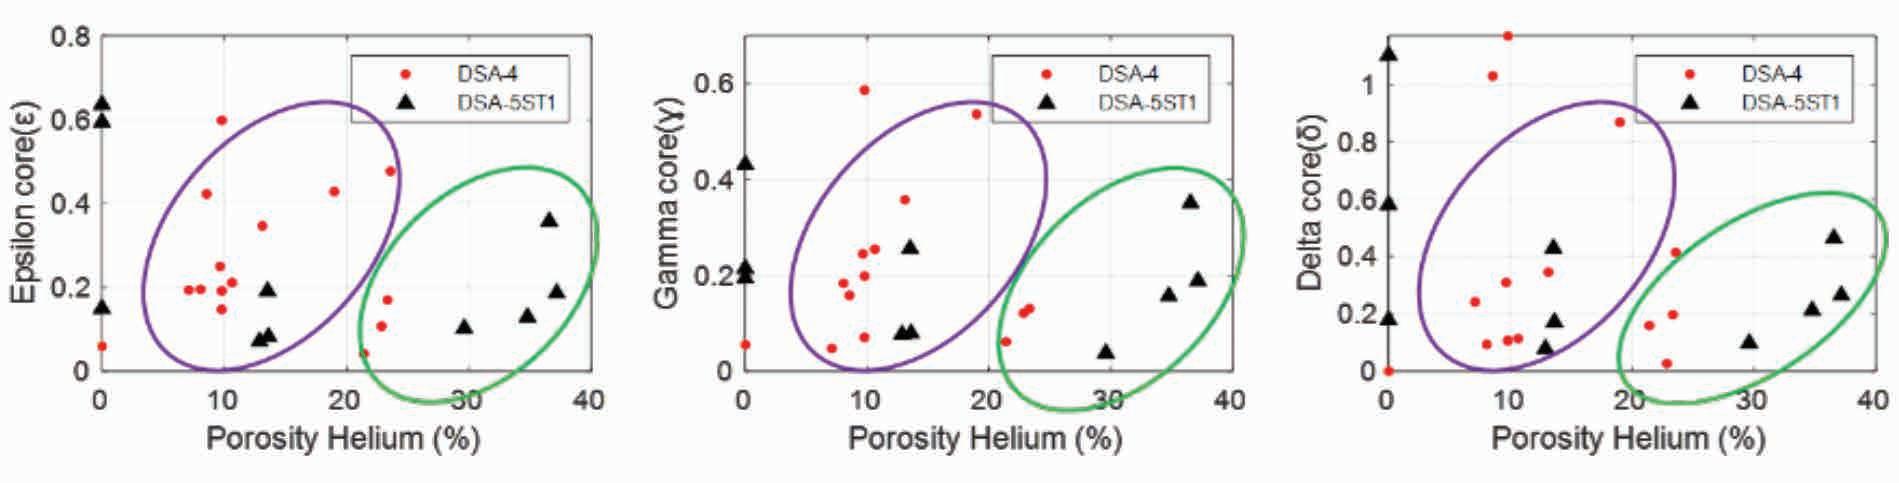
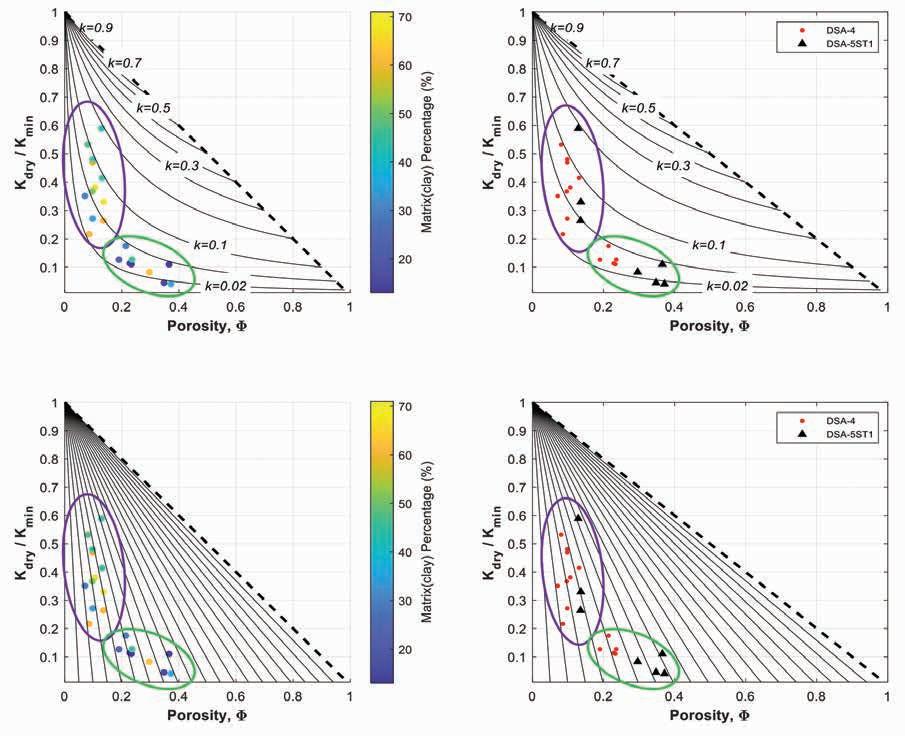
across core intervals from wells DSA-5ST1 and DSA-4. The data reveal clear separation of high-quality reservoir samples at distinct GR cut-off thresholds of 60 API for DSA-5ST1 and 80 API for DSA-4. These cut-offs effectively discriminate between clayrich and cleaner sandstone intervals, consistent with petrographic observations. Core sample positions are indicated by red dots in Figure 10(a) and black triangles in Figure 10(b), facilitating direct correlation between anisotropy measurements and lithological
Table 1 Summary of reservoir quality parameter cut-off values for rock types A and B.
Figure 12 Pore type and critical porosity analysis using Zimmerman Model (Upper) and Nur Critical Porosity Model (Lower), green circle classified as RT-A, purple circle as RT-B.
variations. Figure 11 presents crossplots of anisotropy parameters (ε, γ, δ) with porosity derived from porosity measurements. These crossplots exhibit clearer separation between these groups, with a porosity threshold of > 0.228 demarcating the high-quality reservoir samples (green circle).
Core sample analysis using the Zimmerman (1991) and Nur et al. (1995) models
Figure 12 (upper) displays the pore aspect ratio modelling results based on the Zimmerman model. The black curved lines represent constant pore aspect ratios (k), illustrating the geometric influence of pore shape on porosity and elastic properties. This model shows pore structure heterogeneity within the reservoir samples. Figure 12 (lower) shows the results from the Nur critical porosity model. The black straight lines indicate critical porosity thresholds that distinguish porous rock behaviour, marking the transition between porous and non-porous regimes.
Core samples are plotted as circles, colour-coded according to clay content (left subpanel), facilitating visual correlation between mineralogy and porosity which sample with high critical porosity representing low matrix clay percentage. The right subpanel identi-
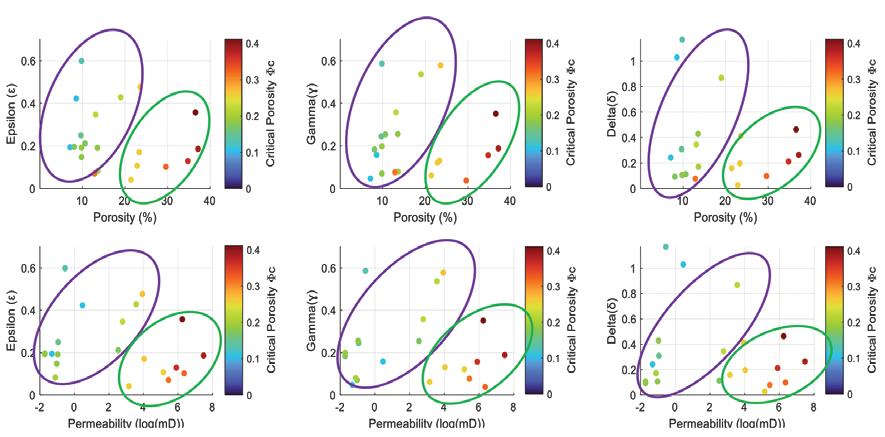
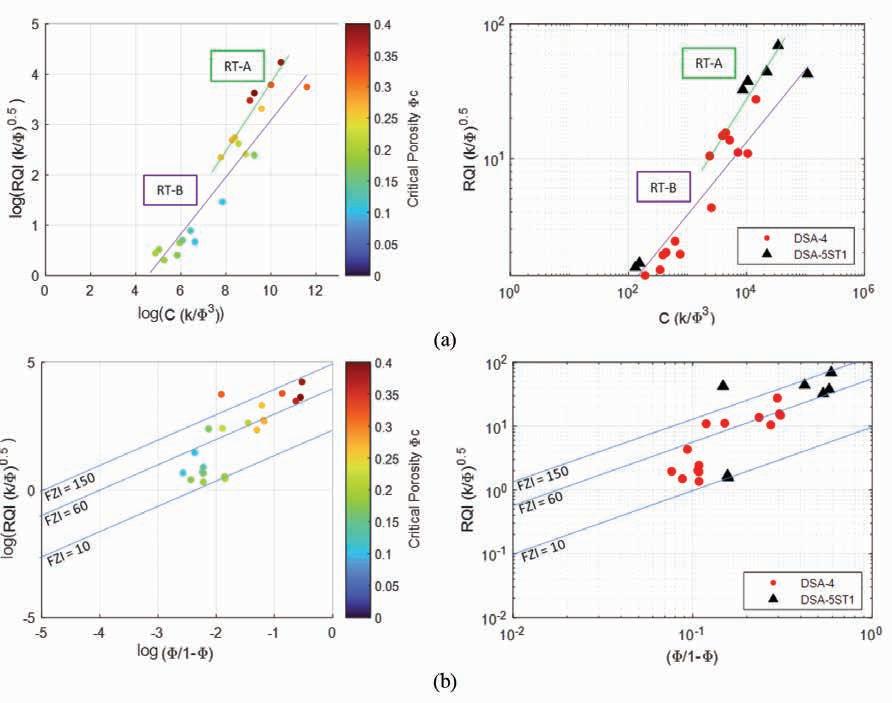
fies sample provenance, with red circles corresponding to samples from well DSA-4 and black triangles from well DSA-5ST1.
Together, these figures demonstrate that both RT-A and RT-B sample groups adhere more closely to the critical porosity model than to the pore aspect ratio model. RT-A samples predominantly possess critical porosity values exceeding 0.257, indicative of higher reservoir quality, whereas RT-B samples generally exhibit critical porosity values below this threshold, corresponding to lower-quality reservoir intervals.
The critical porosity values derived from the Nur model were employed as a colour key in the crossplot of anisotropy parameters versus porosity and permeability (Figure 13). This crossplot confirms that the distinction between RT-A and RT-B corresponds to critical porosity values, reinforcing critical porosity as a robust indicator for reservoir quality classification. The established cutoff values for RT-A and RT-B, derived from integrated reservoir quality parameters, are summarised in Table 1.
Anisotropy parameter and reservoir quality analysis based on RQI and FZI
Figure 14(a) illustrates the segregation of Rock Type A (RT-A) and Rock Type B (RT-B) clusters based on trend differentiation derived from Reservoir Quality Index (RQI) and Flow Zone Indicator (FZI)
13 Anisotropy parameter crossplot to porosity and permeability on core sample data with critical porosity as color key (green circle (RT-A), circle (RT-B).
Figure 14 (a) RQI crossplot based on Permadi and Kurnia (2011) with critical porosity as colour key (left) and well name (right). (b) Crossplot FZI based on Amaefule (1993) with critical porosity as colour key (left) and well name (right).
analyses. The RQI-based reservoir quality assessment reveals that RT-A exhibits a steeper gradient relative to RT-B, characterised by a predominance of higher critical porosity values within RT-A samples, whereas RT-B samples are dominated by lower critical porosity values. Correspondingly, the FZI analysis (Figure 14(b)) demonstrates that RT-A samples span an FZI range of 60 to 150, while RT-B samples display a reduced range between 10 and 60.
Petrographic analysis result
Porosity and permeability measurements demonstrate significant variability in reservoir quality across the studied intervals. In the DSA-4 samples, reservoir properties exhibit a wide range, with porosity values ranging from 7–24% and permeability ranging from 1 to 170 mD. The high-quality sandstone interval, identified between depths of 10,645 and 10,672 ft, is characterised by porosity values of 20-24% and permeability values between 35 and 170 mD. For DSA-5ST1 samples displays generally superior reservoir quality, with porosity ranging from 13 to 35% and permeability varying from 1 to 1800 mD. Notably, a thick sandstone interval at depths of 13,600 to 13,670 ft exhibits the highest porosity (25-35%) and permeability (350-1800 mD).
These observations are consistent with the petrographic data from DSA-5ST1 samples, which generally show larger
grain sizes, higher porosity, and increased permeability relative to DSA-4 samples. Variations in porosity and permeability are attributed primarily to differential compaction effects, particularly evident in DSA-5ST1 samples below 13,680 ft, where increased organic matter content influences diagenetic processes (Chevron, 2006).
Figure 15 illustrates sample from the high-quality rock cluster (Rock Type A, RT-A). Plane-polarised light (PPL) and cross-polarised light (XPL) photomicrographs reveal the presence of intercalated siltstone lenses (brown-coloured regions at the upper-right and lower-left corners in Figure 13(a)) and the presence hydrocarbon interlayers. This specimen is characterised by a greywacke matrix supporting intercalated siltstone lenses composed predominantly of detrital monocrystalline quartz and muscovite grains.
Figure 16 presents a representative sample from the lower-quality rock cluster (Rock Type B, RT-B). The PPL and XPL images classify this sample as greywacke with a closed-fabric
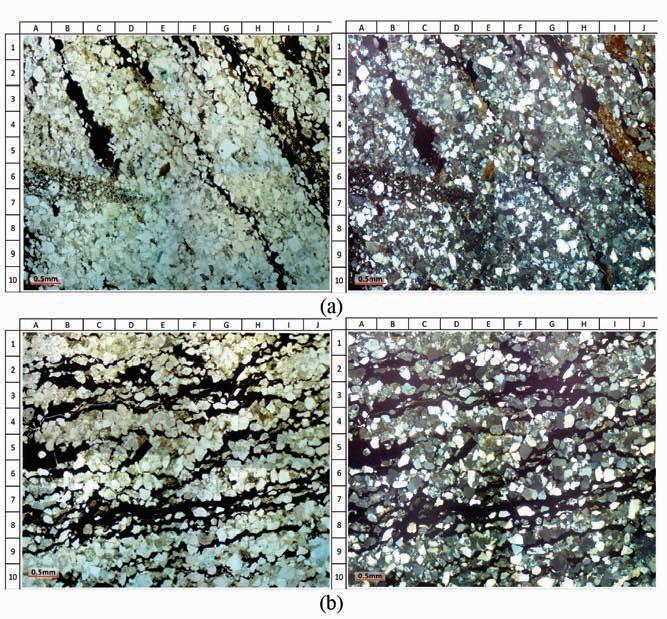
Figure 15 (a) PPL image (left) of sample DSA-5 STI 001786; XPL image (right) of sample DSA-5 STI 001786. The sample is classified as greywacke with intercalation of siltstone lenses (brown in colour, located at the top-right and bottom-left corners of the image). This sample represents part of RT-A. (b) PPL image (left) of sample DSA-5 STI 001800; XPL image (right) of sample DSA-5 STI 001800.
texture, comprising quartz, lithic fragments, feldspar, muscovite, plagioclase, opaque minerals, and biotite embedded within a clay matrix exhibiting recrystallised mica and chlorite alteration products.
Petrographic analysis reveals that the mineral assemblages present in both rock types—including plagioclase, feldspar, chlorite, illitisation of smectite, albitisation, and anhydrite cementation — are indicative of mesodiagenetic or burial diagenetic processes. These processes typically occur in sediments deposited at depths exceeding 2000 m or subjected to temperatures above 60-70°C (Choquette and Pray, 1970; Morad et al. 2000; Worden and Burley, 2003). The predominance of organic material in Rock Type A (RT-A) samples likely facilitated the development of hydrocarbon interlayers (Figure 15). This is consistent with the depositional depth of approximately 13,600 ft (~4150 m), where petroleum generation generally initiates at temperatures
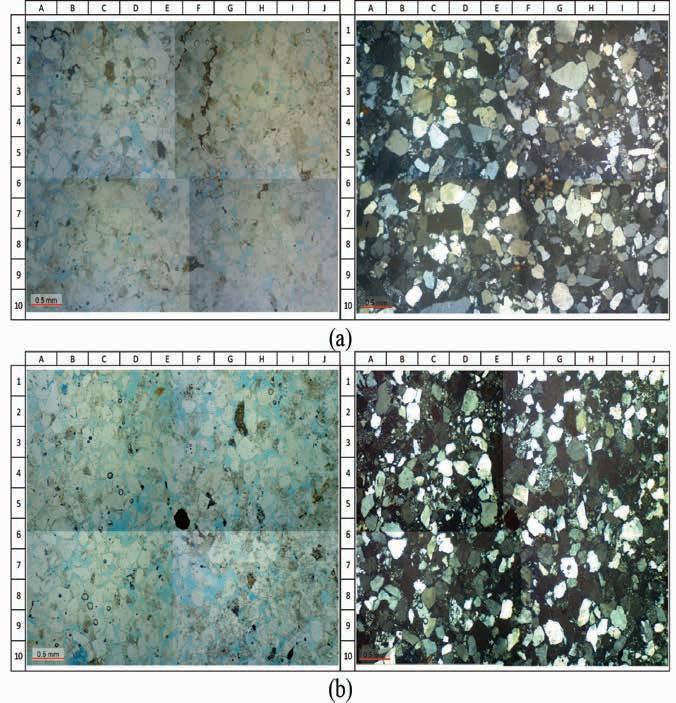
Table 2 Petrography result for sample on Figure 15 (a).
1 DSA5ST1 001786
2 DSA5ST1 001789
3 DSA5ST1 001796
4 DSA5ST1 001800
5 DSA5ST1 001808
Table 3 Petrography result for sample on Figure 15 (b).
*Data is taken from the nearest core sample from CICO-1786, as the original sample is broken on the trimming process Table 4 Anisotropy values summary and reservoir parameter for sample RT-A and RT-B.
exceeding 50°C (around 1200 m depth) and terminates near 180°C (approximately 5200 m depth).
Figure 17 presents a crossplot of anisotropy parameters versus depth for the DSA-4 and DSA-5ST1 core samples. A general trend is observed wherein high-quality samples exhibit elevated anisotropy parameters. However, several data points deviate from this trend. The transition depths demarcating high and low anisotropy trends are approximately 10,720 ft for DSA-4 and 13,660 ft for DSA-5ST1.
To investigate the cause of these deviations, petrographic analyses were conducted on the relevant samples, as detailed in Tables 2 and 3. These specific samples — highlighted in red in Figure 17 — reveal that the dominant factor controlling anisotropy magnitude is the presence of hydrocarbon-bearing interlayer porosity. This feature is associated with increased anisotropy values, suggesting that pore-scale fluid distribution significantly influences the elastic anisotropy observed in these samples.
Samples CICO1744 and CICO1748 from well DSA-4, exhibit elevated seismic anisotropy values characterised by the presence of hydrocarbon-bearing interlayers. In contrast, samples
CICO1760 and CICO1764 demonstrate lower anisotropy trends, with pore systems dominated by intergranular porosity and associated with structural features such as fractures and lithological intercalations but notably lack hydrocarbon-bearing interlayers (Table 2).
Comparable characteristics were observed in samples from well DSA-5ST1. Samples CICO1786, CICO1789, and CICO1800 exhibit elevated anisotropy values concomitant with the dominance of hydrocarbon interlayers. Conversely, samples CICO1796 and CICO1808 display low anisotropy values, associated primarily with intergranular porosity (Table 3). These observations suggest that the presence of hydrocarbon interlayers correlates with increased anisotropy, attributable to the layered distribution of hydrocarbons.
Petrographic analysis indicates the presence of hydrocarbon interlayers within RT-A samples compared to RT-B. The occurrence of these interlayers contributes to elevated anisotropy values, particularly in samples exhibiting high porosity and permeability. These findings are consistent with Kendall’s (2007) observations that microcracks developing along cleavage planes of mica grains significantly enhance anisotropy and serve
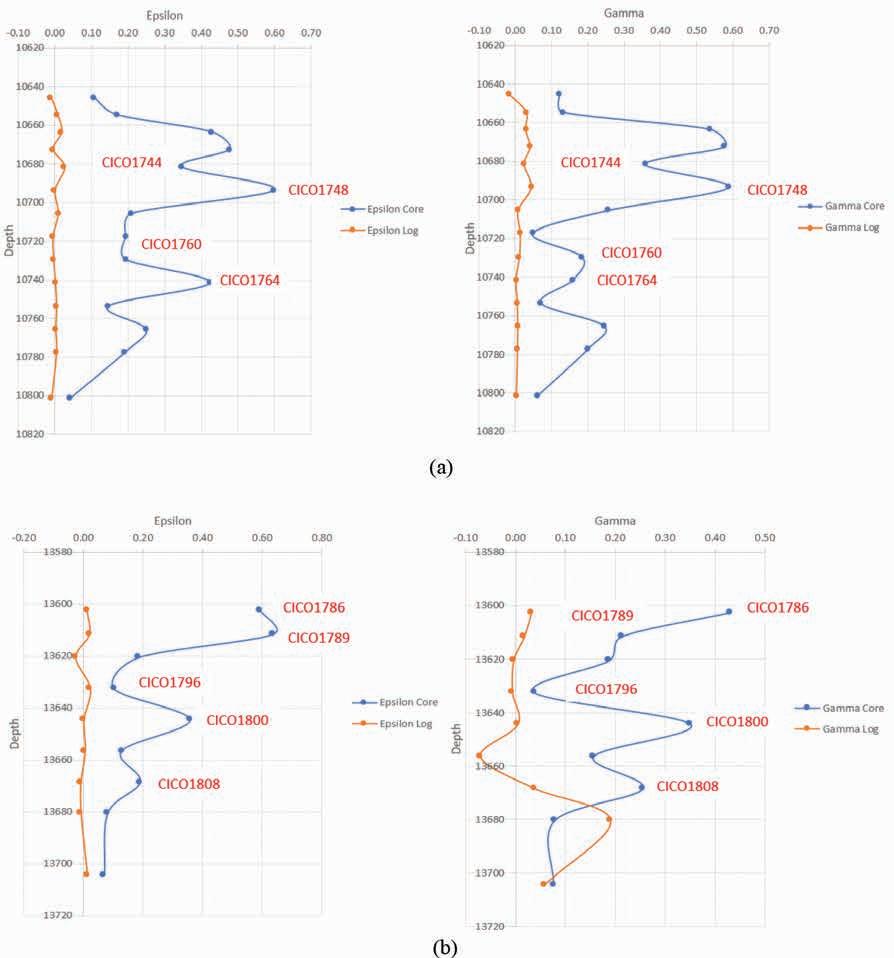
as indicators of reservoir quality. In this study, the alignment of hydrocarbon interlayers parallel to the bedding planes is identified as the primary factor driving increased anisotropy values.
Table 4 summarised anisotropy parameters and reservoir characteristics for RT-A and RT-B samples, as depicted in Figures 13 and 14. RT-A samples (CICO1786 and CICO1800) exhibit significantly higher anisotropy values (ε = 0.48, γ = 0.38, δ = 0.52) alongside enhanced porosity and permeability (ϕ = 36.8%, K_he = 1141.9 mD). Petrographic analysis confirms the presence of hydrocarbon interlayers within these samples contributes to the elevated anisotropy. In contrast, RT-B samples (CICO1732 and CICO1735) show lower anisotropy (ε = 0.14, γ = 0.13, δ = 0.03) with correspondingly reduced porosity and permeability (ϕ = 23.1%, K_he = 114.68 mD). These samples are characterised by intergranular pore structures, consistent with the observed lower anisotropy values. These observations indicate that hydrocarbon interlayers play a critical role in amplifying anisotropy, which correlates with improved reservoir properties such as porosity and permeability.
Comparison of the seismic anisotropyparameter Eta (η) from core, log, and seismic data
Comparison of anisotropy Eta value is conducted from the core data, log data, and result of anisotropic seismic data processing. To be noted, the different acquisition nature of these three data types might be kept in mind first before comparison is made. Core data has resolution within mega-
Figure 17 Anisotropy parameter crossplot (ε and γ) to depth for core sample data (blue curve) and well log data (orange curve) for (a) DSA-4 (b) DSA-5ST1.
hertz (Mhz) scale, followed by log data with kilohertz (Khz) scale, and lastly, seismic within hertz (Hz) scale. It is to be expected that the resolution will decline as the frequency decreases.
In inclined wells, wireline logging acquisition is conducted by following the inclination of the well path. The Sadewa Field area is known to have a slope margin structure with a relatively flat structure, so that the inclination of the well will cut through the deposited rock layers. Most wells in the Sadewa Field area are inclined wells with gentle-to-extreme inclinations. The inclination of the well path will affect the V0 and V90 velocity readings, which in turn could potentially cause errors in the reduction of anisotropy parameter values. Compensation for well inclination against the observed velocity values on the sonic and shear sonic logs is necessary, given that anisotropy values are very sensitive to changes in the V0 and V90 velocity readings from the input data. Oktariena et al. (2023) formulated a method for verticalising Sonic logs by utilising V0 and V90 information from the advanced processing of DSI log data at the Sadewa Field. After inclination compensation, the AVO response from the forward modelling results was closer to the AVO response from the original seismic data. This too influences how anisotropy in log or core data is differs from the anisotropy recorded in seismic data.
The observation window follows the availability of core data, which is about 100-200 ft thick. These windows are only roughly covered by ¾ to 3/2 λ of seismic trace. It is a very small window compared to the seismic record length, which is 8000 ms.
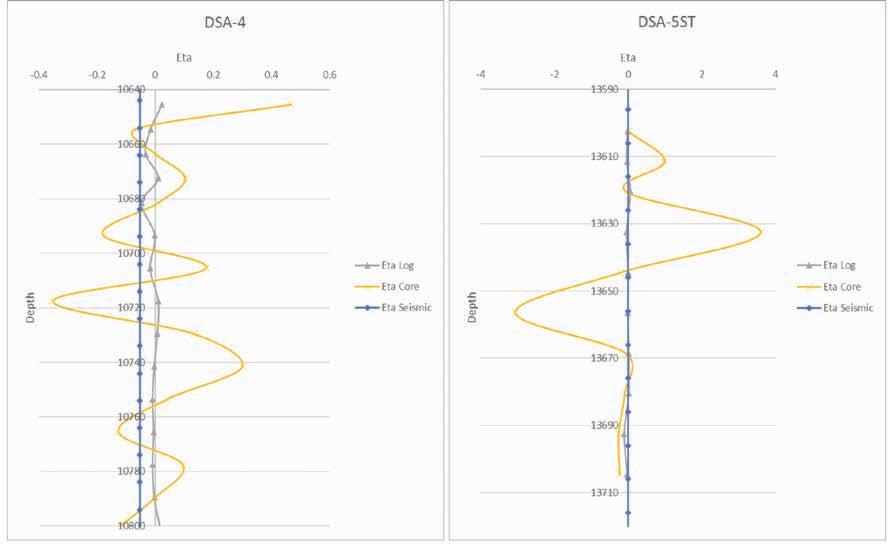
Figure 18 Comparison of Eta Value from Core (yellow line), Log (grey line), and Seismic (blue line). In general, Eta from Core Data has the highest resolution and magnitude followed by Eta from Log Data and Eta from Seismic Data Processing.
anisotropy Eta value range in DSA-4 compared to DSA-5ST. This result is also mirrored by the average Eta value showing all data of DSA-4 is lower than DSA-5ST. This result means that the Eta calculation from core and log data are reflected in the Eta observed from anisotropic seismic data analysis.
Table 5 The magnitude range of Eta as calculated from core measurement, Dipole Sonic Log calculation, and anisotropic seismic data processing.
Table 6 The average value of Eta as calculated from core measurement, Dipole Sonic Log calculation, and anisotropic seismic data processing.
In general, Eta from core data has the highest resolution and magnitude followed by Eta from log data and Eta from seismic data processing. The Eta trend from log and seismic data closely related to one another showing a minimal variance of value within the observation zone. Whereas the Eta parameter from core data shows a highly contrasting value on most of DSA-4 depth and around depth 13650 ft. on DSA-5ST. It can be seen clearly that the magnitude is not comparing apples to apples, as the difference is rooted from the tools’ frequency difference deployed during each of the core, log, and seismic data acquisition. Scaling factor should be applied to bridge this difference.
However, as the observed object is still indeed similar, which is the sand of Sadewa Field. The comparison could be made between the trend and the overall average value between the data. Table 5 and Table 6 show the comparison of Eta magnitude range and average Eta value between core, log, and seismic data on DSA-4 and DSA-5ST well location.
The magnitude of Eta correspondences with the degree of anisotropy recorded in seismic data, which is the difference between Epsilon and Delta as represented by the delta time of mid-to-far offset in seismic gather. Even though the exact magnitude is different, there is consistency of relatively lower
In conclusion, this study shows the effectiveness of seismic anisotropy parameters (ε, δ, γ) as diagnostic tools for reservoir characterisation within interbedded sandstone-shale formations. Through integrated analyses of rock core and well log data from the Sadewa Field, strong correlations were established between anisotropy metrics and key reservoir quality indicators, including mineralogical composition, grain size, porosity, and permeability. Two distinct rock types (RT-A and RT-B) were identified based on anisotropy trends, with RT-A characterised by higher anisotropy values, elevated porosity and permeability, and a dominant presence of hydrocarbon-bearing interlayers. Petrographic data confirm that these hydrocarbon interlayers significantly enhance anisotropy magnitude and improve reservoir quality.
The magnitude of Eta correspondences with the degree of anisotropy recorded in seismic data, is the difference between Epsilon and Delta as represented by the delta time of mid-to-far offset in seismic gather. Consistency of relatively lower anisotropy Eta value range in DSA-4 corresponds with RT-B compared to DSA-5ST as RT-A. This result is also mirrored by the average Eta value showing all data of DSA-4(RT-B) is lower than DSA-5ST (RT-A). This result means that the Eta calculation from core and log data are reflected in the Eta observed from anisotropic seismic data analysis.
Furthermore, the integration of anisotropy parameters with Gamma Ray logs and critical porosity analyses provides an effective approach for discriminating lithological variations and assessing reservoir heterogeneity. These results underscore the potential of anisotropy-based models as valuable tools for enhancing reservoir evaluation, quality prediction, and ultimately optimising hydrocarbon exploration and production strategies in complex sandstone-shale systems.
References
Alkhalifah, T. and Tsvankin, I. [1995]. Velocity analysis for transversely isotropic media, Geophysics, 60, 1550-1566.
Alkhalifah, T. [1997]. Velocity analysis using nonhyperbolic moveout in transversely isotropic media, Geophysics, 62(6), 1839– 1854.
Alkhalifah, T. and Rampton, D. [2001]. Seismic anisotropy in Trinidad: A new tool for lithology prediction, The Leading Edge, 20(4), 420 – 424.
Ambarsari, D.S. and Winardhi, I. S. [2018]. Rock Physics Modelling for Estimating of Reservoir Tight Sand Quality in Bintuni Basin, West Papua, Indonesia Jurnal Geofisika,16(03), 14-18.
Ambarsari, D.S, Winardhi, I. S. Prakoso, S. and Sukmono, S [2020]. Reservoir quality determination by using critical porosity and volume of clay: a case study in the Talang Akar Formation in the NW Java Basin, First Break, 38(5), 63-70.
Ambarsari, D.S. Sukmono, S.Winardhi, I. S. Sanny, T.A. Wardaya, P. D, Septama, E. Setiawan, T. Mulawarman, A. Pratama, R. R. Rossa, V.I. and Murdianto, B. [2021]. The effects of lithology and facies types on the anisotropy parameters and upscaling factor of the sand reservoirs in the deep-water Sadewa field, Kutei Basin, East Kalimantan, Indonesia, First Break, 39(3), 85-91.
Chandra, R. and K. E. Hanson, [1988]. Shear-wave velocity anisotropy insedimentary rocks: A laboratory study: Geophysics, 53, 800-806.
Chevron. [2006]. Sadewa Field East Kalimantan PSC Kutai Basin, Indonesia, ECD Team.
Choquette, P.W. and Pray, L. [1970]. Geologic nomenclature and classification of porosity in sedimentary carbonates. American Association of Petroleum Geologists Bulletin, 54, 207-250.
Dayley, P.F. and Lines, L.R. [2004]. Linearized quantities in transversely isotropic media: Canadian Journal of Earth Science, 41, 349-354.
Dayley, P.F. and Hron, F. [1977]. Reflection and transmission coefficients for transversely isotropic media: Bulletin Seismological Society America, 69, 661-675.
Dayley, P.F. and Hron, F. [1979]. Reflection and transmission coefficients for seismic waves in ellipsoidally anisotropic media: Geophysics, 44, 27-37.
Gavin, L. and D. Lumley, [2017]. Stress-induced seismic azimuthal anisotropy, sand-shale content, and depth trens offshore Northwest Australia: Geophysics, 82, 77-90.
Grechka, V., and Tsvankin, I. [1998]. Feasibility of nonhyperbolic moveout inversion in transversely isotropic media, Geophysics, 63(3), 957-969.
Grechka, V. and Tsvankin, I. [1999]. NMO surfaces and Dix-type formulae in heterogeneous anisotropic media, Proceedings of 69th Annual International Meeting, Society of Exploration Geophysicist, 1612-1615.
Jolly, R.N. [1956]. Investigation of Shear Waves: Geophysics, 21, 905-938.
Kendall, Q. J. Fisher, Q. J. Crump, S. Maddock, J. Carter, A. Hall, S.A. Wookey, J. Valcke, S. L. A. Casey, M. Lloyd, G. and Ben, J.I. [2007]. Seismic Anisotropy as an Indicator of Reservoir
Quality in Siliciclastic Rocks, Geological Society, London, Special Publications, 292, 123-136
Morad, S. Ketzer, J.M. and De Ros, L.F. [2000]. Spatial and temporal distribution of diagenetic alterations in siliciclastic rocks: implications for mass transfer in sedimentary basins. Sedimentology, 47, 95-120.
Nur, A. [1971]. Effects of stress on velocity anisotropy in rocks with cracks: Journal of Geophysical Research, 76, 2022-2034.
Nur, A. Mavko, G. Dvorkin, J. and Gal, D. [1995]. Critical porosity: The Key to relating Physical Properties to Porosity in Rocks. Proc. 65th Ann. Int. Meeting, Society Exploration of Geophysics. 878. Tulsa, OK: Society of Exploration Geophysicists.
Oktariena, M., Triyoso, W., Sukmono, S., Fatkhan, F., Septama, E., Wardaya, P. D., and Murdianto, B. S. [2023]. Anisotropy-driven velocity log reconstruction in deviated wells: A case study from deepwater Sadewa Field. The Leading Edge. 42: 702-710.
Postma, G.W. [1955]. Wave propagation in a stratified medium: Geophysics, 20, 780-806.
Thompson, P. Hartman, J. J. Anandito, M. A. A. Kumar, D. Magill, J. Noguchi, K. and Gunawan, B. K. [2009]. Distinguishing gas sand from shale/brine sand using elastic impedance data and determination of the lateral extent of channel reservoirs using amplitude data for a channelized deepwater gas field in Indonesia, The Leading Edge, 28, 321-317.
Thomsen, L. [1986]. Weak Elastic Anisotropy: Geophysics, 51, 19541966.
Tsvankin, I. and Thomsen, L. [1994]. Non-hyperbolic reflection moveout in anisotropic media: Geophysics, 59, 1290-1304.
Tsvankin, I. [1995]. Normal moveout from dipping reflectors in anisotropic media: Geophysics, 60, 268-284.
Tsvankin, I. [1996]. P-wave signatures and notation for transversely isotropic media: Geophysics, 61, 467-483.
Tsvankin, I. [2012]: Seismic signatures and analysis of reflection data in anisotropic media, Society of Exploration Geophysicists, Tulsa.
Vernik, L. and A. Nur. [1992]. Ultrasonic velocity and anisotropy of hidrokarbon source rocks: Geophysics, 57, 727-735.
Walsh, J. B. [1965]. The Effect of Cracks on the Compressibility of Rocks, Journal of Geophysical Research, 381–389.
Wang, Z. [2002a]. Seismic anisotropy in sedimentary rocks, Part 1: A single-plug laboratory method: Geophysics, 67(5), 1415-1422.
Wang, Z. [2002b]. Seismic anisotropy in sedimentary rocks. Part 2: Laboratory data: Geophysics, 67(5), 1423-1440.
Worden, R.H. and Burley, S.D. [2003]. Sandstone diagenesis: the evolution from sand to stone. dalam: Burley, S.D. dan Worden, R.H. (eds) Sandstone Diagenesis, Recent and Ancient. International Association of Sedimentologists Reprint Series, Oxford, 3–44.
Xu, X., Tsvankin, I., and Pech, A. [2005]: Geometrical spreading of P-waves in horizontally layered, azimuthally anisotropic media, Geophysics, 70(5), D43-D53.
Zimmerman, R.W. [1991]. Compressibility of Sandstones, New York: Elsevier Science Publications.


Ed Hodges1*, Cerys James1 and John Brittan1 discuss how Low Earth Orbit (LEO) satellite constellations have revolutionised connectivity for marine seismic operations, offering high bandwidth and low latency at significantly reduced costs, and enabling near-real-time data transfer and remote processing.
For many years, towed-streamer seismic data has been delivered from the vessel to the processing centre or to a data storage facility on physical media, typically enterprise tape cartridges such as IBM 3592 JC. This method, long considered the industry standard, often introduced significant delays between acquisition and commencing processing. Some contractors then switched to utilising physical disks (NAS drives) instead of tapes. However, this does not reduce the shipment delays but can mitigate against corrupted or bad tapes. Historically, this led to many seismic contractors placing significant amounts of High-Performance Computing (HPC) onboard their vessels along with the required infrastructure, spares and corresponding support structure and of course the highly qualified, experienced processing geophysicists to perform the processing, typically working shift patterns on an offshore rotation of 5 or 6 weeks. Often, this led to a fast-track product being either partially or fully generated offshore, onboard the vessel, because this was seen as a timely way to create an interpretable volume. Often weeks later, the field data would be delivered to an onshore processing centre where a processing team would probably take more than a year to achieve full-integrity final volumes for interpretation, which offered uplift over the similar products created offshore. Whilst the improvements may have been dramatic and certainly significant, there are numerous cases where the full integrity volumes came too late to influence initial drilling decisions.
Alternative strategies included decimating and compressing subsets of field data for satellite transmission to onshore processing centres, enabling preliminary processing. While effective to some extent, these methods involved compromises in data quality and completeness. Recent technological advancements have transformed this landscape.
The advent of Low Earth Orbit (LEO) satellite constellations, such as those provided by Starlink, has revolutionised connectivity for marine seismic operations. These systems offer high bandwidth and low latency at significantly reduced costs, eliminating the need for both data decimation and lossy compression. This technology makes near-real-time data transfer and remote processing a practical reality. In this paper, we expand on the
1 TGS
* Corresponding author, E-mail: edwin.hodges@tgs.com
DOI: 10.3997/1365-2397.fb2025094
potential applications proposed by Ewig et al (2024) and provide case studies detailing the experience gained actively using this approach.
LEO satellite constellations
Whilst there are numerous LEO constellations in the planning or deployment phase today, there are only really two offering fully commercial services. Starlink from SpaceX has the largest operational constellation by far, with >6000 active satellites currently. OneWeb from Eutelsat is the other fully operational LEO network. However, in 2023 the only real provider was Starlink.
Back in 2023, PGS (now TGS) initiated field trials of the Starlink Maritime Service by installing four antennas on a vessel conducting an ultra-high-resolution (UHR) survey in the Irish Sea and six antennas on another vessel acquiring 4D GeoStreamer surveys in the North Sea. The results were highly encouraging, with system uptime proving exceptional and latency significantly lower than the ~750–800 ms, typical of geostationary satellite solutions. Download speeds were also impressive. However, for marine seismic operations, the primary requirement is high-capacity data upload from vessel to shore.
The trials confirmed that the preferred use case was bulk data transfer rather than remote offshore processing. At the time, upload performance was constrained more by the limited number of antennas than by the service itself. Based on these findings, TGS implemented a solution equipping each T-Class Ramform vessel — the most capable in the fleet — with 12 antennas: 10 dedicated to seismic data transfer and two reserved for general connectivity.
Initial tests indicated that LEO satellite systems could feasibly transfer a complete, full-integrity dataset without the need for lossy compression or decimation. During the late 2010s, the industry transitioned from recording discrete shot records to continuous recording, which enabled the widespread adoption of triple-source simultaneous shooting (Langhammer, 2015). This shift redefined ‘record length’ from an acquisition parameter to a processing parameter — a practice that remains standard
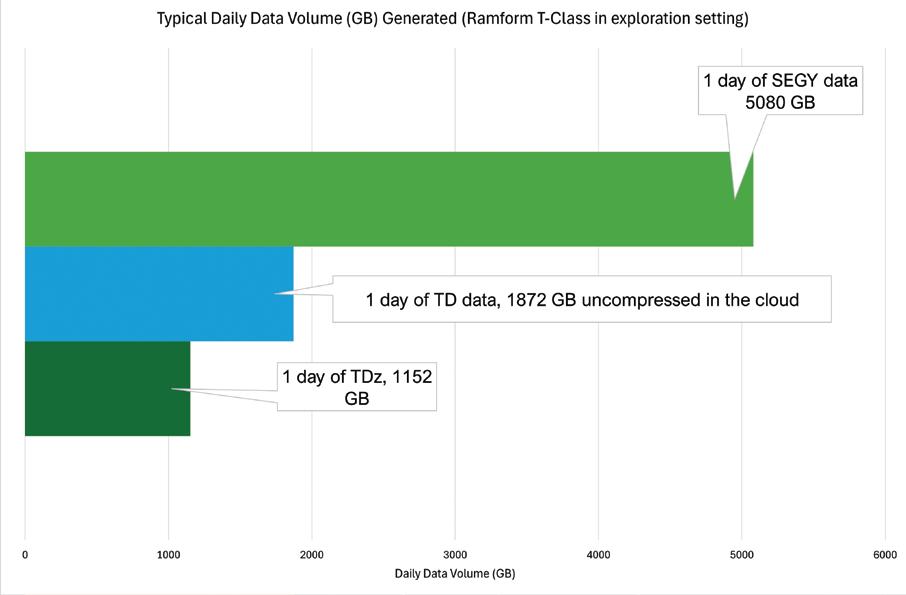
today. Consequently, the overlap between shot records can be so extensive that many samples are effectively delivered twice within discrete shot records. The resulting increase in data volume is significant, as illustrated by the progression from raw field measurements to final processed volumes, further compounded by the requirement for multiple archive copies.
The raw data from the streamer’s analog-to-digital converters is stored in 24-bit integer format. This was identified early as the optimal starting point for transmitting data to the cloud. To improve efficiency, simple lossless compression algorithms were evaluated to balance computational cost against compression ratio. From the outset, it was decided that any compression applied must be fully reversible to preserve data integrity. This requirement was driven by the need for a standardised solution applicable across the entire fleet and all survey types, without requiring case-bycase testing or data-dependent decisions. The selected solution is an open-source lossless compression algorithm that typically achieves a packing ratio of approximately 1.6:1.
The vessel’s recording system generates continuous time-domain (TD) data in 15-minute segments. Each segment is compressed using a multi-threaded, lossless algorithm to achieve efficiency without compromising data integrity. The compressed file is then divided into smaller chunks, which are uploaded to the cloud using proprietary software. This software employs cloudbased commands to enable parallel transfers through the firewall, which manages load balancing to optimise upload performance. The fully automated process has proven highly robust, reducing satellite transmission costs and transfer times while providing a cost-effective solution for long-term cloud-based archiving of field data.
Once the files are transferred to the cloud bucket, the proprietary software reassembles and decompresses each 15-minute segment. A single sail line typically consists of multiple such segments. After all the required segments are available in the cloud, the workflow pauses until ancillary files and necessary approvals are in place. During the initial development phase, many of these decision gates were handled manually as part of a minimum viable product (MVP). Over the course of the proof-of-concept phase and subsequent fleetwide rollout, numerous updates were
implemented with the primary goal of automating steps where practical, thereby reducing manual intervention. This approach has resulted in a robust, long-term solution that remains adaptable without requiring frequent changes as survey configurations and parameters evolve.
A survey using a large streamer configuration typically generates just under 2 TB of raw data per day. By applying lossless compression, this volume can be reduced to approximately 1.2 TB for the cloud upload step. Standard practice is to deliver streamer data as discrete shot records in SEGY format, resulting in datasets of around 5 TB representing this full day’s acquisition, primarily influenced by the chosen record length. This increase is driven by the switch from 24-bit integer to 32-bit IEEE format and the overlap inherent in triple-source shooting (Figure 1). Creating multiple copies of data on physical media remains common practice, for delivery to partners, government entities and archives, etc. Table 1 illustrates data volumes from a recent proprietary survey, which required five complete sets delivered on a mix of tapes and NAS drives. Transitioning this task from the field to a centralised location — enabled by cloud transfer — offers clear benefits in terms of time savings and cost reduction.
During the summer of 2025, TGS acquired multiple proprietary 4D surveys in the Norwegian sector of the North Sea through to the Barents Sea, along with several 3D surveys. All three vessels operating in the North Sea were equipped for direct satellite transfer of data to the cloud. Several experienced offshore geophysicists transitioned from full-time offshore roles to onshore positions, working in the cloud to deliver products efficiently.
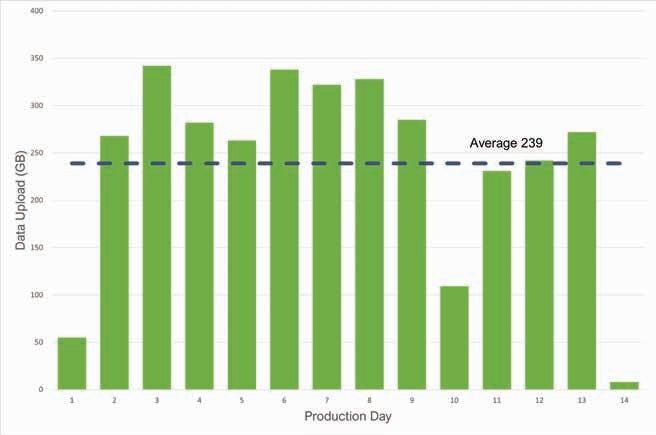
These 4D surveys provided an excellent opportunity to test the new connected workflows, as rapid data delivery offers a particularly high value to 4D projects.
For one of the 4D surveys, the workflow included generating rapid turnaround 4D quality control (QC) products. This involved computing repeatability attributes using various 4D binning strategies in the cloud and comparing them against both a baseline and a previous monitor survey. Additionally, and arguably more valuable, were 4D difference displays derived from 2.5D Kirchhoff pre-stack depth migrations of 4D-binned individual sail lines. The scalability and accessibility of the cloud enabled these products to be generated for every monitor survey line, typically within three days of acquisition, often sooner. This capability, however, required significant preparation of the baseline and monitor datasets by TGS Imaging before the 2025 monitor acquisition. While these extended 4D QC products could technically be generated offshore, the resources required — in terms of both computational capacity and experienced personnel — are far more efficiently and economically utilised by leveraging the cloud for this work.
One of the 4D surveys was acquired well inside the Arctic Circle. Concerns regarding bandwidth availability at such high latitudes had been addressed before the project through testing, during which upload rates exceeding 3 TB per day were achieved near the same field. This relatively small survey utilised a moderate streamer configuration, with just under 60 km of GeoStreamer deployed. The accompanying bar chart in Figure 2
illustrates daily raw data uploads, which averaged approximately 239 GB per day.
The survey acquisition lasted 14 days, with the final shot point recorded late on a Thursday night. By the following Tuesday, all deliverables had been confirmed in the third-party processing company’s cloud environment via cloud-to-cloud transfer. This five-day turnaround included navigation processing, product generation, quality control, and the weekend, as well as making the data available in a shared cloud bucket for third-party access and confirmation.
Similar workflows were repeated for two additional 4D surveys acquired during the same season. In cases where the onshore imaging team handled onward processing, data delivery was seamless, involving a simple transfer from an operations bucket to an imaging bucket within the cloud — a process executed multiple times per week.
Connected workflows, combined with standardisation and event-driven services within the cloud ecosystem, enable the creation of dynamic dashboards that update automatically. Using these dashboards to track project progress across all stages provides stakeholders with a single, clear interface — improving knowledge sharing while reducing confusion and unnecessary communication. Figure 3 illustrates a high-level overview of a completed project, showing detailed daily uploads alongside an overall view of all stages through to the generation of SEGY deliverables.
Using dedicated shared cloud buckets has proven to be a reliable and robust method for transferring data between companies. Electronic data delivery using this approach offers significant advantages over traditional tape shipments or NAS drive transfers, beyond obvious time savings. These time savings are particularly valuable for international transfers, where customs delays often compound physical shipping times. From a risk management perspective, the profile of electronic transfer differs markedly from that of physical media. Cloud-based workflows typically incorporate built-in integrity checks, providing a high degree of confidence in data accuracy. In the rare event of an error or incomplete dataset, remediation is generally faster and less complex than with traditional methods. While checksums remain standard practice, errors are exceedingly
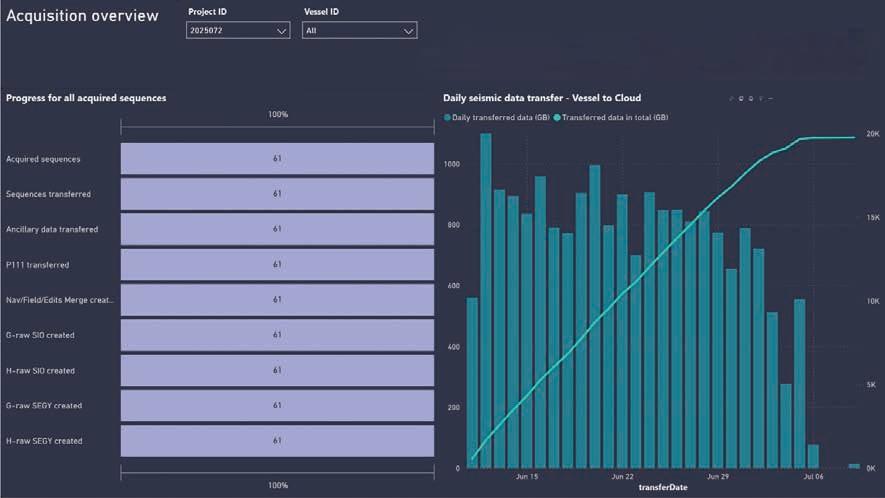
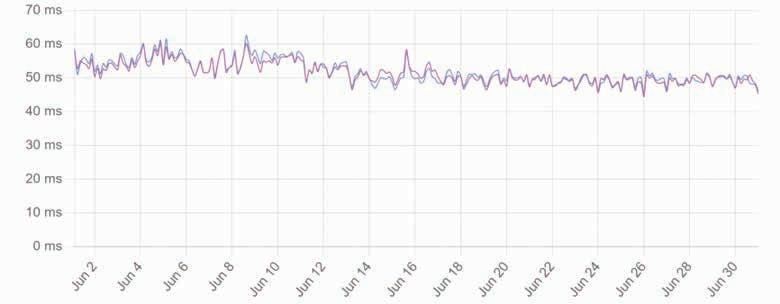
rare because cloud-native transfer commands usually include checksum validation and failover logic.
Electronic delivery is almost certainly the most cost-effective option and aligns with the industry’s demand for timely data access. While physical media for long-term archiving will likely remain for some time, this approach decouples archive creation from immediate delivery, enabling centralised resources for more cost-efficient archive generation.
At first glance, the benefits of digital delivery appear obvious, yet industry adoption has been surprisingly slow. Perhaps the situation is analogous to the persistence of physical books despite the convenience and lower cost of e-readers — physical books still outsell e-books by nearly 4:1.
The LEO design is very favourable for low latencies. Over the three years since Starlink was first installed in the fleet, we have observed further improvements in the ping latency. Today, in Q3 2025, we observe values in the 20-30 ms range when the vessel is operating within the most densely populated part of the constellation between ±60° N/S. During the summer months, a vessel at ~71°N, well inside the Arctic Circle, observed values in the 50-60 ms range (Figure 4).
Experience has shown that the Signal Quality remains largely unaffected by all but the most intense electrical storms. The flat high-performance marine antenna appears unaffected by any vessel motion. The current solution for the offshore data transfer makes use of 10 dedicated antennas to upload the data. We routinely see a single Starlink subscription using a bonded pair of
antennas having a throughput of >500 GB in 24 hours; similarly, a lone antenna uploading 250-300 GB within the same period. The antennas are located on the upper deck with a clear view of the sky, as shown in Figure 5.
During Q2 of 2025, TGS tested the High Data Throughput service offered by Marlink using Starlink as the satellite service. The objectives here were to test the limit of the system both in terms of overall throughput, antenna performance, and global coverage. From the early days of testing Starlink, it had been made very clear that what is provided is a ‘best effort’ service without the SLAs (Service Level Agreements) that the wider business world is so accustomed to. This High Data Throughput offering was an attempt to at least provide a priority service. One of the vessels was transiting from Angola to Las Palmas; during this time, the upload capacity was constantly tested with real data being uploaded to the cloud. The tests included investigating the effect of varying the number of active antennas between 6 and 10. Over an 8-day period, the upload performance was robust. The key measurement was data volume uploaded per antenna per hour, which varied between 18 and 23 GB/antenna/hour. The rate per antenna was slightly higher with 6 active antennas rather than 10, but increasing to 10 increased the overall throughput to the stage that ~4.8 TB was uploaded within a 24-hour period.
Another test was performed on the Ramform Tethys as she transited from Lerwick to just north-west of Hammerfest. This relies on the limited number of satellites in the 70° inclination or the 97.6° polar shells. The throughput observed was consistently ~15 GB/antenna/hour, as shown in the figure below. Whilst this is significantly less than what was observed at the lower latitudes, it still offers a daily upload exceeding 3.5 TB, which is way more than we envisage a streamer vessel requiring (Figure 6). This figure also highlights that one antenna (vlan217) was underperforming compared to the others; the issue was later resolved by replacing the cable.
Predicting daily data generation from a streamer seismic survey is challenging due to factors such as weather, SIMOPS, and technical downtime. However, there is a clear upper limit on the maximum daily volume, typically around 2.5 TB, which reduces
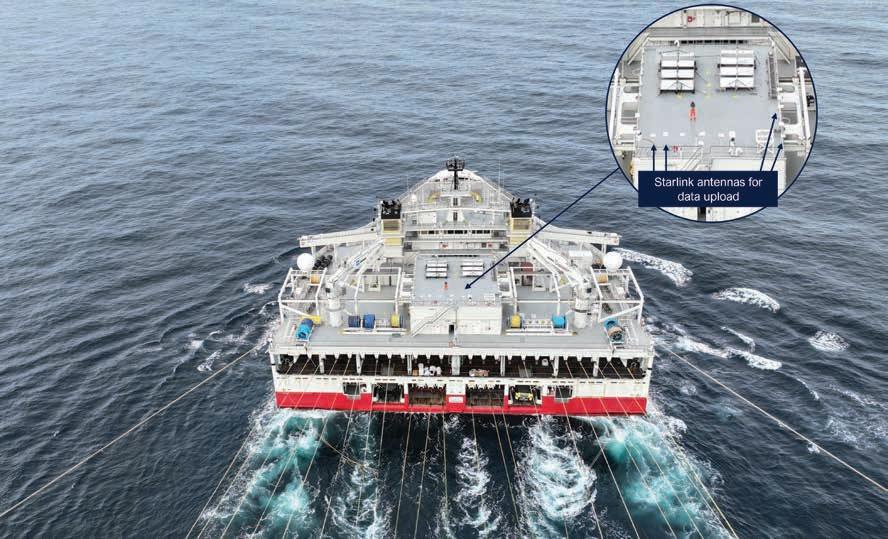
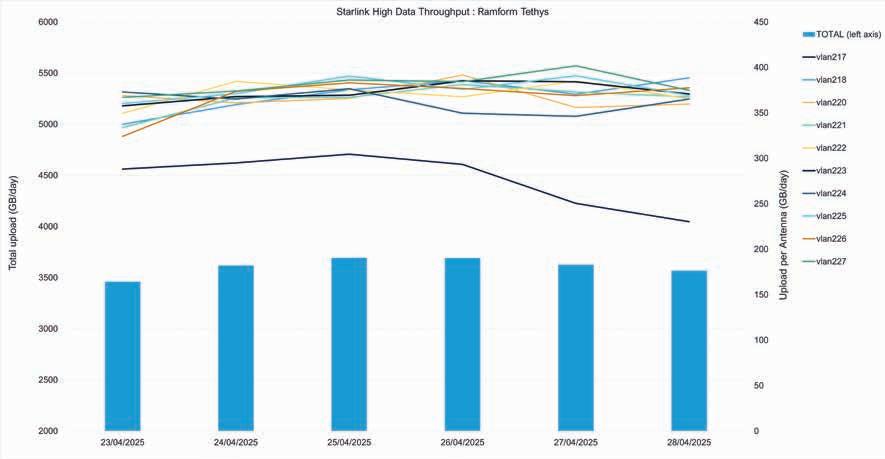
to approximately 1.6 TB after lossless compression. This is well within the capacity of the onboard hardware and is now routine for large exploration surveys, such as those in the Equatorial Margin of Brazil, where a single line into the current can take more than 24 hours.
For OBN surveys, the variables differ, even though the data type remains similar, essentially continuous trace data. Daily volumes depend on the rate at which ROVs recover nodes and the duration of their recording, which varies with survey design, node density, and crossline coverage. Many surveys reach 3-5 TB per day, and short periods exceeding 5 TB per day are not uncommon. Within the OBN arena, this journey is just starting out; to date, OBN teams have used LEO satellites primarily to accelerate delivery of low-frequency hydrophone-only datasets for FWI model-building. This approach was recently applied in the Gulf of Mexico on the Laconia ultra-long-offset sparse OBN program. In that case, data volumes were relatively modest because preconditioning was performed onboard, and only resampled hydrophone SEGY files were uploaded. The satellite companies are bringing though the next generation of hardware, which is expected to be able to handle these data volumes. We expect to be able to leverage this to provide similar cloud access and rapid data turnaround.
How might the availability of seismic data in the cloud transform workflows beyond simply accelerating delivery? When the current solution was designed, it was accepted that some delay would exist between acquisition onboard the vessel and dataset availability in the cloud. At the time, real-time streaming from vessel to cloud was considered too risky and incompatible with the Agile development approach selected. The team has chosen incremental MVPs (minimum viable products) that could deliver immediate operational benefits whilst being aligned to the general roadmap. After nearly 20 surveys using this system, data transit times observed range from approximately 45 minutes for small 4D spreads to around three hours for large exploration spreads. This performance has delivered most of the anticipated commercial benefits. It is difficult to identify significant additional value from moving to a fully real-time vessel-to-cloud system, especially given the added complexity and bandwidth redundancy requirements such a system would entail. The optimal approach
Note that the Total upload per day is using the left axis, whilst the individual antenna uses the right axis.
for real-time interaction may instead involve leveraging onboard data in combination with low-latency connectivity for remote collaboration when necessary.
In streamer seismic acquisition, QC is traditionally divided into real-time and offline processes. Real-time QC, performed onboard by observers and QC geophysicists, relies on live attribute displays to enable immediate interventions — such as detecting an autofire or air leak to prevent costly infill or reshoots. Offline QC, typically executed at end-of-line (EOL), provides statistical checks against contractual specifications (e.g., less than 3% bad channels per streamer). Historically, rigid threshold-based acceptance has evolved into more intelligent, data-driven approaches such as Marginal Line Acceptance, where processing demonstrates that data remains fit-for-purpose despite marginal deviations, avoiding unnecessary reshoots. Machine learning has accelerated this trend; for example, RIDNet, a convolutional neural network for marine seismic denoising (Farmani et al., 2023), can often recover marginal data — though its computational demands are significant. This is where cloud scalability becomes transformative: workflows that transfer raw data to the cloud enable these advanced, compute-intensive QC processes to run quickly and cost-effectively, far beyond what is feasible onboard.
Currently, vessels often generate only a brute stack onboard, typically a 2D stack of a single subsurface line using hydrophone data only, representing less than 1.5% of available traces in a 12-streamer, triple-source configuration with dual-component streamers. With data in the cloud, there is virtually no barrier to producing a full 3D stack cube during acquisition, delivering far richer insight into the acceptability of the entire line.
Another critical factor is the growing prevalence of triple-source acquisition. Advanced deblending algorithms (e.g., Udengaard et al., 2025) remain too computationally heavy for timely onboard execution, excluding them from Marginal Line Acceptance decisions. Cloud-based workflows may change this paradigm, enabling application of advanced processing techniques during acquisition — unlocking QC and decision-making capabilities that were previously out of reach.
This paper has outlined how LEO satellite connectivity has rapidly transformed the acquisition and delivery of marine seismic data. The technology is proven, reliable, and operational at scale.
The remaining barriers are less about capability and more about cultural inertia — reluctance to change or hesitation to be perceived as a first mover. These tendencies are counterbalanced by an economic environment that increasingly favours Opex-based solutions over Capex-heavy alternatives.
Looking ahead, further development is inevitable. We are focused on greater standardisation and automation — automation that delivers tangible benefits while simplifying workflows. The foundation established through this work positions the industry to capitalise on these advancements, paving the way for more agile, scalable, and cost-effective seismic operations.
The development of these projects in TGS has been a collaborative effort involving many individuals whose contributions have been invaluable, even if they are too numerous to list here. Sincere appreciation is also extended to our satellite communi-


cations partner, Marlink, for its exceptional support and patience in helping to implement the vessel connectivity solutions that underpin this work.
References
Ewig, E., Brittan. J., James, C., Brodersen, J.O. and Olsen, S. [2024]. Adopting technology to revolutionise and accelerate the flow of seismic data from sensor to customer. First Break, 42(2), 69-73. Farmani, B., Pal, Y., Pedersen, M.W. and Hodges, E. [2023]. Motion sensor noise attenuation using deep learning. First Break, 41(2), 45-51.
Langhammer, J. and Bennion, P. [2015]. Triple-Source Simultaneous Shooting (TS3), A Future for Higher Density Seismic? 77th EAGE Annual Conference & Exhibition, Extended Abstracts
Udengaard, C., Alexander, L., Gabioli, L., Cochran, S., Cvetkovic, M. and Unger, D. [2025]. Deblending 3D NAZ Data in High Sea Surface Current Environments. IMAGE 2025, Conference Proceedings


15-16 SEPTEMBER 2026 | QINGDAO,


Jill Lewis1,3* and Mark Poole2,4 present an upgrade to the SEG and IOGP’s industry standard formats for the exchange of seismic trace data that are interoperable, increase efficiency and focus on standardisation and automation.
Abstract
The SEG has recently published a clarification note for the SEG-Y_r2.1 format, together with an example file that contains metadata in extended textual headers. This work has been completed in collaboration with the IOGP Geomatics Committee to support organisations that wish to leverage the SEG-Y_r2.1 format and enable the realisation of wider industry objectives around transformational workflows through the adoption and application of open standards. This will serve to enable the automated exchange of seismic data and reduce the risk of introducing positional error through deficiencies in current data transfer and loading processes. The inclusion of extended textual headers in the SEG-Y format presents an opportunity to increase both efficiency and reliability and address the risks and limitations in seismic data management processes that have barely changed for decades. IOGP P format records are presented as an already established solution to addressing the issue of missing or unstructured positioning metadata.
Introduction
Seismic surveying is the most important subsurface imaging tool in the oil and gas industry. The geophysical data from seismic surveys provides a fundamental input to exploration, appraisal and production decisions, minimising both HSE and commercial risks, optimising well locations and supporting the management of reservoirs through 4D technology. It is also a key appraisal and monitoring tool for both carbon capture and storage and wind projects through high-resolution imaging of the overburden.
SEG-Y is the industry standard format for the exchange of seismic trace data and was first published 50 years ago in 1975 (Barry, 1975). The format therefore pre-dates the advent of commercial Global Navigation Satellite Systems (GNSS) and the development of positioning metadata standards. SEG-Y remains the primary industry format in which seismic trace and position data are combined but both acquisition and positioning technology have subsequently changed significantly.
The SEG-Y EBCDIC header, designed to support the inclusion of file metadata, was fit for purpose when introduced but now has multiple limitations that affect its usability in modern seismic data processing and interpretation workflows. The
EBCDIC format itself is outdated and not natively supported by modern systems and there is no industry standard format for the content, which makes it harder to parse programmatically and so it generally requires manual interpretation. Additionally, the limitation of 40 lines, with 80 characters each, significantly constrains the amount of data that can be included in the header.
The SEG-Y_r1 and SEG-Y_r2 revisions were designed to read and write additional data types like 3D and 4D. An issue that was not addressed in these revisions was legacy data with trace header data in incorrect byte offset locations. SEG-Y_r2.1 introduced the option to include user definition of the layout of the trace header entries in the extended textual headers in XML format. The extended headers also permit the inclusion of general metadata in structured formats like JSON. It is envisaged that companies will develop their own cover documents that define metadata requirements in SEG-Y extended textual header stanzas.
Aside from a stanza that defines the trace header layout, the most significant advances afforded by extended textual headers are the pre-defined stanzas that contain positioning metadata. Accurate positioning of a seismic spread is important in both an absolute and a relative sense, the former to ensure that the position of any subsurface feature is recoverable, and the latter to ensure repeated illumination of the same subsurface points. In certain applications geospatial integrity is of fundamental importance to the value of the seismic record and to interpretations derived from the data. Reservoir seismic surveys cost millions of dollars to acquire and great care is applied to reliably position the processed traces. That reliability can easily be compromised if positioning data is subsequently corrupted through incomplete or incorrect metadata in data transfer, management or loading processes.
Reservoir 3D seismic surveys employ wide streamer separations and are less sensitive to positional error than high resolution surveys focused on the overburden to identify geohazards such as shallow gas or boulders. 3D Ultra-High Resolution surveys for offshore wind projects are conducted to precisely map boulders of around 1 metre in diameter to support the micro-siting of offshore wind turbine foundation structures and gridding bins for these
Corresponding author, E-mail: jill@troika-int.com DOI: 10.3997/1365-2397.fb2025095
high-resolution surveys can be sub-metre. The positioning of the receivers and ultimately the first return seismic arrival therefore needs to be as accurate as possible. The better the positioning, the more precise the migrated 3D cube will be and, by extension, the higher the definition of the subsurface.
Currently, there are multiple handshakes between seismic data acquisition, processing and archiving, followed by additional steps for data retrieval and loading. At each stage operators manually enter positioning metadata, further increasing the risk of errors. Seismic metadata is often not easily accessible, not documented in a standard format and not conformant with SEG standards. Geodetic and bin grid geometry information, including Coordinate Reference System (CRS) metadata, is not presented in a common format and some of this information is held separately from trace data, in supporting documentation. As a result, metadata can be missed, ignored or lost in the loading process, which degrades the fidelity of the data and increases the risk of introducing errors.
Seismic bin grids provide the spatial framework that is required for acquiring, organising and processing 3D seismic trace data. In 3D data acquisition the bin grid design helps to optimise acquisition and deliver uniform data coverage at the required resolution in service of the imaging objectives. The use of a local rectilinear grid system for spatial referencing is a simplification that enables efficient computer processing to support the mapping of faults and structures and the location of subsurface targets. Regularising seismic trace data onto a local grid system also allows for the efficient grouping of data based on acquisition geometry.
Binning grids are similar to the local grids that are applied in civil engineering projects in that they are typically a plane cartesian grid with an origin at nominal X & Y integer values that simplify positional referencing within a local area of interest. Axis orientation for seismic bin grids may be aligned with the primary shooting direction, source-receiver layout or major geological features. In contrast with the projected CRS used in topographic mapping, the grid is designed to meet the requirements of a specific survey and is not systematically or necessarily aligned with north.
GNSS calculate positions referenced to a global reference frame. For the Global Positioning System (GPS) this is the World Geodetic System 1984 (WGS 84). However, most national mapping systems still use regional CRSs that pre-date the advent of satellite positioning. There are hundreds of different regional CRSs in active use that are commonly mandated by national mapping authorities as the spatial reference for seismic data. CRSs can use different methods of modelling of the Earth (known as datums) and different map projections. These are defined by multiple parameters, such as ellipsoids, prime meridians, map projection false origins and axis orders.
As is often required when gathering seismic traces within a bin grid, re-referencing data from a global CRS like WGS 84 to a regional CRS requires the use of a coordinate transformation. Since transformations are derived empirically there are often multiple different methods of transforming coordinates between a specific regional CRS and WGS 84. For regional CRSs, details of the required transformation to WGS 84 are an essential requirement in position metadata as it is not possible to reliably determine this information algorithmically. Whilst this requirement has been recognised and addressed in many applications through the process of ‘early binding’, the systematic association of transformation information with regional CRS definitions, transformation information is commonly not included in EBCDIC headers.
Associating the positions of seismic traces with an incorrect CRS or transformation can result in positional errors of tens or hundreds of metres that may impact project planning and introduce operational or HSSE-related risks. It is therefore essential that metadata includes unambiguous definitions of all the CRSs associated with the production of the coordinates to which trace data in a SEG-Y file are referenced, together with any associated transformations. Omitting details of the transformation to WGS 84 in positioning metadata needlessly introduces an uncertainty of up to approximately 25 metres in location.
The International Association of Oil and Gas Producers (IOGP) is an industry-led organisation made up of member companies
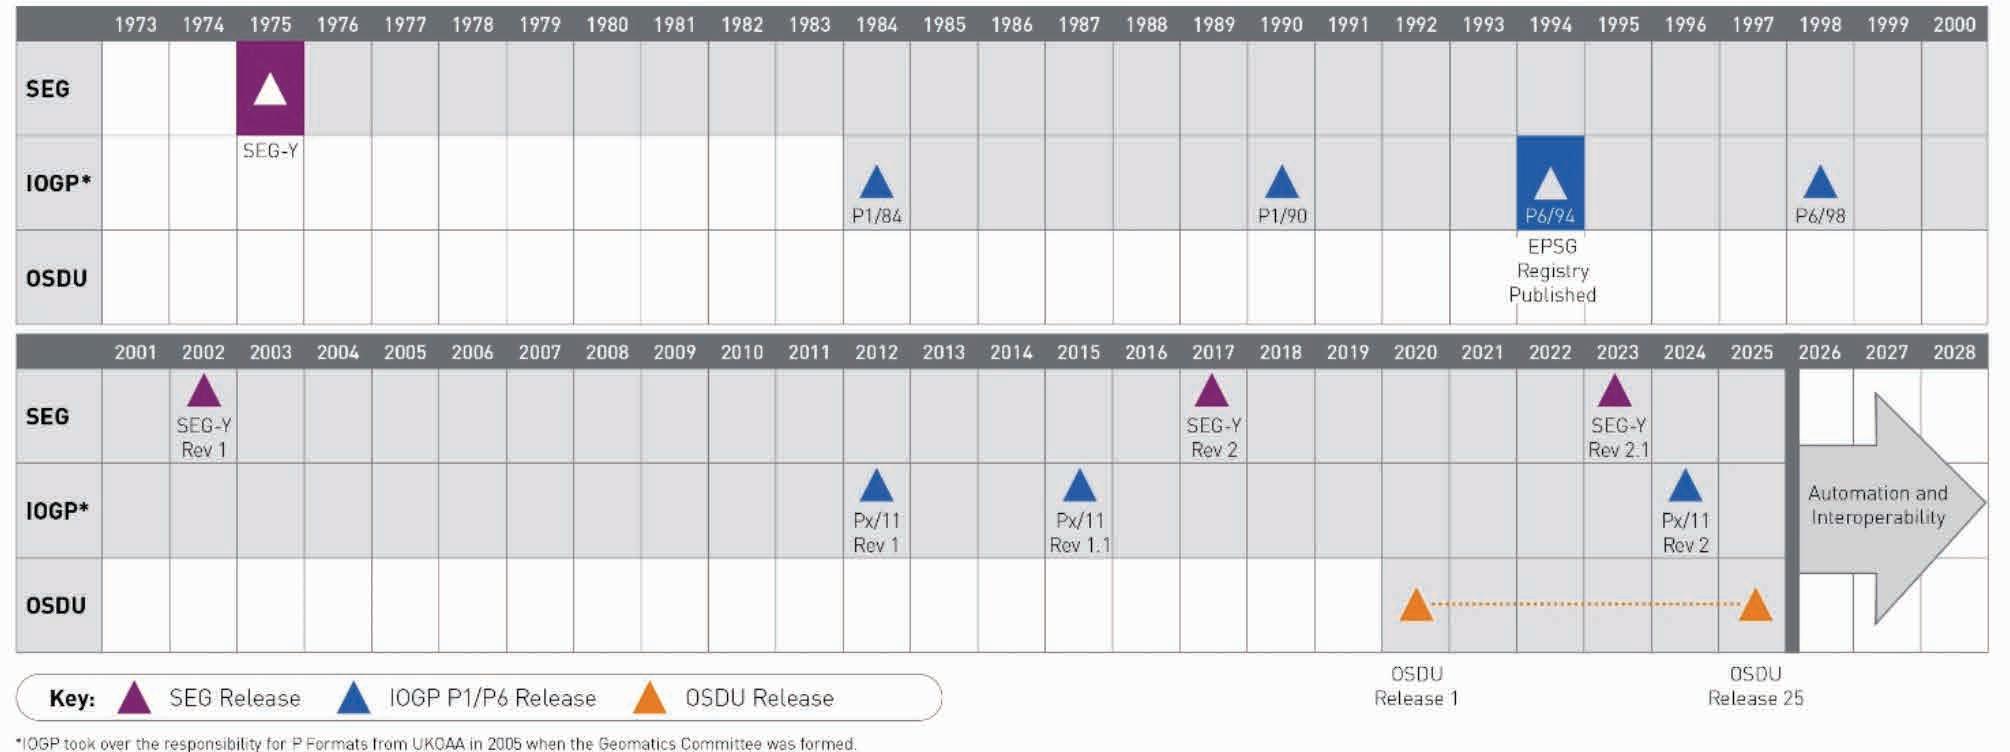
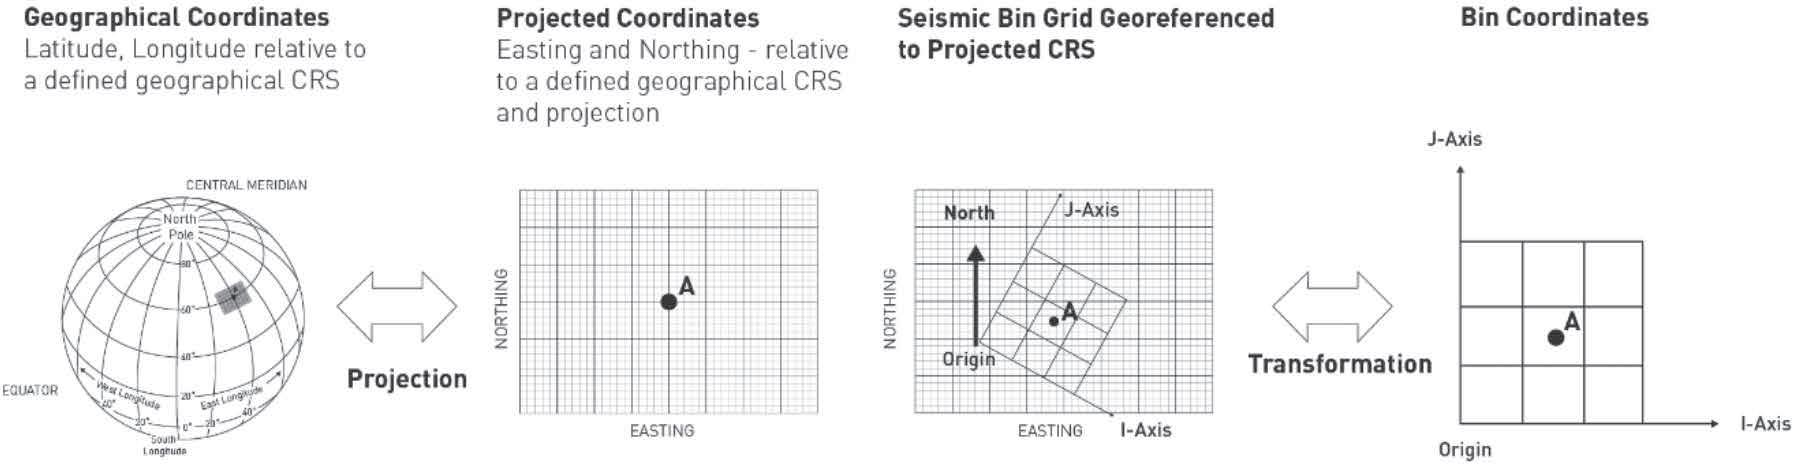
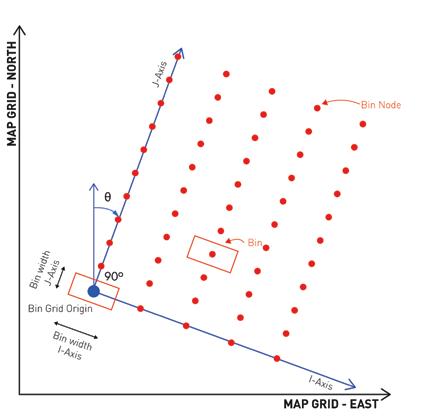
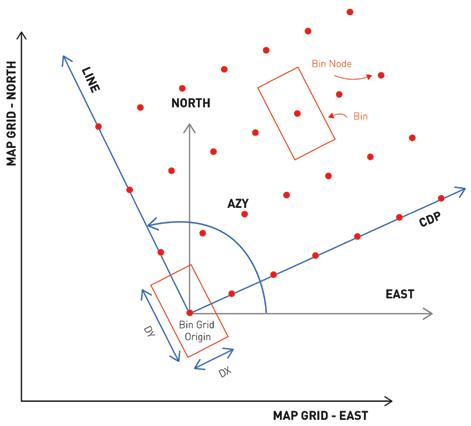
that develops common guidelines, engineering specifications and digital data formats to help the oil and gas sector operate more safely, efficiently, and sustainably. The IOGP’s EPSG Geodetic Parameter Registry (epsg.org) and data model are widely recognised as a leading global reference for CRS and transformation data. In the EPSG registry, CRSs and transformations, and their component parts, are assigned unique names and authority codes in a data model that is aligned with ISO coordinate modelling standards.
The IOGP position or ‘P’ formats for seismic position data reference the the EPSG registry and have been progressively revised in response to ever-evolving acquisition and processing technologies. The P formats provide a comprehensive and logical structure for the robust definition of CRS and coordinate transformations in an industry-standard format. The latest revisions of the formats for processed seismic navigation data (P1/11) and bin grid definitions (P6/11) are machine-readable ASCII files, referencing EPSG names and codes but also including explicit definitions of each entity at the parameter level, providing redundant information and supporting the definition of proprietary CRS that are not recorded in the EPSG registry. The EPSG registry was first published in 1994, 18 years after the first publication of the SEG-Y format, as illustrated in Figure 1.
Unlike most geographic and projected coordinate systems, bin grids are generally designed to meet the requirements of a specific survey and are therefore unique. As only the generic structure of bin grids is described in the EPSG registry bin grids must therefore be fully defined in project documentation and deliverables.
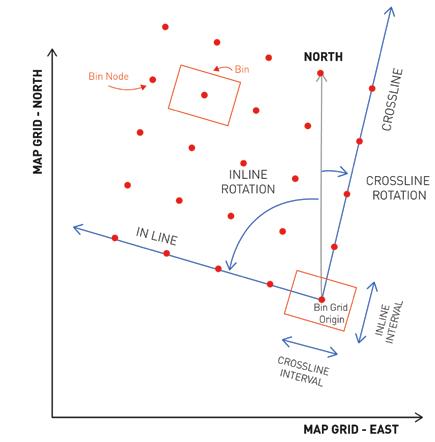
Bin grid coordinate systems afford simplification and convenience in processing and interpretation but, to support field operations, these local grid coordinates need to be converted to a real-world CRS. In civil engineering the relationship between a site grid and the real world is typically achieved by establishing a minimum of three physical control points on site for which the coordinates are known in both the local site grid and a ‘real-world’ CRS. As physical control points are not applicable in offshore seismic acquisition projects, bin grids are defined by virtual points. The absence of physical monuments places greater importance on the definition of the CRS to which the projected coordinates of the bin grid nodes refer. Figure 2 illustrates the relationship between the three coordinate reference systems that must be defined to georeference of 3D seismic trace data. The location of the bin centre node at point A must be known in geographical, projected and bin grid CRS to support operational planning and activities including well placement. Reliable interpretation of coordinate values associated with 3D seismic data therefore requires the unambiguous definition of all associated CRSs and coordinate transformations.
The dynamic positioning of sources and receiver groups during acquisition means that the processed trace locations do not naturally fit a bin grid and thus must be regularised to align with the geometry of the grid. An issue that is often currently overlooked is whether the bin node coordinates associated with trace gathers refer to the centre of a bin, as indicated in Figure 2, or a corner or edge.
Although IOGP publish a standard format for the definition of bin grid coordinate systems this has not been universally
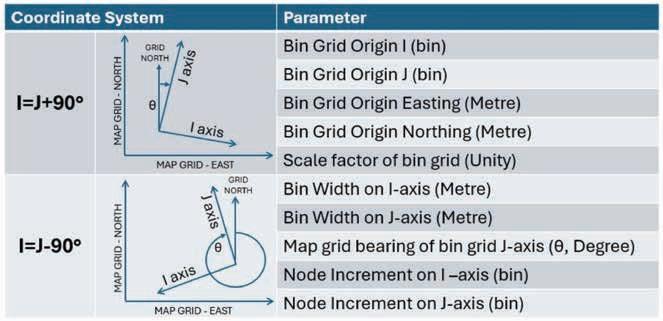
adopted and there are multiple different conventions in current use, some of which are illustrated in Figure 3. The use of different conventions in the documentation of bin grid definitions can result in considerable confusion as, for example, bin grid axes may be labelled variously as I, J, in-line, InLine, xline, Xline, track, trace, T, bin, B, IBL, IBP or CDP. There are also different approaches for defining the angular relationship between bin grid axes and projected/map coordinate systems which may introduce further confusion.
Bin grid geometry is commonly implicitly defined in the EBCDIC header through the inclusion of four ‘corner’ points with coordinate values in both projected and bin grid CRSs. This information can be used to implicitly define the bin grid coordinate system. However, in the absence of an explicit definition some elements must be inferred, resulting in a risk of misinterpretation and consequent error. The IOGP offer an industry standard convention for the parametric definition of bin grid geometry through definition of the coordinate system and the parameters for the formula to transform bin node locations from bin grid to projected coordinates. These are detailed in IOGP report 373-07-2 for the right-handed (I=J+90°) and left-handed (I=J-90°) cases illustrated in Figure 4 together with the associated transformation parameters.
As bin grids are specific to individual surveys they are not defined in the EPSG registry. Unlike projected and geographical CRSs they can therefore not be described implicitly through reference to a name and authority code and must be therefore documented with sufficient redundant information to support verification of the internal integrity of the documented grid. The information in Figure 4, when combined with corner point coordinates in bin grid, projected and geographical coordinates in both the base CRS and WGS 84, provides the necessary redundant information to enable the internal verification of the bin grid definition. The fourth set of corner point coordinates
can be used to check if the grid is square and the grid bearing of the axes is consistent with the bearingJ value. The defined node spacings (widthI, widthJ) can be checked against the spacings computed from the corner point coordinates. The projected coordinates for the corner points can be checked for consistency with the associated latitude and longitude values to validate the quoted CRS. Lastly, where the base CRS is not WGS 84, the geographic coordinates for corner points in WGS 84 can be used to verify the specified coordinate transformation from the base CRS.
The P6/11 format mandates the inclusion of all the required information to enables the checks outline above to be completed. P6 records can also be used to provide additional information for which there is insufficient space in the EBCDIC including data outlines and the provenance of the bin grid. The EBCDIC header was maintained in SEG-Y_r2.1 to support backwards compatibility, a key tenet of the SEG. It is therefore recommended that IOGP conventions and recommendations for documenting CRS, bin grids and transformations are applied in the EBCDIC as good practice, in the absence of a company-specific format.
Recognising that it was not practicable to produce a standard layout for the EBCDIC headers that would be universally acceptable the SEG introduced extended textual headers in revision 1 of the SEG-Y format (Norris, 2002). However, although the extended header stanzas introduced with revision 1 supported the inclusion of comprehensive positioning metadata they did not conform with a standard format or reference the EPSG registry. This was addressed with the release of SEG-Y revision 2 that prescribes the use of IOGP P format records in extended headers with 4 pre-defined stanzas for positioning metadata.
IOGP published the original P6 format in 1994 as a standard convention for bin grid definition. The further developments of the P formats include increased metadata types and improved structuring, allowing for efficient automated QA/QC and data loading. For 3D data the above issues are all addressed in the IOGP P6/11 format, which requires both a parametric definition of the bin grid within a standard format and example points (e.g., corner or perimeter points) that enable quality assurance checks. The format ensures the preservation of the relationships between the geodetic entities required to position the seismic trace data, and it is possible to explicitly define the relationship of the bin node coordinates to a bin cell to avoid the introduction of systematic error.
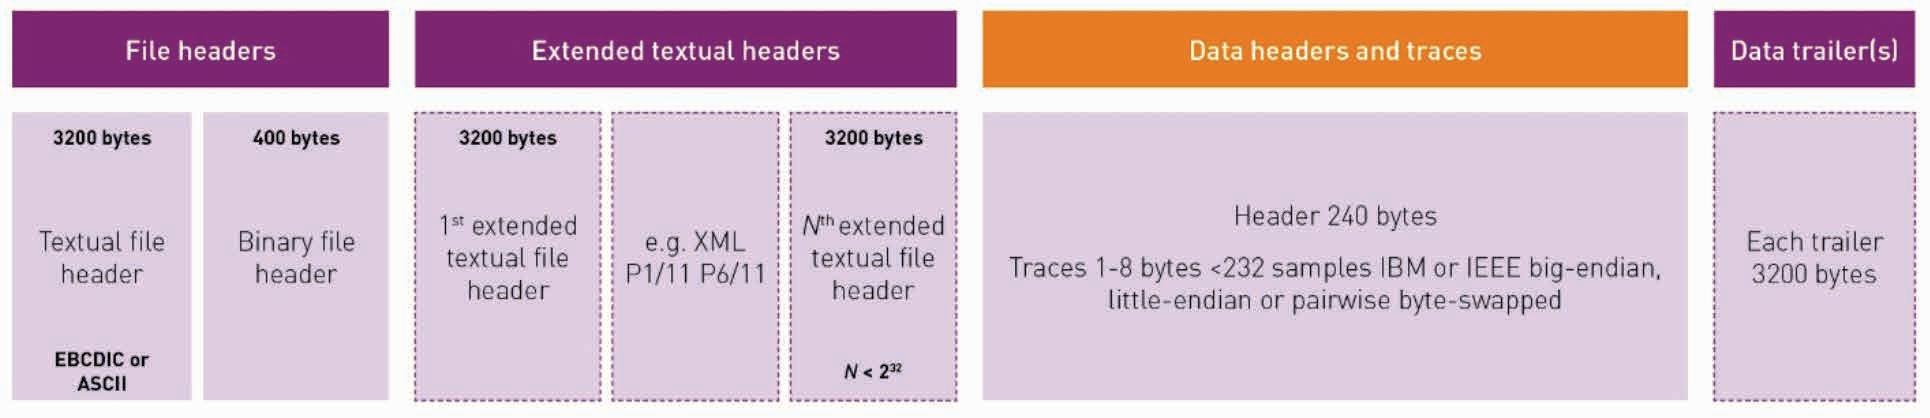
The inclusion of a conformant IOGP P format file in extended textual headers provides an unambiguous, accurate and machine-readable definition of the geodetic parameters associated with the seismic dataset. The extended header structure also allows the storage of structured metadata reflecting other acquisition and processing parameters . An example SEG-Y file with extended textual headers with stanzas containing P1/11 and P6/11 records, a JSON-formatted ‘catalogue’ can be downloaded at the following link: https://public.3.basecamp.com/p/ ieWcighmjwgau7SzSpgu51Pt.
new chapter: Open standards and Interoperability
The establishment of the Open Subsurface Data Universe (OSDU) forum in 2018 marked the start of a new chapter in subsurface data management. The integration of standards is a fundamental tenet of the OSDU mission, to create an open, cloud-native, vendor-neutral data platform for subsurface and energy data.
IOGP are strategically aligning with the OSDU around standardisation. The OSDU recognises the IOGP P formats, and P6/11 is documented as an input to OSDU for bin grid definitions. OSDU also integrates and supports SEG standards within the OSDU Data Platform. Extended textual headers support a wide range of data types and formats with the flexibility to enable customisation. In addition to the position metadata in IOGP P format, headers can be used to include general information like acquisition and processing parameters in a variety of formats, including JSON.
Extended textual headers in SEG-Y_r2 were not widely adopted by the industry when introduced in 2017 and workflows therefore remained constrained by the limitations of the EBCDIC header. The advent of the OSDU has stimulated a renewed focus on the application of standards by both regulators and oil and gas operators that receive and exchange data in SEG-Y format and are looking to increase the efficiency of their seismic data management processes through automation.
The creation of the OSDU Forum and a drive for increased efficiency have increased focus on standardisation and automation. The SEG recognised the value of adopting IOGP P formats with the 2017 release of SEG-Y_r2 (Hagelund, 2017) and have continued to collaborate with IOGP to support the implementation of structured metadata in SEG-Y_r2.1 (Levin, 2023), (Allard, 2025).
The SEG and IOGP have developed interoperable industry standard formats to support the exchange of seismic trace data
and systematically revised these in response to rapidly evolving and increasingly complex acquisition and processing technologies. These formats are designed to provide the flexibility to support a range of end user requirements. The latest revision of the SEG-Y format enables users to include data in IOGP P formats that provide authoritative, machine-readable trace location data with redundant information to enable quality assurance checks. The use of IOGP P format records in SEG-Y extended textual headers mitigates the risks associated with missing, ambiguous or incomplete non-standard CRS and transformation definitions in metadata.
For organisations that wish to move further towards automation in the exchange of seismic trace data, the extended textual headers in SEG-Y_r2.1 offer the option to overcome the limitations of the EBCDIC header. Full exploitation of the format also addresses the risks and inefficiency associated with reliance on supporting documentation and companion files in data transfer and loading workflows. The implementation of support for SEG-Y_r2.1 extended textual headers in applications that create, exchange and consume information in SEG-Y format will be supported by further development of the OSDU platform.
The authors wish to acknowledge the support of the SEG Technical Standards Committee and the IOGP Geomatics Committee and the members of the IOGP / SEG joint working group for the development of the SEG-Y_r2.1 Extended Textual Header clarification and the associated example files.
Allard, J.A. [2025]. SEG-Y_r2.1: Extended Textual Header clarification. Tulsa: Society of Exploration Geophysicists.
Barry, K.C. [1975]. Recommended standards for digital tape formats. Geophysicas, 344-352.
Hagelund, R.A. [2017]. SEG-Y revision 2.0 data exchange format. Tulsa: Society of Exploration Geophysicists. doi: https://doi. org/10.1190/20170101-segy.
IOGP Geomatics Committee Reports and P Formats: https://www.iogp. org/bookstore/portfolio-item/geomatics/.
Levin, S.A. [2023]. SEG-Y revision 2.1 data exchange format. Tulsa: Society of Exploration Geophysicists. doi: https://doi. org/10.1190/20250501-segy.
Norris, M.A. [2002]. SEG-Y rev 1 data exchange format. Tulsa, OK: Society of Exploration Geophysicists. Retrieved from https://doi. org/10.1190/20020501-segy.
Over 80,000 papers and articles covering the main fields of study within geoscience, engineering and energy
All proceedings from EAGE Events held around the world, as well as from partner associations
Works on all devices, IP address authenticated access from your smart phone, tablet, laptop or PC
- Access EAGE’s leading scientific journals
- Enjoy top-quality research articles, news, special monthly topics, industry features, and company profiles in EAGE’s fl agship magazine, First Break
Email earthdoc@eage.org to start your FREE CORPORATE TRIAL today!
Karyna Rodriguez1*, Helen Debenham1, Neil Hodgson1, Lauren Found1 and Sam Winters2 describe the data processing that has maximised the 2023 Link survey offshore Namibia.
In the Orange Basin off the coast of Namibia, the quest to peer deep into the Earth’s subsurface is anything but simple as complex geological structures such as the Orange Basin’s Gravity Driven Fold and Thrust Belt (GDFTB) lie between seabed and the Early Cretaceous targets. Yet the area has been the scene of a string of huge oil and gas discoveries over the last 2-3 years, making it one of the industry’s hottest global hotspots.
After Galp Energia’s Mopane-1X discovery on PEL 83 in 2023, Rhino Resources have followed with three successive discoveries of oil and gas condensate in Cretaceous stacked clastics in the adjacent PEL 85. After such a run of successful exploration wells, the emphasis of the project, and the utility of the 3D seismic inevitably changed from ‘can we detect hydrocarbons ahead of the drill bit and place an exploration well where it will intercept the maximum column of hydrocarbons?’ to ‘can we constrain the range of accumulated resources in place and understand how to efficiently drain these accumulations?’. With many 3D datasets this might have required a new acquisition with alternative processing initiative. However, the Link Dataset in eastern PEL 83 and northern PEL 85 has
many unique qualities that allowed us to transition into a resource delineation quality dataset just utilising an alternative migration approach.
Searcher acquired the Link Multiclient 3D survey in 2023 with partner Shearwater who also processed the seismic dataset. It is part of a net of MC 3Ds in the Orange Basin that allow insight into the full sandstone fairway from the shelf, across the inner basin, the slope and the basin floor. Innovatively, the 3692 km2 Link 3D was acquired in wide tow configuration with 12 by 8.1 km streamers 150 m spaced, and in strike (north-south) azimuth orientation rather than dip azimuth orientation. This was a key decision as this direction of acquisition was more aligned to surface currents, reducing streamer feather and acquisition efficiency across the survey.
Galp subsequently drilled the appraisal well Mopane3X on the Link survey in 2025, so one could be forgiven for saying that the Link survey had proved its worth as an exploration tool. Whilst the lily was beautiful, we wanted to gild it to get some extra utility- and transition the dataset into a resource constraining tool. Our objective was to use
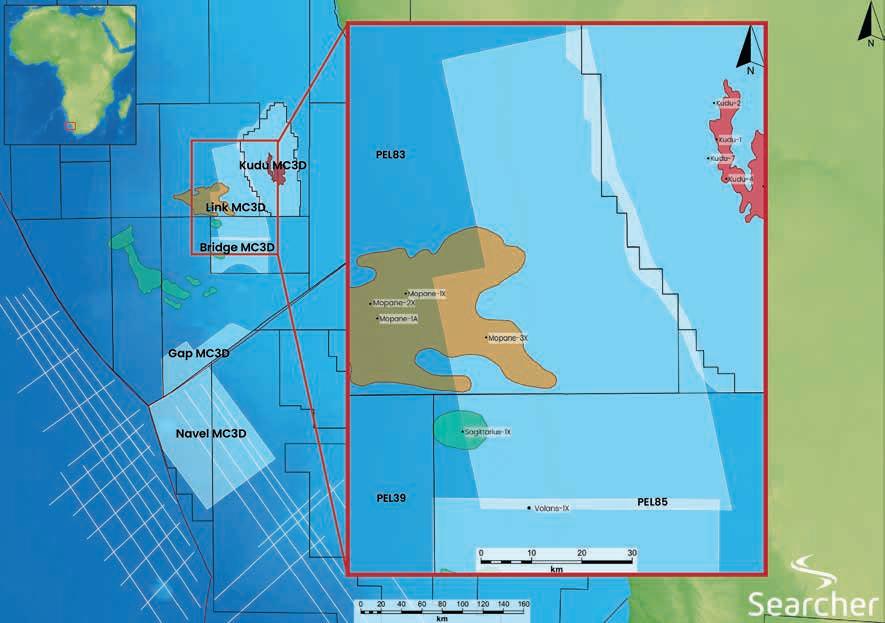
1 Searcher | 2 Shearwater GeoServices
* Corresponding author, E-mail: k.rodriguez@searcherseismic.com DOI: 10.3997/1365-2397.fb2025096
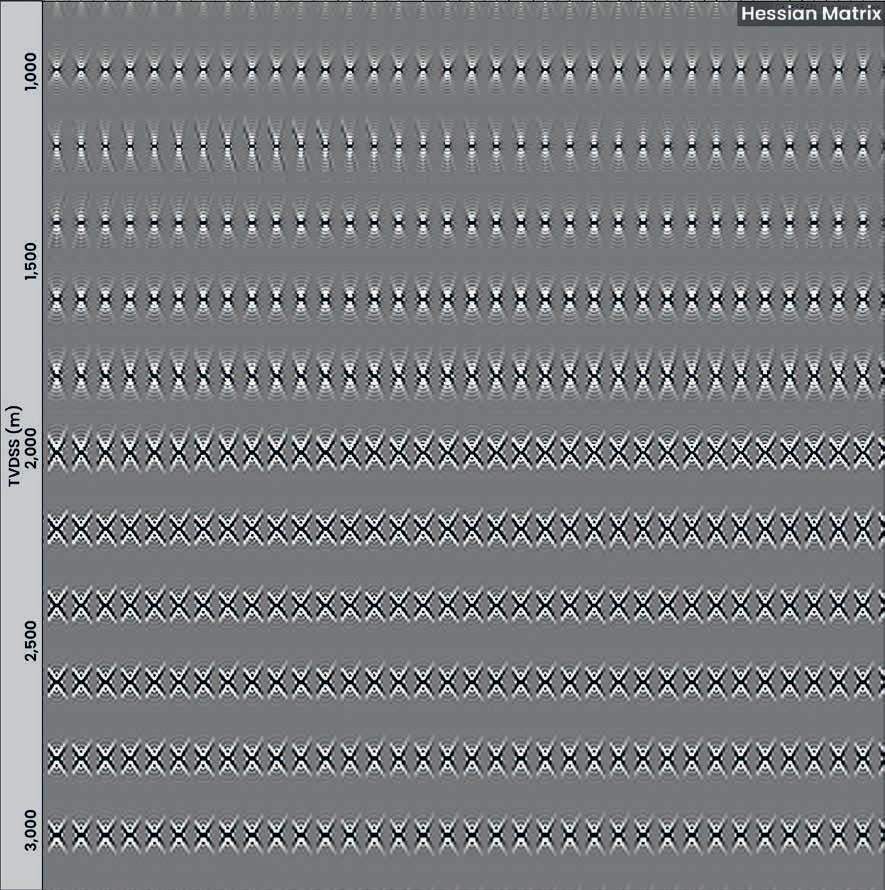
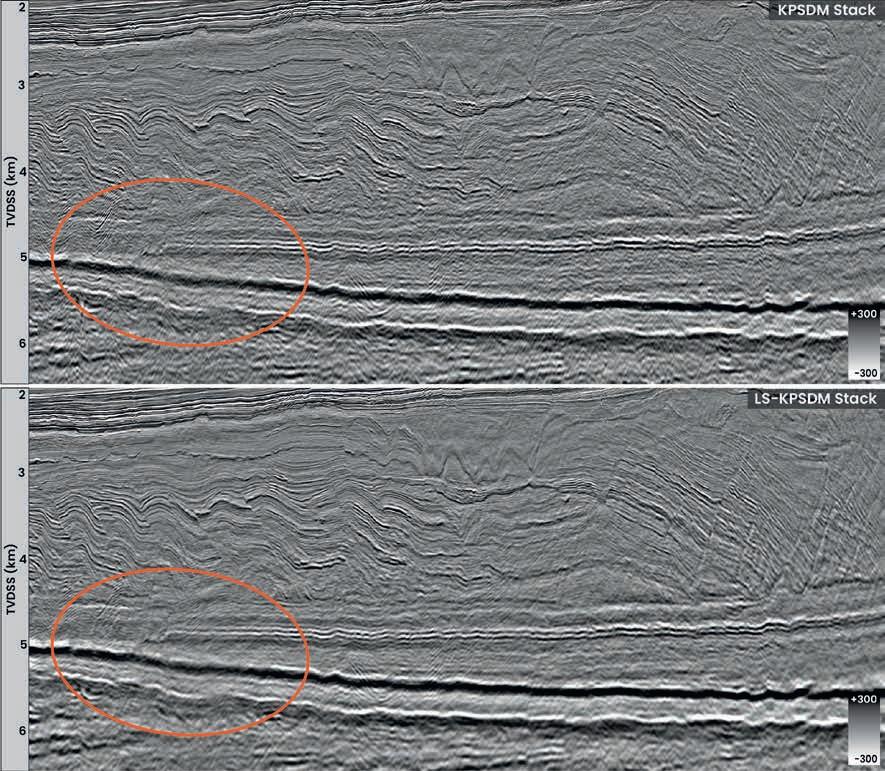
the Link dataset to invert for reservoir and hydrocarbon distribution, where the original reflectivity data is converted from a reflection to impedance where amplitudes are now describing the internal rock properties, such as porosity, lithology and fluid in the rocks. For the inversion to add real value
Figure 2 An example of the point spread functions showing the spatially varying blurring effect of the Kirchhoff migration operator as modelled through the detailed velocity model.
Figure 3 Test Inline Full Stack (0–30°) comparison between K-PSDM (above) and LS K-PSDM (below). Deep section shows improved illumination and reduced noise.
requires the best quality and conditioned dataset you can access.
This is particularly so in the Orange Basin. The target early and late Cretaceous sands lie beneath the decolement surface of the complex extension, translation and compression structures
of the Gravity Driven Fold and Thrust Belt (GDFTB). Looking below the complexities of this phenomenal geological wonder (Figure 3), as depth increases, so too does the challenge of obtaining clear illumination of the reservoir. The reservoirs here are discrete stacked meandering channel, levee and overbank deposits in addition to backstepping lobate frontal splays.
Significant net pay is accumulated by multiple stacked sands, each of which can be resolved within the Link data and laterally mapped.
As illumination varies across the dataset, the conventional Kirchhoff pre-stack depth migration process cannot give a perfect representation of subsurface reflectivity, and therefore
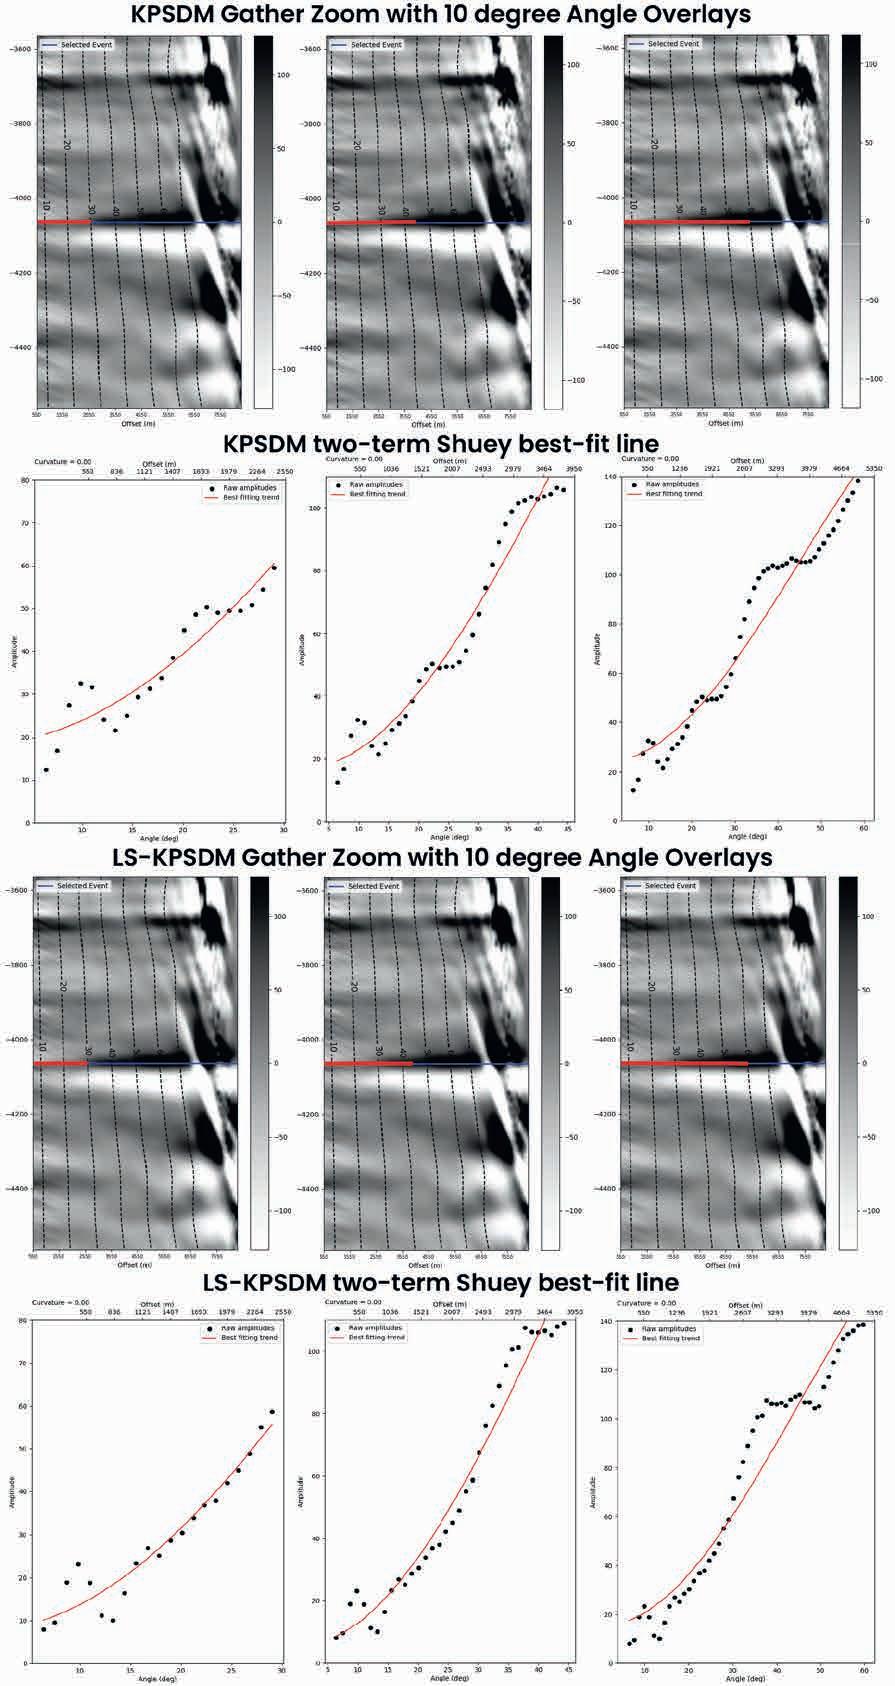
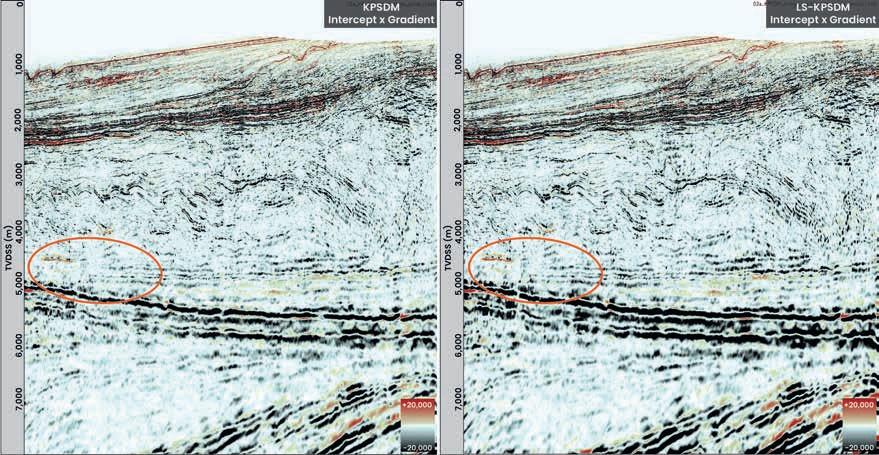
we cannot invert to impedance with sufficient confidence. This would lead to continued wide uncertainty in reservoir distribution, and specifically rock property distribution. Whilst this is manageable in an exploration setting the wide residual uncertainties do not help in modelling efficient reservoir production design and moving towards Final Investment Decision (FID).
To tackle the imaging challenges and enable reservoir and fluid distribution defining inversion of the data, we embarked on a mission: to undertake a least-squares Kirchhoff prestack depth migration (LS K-PSDM) using the Link dataset.
Least squares migration is an advanced technique used to generate a more accurate representation of the Earths’ reflectivity than conventional imaging methods. In simple terms, the process of migration is not perfect and least squares imaging attempts to iteratively reduce this imperfection. This leads to a cleaner, more correctly balanced and higher resolution image of reflectivity. This method naturally lends itself to complex settings, such as that found in the Orange Basin, where strong velocity variations and complex geology are present.
The implementation of LSM covers both Kirchhoff and RTM; with the Kirchhoff method chosen on the Link survey. Within the image domain, the forward Hessian (which can be thought of as the ‘blurring’ effect of migration) can be estimated
either through full migration and de-migration or through use of Point Spread Functions (PSFs) and solving for reflectivity iteratively. Each PSF gives a local estimate of the blurring effect of the migration operator due to variations in illumination or irregularities in subsurface data coverage (see Figure 2). It is worth noting that PSFs have the added benefit of allowing for offset dependent variations in illumination, which can show potential error in conventional AVO estimates in areas of greater model complexity without the computational overheads of full migration and de-migration loops.
Once PSFs are calculated, they are then used to iteratively solve for reflectivity in a constrained inversion, compensating for illumination, and reducing noise – leading to a cleaner image with improved signal to noise ratio. This method allows for the handling of large datasets efficiently, making LSM feasible for exploration size surveys, not just small targeted areas.
Additional data was drawn from the adjacent multi-client 3D Bridge dataset on PEL85, to ensure sufficient coverage for the migration aperture. Fortunately, there was access to the only multi-client 3Ds in Namibia’s orange basin, and here they were not only adjacent, but overlapping sufficiently to ensure full fold coverage.
A full Kirchhoff processing flow was also being implemented on this dataset, including detailed velocity model-building, utilising full waveform inversion to obtain a very high-resolu-
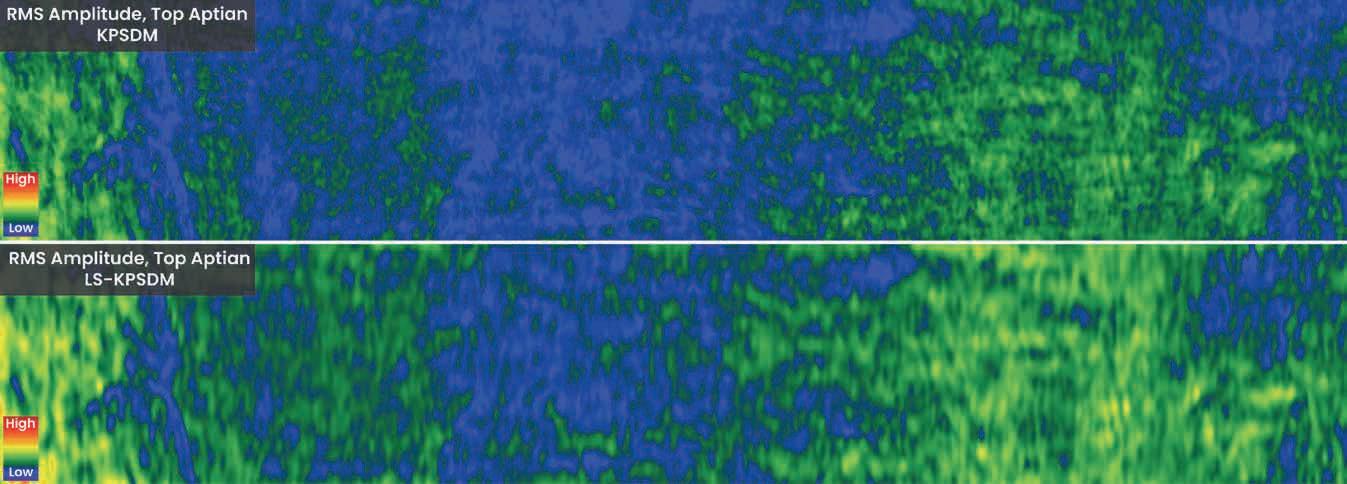


tion velocity model through the complex overburden. This was made possible by the modern acquisition of the Link dataset, utilising 8.1 km streamers, and allowing plenty of offset to capture those vital diving waves. With this detailed velocity model it was possible to perform illumination studies, to see where poor illumination might be impacting the imaging and amplitude fidelity of the standard Kirchhoff migration. Indeed it was these poor illumination zones at critical target horizons that led to the least squares migration, although the improvements to be had with respect to signal to noise were certainly also a driving force.
The standard Kirchhoff result (above), and the least squares Kirchhoff result (below) are compared in Figure 3. The circled area shows the poor illumination zone clearly at the Aptian horizon. And this poor illumination zone will also be affecting the potential reservoir horizons just above this. The improvement in the illumination at this point with the least squares migration is striking. Also worth noting is the strong reduction in noise within the section, with the dipping noise trains generated from the complex seabed topography above being much suppressed.
A closer look at amplitude-versus-offset (AVO) behaviour revealed further insights. Figure 4 shows the comparison of some gathers from the standard Kirchoff result (above) and the least squares Kirchoff (below). The analysis is performed at a horizon showing a strong AVO signal. The best fit two-term Shuey line is also plotted in red for each gather. After LS migration, the intercept diminished slightly due to reduced noise, while the gradient rose, reflecting improved illumination and bandwidth recovery. These shifts hinted at more reliable AVO behaviour, a crucial factor for accurate subsurface interpretation. This is also highlighted well by the Intercept*Gradient displays shown in Figure 5.
Amplitude preservation also saw significant gains. RMS amplitude maps across the Aptian interval displayed lower high-frequency noise and flatter, more consistent responses.
Extracting amplitudes around the Aptian horizon highlighted stronger and more coherent reflectivity, confirming that LS K-PSDM preserved vital signal characteristics that conventional migration had struggled to capture. Additional production-level Q compensation further enhanced deep imaging, and any minor edge effects were resolved by deeper, production-scale runs.
LS K-PSDM of the Link 3D survey in Namibia’s Orange basin has revealed clear advantages over conventional Kirchhoff PSDM. Noise is reduced, illumination and continuity improved, AVO stability extended across a wider-angle range, and amplitude fidelity around key stratigraphic horizons is demonstrably improved. The amplitude reliability is key in this process, central to the reliability of the inversion process, and therefore the success of utilising the data for resource uncertainty reduction and delineation. Indeed, comparisons between the migration strategies indicate that LS K-PSDM delivers improved illumination, amplitude balance, and AVO stability, while reducing noise and preserving geological continuity at depth.
In Namibia’s Orange Basin, a number of large discoveries have been made and the race is on to sanction development first. Early infrastructure development in many basins globally has been seen as a key to later commercial success. However, the eagerness to invest must be balanced with the caution of risk and uncertainty reduction. In the geologies of Namibia’s Orange Basin LS K-PSDM could be a weapon of choice for preparing the Link 3D dataset for inversion.
The story of this 3D enhancement would not have been possible without the expertise and dedication of the SPI processing and imaging team at Shearwater GeoServices, Harry Inman, Sam Winters, Tom Earnshaw and Andrew Woodcock, and also the support of the Searcher Namibia project team, who provided access to the vital Link and Bridge datasets.
ADVERTISEMENT


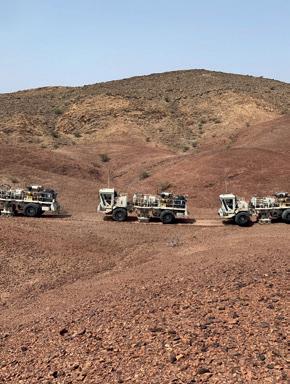


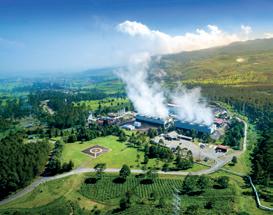


April 2026
7-9 Apr Second EAGE Workshop on Advances in Carbonate Reservoirs: from Prospects to Development www.eage.org
13-15 Apr EAGE Sub-Saharan Africa Energy Forum www.eage.org
28-29 Apr APGCE 2026 Curtain Raiser: 2nd EAGE Workshop on New Discoveries in Mature Basins www.eage.org
May 2026
11-13 May First EAGE/ALNAFT Workshop – Unlocking Hydrocarbon Potential of West Mediterranean Offshore Frontier Basin of Algeria www.eage.org
11-13 May Second EAGE/ALNAFT Workshop on Techniques of Recovery of Mature Fields and Tight Reservoirs www.eage.org
11-13 May 8 th Asia Pacific Meeting on Near Surface Geoscience & Engineering www.eage.org
18-20 May Fifth AAPG/EAGE Hydrocarbon Seals Workshop www.eage.org
19-22 May InterPore2026 www.interpore.org
26-28 May Second EAGE/SBGf Conference on Deepwater Brazil Equatorial Margin www.eage.org
27-28 May EAGE Workshop on Subsurface Intelligence: Harnessing AI/ML to Maximise Asset Value


www.eage.org
2026 Oct First EAGE Workshop on Mobile Shales www.eage.org
6-8 Oct Fourth EAGE Conference on Seismic Inversion www.seismicinversion.org
7-8 Oct Fourth EAGE Workshop on EOR www.eage.org
21-23 Oct 6th EAGE Workshop on Fiber Optic Sensing for Energy Applications www.eage.org
25-27 Oct Sixth EAGE Workshop on Naturally Fractured Rocks www.eage.org
November 2026
2-6 Nov 7 th EAGE Global Energy Transition Conference & Exhibition (GET 2026) • EAGE Carbon Capture and Storage Conference • EAGE Geothermal Energy Conference • EAGE Hydrogen and Energy Storage Conference
• EAGE Offshore Wind Energy Conference www.eageget.org
9-11 Nov Second EAGE/AAPG Geothermal Energy in the Middle East Workshop www.eage.org
11-13 Nov Second EAGE Conference on Energy Opportunities in the Caribbean www.eage.org
16-17 Nov Asia Petroleum Geoscience Conference and Exhibition (APGCE) 2026 www.eage.org
16-18 Nov Second EAGE Workshop on Land Seismic Acquisition www.eage.org
17-19 Nov First EAGE Conference on Petroleum Systems Modeling www.eage.org


We expect to see an evolving focus and growing interest across the disciplines represented by our three circles : oil and gas, sustainable energy, and environment, minerals, and infrastructure. Sponsored by BP, the Aberdeen conference will feature technical and strategic sessions , special discussions on emerging topics, and a compelling programme for executives, experts, and young professionals alike.


BY 15 JANUARY 2026