Navigating Change: Geosciences Shaping a Sustainable Transition
EAGE
TECHNICAL
FIRST BREAK ® An EAGE Publication
CHAIR EDITORIAL BOARD
Clément Kostov (cvkostov@icloud.com)
EDITOR
Damian Arnold (arnolddamian@googlemail.com)
MEMBERS, EDITORIAL BOARD
• Lodve Berre, Norwegian University of Science and Technology (lodve.berre@ntnu.no)
Philippe Caprioli, SLB (caprioli0@slb.com) Satinder Chopra, SamiGeo (satinder.chopra@samigeo.com)
• Anthony Day, NORSAR (anthony.day@norsar.no)
• Peter Dromgoole, Retired Geophysicist (peterdromgoole@gmail.com)
• Kara English, University College Dublin (kara.english@ucd.ie)
• Stephen Hallinan, Viridien (Stephen.Hallinan@viridiengroup.com)
• Hamidreza Hamdi, University of Calgary (hhamdi@ucalgary.ca)
Fabio Marco Miotti, Baker Hughes (fabiomarco.miotti@bakerhughes.com)
Susanne Rentsch-Smith, Shearwater (srentsch@shearwatergeo.com)
• Martin Riviere, Retired Geophysicist (martinriviere@btinternet.com)
• Angelika-Maria Wulff, Consultant (gp.awulff@gmail.com)
EAGE EDITOR EMERITUS
Andrew McBarnet (andrew@andrewmcbarnet.com)
PUBLICATIONS MANAGER
Hang Pham (publications@eage.org)
MEDIA PRODUCTION
Saskia Nota (firstbreakproduction@eage.org) Ivana Geurts (firstbreakproduction@eage.org)
ADVERTISING INQUIRIES corporaterelations@eage.org
EAGE EUROPE OFFICE
Kosterijland 48 3981 AJ Bunnik
The Netherlands
• +31 88 995 5055
• eage@eage.org
• www.eage.org
EAGE MIDDLE EAST OFFICE
EAGE Middle East FZ-LLC Dubai Knowledge Village PO Box 501711 Dubai, United Arab Emirates
• +971 4 369 3897
• middle_east@eage.org www.eage.org
EAGE ASIA PACIFIC OFFICE
EAGE Asia Pacific Sdn. Bhd.
UOA Centre Office Suite 19-15-3A No. 19, Jalan Pinang 50450 Kuala Lumpur Malaysia +60 3 272 201 40
• asiapacific@eage.org
• www.eage.org
EAGE LATIN AMERICA OFFICE
EAGE Americas SAS Av Cra 19 #114-65 - Office 205 Bogotá, Colombia
• +57 310 8610709
• americas@eage.org
• www.eage.org
EAGE MEMBERS’ CHANGE OF ADDRESS
Update via your MyEAGE account, or contact the EAGE Membership Dept at membership@eage.org
FIRST BREAK ON THE WEB www.firstbreak.org
ISSN 0263-5046 (print) / ISSN 1365-2397 (online)
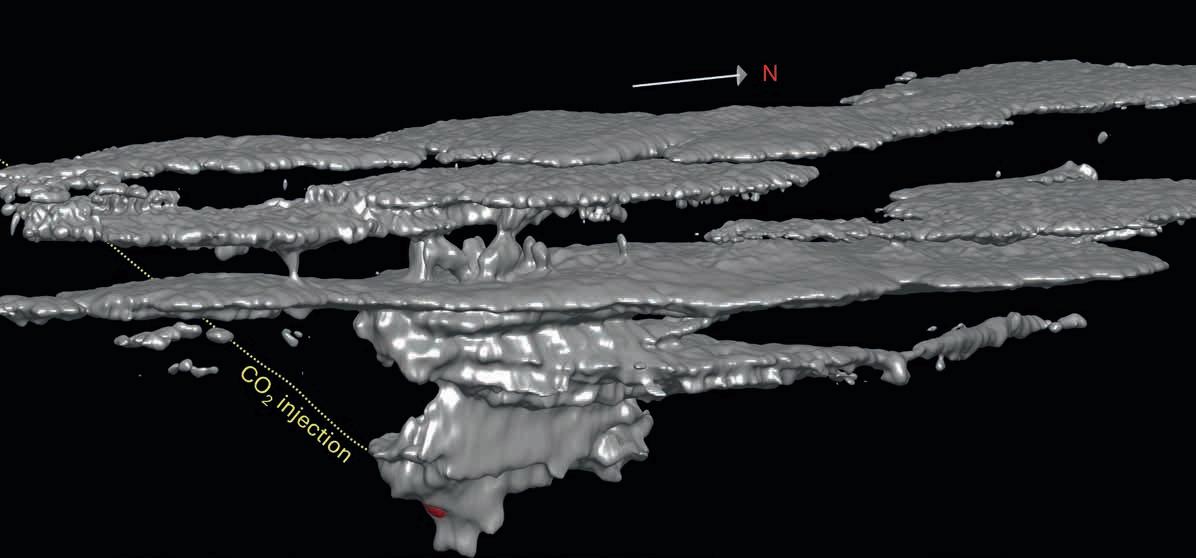
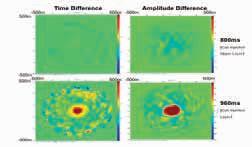
A breakthrough in the imaging of a CO2 plume — using OBN data to the full
25 Detection of CO2 distribution by seismic pulse width analysis using mollifier functions F. P. L. Strijbos
35 Geostatistical AVA seismic inversion for reservoir characterisation of the Pozo D-129 Formation: A case study in San Jorge Basin, Argentina Cecilia Zarpellón, Angie Padrón, Manuel Arijón, Antonio Ornés and Paola Fonseca
Special Topic: Navigating Change: Geosciences Shaping a Sustainable Transition
47 Adapted from the hydrocarbon mindset: Global screening and prospectivity mapping for critical metals with reference to copper and nickel Paul Helps, Graeme Nicoll and Joseph Jennings
57 Mainstream, modular, multi-dimensional: A global agenda for geothermal in 2025 Marit Brommer
61 Revolutionising geothermal heat extraction from abandoned mines for a sustainable energy future
Julien Mouli-Castillo and Jeroen van Hunen
67 Revealing the salt tectonic puzzle: Mesozoic base of the Norwegian North Sea Alena Finogenova, Vita Kalashnikova, Barbara Eva Klein, Marcin Kaluza, Tatiana Nekrasova, Rune Øverås, Vlad Sopivnik, Elena Akhiyarova, Anna Ivanova, Eli Karine Finstad and Natalia Kukina
75 Multicycle injection and withdrawal in sedimentary basins, a multi-disciplinary analysis of pore-scale fluid flow for hydrogen storage
Johnson, J.R, Kiss, D, Shukla, M, van Noort, R, Nooraiepour, M. and Yarushina, V
83 A breakthrough in the imaging of a CO2 plume — using OBN data to the full Vetle Vinje, Ricardo Martinez and Phil Ringrose
89 Geosciences and the Energy Transition: Dispelling the myth, building solutions
Elodie Morgan and Camille Cosson
95 Geothermal is becoming key in the renewable energy transition
Kim Gunn Maver and Thomas Møgelberg
102 Calendar
cover: The city of Toulouse (La Ville Rose) will host the EAGE Annual Conference and Exhibition this month.
European Association of Geoscientists & Engineers Board 2024-2025


Near Surface Geoscience Circle
Andreas Aspmo Pfaffhuber Chair
Florina Tuluca Vice-Chair
Esther Bloem Immediate Past Chair
Micki Allen Liaison EEGS
Deyan Draganov Technical Programme Representative
Eduardo Rodrigues Liaison First Break
Vladimir Ignatev Liaison CIS / North America
Ruth Chigbo Liaison Young Professionals community
Gaud Pouliquen Liaison Industry and Critical Minerals community
Mark Vardy Editor-in-Chief Near Surface Geophysics
Martin Brook Liaison Asia Pacific
Madeline Lee Liaison Women in Geoscience and Engineering community
Oil & Gas Geoscience Circle
Yohaney Gomez Galarza Chair
Johannes Wendebourg Vice-Chair
Lucy Slater Immediate Past Chair
Wiebke Athmer Member
Alireza Malehmir Editor-in-Chief Geophysical Prospecting
Adeline Parent Member
Jonathan Redfern Editor-in-Chief Petroleum Geoscience
Xavier Troussaut EAGE Observer at SPE-OGRC
Robert Tugume Member
Timothy Tylor-Jones Committee Member
Anke Wendt Member
Martin Widmaier Technical Programme Officer
Sustainable Energy Circle
Carla Martín-Clavé Chair
Giovanni Sosio Vice-Chair
SUBSCRIPTIONS
First Break is published monthly. It is free to EAGE members. The membership fee of EAGE is € 85.00 a year including First Break, EarthDoc (EAGE’s geoscience database), Learning Geoscience (EAGE’s Education website) and online access to a scientific journal.
Companies can subscribe to First Break via an institutional subscription. Every subscription includes a monthly hard copy and online access to the full First Break archive for the requested number of online users.
Orders for current subscriptions and back issues should be sent to First Break B.V., Journal Subscriptions, Kosterijland 48, 3981 AJ Bunnik, The Netherlands. Tel: +31 (0)88 9955055, E-mail: subscriptions@eage.org, www.firstbreak.org.
First Break is published by First Break B.V., The Netherlands. However, responsibility for the opinions given and the statements made rests with the authors.
COPYRIGHT & PHOTOCOPYING © 2025 EAGE
All rights reserved. First Break or any part thereof may not be reproduced, stored in a retrieval system, or transcribed in any form or by any means, electronically or mechanically, including photocopying and recording, without the prior written permission of the publisher.
PAPER
The publisher’s policy is to use acid-free permanent paper (TCF), to the draft standard ISO/DIS/9706, made from sustainable forests using chlorine-free pulp (Nordic-Swan standard).
Sanjeev Rajput Vice-President
Laura Valentina Socco President
Martin Widmaier Technical Programme Officer
Andreas Aspmo Pfaffhuber Chair Near Surface Geoscience Circle
Maren Kleemeyer Education Officer
Yohaney Gomez Galarza Chair Oil & Gas Geoscience Circle
Carla Martín-Clavé Chair Sustainable Energy Circle
Diego Rovetta Membership and Cooperation Officer
Peter Rowbotham Publications Officer
Christian Henke Secretary-Treasurer
Our diverse community is driver of change
Valentina Socco, EAGE president, reflects on her year in office.
It has been a great honour to serve EAGE as president during the past year. The vitality of our Association is impressive and witnessing it is a privilege. In a time of great changes, it is not straightforward to adapt and respond to the different challenges that environment, innovation and geopolitics pose for us, but EAGE is not only resilient, it acts as driver of change.
The transformation started two years ago with the introduction of Circles replacing Divisions. The establishment of the new Sustainable Energy Circle continues and supports an extremely active community of members. Its tremendous innovative potential is being expressed through an increasing number of technical communities.
Our Technical Communities tackle strategic topics related to energy transition, sustainable exploitation of natural resources, energy security and related technological developments, including artificial intelligence (AI).
This transformation has also proven highly effective in attracting and engaging new stakeholders in our areas of interest. The 2024 edition of GET, our flagship event targeting global energy transiton, was a remarkable success, seeing attendance increase sixfold compared to 2023, alongside a significant rise in participation from industry and institutions. The numbers for the 2025 edition suggest a further growth to come. It is noteworthy that this event is bringing together researchers, professionals, and companies who never participated in an EAGE event before, confirming that our transformation process expands our horizons, increases our impact, and creates new opportunities for our members.
As part of this evolution, the Near Surface Geoscience Circle will be transformed into the new Environment, Minerals, and Infrastructure Circle (EMI). This new name reflects the expanding scope of the Circle and its mission to serve as a platform for knowledge exchange and innovation in key areas for a growing global population. This includes building sustainable
infrastructures that respect environment and cultural heritage and are resilient to climate forcings; improving land management to mitigate the impact of natural hazards and increase our capability to adapt to climate change; creating a safe environment by controlling and reducing water and soil pollution; providing effective methods for characterisation, monitoring and manage-
ment of water resources; and responding to the growing demand for mineral resources which are strategic for energy transition and technological development. Multi-disciplinary expertise in geoscience and engineering will be increasingly essential to ensuring the sustainability and safety of our development, and the new name aims to communicate these priorities more clearly and connect us with the relevant industries and professionals.
Building the Associated
Borehole seismic courses for everyone
Digital event scores a hit in Edinburgh
EAGE president Valentina Socco at GET 2024.
Among the challenges we face, recent geopolitical developments are promoting cultural models that question science-based decision-making, elevate personal opinions over scientific evidence, casting doubt on the climate and environmental crises, and pushing diversity and inclusion off political agendas. Globally, the scientific research ecosystem is suffering from public disinvestment and political interference.
In this context, EAGE stands as a safe space where academia and industry collaborate, share knowledge, and generate mutual opportunities. However, to be a true driver of change, we must look beyond our comfort zone and engage in the global conversation about the role of geoscience and engineering in society. The recent creation of a new Special Interest Community for Geoscience Communication and Public Engagement is a step in this direction, aiming to enhance public understanding of Earth systems and the role geoscientists and engineers play in the energy transition and other crucial areas.
EAGE remains deeply committed to promoting diversity and inclusion. This is reflected in the wide range of topics addressed by our Technical Communities, the many initiatives led by our local and student chapters, and the efforts of our Women in Geoscience and Engineering and Young Professionals Special Interest Communities. We are also proud to introduce the Rosemary Hutton Award for Best Paper in Geoenergy, which celebrates excellence in sustainable energy and honours an outstanding woman scientist.
EAGE also champions continuous technological development. During the last year, tremendous work has been done to implement AI applications into the digital services offered to our members. New AI applications will be available for supporting delegates at the Annual Conference and for offering new opportunities in navigating EarthDoc.
Our member community is our greatest strength and most valuable asset. Its unwavering support, active participation, energy, and generosity of members in sharing their time and expertise with the Association are key to our continued success, growth, and evolution. On behalf of the Board and the entire Association, I extend my heartfelt thanks and appreciation to each of them.
A warm thanks also goes to our Board of Directors and to our staff at Head Office and in the regions who share our passion and dedication in making EAGE a successful organisation where innovation and creativity are always supported by professionalism.
During this year I have had the privilege and the pleasure to work with a very active and competent Board, whose members I really thank for their availability and commitment.
For the 2025 Annual Conference, we have chosen the theme Navigating Change: Geosciences Shaping a Sustainable Transition. With this we mean to highlight the great potential of our community to propel the change that humanity needs to progress safely and sustainably. I look forward to meeting you in person in Toulouse.
Meet the Chapter champions 2025
At the end of 2024 we launched a special challenge for our Local and Student Chapters worldwide: a competition designed to celebrate and reward their exceptional efforts in recruiting new EAGE members. They definitely rose to the challenge.
Chapters play a vital role in connecting with local professionals, strengthening our global network, and expanding EAGE’s reach. The EAGE Champions initiative was not only a way to recognise their dedication but also an opportunity to win funding for future local activities.
After months of enthusiasm and community-building, we are thrilled to announce the winners:
• Local Chapter London, UK
• Student Chapter University of Lagos, Nigeria
• Student Chapter Ahmadu Bello University, Nigeria
• Student Chapter Kurukshetra University, India
London Chapter reacted to the win: ‘We are immensely grateful to everyone who endorsed us in the challenge. We know
that the competition was high. This year we are specifically focusing on supporting students in the London area. We are planning an initiative where students will be able to present their work to the wider EAGE London community, in line with the topics of our monthly Evening Lectures.’
Members of the Student Chapters at the University of Lagos said: ‘This achievement means a lot to our community. We plan to use the prize money to strengthen our educational workshops, which play a vital role in enhancing our members’ practical experience. This year, we aim to deepen our engagement with local geoscience companies and invest in new learning resources to better support our members’ development.’
Kurukshetra Student Chapter said: ‘This year, we have planned several initi-
atives, including conducting groundwater awareness campaigns in Kurukshetra University to address the local water crisis and empowering underprivileged girls through earth science education to inspire future geoscientists. We will organise field surveys to provide practical exposure to geophysics and implement school outreach programs to promote the relevance of geophysics in society. Our focus will be on hosting workshops, seminars, and field visits to enhance public understanding, as well as developing engaging initiatives such as exhibitions, community activities, and social media campaigns tailored to diverse audiences.’
A huge thank you to all participating Chapters for their hard work and commitment. We look forward to seeing the amazing projects that will emerge from this well-earned recognition.
LEAP WHOLE WORKFLOWS IN A SINGLE BOUND

DUG Elastic MP-FWI Imaging enables simultaneous inversion of reflectivity (3-component, directional, horizontal), P-wave velocity, S-wave velocity, density, P-impedance, S-impedance, and Vp/Vs ratio, providing quantitative-interpretation-ready outputs of the highest resolution and amplitude fidelity — using field-data input. In this example we can readily identify the reservoir location — a beautiful flat spot!
No more jumping through hoops — DUG Elastic MP-FWI Imaging gives you everything you need with one powerful leap.


Congratulations to the winners of EAGE’s 2025 Awards
As an association committed to promoting innovation and excellence for inclusive and sustainable development, EAGE proudly acknowledges the hard work of its members in advancing the field and fostering collaboration across disciplines. Here are this year’s winners that were nominated by colleagues like you.
Desiderius Erasmus Award
For lifetime contributions in the field of resource exploration and development.

Carlos Torres-Verdín
For his contributions to the community, particularly in the fields of formation evaluation and rock physics.
Honorary Membership Award
For highly significant and distinguished contributions to the geoscience community at large or to the Association in particular.

Luigi Zanzi
For his contributions to applied geophysics, particularly in the field of civil engineering.
Conrad Schlumberger Award
For outstanding contributions to the scientific and technical advancement of the geosciences, particularly geophysics.

Tijmen Jan Moser
For his contributions to advancing our understanding in fields of seismic imaging, inversion, and subsurface exploration, and his years serving Geophysical Prospecting
Alfred Wegener Award
For outstanding contribution to the scientific and technical advancement of EAGE’s disciplines, particularly petroleum geoscience and engineering.
Hugh Daigle
For his contributions to both petroleum engineering and new energy-related topics which benefit from his profound understanding of formation evaluation and pore space.
Arie van Weelden Award
For Young Professionals who have made highly significant contributions to one or more of the disciplines in our Association.


Chao Song
For his outstanding work on seismic modelling, inversion, and the integration of deep learning techniques in geophysics.
Myrto Papadopoulou
For her outstanding work on seismic reflection imaging and surface wave analysis toward minerals and geothermal energy exploration, CO2 storage, and geotechnical characterisation.
Nigel Anstey Award
For the Best Paper published in First Break in 2024.
Isabel Espin and co-authors
For their paper ‘Angle-Restricted FWI for Shallow Reservoir Characterisation’.
Ludger Mintrop Award
For the Best Paper published in Near Surface Geophysics in 2024.
Huamei Zhu and co-authors
For their paper ‘A framework for GPRbased water leakage detection by integrating hydromechanical modelling into electromagnetic modelling’.
Norman Falcon Award
For the Best Paper published in Petroleum Geoscience in 2024.
Nigel H. Platt and co-authors
For their paper ‘Footwall uplift and erosion during Jurassic rifting: Scott and Telford fields, Outer Moray Firth, UK Central North Sea’.

Robert Mitchum Award
For the Best Paper published in Basin Research in 2024.
Amando P. E. Lasabuda and co-authors
For their paper ‘Unravelling controls on multi-source-to-sink systems: A stratigraphic forward model of the early–middle Cenozoic of the SW Barents Sea’.
Loránd Eötvös Award
For the Best Paper published in Geophysical Prospecting in 2024
Stephen Secker and co-authors
For their paper ‘Marine vibrator source motion correction for strictly monotonic sweeps’.
Rosemary Hutton Award
For the Best Paper published in Geoenergy in 2024.
Catherine M. Gibson-Poole and co-authors
For their paper ‘Site characterisation of the Endurance CO2 store, Southern North Sea, UK’.
Guido Bonarelli Award
For the Best Oral Presentation at the EAGE Annual 2024.
R. Bachrach and co-authors
For their paper ‘Scholte-Wave Interferometry Using Passive Surface Distributed Acoustic Sensing (S-DAS) with Application for CCS Monitoring’.
EAGE extends its Associated Societies network
EAGE signed three new Associated Society agreements and renewed one in the first half of this year.
One of these new partners is AGAP Qualité (France). By leveraging its expertise on hydrogeology, geotechnics, passive seismic methods, and geophysical technologies for the benefit of the environment, we aim to contribute to the advancement of subsurface geophysics worldwide.
We also joined forces with the Geochemical Society of Japan (GSJ, Japan), a professional association committed to the promotion of geochemistry through technical events and an international peer-reviewed journal since 1953.
Prof Dr Yoshio Takahashi, GSJ president, says that the collaboration will greatly benefit their members by providing them access to ‘short courses and seminars to learn about various fields related to geochemistry in person and online. These platforms are very attractive for our members, especially for young scientists, to learn new things and be involved in international research communities’.
The third agreement was signed in South America with the Colegio de Geólogos de Chile (CGC – Chilean Geologists Board). Created in 1972, the CGC gathers, represents and supports the professional development of Chilean geologists. Thanks to its technical expertise and knowledge of the local/ regional geology, CGC has been invited to support the First
EAGE Conference on the Future of Mineral Exploration, coming on 14-16 October 2025 in Santiago, Chile.
Concluding an active semester, we also renewed our cooperation agreement with AVENIA (France). Even though our partnership began in 2019, we updated its terms to strengthen synergies between our major events; collaborate on European R&D geoscience projects and initiatives; and encourage dialogue between scientific, industrial and societal actors.
We look forward to cooperating with our 98 Associated Societies worldwide to continue making a positive impact on the broader geoscience and engineering community.
Viking battle of wits tests geoscience knowledge in Oslo

It was a lively evening in March when the Oslo Local Chapter hosted a geoscience quiz at the University of Oslo’s Department of Geosciences. The event turned out to be quite the brain-teaser, with questions ranging from the simple to complex on the topics like: paleontology, oil and gas, geophysics and seismic interpretation, planetology, geology of
Norway, paleomagnetism, sedimentology, petrography and mineralogy.
The quiz itself ran smoothly, but it was not just about the score - right answers lit up the big screen and sometimes sparked discussions among contenders and organisers alike.
Geoscience enthusiasts displayed deep knowledge across the board with
the top players getting the right answers to about two-thirds of the questions. It was Ofelia Soledad Silio, from the Research Group for Basin Studies (UiO), who took home the top prize, the huge book Geology of Norway. Post-quiz, the atmosphere buzzed with an informal vibe as attendees unwound with refreshments. Apart from networking, a spontaneous discussion between the board members of the Oslo Students chapter and the Local chapter was sparked about future projects. Overall, the quiz night was a testament to the community’s passion for geoscience and to the fun that can come from combining learning with a touch of competition. Here’s to more such evenings of knowledge and camaraderie.
Collaborating with its associated societies, EAGE aims to further promote knowledge exchange and dissemination.
Beneath the Norwegian landscape lies a hidden world of geoscecrets.
Welcome from GET executive chair
The EAGE Global Energy Transition Conference & Exhibition (GET 2025), in Rotterdam from 27-31 October, will again feature four dedicated technical conferences, all under the theme ‘Powering the Transition: Innovation, Integration & Involvement’. Here Maurice Hanegraaf, market director, TNO GDN, and chair, GET 2025 executive committee, invites us to join forces, innovate, and shape the energy systems of tomorrow.

As chair of this year’s conference, I am proud to bring together experts and pioneers from across disciplines to address the pressing questions of our energy transition.
The conference isn’t just about dialogue, it’s about direction. How do we balance immediate energy needs with long-term climate commitments? How do we scale up geothermal, carbon capture and storage, and energy storage – and harness the full potential of wind power through smarter integration? Our path forward is not defined by technology alone: it also requires the right policies, financial frameworks, and, above all, societal engagement and public trust to truly succeed. Together, we will explore not only what’s possible, but what’s essential for a just, secure and sustainable energy future.
I invite you to connect, collaborate, and be inspired because real progress happens when knowledge meets action. Let’s harness our insights, challenge our assumptions, and shape an energy system for generations to come. I’m honoured to take this journey with you.
Contribute to the Technical Programme and join key stakeholders in shaping the energy transition. Submit your abstract by 15 June 2025. Early bird registration is open until 1 September 2025. Learn more at eageget.org.
Carbon Capture and Storage Conference Geothermal Energy Conference
and Energy Storage Conference Offshore Wind Energy Conference
Nigeria has a new Student Chapter
EAGE’s latest Student Chapter in Nigeria has been launched at Ladoke Akintola University of Technology (LAUTECH). This is what the students have to say.
Our Chapter provides an opportunity for LAUTECH students to engage with a global network of geoscientists, fostering academic and professional growth in geophysics and related fields. We are motivated by a collective desire to advance geoscience knowledge, develop practical skills, and contribute to solving real-world problems through innovative geophysical applications.
We focus on environmental geophysics and digital geoscience applications, as these areas align with global trends and the need for sustainable solutions. We plan to
explore near-surface geophysical techniques for groundwater exploration, contamination studies, and geohazard assessments. We are also keen on integrating geophysics with artificial intelligence, remote sensing, and GIS for better data processing and interpretation.
We are looking forward to participating in EAGE student e-summits, online events and competitions. Additionally, we plan to organise fieldwork, hackathons, and collaborative projects with other student chapters and institutions.
We believe our new Chapter is not just a student organisation but a movement towards innovation, skill development and global networking in geoscience. We are excited about the journey ahead and the opportunities for growth.


Hydrogen
STUDENT CHAPTER
Members of the LAUTECH Student Chapter.
Maurice Hanegraaf.
Advancing borehole seismic for the energy transition
Sébastien Soulas, a leading expert in borehole geophysics, is bringing two new courses to the EAGE Education Catalogue in 2025. He will teach Borehole seismic monitoring for sustainable energy solutions at GET 2025 and VSP technology – From check shot to advanced DAS at the Eight EAGE Borehole Geophysics Workshop (29 September – 1 October, Al Khobar, Saudi Arabia). In this interview, he discusses the value of borehole seismic for the energy transition and the future of distributed sensing.
How do you see borehole seismic methods contributing to the success of geothermal and CCS projects today?
Vertical seismic profiling (VSP) combined with surface seismic can provide a valuable real-time geophysical monitoring technology for reservoir characterisation and management. It can also provide the geologic framework for locating and interpreting events detected by microseismic monitoring. Advancement in downhole sensing technology for active and passive seismic monitoring using a combination of C point and 1-C distributed sensors is becoming an important part of the CCS MMV strategy for full wave recording as well as data integration for geothermal reservoir characterisation. However, it’s important to characterise, technically
evaluate and quantify limitations and merits of each borehole seismic sensing technology and, from an instrumentation standpoint, see how these technologies can be combined and integrated with surface seismic or standalone in a cost-effective way for high resolution imaging, 4D monitoring and microseismic cap rock integrity monitoring.
How do your courses help reposition VSP as a valuable tool for sustainable energy development?
Most of the borehole seismic solutions for both integrated reservoir characterisation and active/passive seismic monitoring are valid and directly transferable beyond oil and gas applications. However, there are key constraining factors associated with monitoring conditions for CCUS where dedicated monitoring wells are not always feasible due to costs and harsh/hot environment for geothermal monitoring. Advanced geophysical exploration and development methods for geothermal fields are like oil and gas technology. This encompasses, for example, derisking the sub-horizontal drilling of geothermal doublets where multi-component VSP can add value including improved reservoir studies even in highly congested suburban areas. Dedicated, fit-for-purpose, cost-effective and, combined with distributed acoustic sensing system, VSP can be very pertinent using decades of in-depth legacy knowledge built from the oil and gas industry.
Who do you think will benefit most from joining your courses?
I do believe that a holistic approach to understand the value and limitations of
borehole seismic data and its complex integration with surface seismic for new energies geophysical monitoring and reservoir characterisation is paramount in the context of the rapid evolution of downhole sensing technology towards data analytics to improve decision-making. Increased needs in permanent monitoring and reducing subsurface model uncertainties via surface seismic calibration with more and more complex signal processing toolbox like FWI and ML is making the process very complex in extracting real business value.

Multi-levels fully passive 3-C fibre optical system being deployed in a borehole.
Experienced and young professionals from geologists, geophysicists, geoscientists and reservoir engineers could benefit in joining the course as it would provide a practical overview of conventional borehole geophysics and highlight its evolution towards using and combining with DAS.
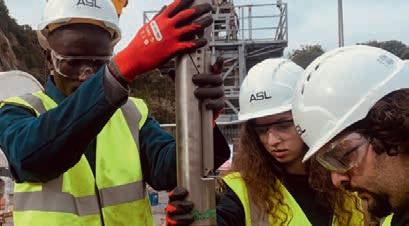
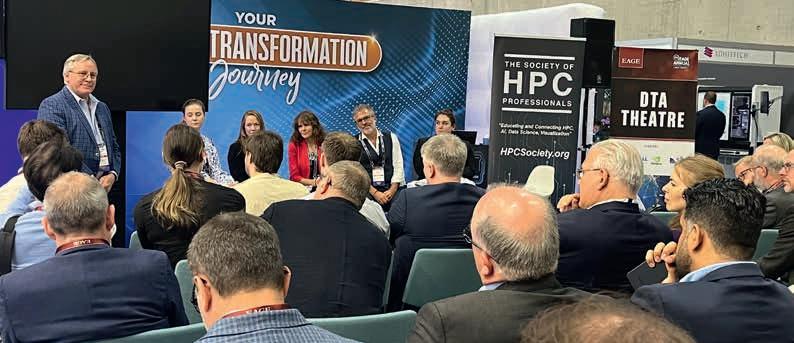
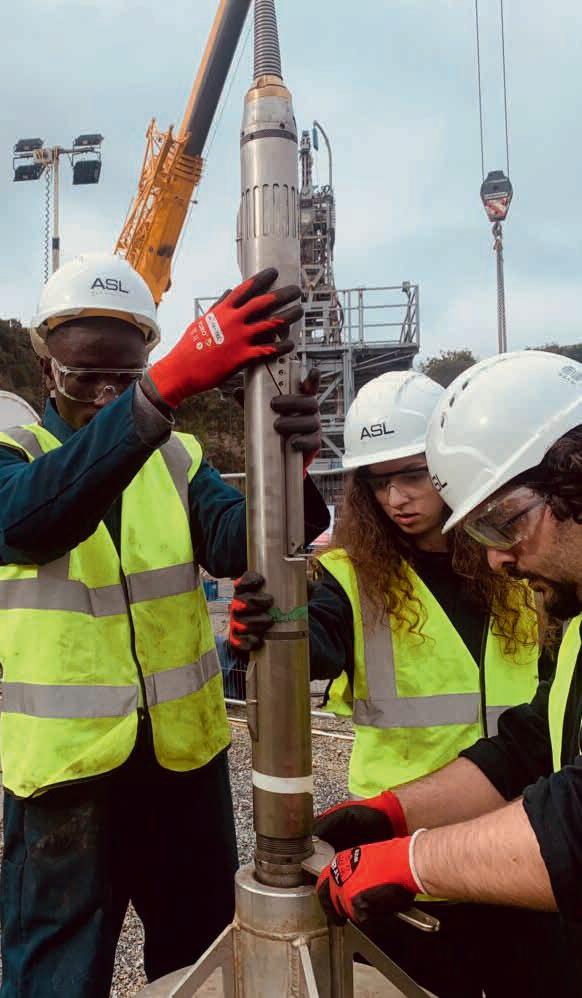
Young professionals at the wellhead at the Avalon HDR geothermal site deploying 3-C VSP tool for training.
Workshops and short course await you at NSG 2025
The EAGE Near Surface Geoscience Conference and Exhibition is renowned for bringing cutting-edge and cross-disciplinary technologies to the forefront of geoscience discussions, and this year’s edition is no exception with some first class short courses and workshops.
Among the highlights of the event is the short course on Satellite InSAR Data:
Monitoring from Space presented by Dr Alessandro Ferretti (TRE ALTAMIRA). This one-day programme resonates powerfully with the parallel meeting on Geohazards Assessment and Risk Mitigation, as well as with the multi-disciplinary nature of the conference, bridging the gap between advanced satellite technologies and applied geoscience applications.
Satellite radar data, particularly from synthetic aperture radar (SAR) sensors, have revolutionised surface deformation monitoring. Capable of measuring sub-centimetre ground displacements over vast areas and long timeframes, InSAR (Interferometric Synthetic Aperture Radar) is a game-changer for geohazards assessment, reservoir management, and environmental monitoring. These tools are no longer confined to specialised remote sensing teams, they are becoming indispensable across disciplines from optimising design and construction operations to identifying at-risk locations and providing early warning for mining assets.
Ferretti’s course is designed with accessibility in mind, offering a clear, practical introduction to how InSAR works and its profound potential for real-
world applications. In fact, InSAR is one of the most multi-disciplinary technologies, with application examples ranging from a reservoir in the Middle East, a volcano in Sicily, and coastal subsidence in the Netherlands. Attendees will benefit from case studies and experience sharing from diverse applications.
The NSG 2025 experience is further enhanced with three fantastic workshops. The first titled Geophysical exploration to volcanological areas: Imaging challenges and public and operational constraints by Pier Paolo Bruno (Università degli Studi di Napoli Federico II) and Paola Ragazzo (Eni) will focus on the latest methodologies for geophysical inversion in volcanological areas, emphasising both active source and ambient noise (passive) seismic data. Additionally, it will explore joint inversion approaches that integrate seismic, gravity, electromagnetic, and other geophysical datasets to enhance understanding of volcanic systems.
The second workshop on Geophysical applications to archaeology: Innovation in acquisition and data modelling by Federico Cella (Università di Camerino), Chiara Colombero (Politecnico di Torino) and Maurizio Milano (Università degli Studi di Napoli Federico II) aims
EAGE Education Calendar
to bring together the international geophysical research community to explore the latest technical and methodological advancements in data analysis, processing and interpretation. Topics will include archaeogeophysical remote sensing, signal enhancement, 3D imaging, joint investigations, and inter-disciplinary synergies between geophysics, petrochemistry and soil science. By refining these approaches, the workshop seeks to highlight their added value in the rediscovery and preservation of cultural heritage.
Lastly, the workshop on Airborne geophysics: Advances and perspectives from different platforms’ by Massimo Chiappini (Istituto Nazionale di Geofisica e Vulcanologia), Gianluca Fiandaca (University of Milano “La Statale”) and Andrea Viezzoli (Emergo), will explore all main geophysical techniques. Looking into advances in data acquisition, integration, processing and modelling. A part of the workshop will be highly interactive, with a live demo on AEM data processing and modelling using open source software. The field of applications includes geologic mapping, environmental geophysics, hydrogeophysics, mining and resource exploration, health and safety, and international security.
1 JUN COMPRESSIVE SENSING, EXPLAINED AND CHALLENGED, BY JAN DE BRUIN TOULOUSE, FRANCE PART OF EAGE ANNUAL 2025 RESERVOIR ENGINEERING FOR HYDROGEN STORAGE IN SUBSURFACE POROUS MEDIA, BY GANG WANG
2 JUN SEISMIC PROCESSING OF MULTIPLES: CONCEPTS, APPLICATIONS, TRENDS, BY CLÉMENT KOSTOV GEOSCIENCE COMMUNICATION AND PUBLIC ENGAGEMENT (EET), BY IAIN STEWART
6 JUN STATE OF THE ART IN FULL WAVEFORM INVERSION (FWI), BY IAN JONES
* EXTENSIVE SELF PACED MATERIALS AND INTERACTIVE SESSIONS WITH THE INSTRUCTORS: CHECK SCHEDULE OF EACH COURSE FOR DATES AND TIMES OF LIVE SESSIONS FOR THE FULL CALENDAR, MORE INFORMATION AND REGISTRATION

Every month we highlight some of the key upcoming conferences, workshops, etc. in the EAGE’s calendar of events. We cover separately our four flagship events – the EAGE Annual, Digitalization, Near Surface Geoscience (NSG), and Global Energy Transition (GET).

Second EAGE Conference & Exhibition on Guyana-Suriname Basin 9-11 September 2025 – Georgetown, Guyana
The Guyana-Suriname Basin has become one of the world’s most exciting offshore exploration frontiers, with over 18 billion barrels of oil equivalent discovered to date. The conference will gather geoscientists, engineers, industry leaders, and regulators to explore the latest developments in exploration, reservoir imaging, drilling technologies, sustainable practices across the basin, and discuss the region’s ongoing transformation into a major global energy hub. We welcome contributions that highlight innovative research, new exploration concepts, case studies and lessons learnt from operations in this dynamic basin.
Registration early fee deadline: 15 June 2025

Third EAGE Workshop on Geothermal Energy in Latin America
12-14 November 2025 – Guancaste, Costa Rica
The workshop will once again serve as a key platform for technical exchange on the development of geothermal energy, a constantly renewable, high-capacity (>80%) resource with low environmental impact with significant potential in Latin America for power generation and direct uses. Geothermal’s geological complexity demands a better understanding of the subsurface geothermal system to mitigate exploration and development risks. Targeting stakeholders across the entire geothermal value chain, the workshop is to focus on new exploration techniques, reservoir characterisation, emerging technologies, regulatory frameworks, environmental and social impact assessment.
Call for Abstracts deadline: 1 August 2025


First EAGE Workshop on Energy Transition in Latin America’s Southern Cone 17-18 September 2025 – Buenos Aires, Argentina
The workshop will provide insights into how the Southern Cone region (including Argentina, Uruguay, Paraguay, Chile and southern Brazil) can develop its renewable resources and restructure its energy infrastructure to transition from traditional high-carbon fuels to low-/zero-carbon and sustainable energy sources. Topics will include: cross-border collaboration, the need for smart grid expansion, investment in storage technologies, innovation and digitalisation, social equity, policy development, workforce transformation, and inclusive planning procedures to support a fair and equitable transition.
Abstract submission deadline: 20 June 2025
EAGE/FESM Conference on ‘Petrophysics meets geoscience: unlocking reservoir potential in a dynamic energy landscape’ 18-20 November 2025 – Kuala Lumpur, Malaysia
The energy landscape is evolving rapidly, demanding innovative approaches to reservoir characterisation. With a focus on practical applications, the event will showcase how these integrated approaches can optimise reservoir management, enhanced hydrocarbon recovery, and support the development of geothermal and carbon storage projects.
In an era defined by the energy transition, this conference is a must-attend for professionals seeking to stay at the forefront of reservoir characterisation and maximise subsurface potential. Kuala Lumpur, a vibrant hub in the heart of Southeast Asia, provides the perfect backdrop for this exchange of knowledge and innovation.
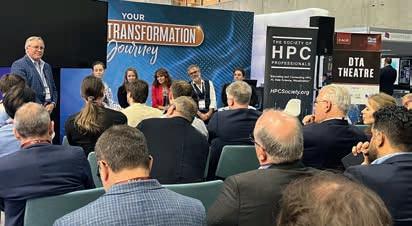
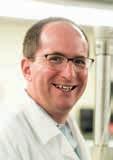
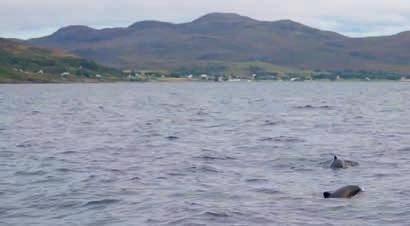
Our flagship digital event in Edinburgh was a huge hit
Glyn Edwards, global subsurface data and AI unit leader at bp and conference chair, and Krystel St Clair, seismic interpretation transformation lead at bp and member of the technical committee, report on the fifth edition of EAGE Digital, held on 24-26 March 2025 in Edinburgh under the theme ‘Enhancing Predictions and Investments with Digital Technologies’. The event marked our largest gathering yet, welcoming over 500 participants and highlighting the increasing momentum around artificial intelligence and the growing impact of next-generation technologies in the industry.
Several key themes emerged during the conference:
Data management & OSDU
The importance of organising and standardising data effectively was a major focus. When leveraging AI, with vast amounts of data in various formats and locations, efficient management is crucial to avoid the ‘garbage in, garbage out’ scenario. AI was highlighted as a tool to clean, organise, and standardise data first which will then make further utilisation of AI more streamlined.
Open Surface Data Universe (OSDU), a platform aimed at standardising data formats and minimising interoperability issues between tools, was highlighted as something the energy industry wants and is committed to. There is no option B, and we all need to actively participate and progress with intention and pace.
Why does this matter? Data is at the foundation of what we do in geoscience, and it is important for us to leverage our vast resources effectively, leading to
better decision-making and operational efficiency.
Generative AI (GenAI)
GenAI, which can create original content from user prompts (like chatbots such as Copilot and ChatGPT) was another significant topic. Discussions centred on balancing the use of large language models (LLMs) and agents with the specific needs of geoscience, which often involves unique terminology not found in natural language. More graphical models such as GraphRAG or geoscience specific models like GeoBERT were discussed to help bridge the gap and help make sense of geoscience data.
It was generally agreed that GenAI is still maturing and is currently too inaccurate to fully understand geoscience and engineering without significant supervision and expert training from SMEs.
Why does this matter? GenAI offers a new way to approach our interpreta-
What participants had to say
‘EAGE Digital is an excellent conference; small enough to allow efficient networking, yet big enough that many of the key decision-makers in digital in our industry are in the same place. High quality keynotes and insightful panels, addressing the big topics with insight and honesty.’
Trygve Randen, SVP digital products & solutions, SLB
‘The key takeaway for me - I think it has to be generative AI. At times, it’s a controversial topic, but we’ve worked
really hard this week to look at it from the positive side: how we can use AI to our advantage? Generative AI allows us all to access and leverage key technologies much more quickly and much more smartly.’
Michael Wynne, vice president, upstream solutions, S&P Global Commodity Insights
‘The presentations highlighted that the current digital transformation is above all a ‘digital integration’: geoscientists now
tion and integration workflows, reducing the time spent searching for data and clicking endless buttons. It can help geos get up to speed in new areas more easily, allowing us to focus on analysing data.
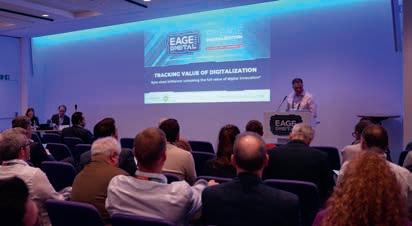
Value tracking
Tracking the value of digital products, which can often have subtle and non-obvious cost savings, was another key theme. While some specific examples were provided by TotalEnergies, bp and Akerbp in one of the dedicated technical sessions, it was clear that this is an area still under development with more work required to support successful deployment of digital products in the industry.
Why does this matter? Accurately tracking the value of digital products helps justify investments and demonstrates their impact on cost savings and efficiency.
leverage AI and digital technologies in every step of the subsurface workflows, from seismic interpretation to reservoir simulation. The energy resources sector has always been very technology-friendly, but what really changes is the pace of innovation. With AI and data science making tremendous progress every year, events such as EAGE Digital are essential to keep track of recent advances and learn from each other’s experience and practices.’
Antoine Bouziat, IFPEN
Industry collaboration
The need for industry collaboration and partnerships was emphasised in order to keep up with rapid AI and technological changes, which are now occurring on a 2–5 year cycle rather than the 10-15 years it would previously take.
Why does this matter? As an industry, we should collaborate in the good times and the bad to stay at the forefront of technological advancements as our challenges are common and we can be known less for being a ‘dinosaur’ industry.
Digital boom
There is a massive increase in digital products and ideas, both externally and internally at bp. We often see assets creating bespoke solutions to problems in tandem with other areas of the business so effective
communication is key to managing these new technologies and ideas efficiently. Why does this matter? Embracing the digital boom allows us to innovate and develop bespoke solutions that can drive business growth and efficiency.
Takeaways
The 5th EAGE Digitalization Conference and Exhibition may well prove to be an inflection point in OSDU adoption. We were surprised by the level of support for OSDU and the strong agreement that it isn’t progressing fast enough. It was one of the most debated topics, with many defending it against doubts about its success. GenAI sessions were consistently well attended, and the David Rowan keynote sparked lively discussion – though there was caution around how applicable other industries’
Signs of revival fuel interest in Libya’s oil and gas sector
After years of uncertainty and underinvestment, Libya’s oil and gas sector is showing clear signs of revitalisation. A series of recent events point to growing momentum and renewed international attention to the country’s vast hydrocarbon potential.
One such signal came from EAGE, which dedicated a second and specialised technical meeting to Libya’s carbonate reservoirs. Held last February, the virtual event – Libyan Carbonates: Carbonate Geology and Its Role in Libya’s Exploration Success – brought together geoscientists and engineers to discuss the complexities of carbonate formations which hold significant promise for future exploration and development. The high attendance of 140 people underscored the industry’s scientific and operational interest in the region.
On the commercial and strategic front, the Libyan National Oil Corporation (NOC) made headlines with the launch of its first
work is to our safety-critical environment. A key takeaway was the significant opportunity for collaboration across many areas, and a growing recognition that we don’t need to compete everywhere – reflected in the TotalEnergies and SLB joint keynote, the open OSDU discussions, and the shared GenAI use cases. The next edition can hopefully build on this by focusing more on how vendor tools are becoming increasingly OSDU-enabled.
We are already excited for the 6th EAGE Digitalization Conference and Exhibition, taking place from 16-19 March 2026 in Stavanger, Norway. Learn more
Mediterranean zones. The shift to a new production sharing agreement (PSA) model is designed to create more attractive terms for investors with the ultimate goal of boosting production capacity from the current 1.4 million barrels per day to 2 million.
These developments, while distinct in nature, both point to a broader trend: a renewed effort to reposition Libya as a viable and attractive player in the global energy landscape. Whether through technical collaboration or strategic investment, the international community is watching and increasingly re-engaging with Libya’s promising oil and gas sector.
Building on this increased activity in Libya and the successes of its earlier events, EAGE is already preparing a third meeting, planned as a face-to-face event, to further strengthen collaboration and networking within the technical and commercial communities.

If you are interested in joining the Technical Committee or helping in different ways to shape the content and direction of this upcoming event on Libya, please reach out to EAGE’s Middle East office via middle_east@eage.org.

How geochemistry contributes to the energy transition
The EAGE-EAG Technical Community on Geochemistry has embarked on a journey to show how the discipline plays a significant role in the energy transition era.
The quest started in September 2024 at the webinar Targeting and predicting key resources of the energy transition, where guest speakers Olivier Sissmann and Adriana Traby (IFPEN) shared their latest research on geochemistry for hydrogen, helium and lithium exploration with over 60 attendees.
One of the takeaways referred to H2 source rocks exploration. Leveraging chemical, e.g., Eh (FO2) data when available from old fluid data in drilling databases, satellite, geophysical (magnetic and gravimetric anomalies), and petrology data, as well as targeting iron mines and related
iron-rich lithologies, seem to be efficient proxies to discover new H2 sources.
In April 2025, the community set its focus on the need for evaluating the potential for geochemical reactions caused by CO2 injection at storage sites — partly to address regulatory demands but also to identify risks related to predicting injectivity impacts. Dr Linda Stalker (CSIRO), together with over 30 participants, explored how to tackle these challenges at the webinar Geochemistry impacts in high quartz systems for injectivity risk management and the art of the negative result
Dr Stalker explained: ‘You can start with simple tools for lower risk sites those with high quartz content in particular. Batch reaction models can be used to determine whether there is a risk of precipitation in res-
ervoir/storage intervals versus dissolution in topseal (shale, mudstone) intervals. Constrained by data, you can develop a series of sensitivity cases and stretch cases to test potential impacts to report to regulators.’
If you missed these discussions, go to the EAGE Youtube Channel to check out the recordings.
Toulouse Annual was due to be their next stop with a workshop on Geochemistry’s role on advancing climate change and energy transition research and a Dedicated Session on Reactive flow and transport in porous media
Connect with the EAGE-EAG Technical Community on Geochemistry to find out what’s next.
Become a reviewer for Petroleum Geoscience and Geoenergy

Are you passionate about advancing geoscience research and want to have a direct impact on the future of your field? Do you want to collaborate with leading experts and contribute to high-quality, peer-reviewed publications? If so, we invite you to become a reviewer for Petroleum Geo-
science and Geoenergy, co-owned journals of the Geological Society and EAGE.
As a peer reviewer, you’ll play a vital role in the rigorous process that ensures the highest-quality research is published. Your expertise will directly impact the accuracy and credibility of studies on key topics such as reservoir modelling, renewables, carbon capture, and energy storage.
Becoming a reviewer offers a unique opportunity to engage with the latest research, sharpen your analytical skills and refine your expertise, while also helping others to improve and refine their work.
Reviewers are acknowledged for their valuable contributions. The Geological
Society publishes a reviewer thank you list each year, providing you with recognition and visibility within the scientific community. In addition, reviews can be effortlessly tracked in your Web of Science profile, showcasing your review work and expertise without compromising anonymity.
Whether you’re an experienced or early career academic, researcher, or industry professional, your insights will be invaluable to the success of both journals. Sign up to become a reviewer and make a lasting impact on your field.
Send your expression of interest to email: lucy.bell@geolsoc.org.uk. The EAGE Student Fund supports student activities that help students bridge the gap between university and professional environments. This is only possible with the support from the EAGE community. If you want to support the next generation of geoscientists and engineers, go to donate.eagestudentfund.org or simply scan the QR code. Many thanks for your donation in advance!
Personal Record Interview
Life shaped by energy, family and purpose

Eugene Okpere is executive vice president exploration, strategy and portfolio, integrated gas and upstream at Shell based in London. He says his international career journey encompassing posts in many countries including Brunei, Nigeria, South Africa, and notably Trinidad & Tobago, has been inspired by his parents, family and faith.
Born into the business
I was born in Birmingham, UK, while my dad was finishing his PhD in mechanical engineering. However, I have no Brummie accent – our family moved back to Nigeria when I was young. As the eldest child in a big family, discipline and my Christian faith were pretty much non-negotiable. My dad, Dr Kisito Okpere, joined Shell in 1972 and went on to lead Shell Nigeria Exploration and Production Company (SNEPCo), so it is safe to say, Shell is in my blood.
Eureka moment
Growing up, I saw how energy could both catalyse progress and present significant challenges. This sparked my decision to pursue geology at the University of Benin, Nigeria. But the real ‘eureka’ moment came during a two-week seismic processing internship, where I watched experts interpret subsurface data. I was hooked.
First experiences
I started my career at Mobil Producing Unlimited in 1991 in Nigeria, gaining hands-on experience with drilling and operations as a well site geologist. I then moved to Shell in Nigeria, marking the beginning of an exciting journey spanning seismic interpretation, exploration and development, new business development, strategy and business planning across several countries including Brunei, Nigeria, UK and the Netherlands.
South Africa move
One defining moment of my career came in 2009 when I joined Sasol in South
Africa to lead its global exploration business. This included the somewhat humorous experience of being mistaken for Denzel Washington during a business trip to Uzbekistan. While I can assure you Denzel’s job is safe, the work was serious – growing exploration across conventional and unconventional assets globally. I returned to Shell, taking on leadership roles across Africa and South America, culminating in senior vice president and country chair in Trinidad and Tobago.
Trinidad and Tobago highlight
Leading Shell in Trinidad and Tobago was one of the most fulfilling chapters of my career. I oversaw upstream gas production and our majority share in Atlantic LNG, a cornerstone of Trinidad’s economy and the company’s LNG portfolio. This role allowed me to combine technical leadership with stakeholder engagement and geopolitical navigation. By working closely with government, community, and international partners, we helped strengthen the company’s position as a key contributor to the Caribbean country’s energy future.
Role in Shell
Currently, based in London, I lead Shell’s global exploration, strategy & portfolio organisation, an integral part of Shell’s strategy to deliver more value with fewer emissions. It’s about discovering and developing assets that can compete for capital against lower-carbon opportunities while providing secure, reliable energy the world still needs.
Meaning of diversity
Real diversity goes beyond ticking boxes. Diverse backgrounds challenge thinking, strengthen teams, and lead to better decisions. I’ve seen first-hand how leadership is enhanced when it reflects the world we live in.
Faith and family
My Christian faith is my anchor. If I were stranded on an island and could bring only one thing, it would be my Bible – without hesitation. Family is just as central to who I am. My wife, Violet, a civil engineer, is a powerhouse in her own right, currently Shell’s vice president for contracting and procurement, projects and technology. With Shell’s support for dual careers, we’ve had the opportunity to raise our two children across several continents, embracing every chapter of life together.
Legacy in motion
Energy isn’t just my career; it is woven into my family’s history. My dad helped shape Nigeria’s oil and gas sector, and over the years, several relatives – including my own daughter – have forged their own paths in an industry that powers economies and shapes lives worldwide. I believe deeply in mentorship, in the power of legacy, and in leadership rooted in values, integrity, and purpose. These principles have guided my journey.
As a child, I dreamed of becoming an astronaut. While I may not have made it to space (yet!), spending my life exploring the mysteries beneath our feet has been just as thrilling.
CROSSTALK
BY ANDREW
M c BARNET

Coming to terms with chaos
Even as we focus on our Annual meeting in Toulouse this month, it will be hard to steer clear from discussing the extraordinary impact on the political and economic world order ignited by the craziness of President Trump’s first 100 days of his second administration which he celebrated last month with a now, all too familiar, MAGA rally.
There is a clear and present threat to our geoscience and engineering community that near-term assumptions about investment in the energy sector will be disrupted, and not in a good way. The longer term is not so concerning as the fundamentals of global energy supply and demand into the foreseeable future and the inescapable need to address climate change issues remain a constant.
Not many things in this life are certain. For Benjamin Franklin (1706-1790), American founding father, diplomat and a true polymath with literary and scientific interests, it was famously death and taxes. To which these days we could add climate change. Its potential impact looms over everything we do as individuals, communities and countries. We may already be behind the clock in meeting the 2050 Net Zero targets, not even close in some people’s view, and we may also be witnessing a hopefully temporary loss of momentum due to tariff war confusion and a hangover of post Covid weariness.
acceptance speech, he stated quite unequivocally, if regretfully, that the old economic order that has basically served the world since the end of the Second World War is broken. This was a judgment that went beyond resentment at Trump’s baffling musings over Canada becoming America’s 51st state. In other words, the US under Trump is a loose cannon and no longer to be regarded as a reliable ally, trading partner, or reassuring anchor when times are tough.
‘The longer term is not so concerning’
There are some easy conclusions to draw from this drama. First and foremost is the creation of uncertainty in the workings of the world economy. Whether this plunges us into recession as a result is a moot point at this juncture. Among other things, tariffs portend higher consumer prices, supply chain disruption, reduced international commerce and slower economic activity especially for countries dependent on exports, just how seriously remains to be seen. For what it’s worth at the time of writing, the US economy had its worst quarter in three years, with GDP shrinking at the equivalent of an annual rate of 0.3%. Consumer confidence around the globe is ebbing.
Right now the analysts are having a field day elaborating endless scenarios guessing where Trump’s chaotic policy-making may lead. What is irrefutable is that governments worldwide are beyond writing off as an ‘art of the deal’ negotiating tactic the president’s unexpected, apparently limitless power to employ Executive Orders to unilaterally impose or lift tariffs on just about every country on the planet except Russia.
For example, Mark Carney, newly elected prime minister of Canada, is probably one of the sanest voices in the international financial world with experience as former governor of both the Bank of Canada and the Bank of England. In his election
If economic disarray takes hold, everyone will inevitably look to the price of oil for guidance. In advancing his ‘America First’ agenda, Trump has consistently argued for lowering the cost of oil. This makes total sense for the US as the world’s largest producer: cheaper gas prices at the pumps and lower costs for oil-dependent industries such as transport, manufacturing and agriculture should be beneficial to company profits and goods and services for consumers.
Logically, lower oil prices should provide a boost to the world economy, but historically this has not proven the case. The reasons are not that complicated. As we have seen in various crises over time, recession is likely to occur when supply outstrips demand. An oil glut is very much on the cards if tariffs do suppress demand for oil as seems likely. For example, it will not require much to burst the dam holding back oil supply. OPEC+ has been struggling to maintain discipline
in constraining production precisely because over-supply hurts those member countries which depend heavily on crude export for revenue. Any sign of recession that brings prices down is out of OPEC+ control, but it creates a situation that invites a free for all with producing countries trying to make up their revenues by increasing their volume of sales.
President Trump is already aiding and abetting a possible price collapse by pushing his ‘drill baby drill’ mantra. This may prove mission impossible, and is undeniably wrong-headed. Under his predecessor President Biden, the US reached record oil production so there may not be much room for expansion, especially, if as many speculate, the years of the shale boom may be coming to an end. It is said that making production more efficient has been the key to profitability in recent years for shale operators. The US Energy Information Administration (EIA) recently estimated that shale oil production will peak at 10 million bpd in 2027, up from about 9.69 million bpd this year, declining thereafter to about 9.33 million bpd by 2050.
Which brings us to global oil and gas investment and the price at which this is viable. According to Statista, on 28 April 2025, the Brent crude oil price stood at $64.73 per barrel, compared to $62.05 for WTI oil and $68.16 for the OPEC basket. Crude oil prices were the lowest they had been in four years following introduction or threat of widespread trade tariffs. Rystad Energy, reporting before the Trump administration took office, found that onshore Middle East was the cheapest source of new production, with an average breakeven price of just $27 per barrel. The segment also boasted one of the most significant resource potentials. Offshore shelf was the next cheapest ($37 per barrel), followed by offshore deepwater ($43) and North American shale ($45). Conversely, oil sands production break-evens averaged $57 per barrel, but could go as high as $75.
which has meddling form in the energy business, has built a 5% plus stake in bp in a campaign to have the company do more in the way of a pivoting from renewables on the basis that the Net Zero agenda imposed ‘massive costs’ and was a ‘drag on growth’.
These developments in themselves may not be too much of a setback because the energy transition does not and cannot depend on oil/energy company funding and decarbonisation initiatives. But they may reflect an escalating vocal feeling, most conspicously expressed by right of centre parties in many countries, that the proposed or actual level of public spending on tackling climate change cannot be justified.
It is an easy target for government critics because unlike long-term spending, say on a multi-year low cost housing programme, there is unlikely to be a tangible result, e.g., we will need scientists to confirm that decarbonisation is actually happening. The obvious exceptions are wind power and solar energy which are as much as about reducing electricity cost as saving the planet and do not address many of the carbon emission reduction issues or the requirement for consistent provision of power.
‘It is an easy target for government critics’
We are in a place where such hostile sentiments will likely propagate if we cannot come up with convincing counter arguments that persuade the sceptics, encourage the many who instinctively recognise the need for action if not the form it should take, and at least appease the more vehement Net Zero activists.
The problem all too familiar to the EAGE community is that there is no single solution. For instance, the article in this issue of First Break by Elodie Morgan and Camille Cosson and in the previous month by Mike Lakin and the special energy briefing for the Annual provided by S&P Global Commodity Insights, indicate that we are all working with the same data in trying to resolve the energy trilemma.
Those numbers will surely have changed simply as a result of probably quite significant increases in the cost of materials and services as a result of the inflationary pressure of tariffs. But of course industry investment sentiment also has to be taken into account. A few months ago the big oil companies were expected to maintain or marginally increase their expenditure on new production following the familiar rubric of exploiting existing or near-field reserves and engaging in areas promising predictable major hydrocarbon riches, e.g., offshore Brazil, Gulf of America, the Caribbean, offshore Namibia, etc.
The strategy may still remain in place even as oil industry profitability comes under pressure amplified by the need to meet stakeholder expectations. Crucially the strain is taking its toll on investment in the energy transition. Shell, TotalEnergies and Equinor have all pared back their commitments to focus on their main business, but without seriously abandoning the cause. As reported in the Financial Times, hedgefund Elliott Management,
If we are honest it is a tough sell. Pointing this out in the public domain has got former British Prime Minister Tony Blair into hot water in some quarters for seemingly going soft on Net Zero in support of corporate interests. The admirably comprehensive The climate paradox: Why we need to reset action on climate change published by the Tony Blair Institute for Global Change, faultlessly all the issues from technical solutions to climate justice. In his forward, Blair states the incontrovertible truth about energy transition that ‘there is no proper process in place that allows the detailed and complex policy work to be done, mandated by the few nations that can make a real difference to climate change … A new cooperative approach to technological solutions could be a galvanising next chapter – focusing political and real capital on alternative fuels and carbon-capture technology, including financing, deployment and R&D.’
EAGE members will surely say amen to that.
Views expressed in Crosstalk are solely those of the author, who can be contacted at andrew@andrewmcbarnet.com.


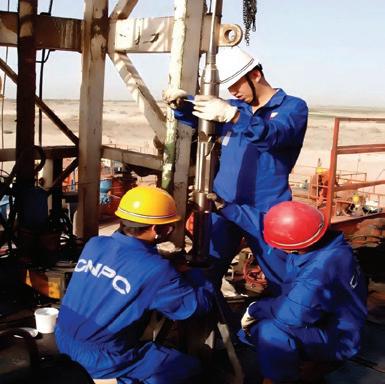
BGP Borehole Geophysics


Pioneering advanced borehole technology solutions


Core business areas


As a leader in borehole technologies innovation, we specialize incutting-edge borehole technologies using fiber-optical sensing techniques, delivering real-time, high-resolution insightsinto reservoir dynamics, geomechanical behavior, and fluid movement. Our solutions empower the E&P industrywith advanced monitoring and data-driven decision-making, optimizing exploration, production, and long-term reservoir monitoring—while ensuringenvironmental safety and sustainability.
VSP surveys – 3C downhole geophone array VSP and DAS-VSP surveys for high-resolution structural imaging around wellbores and formation fluid boundary mapping and tracing around wellbore.

Joint borehole-surface seismic data acquisition – Integrating surface and downhole seismic data for enhanced subsurface imaging.

Long-term reservoir dynamic monitoring – Tracking fluid changes and movements, pressure, and production effects over time.
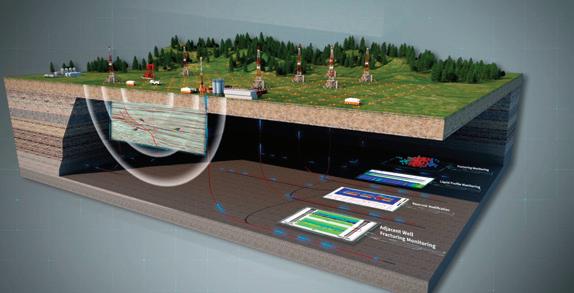
Micro-seismic monitoring – Real-time fracture mapping and induced seismicity detection for hydraulic fracturing, oil/gas storage field and CCS/CCUS monitoring.
Downhole fiber-optical sensing deployment – Enabling highresolution downhole DAS (distributed acoustic sensing), DTS (distributed temperature sensing), and DSS (distributed strain sensing) monitoring.

Key technologies
Vertical seismic profiling (VSP):
Zero Offset VSP
Offset VSP
Walkaway / Walkaround / Walkabove VSP
3D-VSP & Time-Lapse (4D) VSP
Fracturing & geomechanical monitoring:


Micro-seismic monitoring for hydraulic fracturing
Integrated oil/gas storage &CCS/CCUS site integrity monitoring


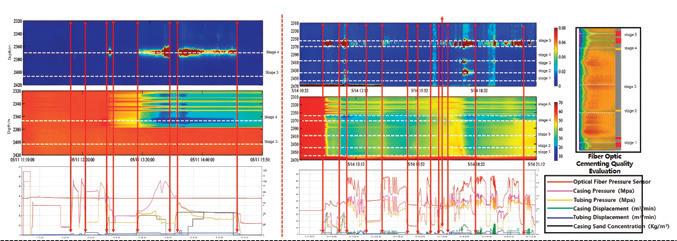
Fiber-Optical pressure sensor interrogator: DAS & DTS Interrogator Development & Manufacturing– High-performance, ruggedized systems for downhole and surface applications.
Downhole Fiber-Optical Pressure Sensor


Joint high density and 3-D DAS-VSP data acquisition
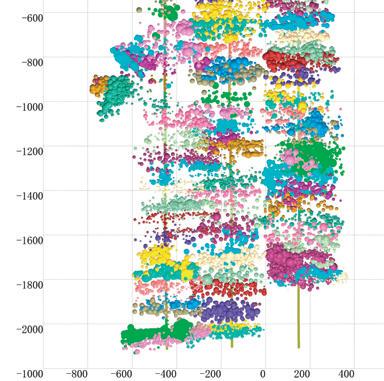
3-components micro-seismic monitoring
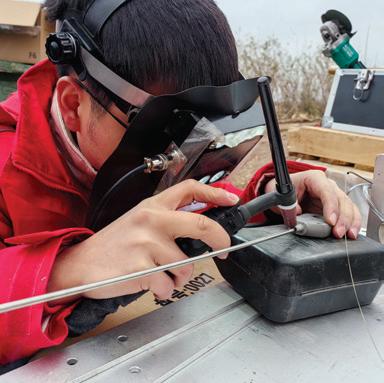
Downhole deployment optical fiber
INDUSTRY NEWS

Global renewables capacity rises by record 15%
Global renewable energy capacity has increased by 585 GW in the past year, according to the International Renewable Energy Agency (IRENA)’s Renewable Capacity Statistics 2025.
A record rate of 15.1% annual growth surpasses a growth rate of 14.3% in 2023. As the cost of electricity produced from most forms of renewable power continues to fall, renewables are becoming an increasingly cost-effective power source, said IRENA.
‘2024 marks yet another benchmark in renewable energy capacity and growth. The historic expansion is strong evidence of both the economic competitiveness and the scalability of renewables, prompting a clean energy revolution that can help the world to achieve its target to triple renewable power capacity by 2030 – if challenges are addressed.’
Overall, renewables accounted for 92.5% of total power capacity expansion in 2024, up from 85.8% in 2023. Their share in the world’s total installed power capacity rose from 43% to 46.4% during the same period. Solar and wind remained key to this momentum, jointly accounting for 96.6% of net renewable expansion.
Solar energy remained the driving force behind this expansion, responsible for 42% of the total global renewable power capacity mix. The solar sector alone grew by 32.2%, adding almost 452 GW to reach a total capacity of 1865 GW worldwide. Solar photovoltaic (PV) tech-
nology accounted for virtually all solar capacity growth, demonstrating its continued cost-effectiveness and scalability, said IRENA. In 2023 the global weighted average cost of electricity from new solar PV projects dropped by 12%, the steepest decline among major renewable sources.
Regional disparities in renewable energy capacity deployment intensified
tions decline from 1.1 GW in 2023 to just 0.7 GW in 2024. Africa’s capacity grew by only 4.2 GW and the Middle East by 3.3 GW.
Despite a record growth rate, progress still falls short of the 11.2 terawatts needed to align with the global goal to triple installed renewable energy capacity by 2030, said IRENA. If the current
from 2023 to 2024, with Asia strengthening its dominance from 69.3% to 72% of global additions at 421.5 GW. China alone accounted for more than 88% of Asia’s increase. By contrast, Central America and the Caribbean contributed the least with only a 3.2% share of the global addition, while the Small Island Developing States saw their contribu-
growth rate persists, the world will be approximately short 0.8 TW by 2030. Achieving the target now requires an annual growth rate of 16.6% until 2030, it added.
IRENA called for more ambitious renewable energy targets in the next round of the Nationally Determined Contributions (NDCs).
TGS expands Mauritania
Indonesia awards oil and gas contracts
OWIC plans to regulate underwater noise
Wind, along with solar, accounted for 96.6% of net renewable expansion.
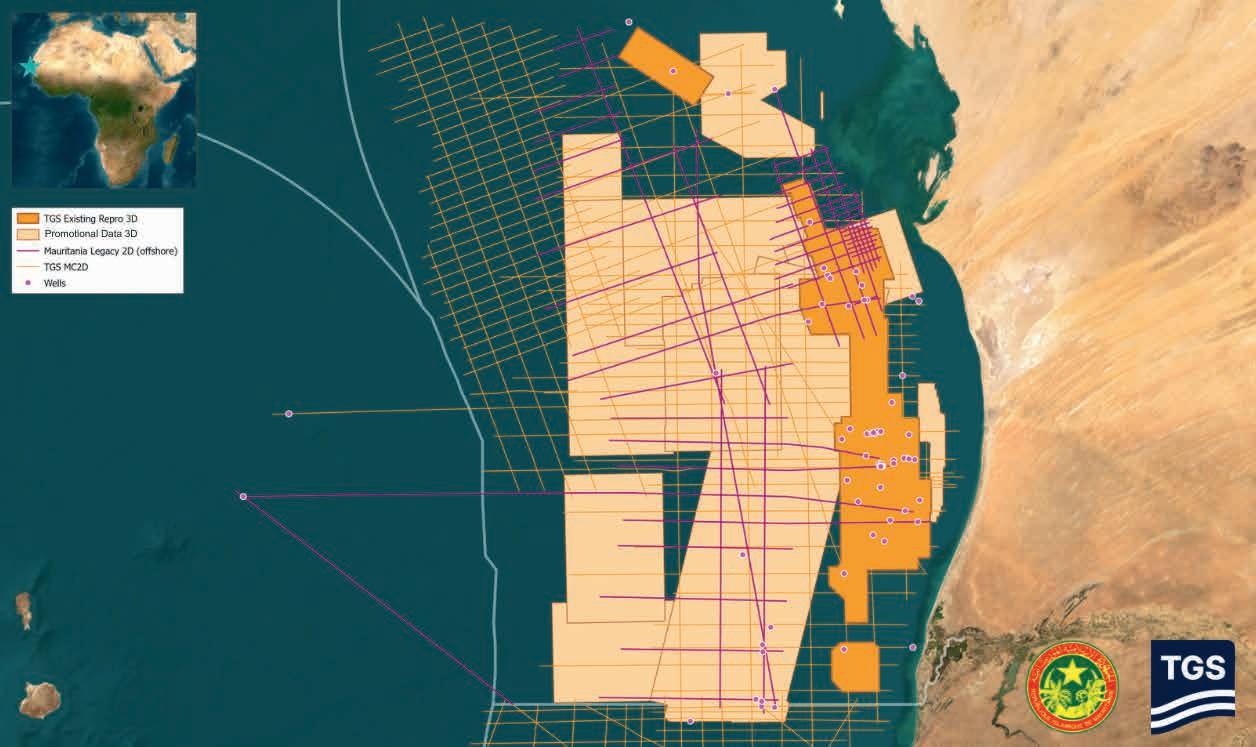
TGS expands offshore Mauritania 3D data
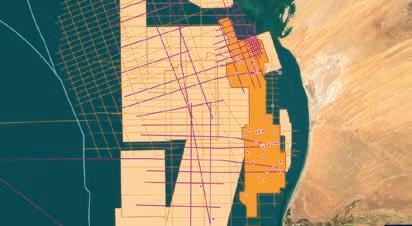
TGS has significantly expanded its multi-client data library offshore Mauritania, with the addition of more than 101,500 km2 of 3D seismic data.
The expansion adds to the existing library of more than 19,000 km2 of reprocessed PSDM 3D seismic data and multiple regional 2D seismic surveys. Together, these integrated datasets provide a more comprehensive and nuanced view of the subsurface, helping to refine known plays while revealing new exploration opportunities, said TGS.
‘Early insights are emerging through the combination of regional geological knowledge and detailed mapping of trap trends, spanning from shelf-edge wells to deeper outboard fairways,’ the company added. ‘Notably, evidence of Late Cretaceous channel-fan systems within the basin domain is providing a fresh perspective into the region’s hydrocarbon potential.’
Mohamed Ould Khaled, the Mauritanian Minister of Energy and Petroleum, said: ‘With the extension of our offshore data library with new 3D seismic data, Mauritania is opening the door to a new era of
energy exploration. Our rich, underexplored basins and stable investment climate make Mauritania one of the most exciting frontiers for oil and gas. We are ready to work hand in hand with international partners to unlock this immense potential and deliver long-term, mutually beneficial growth.’
David Hajovsky, executive vice-president of multi-client, TGS, said: ‘Aside
from greatly expanding the quantity of high-quality multi-client subsurface data in West Africa, the true value of this extensive regional study lies in its ability to contextualise borehole data across the area. By re-evaluating historical exploration results exploration teams are better equipped to derisk future ventures and make informed investment decisions.’
Indonesia awards five oil and gas contracts

Indonesia has announced the winners of the Direct Bidding Auction for Phase II of Oil and Gas Working Areas (WK) in 2024, consisting of WK Kojo, WK Binaiya, WK Serpang, WK Gaea and WK Gaea II.
Etan Fleet Ltd has won the Kojo area and will do a G&G study and acquire and process 500 km2 of 2D seismic data.
A consortium of PT, Pertamina Hulu Energi, PC North Madura II, and SK
Earthon Co have won the Binaiya area and will carry out a G&G study along with acquiring and processing 400 km2 of seismic data.
A consortium of PC North Madura II, Inpex, and SK Earthon has won the Serpang area and will carry out a G&G study along with acquiring and processing 400 km2 of seismic data.
A consortium of Enquest, PT Agra Energi, bp, MI Berau, CNOOC, ENEOS Xplora, Indonesia Natural Gas Resources Muturi, and KG Wiriagar has won the Gaia area and will carry out a G&G study along with acquiring and processing 150 km2 of seismic data.
A consortium of Enquest, PT, Agra Energi, bp, MI Berau, CNOOC, ENEOS Xplora, Indonesia Natural Gas Resources Muturi Inc and KG Wiriagar has won the Gaea II area and will carry out G&G studies along with acquiring and processing 100 km2 of seismic data.
The five winners winning consortiums have pledged to invest a total of $21.7 million for the first three years of the exploration period.
‘In the last 4 years, since the oil and gas working area tender with more attractive terms and conditions, 24 new Cooperation Contracts have been signed,’ said Tri Winarno, Indonesia’s acting director general of Oil and Gas.
The country’s Ministry of Energy and Mineral Resources has pledged to support increased oil and gas production by optimising technology, including horizontal multi-stage fracturing and the implementation of enhanced oil recovery (EOR).
The second strategy is reactivation of idle wells and fields and thirdly the government will conduct massive exploration. In the next two to three years, around 60 oil and gas work areas will be prepared.
TGS multi-client library offers a comprehensive view of the subsurface offshore Mauritania.
US develops new oil and gas programme
The US Bureau of Ocean Energy Management is developing a new schedule for offshore oil and gas lease sales on the US Outer Continental Shelf.
BOEM will soon publish in the Federal Register a Request for Information and Comments on the preparation of the 11 th National OCS Oil and Gas Leasing Program. This publication will initiate a 45-day public comment period and serve as the initial step in the multi-year planning process.
A new planning area offshore Alaska – the High Arctic – is being established as the 27th OCS planning area. Additionally, boundaries of other existing planning areas are being updated to align with BOEM’s revised jurisdiction.
Once finalised, the 11 th National OCS Program will replace the current 10th Program (2024-2029), which includes just three lease sales over five years – all located in the Gulf of America.
As of 1 April 2025, BOEM manages 2227 active oil and gas leases covering approximately 12.1 million acres in OCS regions. Of these, 469 leases are currently producing oil and gas.
In fiscal year 2024 alone, production from OCS leases accounted for approximately 14% of domestic oil production and 2% of domestic natural gas production, yielding $7 billion in federal revenues.
BOEM’s most recent assessment estimates a mean of 68.79 billion barrels of undiscovered oil and 229.03 trillion cubic feet of natural gas.
Earlier this year, the Trump administration reaffirmed its commitment to offshore energy development with Executive Order 14154, ‘Unleashing American Energy,’ to ‘encourage energy exploration on federal lands and waters including the Outer Continental Shelf’.
PXGEO appoints Chuck Davidson as executive chairman
PXGEO has appointed Chuck Davison, Jr as executive chairman and chief executive officer.
Davison Jr brings more than 30 years’ experience in growing and modernising international energy businesses and particular expertise in subsea technologies, services and products. His previous roles include chief operating officer at Oceaneering International and chairman of Magseis Fairfield.
He also held the position of chairman and CEO at Fairfield Geotechnologies, leading a major turnaround and transformation of the company.
In parallel to his new role at PXGEO, Davison Jr will continue to lead EnerMech, a technical solutions company for the energy industry, which shares the same shareholder as PXGEO.
As part of the transition, founder Peter Zickerman will continue as PXGEO
vice-chairman and chief development officer, and will continue to serve on the board.
Meanwhile, PXGEO has expanded its subsea offering with the acquisition of Modus Subsea Services, a provider of offshore life-of-field support services specialising in autonomous subsea operations using Underwater Intervention Drones (UID) based on the Saab Sabertooth platform. The company has also developed and commercialised the industry’s first-ever UID subsea residency solution.
‘PXGEO and Modus Subsea Services will leverage their respective technological expertise and enhance their subsea autonomous offerings to provide their customers with a range of benefits, including increased efficiency, reduced exposure, and a lower environmental footprint,’ said PXGEO in a statement.
The UK North Sea oil and gas joint venture between Shell and Equinor will be headquartered in the Silver Fin building in Aberdeen city centre. With Shell and Equinor each holding a 50% stake, the joint venture will take over stakes of Equinor’s Mariner, Rosebank and Buzzard fields and Shell’s Shearwater, Penguins, Gannet, Nelson, Pierce, Jackdaw, Victory, Clair and Schiehallion fields.. It will be the UK’s largest independent producer.
US natural gas production remained relatively flat in 2024, growing by less than 0.4 billion cubic feet per day (Bcf/d) compared with 2023 to average 113 Bcf/d, according to the US Energy Information Administration. Production growth in the Permian was offset by declining production in the Haynesville and relatively flat production in Appalachia.
Eni has reported first quarter operating profit of $4.2 billion, net profit of $1.6 billion, and adjusted cash flow of $3.9 billion. Gross capex was $2.2 billion.
Exxon Mobil has agreed with Calpine Corporation to transport and permanently store up to 2 million metric tons per annum (MTA) of CO2 from Calpine’s Baytown Energy Center near Houston. This is part of Calpine’s Baytown Carbon Capture and Storage (CCS) Project that is designed to capture the facility’s CO2 emissions, enabling the 24/7 supply of low-carbon electricity to Texas customers as well as steam to nearby industrial facilities.
In response to President Donald J. Trump’s declaration of a ‘National Energy Emergency’, the US Department of the Interior is implementing emergency permitting procedures to accelerate the development of domestic energy resources and critical minerals. These measures are designed to ‘expedite the review and approval of projects related to the identification, leasing, siting, production, transportation, refining, or generation of energy within the United State’s. The new permitting procedures are designed to take a ‘multi-year process’ down to 28 days. BRIEFS
UK’s First CO2 injection test takes place at the Poseidon project in the North Sea
Perenco, Carbon Catalyst and Harbour Energy have conducted the UK’s first offshore CO2 injection test at the Poseidon project in the North Sea. The project involved injecting liquid CO2 into a heavily depleted North Sea gas field, achieving injection rates above 1 million tonnes per annum (Mtpa).
‘This technical feat wasn’t just an operational success — it was a critical derisking milestone for both the Poseidon project and the broader CCS industry, providing concrete evidence that repurposing the UK’s mature offshore infrastructure for CO2 storage is not only possible, but commercially viable,’ said the project partners.
The Leman gas field, the UK’s largest legacy gas field, located at the southern edge of the Southern North Sea (SNS), has produced over 14 trillion cubic feet (Tcf) of gas. Leman now has an estimated storage capacity of 1 billion tonnes of CO2.
‘Sitting within reach of some of the UK’s major emission hubs — including London and the South East — Poseidon is also ideally positioned to receive CO2 from Europe’s industrial corridors, such as the German Rhine Valley, the Netherlands, Belgium and Northern France,’ said the partners.
Over a three-month trial, the team executed a rigorous CO2 injection programme into the Leman H fault panel, utilising the Leman Hotel unmanned wellhead platform and a previously suspended gas well.
The goals of the injection test were to generate hard data on the viability of storing CO2 in offshore depleted gas reservoirs at commercial rates of injection; confirm the potential for repurposing existing infrastructure, from topsides to well completions, for cost-effective CCS deployment; introduce advanced Measurement, Monitoring, and Verification (MMV) technologies capable of tracking CO2 flow, pressure changes and well integrity; demonstrate stable CO2 injection at scale across gas, super-critical and liquid phases; test the boundaries around the CO2 fluid properties and behaviour as it flows from well head to bottom hole and then into the geological store; and assess the operability of the system and its capacity to maintain liquid-phase injection at Mtpa levels.
A total of 4000 tonnes of food-grade CO2 was sourced from Air Liquide’s Netherlands facility. From there, it was shipped across the North Sea via the Atlantic Carrier supply vessel to Petrodec’s ERDA jack-up rig, which had been outfitted with a CO2 injection package including 24 cryogenic ISO tanks. These 20-ft tanks enabled the controlled injection of 400-ton liquid CO2 batches into the reservoir via the adjacent wellhead.
‘This complex setup not only enabled continuous, high-rate injections but also tested the practicality of offshore liquid-phase transport and storage — key learnings for future commercial deployment,’ said the partners.
The partners secured the first CO2 well test consent from the North Sea Transition Authority (NSTA) and Offshore Petroleum Regulator for Environment and Decommissioning (OPRED).
Poseidon’s MMV programme included Vertical Seismic Profiling (VSP) using Distributed Acoustic Sensing (DAS), passive seismic monitoring, and seabed DAS via telecom cables already laid on the seabed. ‘These techniques aimed to understand the capabilities of geophysics to track the pressure front as it moved through the reservoir, providing real-time insights into CO2 migration and model conformance — crucial for long-term storage safety and regulatory compliance,’ said the partners.
More than 15 full injection cycles were executed with stable injection achieved across all CO2 phases — gaseous, super-critical, and liquid. Commercial-scale injection rates of 1 Mtpa were achieved, limited only by topside facility constraints.
‘The results point to a viable commercial case for repurposing depleted reservoirs,’ said the partners.
Test data will be integrated into the front-end engineering design (FEED) for a commercial-scale development. Meanwhile, discussions continue with the UK Government on an appropriate business model. A CCS storage permit application is expected in 2026, with a Final Investment Decision (FID) targeted for 2027. First injection is slated for 2029.
US increases estimate of oil and gas reserves in the Gulf of America
The US Department of the Interior has significantly increased its estimated oil and gas reserves in the Gulf of America Outer Continental Shelf.
The Bureau of Ocean Energy Management’s analysis reveals an additional 1.30 billion barrels of oil equivalent since
2021, bringing the total reserve estimate to 7.04 billion barrels of oil equivalent. This includes 5.77 billion barrels of oil and 7.15 trillion cubic feet of natural gas – a 22.6% increase in remaining recoverable reserves.
BOEM’s updated assessment evaluated over 140 oil and gas fields, identi-
fying 18 new discoveries and analysing more than 37,000 reservoirs across 1336 fields in the Gulf. The review added 4.39 billion barrels of oil equivalent in original reserves, up from the previous estimate of 3.09 billion barrels of oil equivalent.
OWIC launches measures to regulate underwater noise in the North Sea
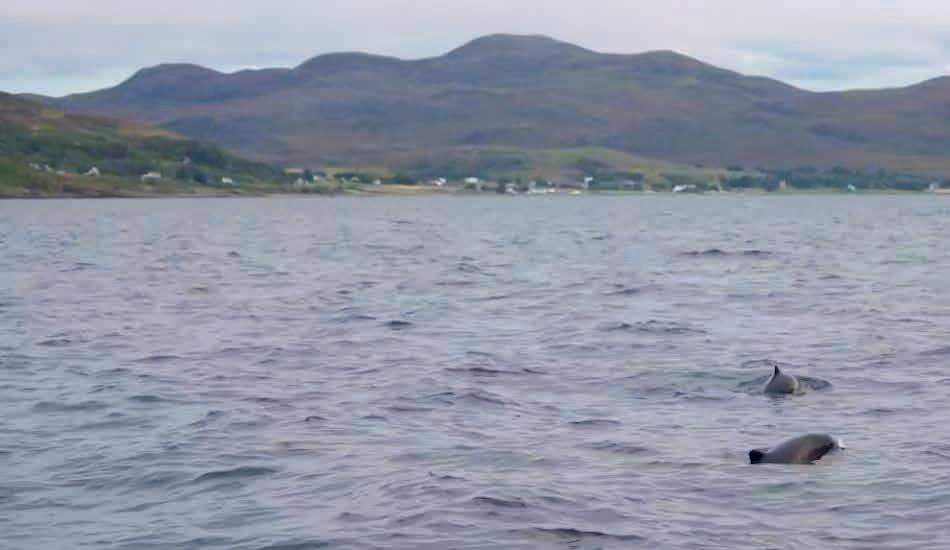
The Offshore Wind Industry Council (OWIC) has set out measures to ensure that the management of underwater noise is co-ordinated more effectively among key industries operating in the North Sea.
The Underwater Noise Conflict Resolution Framework Report highlights the evolving variety of seabed users working under different regulatory regimes to deliver offshore wind, oil and gas and carbon capture and storage projects. Activities include conducting underwater surveys, installing foundations for wind turbines and dealing with unexploded bombs on the seabed.
Measures to conserve marine wildlife are in place in some areas; for example, the southern part of the North Sea is a Marine Protected Area to safeguard harbour porpoises which are sensitive to sound, said OWIC. ‘Government regulators, nature conservation bodies and marine industries already work together to manage any noise impacts and to ensure that noise is kept within agreed limits –but there is a need to plan ways forward should government thresholds lead to some projects not being able to carry out activities at the same time,’ OWIC.
The report puts forward proposals for a co-ordinated framework to support closer co-operation and forward planning of different activities to avoid noise limits being exceeded, as well as a new decision-making process through which
scheduling conflicts can be resolved quickly. ‘The fact that a transparent arbitration process is currently lacking is a key concern for offshore industries as this risks delays to crucial offshore projects,’ said OWIC.
Environment and consents manager Juliet Shrimpton, said: ‘Marine industries work hard to ensure that rigorous underwater noise limits are adhered to, but we need to improve the way that different industries work together, supported by regulators and nature conservation bodies, so that activities can be co-ordinated more effectively. Critically, we need to ensure that if conflicts arise, these can be resolved through a transparent, fair and timely process.’
OWIC’s environment and consents workstream sponsor Benj Sykes, Ørsted UK country manager, said: ‘Initiatives like this are important to ensure that we continue to roll out new projects sustainably, and avoid delays so that we can generate economic growth by accelerating the deployment of vital new clean energy infrastructure whilst ensuring we take proper care of the marine environment. This will also help to enable us to stay on track to meet the government’s target of clean power by 2030.’
The Underwater Noise Conflict Resolution Framework Report was produced by Xodus Group, commissioned by the Offshore Wind Industry Council.
Equinor has halted offshore construction in the outer continental shelf for the Empire Wind project. On 16 April, the US Bureau of Ocean Energy Management (BOEM) ordered Empire to halt all activities until it has completed its review. Empire is considering appealing the order. The federal lease was signed in 2017. Empire Wind 1 has secured all necessary federal and state permits and has a gross book value of around $2.5 billion.
KBR is partnering with Neptune Energy to produce battery-grade lithium carbonate (Li2CO3) from gas field brine at the Altmark site in Germany, utilising KBR’s proprietary PureLi refining and conversion technology.
Energiequelle has received planning consent for its Oulu Green Hydrogen Park project in Finland. The first phase includes construction of a hydrogen production plant with a maximum capacity of five MW and a hydrogen refuelling station for buses and heavy commercial vehicles.
Öresundskraft Kraft & Värme AB and INEOS have signed an agreement to store up to 210,000 tonnes of CO2 annually from Sweden in Denmark. The captured carbon dioxide is planned for permanent storage in Greensand facility in the Danish part of the North Sea, with the first volumes to be stored from 2028.
Denmark has awarded Norne Thorning Storage an exploration licence for the Thorning structure as a site for carbon capture and storage. Norne will gather the necessary information about the structure to evaluate and confirm its suitability for safe and permanent CO2 storage.
Block Energy has announced Phase 2 of its CCS project in Georgia including pilot injection of CO2 into the Patardzueli Middle Eocene reservoir, to prove mineralisation and permanent storage of CO2. Analysis of Middle Eocene reservoir rock samples suggest the reservoir is suitable for CO2 mineralisation at depths shallower than forecast.
Two porpoises close to Tobermory Bay offshore Scotland.
Global rig utilisation falls to lowest level since 2021
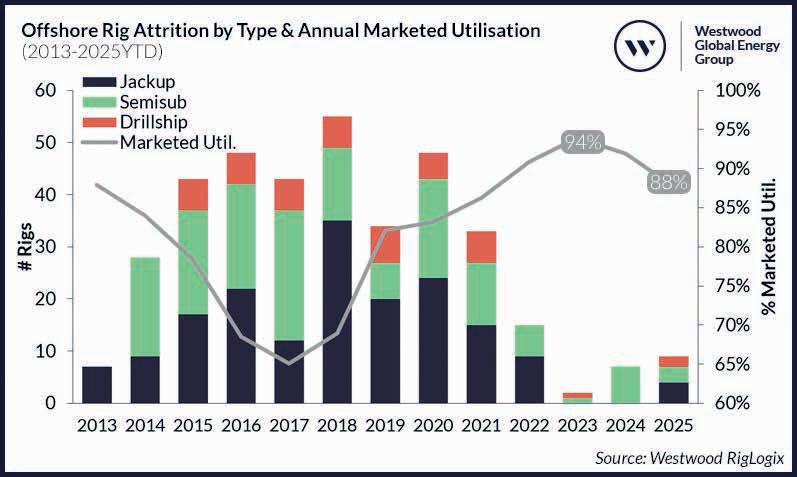
Utilisation in the offshore rig market has hit the lowest levels recorded since 2021, according to research by Westwood Insight. Factors include Saudi Aramco’s suspension of more than 30 jackup contracts by up to one year, the entry of new-build rigs into the market without work to go to, and the deferment of several long-term deepwater drilling and plug and abandonment projects.
The combination of a dip in firm demand (currently 18% lower than March 2024) and an increase in supply (7% higher than March 2021), has led to a fall in marketed utilisation to 88% – representing a 6% drop in less than two years.
With Westwood predicting utilisation of the combined jackup, semisub and drillship segments to fall further this year to
Oil
and gas round-up
Reconnaissance Energy Africa (ReconAfrica) has agreed a joint exploration project in Angola with the National Oil, Gas and Biofuels Agency (ANPG). The partners will jointly explore a project in the Etosha-Okavango basin, located onshore in southeastern Angola.
Eni and YPF have signed a Memorandum of Understanding (MoU) to evaluate Eni’s participation in the Argentina LNG project, promoted by YPF and designed to develop the resources of the ‘Vaca Muerta’ onshore gas field.
bp and Chevron have made an oil discovery at the Far South prospect in the deepwater US Gulf of America. It drilled the exploration well in Green Canyon Block 584, located in western
around 85% – it seems likely that more rigs could permanently be removed from the active drilling fleet as the year progresses, said Westwood.
Year to date, nine rigs have been confirmed for removal from the active fleet. These consist of four jackups – owned by Shelf Drilling, White Fleet Drilling and Well Services Petroleum – and three 8500-series semisubs owned by Valaris, all of which were under 15 years old. Additionally, Noble confirmed the disposal of two modern S12000-design, ultra-deepwater drillships that it inherited during its acquisition of Pacific Drilling – one of which never drilled a single well and was just 10 years old.
For jackups, 39 of these units are cold stacked and 19 are warm stacked (seven of these for over a year). Eight of these warm assets do not have a valid SPS in place and three more will expire this year or next if not renewed. Most of the units included in Westwood’s analysis are located in the Middle East, India or US waters, with Shelf Drilling and Enterprise Offshore owning most of these rigs.
‘To sum up, due to the reduction in jackup, drillship and semisub demand and utilisation this year, more assets will be moved to cold stack due to not having follow-on commitments in place,’ said Westwood. ‘These factors we believe will spur further older, idle and surplus assets to be removed from the fleet, which in the long run may help to set the stage for a stronger recovery in utilisation from the second half of 2026 onwards, when Westwood expects to see a rebound in demand.’
Green Canyon approximately 120 miles off the coast of Louisiana in 4092 feet of water. The well was drilled to a total depth of 23,830 feet. The Far South co-owners are bp (operator, 57.5%) and Chevron (42.5%). Both the initial well and a subsequent sidetrack encountered oil in high-quality Miocene reservoirs. Preliminary data supports a potentially commercial volume of hydrocarbons.
Pantheon Resources has announced strong flow rates from a well testing programme at the Kodiak and Ahpun oil fields on Alaska’s North Slope. The Megrez-1 well was fracture stimulated in the Topset 1 reservoir interval over some 290 ft from 7165 ft to 7453 ft MD. Preliminary analysis indicates that although the reservoir is
oil bearing, it appears to be in a transition zone with limited to no mobile oil and gas. Technical data gathered increases confidence in the productivity and hydrocarbon potential of the intervals higher in the wellbore and indicates mobile oil will be found in the shallower stratigraphic sequences.
Petronas and Beicip Franlab Asia have embarked on an Integrated Basin Study to explore untapped resources in the Malay Basin, located off the coast of Peninsular Malaysia. The study is deploying advanced 4D modelling and machine learning technologies to analyse the subsurface architecture at both basin and reservoir scales. It also focuses on predicting hydrocarbon migration and entrapment by harnessing big data from the Malay Basin.
Offshore Rig Attrition by Type & Annual Marketed Utilisation (2013-2025YTD).
Source Westwood RigLogix.
Detection of CO2 distribution by seismic pulse width analysis using mollifier functions
F. P. L. Strijbos1*
Introduction
Abstract
The relative contribution of buoyancy to dissipative forces that characterise CO2 flow can significantly impact the capacity of a geological storage site. For example, a smaller contribution of the buoyancy forces due to limited density variation with depth will cause the plume to spread out more laterally.
With CO2 being injected in supercritical thermodynamic conditions, close to the critical point, thermodynamic models support that its diffusion within the formation will create a plume with acoustical properties that vary gradually. Such impedance profiles (not limited to linear ramps) generate so-called transitional reflection responses. We describe a method to detect and analyse such transitional reflections based on the analysis of reflection pulse width performed using basis functions called mollifiers.
This method performs well on a synthetic dataset. When we apply this technique on the Sleipner data it detects anomalies at locations where previous publications have observed or inferred CO2 chimneys. This study introduces a novel approach to identifying transitional reflection responses in CO2 storage sites, demonstrating its effectiveness in detecting anomalies that were previously observed or inferred, thus providing a new tool for monitoring and assessing geological storage sites.
The monitoring objectives for the storage of carbon aim to identify the subsurface distribution of the CO2 plume (International Organization for Standardization, 2017). The way injected CO2 distributes itself after injection has a significant effect on this storage capacity. For example, if buoyancy dominates due to large density variations, CO2 will migrate upwards in a narrow cone and a smaller volume will contain residually trapped CO2
(Ringrose et al., 2017). If due to heat loss the supercritical fluid becomes more viscous, CO2 spreads out before getting trapped and residual CO2 remains in a larger volume.
Equation of state plots of CO2 show that density and velocity change very rapidly near the critical point (van der Meer, et al 2009). We can use this sensitivity of density and velocity to temperature and saturation to monitor the movement of CO2 provided these changes can be resolved within the available
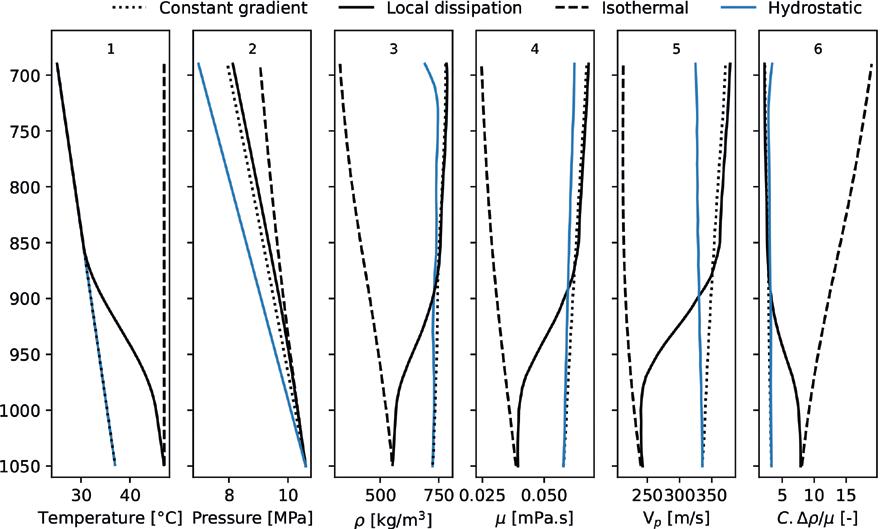
1 TASK G&EO
* Corresponding author, E-mail: floris.strijbos@gmail.com DOI: 10.3997/1365-2397.fb2025040
Figure 1 Density r, viscosity m and p-wave velocity Vp distribution for several thermodynamic models using the equation-of-state published by Span and Wagner (1996). The density change over viscosity ratio determines with some proportionality constant C the dynamic behaviour of the CO2 plume.
seismic bandwidth. Fawad and Mondol (2022) model the impact of CO2 fluid properties on acoustic impedance and Vp/Vs ratio which can be used for seismic monitoring. Figure 1 shows the behaviour of density and velocity as a function of depth for several thermodynamic models. The constant gradient model assumes that injection doesn’t affect the formation temperature. The local dissipation model has temperatures dropping slowly away from the injection point. The isothermal model is an extreme model where temperature remains high throughout the CO2 plume. The hydrostatic model ignores any effect of the changing CO2 density r within the plume. These curves have been calculated using the Span and Wagner (1996) equation of state for CO2. The ratio of CO2 density r over viscosity m shown in the last track characterises the CO2 flow (De Paoli et al., 2022). We expect the heat transport of injected CO2, or the movement of CO2 leaving a wake of residually trapped CO2, to yield gradual changes in acoustic properties. The dynamic behaviour thus can be observed if we can accurately determine the plume shape and the impedance variations within the plume itself. Impedance may, however, vary too slowly to detect using conventional interpretation techniques. Our novel method treats gradual impedance changes as a transitional reflection response, such that slow variations can be detected better.
Wolf (1937) derived an analytical solution for the normal incidence reflection response of a linear velocity transition zone, a so-called ‘Wolf Ramp’.
O‘Doherty and Anstey (1971) show that reflection by a layered sequence with a ‘transitional’ impedance variation, i.e., strictly increasing or decreasing, is frequency dependent. Liner and Bodmann (2010) use this frequency dependence to detect transitional impedance variations with spectral decomposition. Their method assumes that impedance varies linearly within the transition zone (Wolf ramp) and relies on detecting corresponding interference patterns that are difficult to detect due to the reduced temporal resolution of the spectral decomposition method. An improved temporal resolution could be achieved using wavelet-based decomposition, preferably using a basis that is well suited to seismic data and this task.
In this paper, we present an alternative method based on a decomposition of the seismic data using functions known as mollifiers. The parameter that scales these functions can be derived from the reflection pulse width. We will further detect transitional
responses (not limited to linear ramp profiles) using this method and will test this technique on a finite difference synthetic data set. Then, we apply this technique on the seismic data recorded in 2010 over the Sleipner injection site to analyse possible CO2 distribution.
In this paper we restrict ourselves to normal-incidence modelling and apply this to the interpretation of Sleipner near-stack data.
The
normal incidence response of a transition zone
Liner and Bodmann (2010) and Kwietniak et al. (2021) have used the Wolf Ramp analytical solution to interpret transition zones associated with lithological changes. For this they use spectral decomposition techniques. These lithological changes or impedance changes due to CO2 injection may, however, not result in a purely linear trend as a function of depth or time. Amundsen and Ursin (2023) provide an analytical solution to a gradient interface described by a smoothed Heaviside function which results in a frequency response that is quite different from the Wolf ramp response. We will see that the exact functional shape of a transition has indeed a large impact on its frequency response.
In order to understand both the impact of discretisation interval and slope we compare the analytical expression for the Wolf ramp to sigmoid-shaped profiles calculated with the recursive Green’s function technique. The mollifier functions that we will introduce in the next section to represent reflections from a transitional zone integrate to a sigmoidal function. The parameterisation of an impedance ramp and the parameterisation representing its reflection are thus related. In Figure 2 we show the results for a range of discretisation intervals and different slopes. Each sigmoid is parametrised with a scale factor a which determines the slope and the discretisation interval ∆z. The Wolf ramp and the sigmoid transition calculated with a 5-metre discretisation step show a polarity flip which is not present for the other curves. Similar behaviour has been modelled and experimentally verified in a classic paper by Schoenberger and Levin (1974). More recently Amundsen and Ursin (2023) provide an analytical solution that confirms the loss of high frequencies. We explain this loss of high frequencies as follows: with an increasing number of layers and decreasing slope, the reflection coefficients drop. Furthermore, a smooth transitional shape causes the (larger)
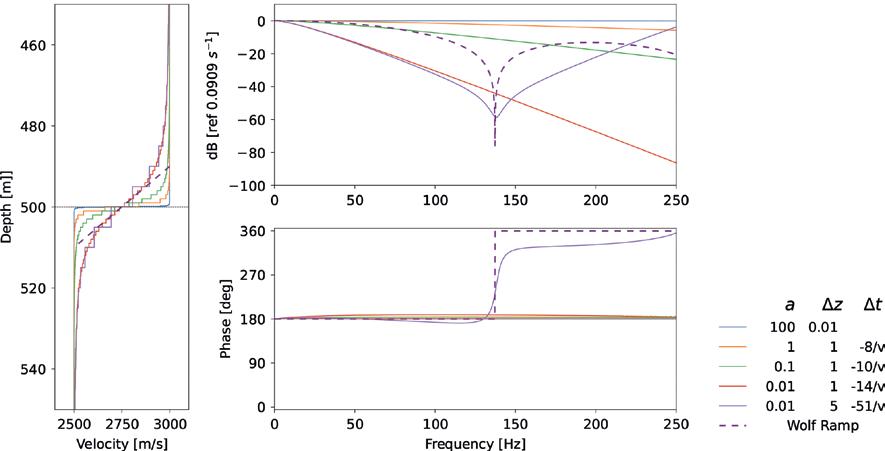
Figure 2 The reflection response for several velocity models (left). The corresponding amplitude- and phase response (right). Parameter ‘a’ is a scale factor that determines the steepness of a sigmoid model. ∆z is the layer thickness and ∆t is the delay applied to the phase.
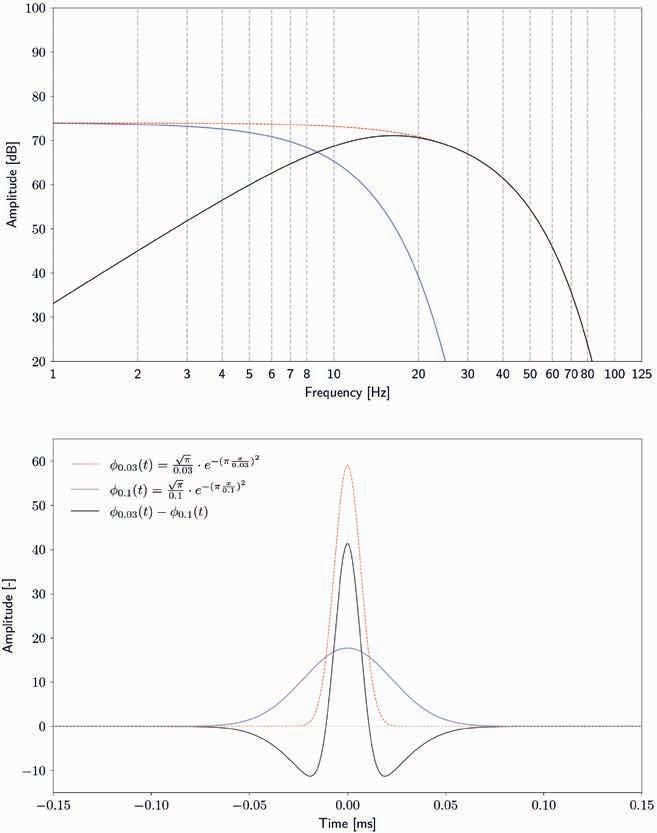
Figure 3 Two mollifier functions with scaling parameters 0.1 (blue) and 0.03 (red). The difference between these mollifiers (black curve) form a bandpass filter.
number of multiples to spread out in time. This timing variation acts as a high-cut filter.
The sigmoid with a 0.01 metre step and a factor equal to 100 shows in Figure 2 a flat spectrum and a constant 180 degrees phase response related to the polarity of the impedance contrast. The remaining functions all show an amplitude decay that is nearly linear on a logarithmic scale. The linear trends related to the time arrival time differences have been removed to facilitate comparison of the phase spectra. There is a small non-linear component as the ramp is defined in depth and its time domain equivalent therefore is skewed somewhat. The strong amplitude decay corresponds in the time domain to a broadening of the seismic reflection. This broadening provides a means to detect a transition response for example due to formation density and velocity changes upon injection of CO2 from variation in its pulse width.
Pulse width analysis
In this section we will describe how we can use pulse width to approximate reflections by a family of functions called ‘mollifier functions’. Mollifiers are smooth functions that can approximate non-smooth functions to an arbitrary smoothness or scale via convolution. Such a non-smooth function could be a ramp or its derivative convolved with a short wavelet. We replace the typical convolutional model for seismic data as a series of reflections or spikes convolved with a wavelet, by a convolutional model consisting of a series of spikes convolved with the difference of two mollifiers. These two mollifiers are a scaled and dilated version of each other. This convolutional
model has the advantage that each function separately provides a representation of the earth reflectivity at a different scale (e.g., see Strijbos, 2024).
The mollifiers are parameterised by a scale parameter that relates to its pulse width. We define the pulse width as the time between the extrema of the wavelet derivative. We find that in the presence of noise a more stable pulse width is estimated from the extrema of a 90° rotated trace.
Each mollifier corresponds to a high-cut filter and the difference of two mollifier represents a band-pass filter. A simple illustration of such an approximation is shown in Figure 3. The blue curve corresponds to a coarse scale representation of the seismic data. The red curve is associated with the fine detail. The difference of the two curves creates a wavelet with an approximately 7-35 Hz bandwidth (black curve).
A decomposition of the data into the two mollifiers allows us to identify changes to the bandwidth of the data as a pulse width change. We start from the functional form for a mollifier:
(1)
where τ denotes the scale parameter. It is a requirement for a mollifier function that as this scaling factor goes to zero, the function approximates a delta function.
At each spike location t0 we establish the spike amplitude R(t = t0). Figure 4 illustrates the pulse width analysis. A 7-35 Hz bandpass filter (blue curve) represents the reflection to be approximated. The pulse width DT is measured between the extrema of the 90° rotated data (red curve). From DT we can calculate the scale parameter τ0. For this we use the roots of the 2nd derivative of the equation describing the Gaussian Mollifier,
to derive the relationship between the scale parameter and pulse width:
τ1 is assumed to be a fixed parameter determined by the lower frequency limit of the data. That this is justified for a transitional response can we see from the low frequency behaviour shown in Figure 2.
Scale parameter τ relates to the high-cut frequency of the mollifier function: (4)
Equations (3) and (4) are used to determine the scale factors from the pulse width and the low-cut frequency of the data. A mollified version of R(t) at a larger (i.e., ‘coarser’) scale τ1 can be created by convolution of the reflection series with the corresponding mollifier function: (5)
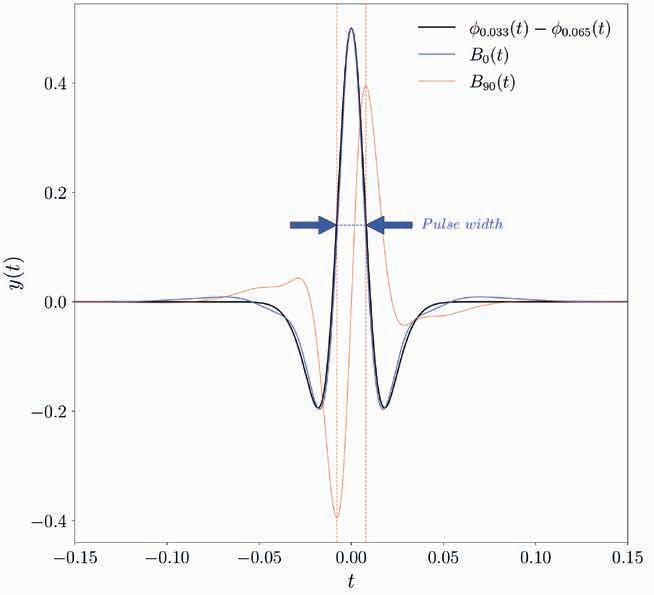
Figure 4 A 7-35 Hz Butterworth filter (blue). The pulse width is picked as the peakto-trough time difference on the 90 rotated Butterworth (red). Equations (3) and (4) are used to determine the scale factors from the pulse width and the low-cut frequency of the data. The difference between the corresponding 0.033 mollifier and a fixed 0.065 mollifier (black) approximates the Butterworth filter.
The denominator ensures that the difference of the two mollified traces preserves the amplitude of the input trace. The black curve shows the resulting approximated data.
A decomposition of the data using mollifiers and pulse width analysis can be done in three ways. First, we can use the pulse width analysis to estimate the fine scale mollifier at each spike location and create a separate trace with a coarse scale mollifier at each spike location honouring the amplitude relationship expressed in Equation (5). Alternatively, we can create a coarse scale volume by convolving the fine scale mollifier volume with the coarse scale mollifier. Or, if we have a good signal-to-noise ratio we can subtract the fine scale mollifier from the input data. An overview of the various steps is given in Figure 5.
We demonstrate the first decomposition method using a simple finite difference synthetic. The first track in Figure 6 shows two sigmoidal velocity depth profiles stretched to time. We create from these models finite difference synthetics using two mollifiers: a Gaussian mollifier with a fine scale (0.0025) and one with a coarse scale (0.02). Track 2 shows the difference of these two models which results in a bandlimited wavelet. The corresponding synthetic data in tracks 3 and 4 show an incident wave followed by a reflection from the velocity ramp. Compared to the first arriving incident wave the reflection from the ramp has lost high frequencies. The smoother reflection for profile (B) results in more high-frequency loss.
Note that the traces in tracks 3 and 4 are multiplied by their corresponding scale parameter to see the relative error between reference and inverted traces. We invert the traces in the 2nd track using steps described in Figure 5.
The coarse scale shows a difference for the less steep velocity profile only. For equation (5) to be valid the reflection response should be white, but as we have seen in Figure 2 this is not the
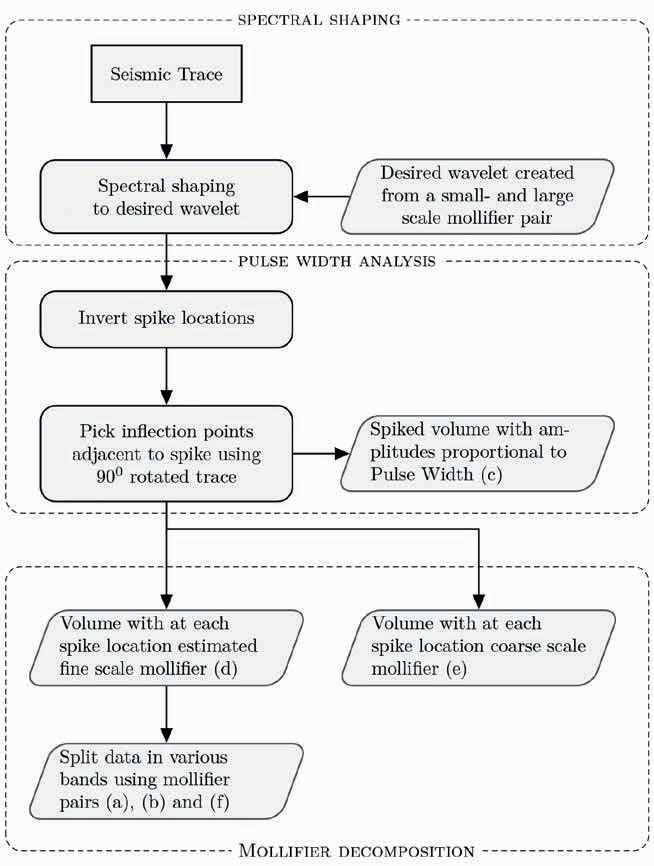
Figure 5 Flowchart detailing spectral shaping, pulse width analysis and mollifier decomposition steps. The letters between brackets correspond to the Figure 9 subfigures.
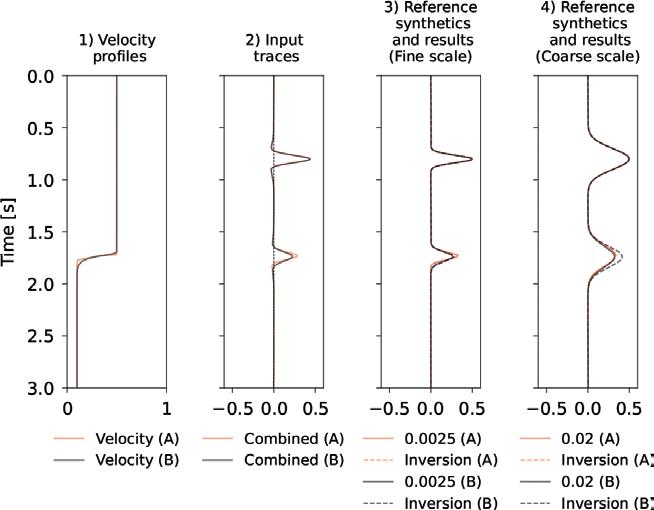
Figure 6 Finite difference modelling showing velocity models for two ramps labelled (A) and (B). These ramps are sigmoidal in depth but become asymmetric as a function of time (left). The receiver is placed between the source and the ramp. Track 2 shows the models created by combining the individual synthetics shown in tracks 3 and 4. These combined models are inputted to the inversion. The incident wave arrives first at about 0.7 seconds. The ramp reflection arrives at about 1.7 seconds. For both models the forward model and inverted data for a 0.0025 and 0.02 Gaussian mollifier are shown in tracks 3 and 4.
case for a transitional response and as a consequence the amplitude of the coarse scale mollifier is over-predicted. We will utilise this overprediction to identify transitional reflections.
In the next section we will apply these methods to the 2010 Sleipner near-stack seismic data.
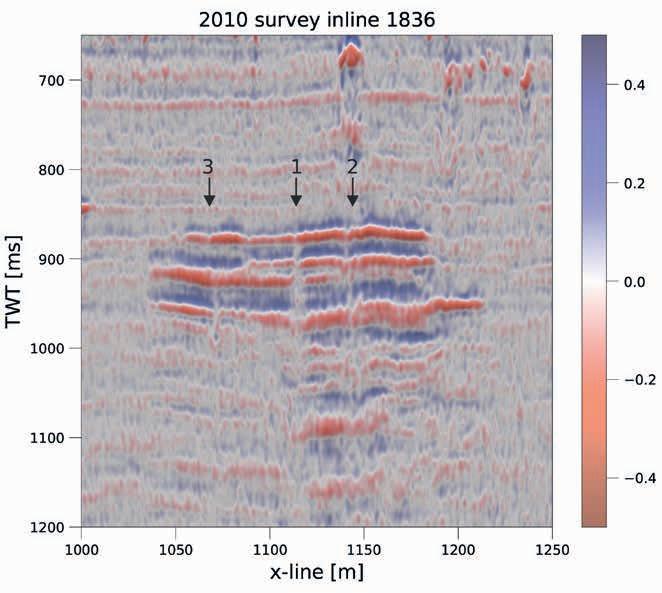
Sleipner 2010 data pulse width analysis
At the Sleipner site CO2 is injected at near critical conditions into sandstones of the shallow Utsira formation. The thermodynamic modelling discussed in the introduction shows that under these conditions a transitional impedance change may develop. The monitoring of the actual seismic response has been done at a two-to-three-year interval since injection started in 1996. 4D seismic data have been released for the timelapse vintages up to 2010. This data release has resulted in an extensive range of publications that discuss the interpretation of the developing Sleipner CO2 plume. In this paper we focus on the 2010 monitor dataset, where we expect the plume to be well developed and to have a strong velocity sag visible. We will not use any 4D difference data: without an accurate correction for the sag interpretation of 4D difference (time) data is particularly difficult in the lower-level part of the plume.
Several authors have observed vertically aligning discontinuities in reflection strength (e.g. Arts et al., 2004; Williams and
Chadwick 2021; Furre et al. 2019, 2024). These discontinuities are assumed to be ‘CO2 chimneys’ where a whole reservoir column is filled with a high CO2 concentration. Figure 7 shows the relative impedance seismic data of a weighted stack of the 2010 near- and mid-stack offsets. The chimneys were not visible on the full- and far stacks. Along this inline Williams and Chadwick (2021) identified three ‘putative chimneys’. The locations of these chimneys are indicated by the black arrows. ‘Chimney 1’ shows a narrow, transparent and near-vertical anomaly confined to a couple of traces in any direction we look. Indeed, some reservoir models made for CO2 injection (e.g., Wen and Benson, 2019) show the highest saturation in a near-vertical zone above an injection point combined with a wider cone with lower saturations expanding out horizontally. ‘Chimney 2’ is directly overlain by a shallow amplitude anomaly which even creates a small velocity sag of its own. ‘Chimney 3’ doesn’t show up on this display.
Furre et al. (2019) interpret several other chimney locations based on the location of the earliest appearance of 4D anomalies. They denote these as ‘invisible feeder chimneys’.
A full waveform inversion scheme based on a cost function calculated from time shifts between recorded- and synthetic data is used by Martinez et al. (2024) to build a detailed image. Their result highlights a ‘source feeder’ and several additional chimneys.
In this paper we apply the method described in the previous section in several steps:
• The average autocorrelation function of the data showed some residual multiple energy which could be effectively suppressed by subtracting a scaled and shifted version of the input data.
• We use the wireline logs of well 15/9-13 to create a normal incidence synthetic. As the sonic and density logs for this well are of poor quality, we replace the density log by a pseudo-log using the empirical relationship between porosity, velocity and shale content derived by Han et al. (2012).
• The amplitude spectrum of the data is then shaped to be consistent with the global reflectivity observed in the well logs (‘spectral blueing’).
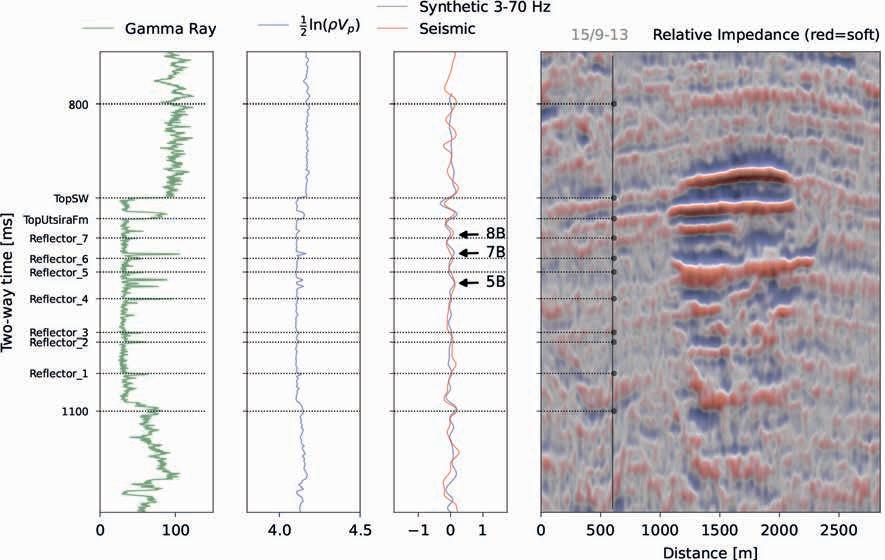
Figure 8 A comparison between the 15/9-13 relative impedance synthetic and the 2010 inverted near stack data. The synthetic is created using a 90 rotated 3-70 Hz Butterworth filter.
Figure 7 The relative impedance of a weighted stack of the 2010 near- and midstack data. Along this line Williams and Chadwick (2021) identified three ‘putative chimneys’. The black arrows indicate the interpreted chimney locations.
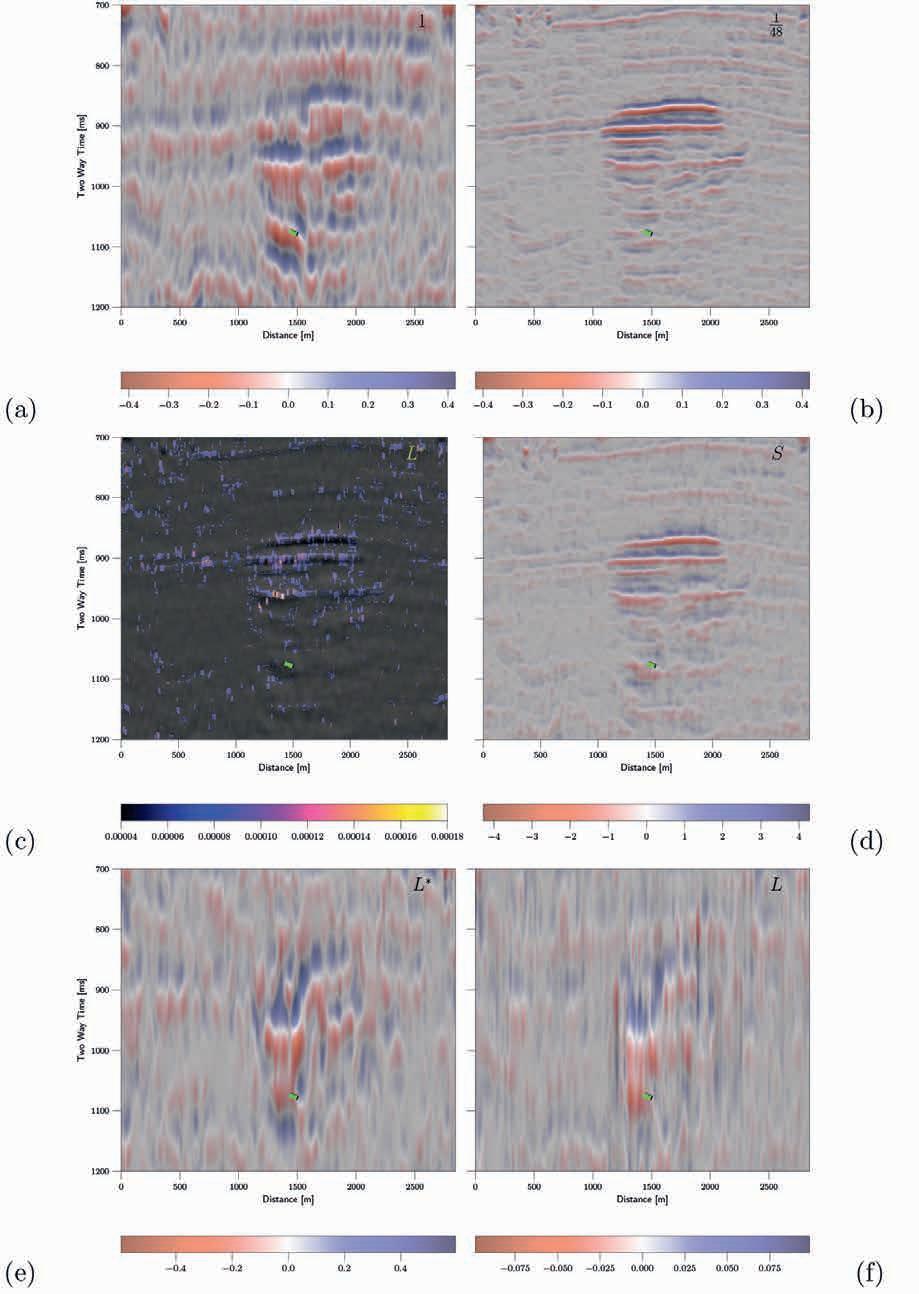
• We invert the 2010 near stack data using the sparse spike inversion scheme described in the previous section.
Figure 8 shows a comparison between the synthetic trace and the inverted seismic data represented by the difference of the two mollifiers. The match is good across the Utsira section and this validates the inversion. Very little contrast is visible in the lower Utsira section, suggesting a more homogeneous formation. Traditionally the Sleipner Utsira reflectors are numbered 1 to 7 based on spikes observed in the gamma ray log. In Figure 8 we can see that these spikes are very thin and below seismic resolution. The loops that can be observed in the synthetic correspond to wider zones of increased gamma ray values. We label these high impedance loops ‘5B’, ‘7B’, ‘8B’ as they don’t exactly coincide with the gamma ray spikes. Based on the observed response in Figure 8 we can divide the Utsira plume into two zones: An upper zone where the presence of potential seals or net-to-gross variations can create a cyclic reflection response. The lower zone
Figure 9 A comparison of the two lower octaves (a) with the two highest octaves (b) along the trajectory of well 15/9-A16. An overlay of pulse width (c) over a backdrop of the full bandwidth impedance also shown in (d) The inversion mollified in 3D using a 5-point Gaussian and a 0.144 ms Gaussian function corresponding to an equivalent frequency of about 7 Hz (e). This Gaussian is calculated from the observed spike amplitude and its pulse width. The full bandwidth result filtered back to approximately the same bandwidth (f).
is more homogeneous and slower changes of acoustic properties have the potential to create a transition reflection response. The loop below level 5B is much broader than the overlying levels and this may indicate a transitional reflection. Alternatively, there might be some attenuation related to transmission through the upper layers as this loop broadens directly below the overlying anomalies. Without a more detailed analysis it is hard to be conclusive about the contribution of transitional reflection versus cyclic transmission losses.
In Figure 9a and Figure 9b we compare two lower octaves with the two highest octaves along the trajectory of well 15/9A16. The injection zone is indicated by the small green bar. The highest frequency band is equivalent to 1/48 of the scale associated with the lowest frequency band. We can see that below 950 ms, approximately at the top of the loop we identify as 5B, coherent low-frequency energy dominates, whereas above this level higher frequencies dominate. Taking into account the time sag related to the low velocities in the plume, we note that the low

Figure 10 Two traverses and a time slice at 1008 ms through a 3D cube with the 0.144 ms Gaussian (left), the full bandwidth result (middle) and a time slice at 928 ms showing the trajectory of the traverses (white) and the 15/9-13 well trajectory (yellow). The green bar indicates the (projected) injection zone.
frequencies are strongest at and above the injection zone, whereas also immediately to the right (East) of the injection zone less low frequency energy is present. This low frequency reflectivity is consistent with the presence of a transitional reflection at this scale. The alternative model, high-frequency loss upon transmission through the overlying layers, would not create a section with stronger low frequencies than the overlying formations.
Figure 9c shows an overlay of reflection pulse width (colour) over a backdrop of the full bandwidth impedance shown also in Figure 9d. An anomalously large pulse width is observed at the top of loop 5B offset to the left with respect to the injection zone.
In Figure 9e the lowest frequency band is shown. This band has a low signal-to-noise, but by combining the mollifier with a 5-point Gaussian filter essentially a 3D mollification can be done. Figure 9e shows this 3D result using a 0.144 ms scale, corresponding to an equivalent frequency of about 7 Hz. The amplitude at each spike location is scaled using equation (5). For comparison we show in Figure 9f the trace-by-trace mollification created by filtering the full bandwidth inversion back to approximately the same bandwidth. This results in a 1D filter that also includes the Gaussian residual of the sparse spike inversion.
In Figure 10 we compare the 3D result with the full bandwidth along two trajectories. The white arrows indicate the location of chimneys 1 and 2. The anomaly below reflector ‘5’
lies above the injection zone, but is slightly offset w.r.t. chimney 1. Chimney 2 dissects the anomaly bounded by reflectors 5 and 8. The time slices through the anomalies show that these form sheet-like features. It is possible that these are the thin and bright filaments corresponding to warm fluid ‘protoplumes’ that are described by De Paoli et al. (2022) in the context of the initial stages of convection.
Discussion
In this paper we used a decomposition of the data into two mollifiers to analyse the pulse width. Although a similar analysis can be done on data with a regular wavelet, the (integrated) mollifier shape follows a sigmoid shape that can be expected for the gradual response associated with transport phenomena. Furre et al. (2024) note that the deeper anomalies within the Sleipner CCS site are hard to interpret ‘…where the reflectivity pattern is complex and affected by time-shifts’. Nevertheless, the authors have interpreted seismic anomalies in terms of flow, but not in terms of gradual changes of fluid properties. We detected in the Sleipner seismic data frequency dependent reflections and distinct pulse width anomalies. Figure 11 displays these anomalies with the ‘putative chimneys’ from previous publications. We cannot be sure about the exact nature of these anomalies, but they are located where CO2 flow transport and/or change in fluid properties are
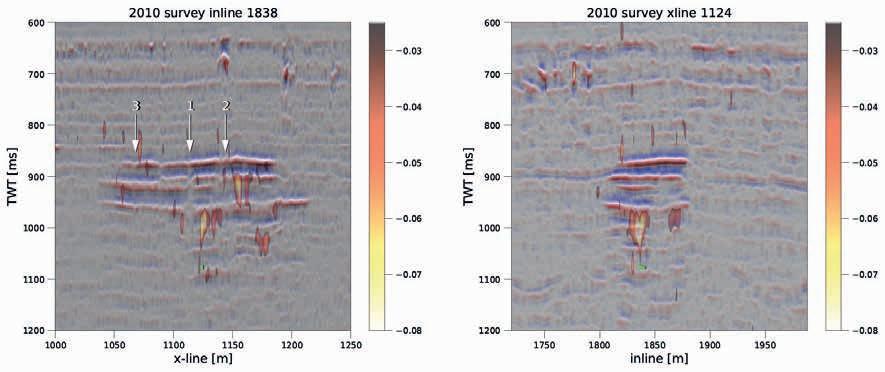
possible. A drop in bandwidth in itself is not enough to exclude a cyclic reflection response. In fact, the shallow gas anomalies visible in this figure show anomalies that may be indicative of a transmission-related frequency loss (e.g., see discussion in De Bruin et al., 2022). We note, however, that such transmission losses require a high reflection response more typical of shallow gas. The interpretation of the anomalies as ‘protoplumes’ may be open to challenge in a setting where many physical phenomena could occur, but at least these anomalies are observations to test various fluid mechanical models against. A key step in the method is to analyse reflection events as transients rather than a reflection series with stationary or slowly evolutionary spectra. The use of an assumed fixed coarse scale value in the decomposition may not be an accurate assumption, but at the same time we can consider it as the scale against which any bandwidth changes are compared.
Conclusion
CO2 injected close to its critical point has the potential to create a frequency dependent (transitional) reflection response. We illustrate that the shape of the transition zone matters, with a sigmoid-shaped transition having a stronger attenuation than a linear transition over similar depth range. The mollifier-based decomposition of the Sleipner 2010 near stack data showed a response consistent with a transitional reflection in the lower part of the CO2 plume. We described a novel technique to detect bandwidth loss through its impact on the pulse width. This method performs well on a synthetic dataset. When we applied this technique on the Sleipner data we detected anomalies at locations where previous publications have observed or inferred CO2 chimneys.
Acknowledgements
The author gratefully acknowledges Equinor and the partners of Licence PL046 for making the 4D seismic data from the Sleipner CCS site available under the Sleipner CO2 Reference Dataset Licence (Equinor ASA, 2020). I thank the First Break editors and reviewers for the excellent feedback that has led to a significantly improved paper.
Conflict of interest
The author has no conflict of interest to declare.
Data availability
The seismic data is available from the CO2 DataShare site (https://doi.org/10.11582/2020.00005)
Figure 11 The pulse width anomalies overlain on the inverted seismic along inline 1838 (left) and crossline 1124 (right). The locations of chimneys identified by Williams and Chadwick (2021) are indicated by the white arrows.
References
Amundsen, L. and Ursin, B. [2023]. Solving the nonlinear Riccati equation for the 1D plane-wave reflection response from a velocity gradient interface by a Heun to hypergeometric reduction. Geophysics, 88(1). https://doi.org/10.1190/geo2022-0186.1
Arts, R., Eiken, O., Chadwick, A., Zweigel, P., Van Der Meer, L. and Zinszner, B. [2004]. Monitoring of CO2 injected at Sleipner using time laps seismic data. Energy, 29(9-10), 1383-1392. https://doi. org/10.1016/j.energy.2004.03.072
De Bruin, G., Ten Veen, J., Wilpshaar, M., Versteijlen, N., Geel, K. and Verweij, H. [2022]. Origin of shallow gas in the Dutch North Sea — Seismic versus geochemical evidence. Interpretation, 10(1), SB63–SB76. https://doi.org/10.1190/INT-2021-0081.1
De Paoli, M., Pirozzoli, S., Zonta, F. and Soldati, A. [2022]. Strong Rayleigh-Darcy convection regime in three-dimensional porous media. Journal of Fluid Mechanics, 943, 1–21. https://doi.org/10.1017/ jfm.2022.461
Equinor ASA. [2020]. Sleipner CO2 Reference Dataset Licence: Terms and Conditions. https://co2datashare.org/landing_pages/sleipner2019-benchmark-model/static/license.pdf
Fawad, M. and Mondol, N.H. [2022]. Monitoring geological storage of CO2 using a new rock physics model. Sci Rep, 12, 297. https://doi. org/10.1038/s41598-021-04400-7
Furre, A., Ringrose, P. and Santi, A.C. [2019]. Observing the Invisible CO2 Feeder Chimneys on Seismic Time-Lapse Data. 81st EAGE Annual Conference and Exhibition, Extended Abstracts. https://doi. org/10.3997/2214-4609.201901646
Furre, A.K., Warchoł, M.J., Alnes, H. and Pontén, A.S.M. [2024]. Sleipner 26 years: how well-established subsurface monitoring work processes have contributed to successful offshore CO2 injection. Geoenergy, 2(1). https://doi.org/10.1144/GEOENERGY2024-015
Han, D.H., Nur, A. and Morgan, D. [1986]. Effects of porosity and clay content on wave velocities in sandstones. Geophysics, 51(11), 2093–2107. https://doi.org/10.1190/1.1442062
International Organization for Standardization. [2017]. ISO 27914:2017 - Carbon dioxide capture, transportation and geological storage Geological storage. https://www.iso.org/standard/64148.html
Kwietniak, A., Maćkowski, T. and Cichostępski, K. [2021]. Seismic Signature of Transition Zone (Wolf Ramp) in Shale Deposits with Application of Frequency Analysis. Geofluids, 2021(1). https://doi. org/10.1155/2021/6614081
Liner, C.L. and Bodmann, B.G. [2010]. The Wolf ramp: Reflection characteristics of a transition layer. Geophysics, 75(5). https://doi. org/10.1190/1.3476312
Martinez, R., Vinje, V., Stovas, A., Ringrose, P., Mispel, J. and Landrø, M. [2024]. Learnings from Recent Full-Waveform Inversion Analysis on the CO2 Plume at Sleipner. 85th EAGE Annual Conference and Exhibition, Extended Abstracts. https://doi.org/10.3997/22144609.2024101068
O‘Doherty, R.F. and Anstey, N.A. [1971]. Reflections on Amplitudes. Geophysical Prospecting , 19(3), 430-458. https://doi. org/10.1111/j.1365-2478.1971.tb00610.x
Ringrose, P., Greenberg, S., Whittaker, S., Nazarian, B. and Oye, V. [2017]. Building Confidence in CO2 Storage Using Reference Datasets from Demonstration Projects. Energy Procedia, 114, 3547-3557. https://doi.org/10.1016/j.egypro.2017.03.1484
Schoenberger, M. and Levin, F.K. [1974]. Apparent attenuation due to intrabed multiples. Geophysics, 39, 278-291. https://doi. org/10.1190/1.1440427
Span, R. and Wagner, W. [1996]. A new equation of state for carbon dioxide covering the fluid region from the triple-point temperature to 1100 K at pressures up to 800 MPa. Journal of Physical and Chemical Reference Data, 25(6), 1509–1596. https://doi.org/10.1063/1.555991
Strijbos, F.P.L. [2024]. A mollifier approach to seismic data representation. Geophysical Prospecting, 72(9), 3217-3229. https://doi. org/10.1111/1365-2478.13613
van der Meer, L.G.F., Hofstee, C. and Orlic, B. [2009]. The fluid flow consequences of CO2 migration from 1000 to 600 metres upon passing the critical conditions of CO2. Energy Procedia, 1(1), 32133220. https://doi.org/10.1016/j.egypro.2009.02.105
Wen, G. and Benson, S.M. [2019]. CO2 plume migration and dissolution in layered reservoirs. International Journal of Greenhouse Gas Control, 86, 66-79. https://doi.org/10.1016/j.ijggc.2019.05. 012
Williams, G.A. & Chadwick, R.A. [2021]. Influence of reservoir-scale heterogeneities on the growth, evolution and migration of a CO2 plume at the Sleipner Field, Norwegian North Sea. International Journal of Greenhouse Gas Control, 106, 103260. https://doi. org/10.1016/j.ijggc.2021.103260
Wolf, A. [1937]. The reflection of elastic waves from transition layers of variable velocity. Geophysics, 2(4), 357–363. https://doi. org/10.1190/1.1438104


NAVIGATING CHANGE: GEOSCIENCES SHAPING A SUSTAINABLE TRANSITION

Submit an article
The theme of this year’s EAGE Annual Conference and Exhibition in Toulouse is ‘Navigating Change: Geosciences Navigating a Sustainable Transition’. This month, geoscientists are demonstrating in different ways how their expertise is making a vital contribution to the energy transition. Geothermal, carbon and hydrogen storage are among the topics covered.
Paul Helps et al demonstrate mineral system approaches to globally screen for prospective areas for both sedimentary-hosted copper and magmatic nickel systems.
Marit Brommer gives an overview of the burgeoning global geothermal energy scene.
Julien Mouli-Castillo et al demonstrate why mine water geothermal heat (MWGH) extraction offers significant potential for decarbonising heat supply in regions with former coalmining operations.
Alena Finogenova et al highlight the key findings that have emerged from their work on the Elephant project for the past two years, working towards the public release of a detailed, freely accessible Mesozoic Base of the Norwegian North Sea.
Johnson, J.R et al show that injection rate is critical to multicycle hydrogen storage in porous media utilising analogue and numerical models.
Vetle Vinje et al demonstrate a long-offset, wide-azimuth four-component OBN survey, in combination with Full-Waveform Inversion, that produces 3D images with unprecedented detail and a geobody of the Sleipner CO2 plume that can be used for quantitative analysis.
Elodie Morgan et al on the impact of geosciences on energy transition and the role of geoscientists ten years after the Paris agreement.
Kim Gunn Maver explains why many different applications of geothermal energy will develop rapidly in the coming years.
First Break Special Topics are covered by a mix of original articles dealing with case studies and the latest technology. Contributions to a Special Topic in First Break can be sent directly to the editorial office (firstbreak@eage.org). Submissions will be considered for publication by the editor.
It is also possible to submit a Technical Article to First Break. Technical Articles are subject to a peer review process and should be submitted via EAGE’s ScholarOne website: http://mc.manuscriptcentral.com/fb
You can find the First Break author guidelines online at www.firstbreak.org/guidelines.
Special Topic overview
January Land Seismic
February Digitalization / Machine Learning
March Reservoir Monitoring
April Underground Storage and Passive Seismic
May Global Exploration
June Navigating Change: Geosciences Shaping a Sustainable Transition
July Reservoir Engineering & Geoscience
August Near Surface Geo & Mining
September Modelling / Interpretation
October Energy Transition
November Marine Acquisition
December Data Management and Processing
More Special Topics may be added during the course of the year.
BY 21 JULY

14-18 SEP. 2025
CALENDAR OF EVENTS

7-11 Sep 32 nd International Meeting on Organic Geochemistry (IMOG) www.imogconference.org
9-11 Sep Second EAGE Conference and Exhibition on Guyana-Suriname Basin www.eage.org
14-18 Sep Seventh International Conference on Fault and Top Seals www.eage.org
15-17 Sep Fifth EAGE Workshop on Assessment of Landslide Hazards and Impact on Communities www.eage.org
15-18 Sep AOW Energy 2025 www.aowenergy.com
16-18 Sep The Middle East Oil, Gas and Geosciences Show (MEOS GEO) www.meos-geo.com
17-18 Sep First EAGE Workshop on Energy Transition in Latin America’s Southern Cone www.eage.org
22-24 Sep Sixth EAGE Borehole Geology Workshop www.eage.org
29 Sep1 Oct Second AAPG/ EAGE Mediterranean and North African Conference (MEDiNA) medinace.aapg.org
29 Sep1 Oct Eighth EAGE Borehole Geophysics Workshop www.eage.org
6-8 Oct Second EAGE Data Processing Workshop www.eage.org
6-8 Oct Empowering the Energy Shift - The Role of HPC in Sustainable Innovation: Ninth EAGE High Performance Computing Workshop www.eage.org
6-9 Oct GEOTERRACE-2025: International Conference of Young Professionals www.eage.org
14-16 Oct First EAGE Conference on the Future of Mineral Exploration: Challenges and Opportunities www.eage.org
15-16 Oct 3 rd EAGE/SUT Workshop on Integrated Site Characterization for Offshore Renewable Energy Melbourne Australia

CALENDAR OF EVENTS
18-20
13-14
2-4
8-11