Financial Analysis of the Other Major Funds
Housing Authority
The Housing Authority Special Revenue Fund account for revenues generated by housing assets received from former redevelopment agency. The total revenue generated in fiscal year 2022-23 was $435 thousand. The revenues are from housing loan repayments. Total expenditures for the Housing Authority Fund were $80 dollars. The fund balance of $4.1 million is restricted for lowand moderate-income housing. The fund balance increased by $435 thousand primarily due to increased collection in subsidy loans. Increase in homeowners who sold their homes during the year also increased the number of homeowners paying off their loans.
CIP Grant Fund
The CIP Grant fund is used to account for the majority of City capital improvement projects funded from various federal, state and local sources such as Caltrans, Metropolitan Transit Authority and joint ventures with the Downey Unified School District and surrounding Cities.
The CIP grant had expenditures of $1.4 million and grant revenues of $3.5 million. The net increase in fund balance is $2.1 million. The increase in fund balance is primarily due to reimbursements from various agencies were received within the 90-day timeframe. Revenues not collected within the 90-day period after the city closed its books are booked as unavailable revenues.
As of June 30, 2023, the CIP Grant fund has a negative fund balance of $2.2 million. However, this is offset by the $2.8 million of unavailable revenues. The unavailable revenues are expected to be received in the future, which will eventually cover the negative fund balance.
Below is a description and amount of expenditures for the key projects.
$550 thousand Inspiration Space Shuttle Exhibit & Education Building (NRA)
$332 thousand Lakewood Blvd at Imperial Intersection Improvement (Metro)
$165 thousand Telegraph Traffic Safety Enhancement (Caltrans, Pico Rivera, Measure M)
$149 thousand Paramount Blvd. at Imperial Intersection Improvement (Metro)
$113 thousand Lakewood Blvd at Florence Intersection Improvement (Metro)
Expenditures during the year also included other projects such as Citywide Transit Priority System, Imperial Hwy Signalization & Safety, Bicycle Master Plan and Street Improvements.
19
COVID-19 Grant Fund
Covid-19 grant fund is used to account for all revenues and expenditures related to Covid-19 grant funding. The total grant proceeds for FY 2022-23 were $361 thousand of these amounts $220 thousand is from ARPA Grant. The remaining $141 thousand are from the Covid 19 Community Development Block Grant (CDBG-CV), Justice Assistance Grant (JAG) and Behavioral Health Grant (BHJIS). These grant funds were used for rental assistance, small business support through grants, food drives, senior wellness, distance learning and personal protective equipment, water well projects and provide services for mental health and substance abuse.
As of June 30, 2023, the Covid-19 Grant Fund has a positive fund balance of $216 thousand. The increase resulted primarily from interest income of $199 thousand.
CAPITAL ASSET AND DEBT ADMINISTRATION
Capital Assets
The City's investment in capital assets for its government and business-type activities at June 30, 2023 amounted to $378.3 million, net of accumulated depreciation. This investment in capital assets includes land, projects in progress, buildings, equipment, fixtures and infrastructures. The total increase over prior fiscal year in the City’s investment in capital assets was $15 million or a 4% increase. The increase is primarily due to projects in progress that were capitalized during the year, mainly in the categories of infrastructures, right-to-use leased asset and the newly added right-to use subscription asset.
City of Downey
Summary of Captial Assets (Net of Depreciation) For Fiscal Year Ended June 30, 2023 and 2022 (Amounts Expressed in Thousands)
202320222023202220232022 Land and Improvements26,361 $ 26,361 $ 10,754$ 10,754 $ 37,115 $ 37,115 $ Projects in Progress 22,916 24,040 7,528 7,576 30,444 31,616 Water Rights - - 4,291 4,291 4,291 4,291 Buildings 56,647 58,510 5,247 5,419 61,894 63,929 Land Improvements 19,552 20,756 172 197 19,724 20,953 Machinery & Equipment 10,893 10,847 749 808 11,642 11,655 Furniture & Fixtures - - 576 630 576 630 Lease Assets 1,720 1,548 - - 1,720 1,548 Subscription Asset 28 - - - 28Infrastructures 153,873 136,871 56,972 54,589 210,845 191,460 Total Capital Assets 291,990 $ 278,933 $ 86,289 $ 84,264 $ 378,279 $ 363,197 $
Governmental ActivitiesBusiness-Type ActivitiesTotal 20
Major capital asset transactions during the current fiscal year included the following:
Projects in progress decreased by $1.1 million, which is net of a decrease in governmental activities.
The projects in progress added during the year amounted to $24 million minus the capitalized amount of $25.1 million. The net effect is a decrease of $1.1 million, leaving a balance of $30.4 million in projects in progress as of June 30, 2023. The capitalized amount of $25.1 million are:
- Telegraph Traffic Safety Enhancement - $7.7 million
- Water System Improvements - $4.9 million
- Residential Street Pavement Rehabilitation (Area 8) - $3.7 million
- Residential Street Pavement Rehabilitation (Area 2) – $3.1 million
- Stoakes, Meldar, Manzanar & Vista del Rosa Pavement Rehab - $1.8 million
- Imperial Hwy Signalization & Safety - $1.7 million
- Fifth Street Pavement Rehabilitation – $0.6 million
- Lakewood Blvd Improvement Alameda-Imperial - $.4 million
- Alley N-O & S-O Stewart & Gray Rd Pavement Rehabilitation - $0.3 million
- Concrete Repairs & ADA Improvement - $0.3 million
- City Maintenance Yard Pavement Rehabilitation - $0.2 million
- Annual Residential Pavement Rehabilitation - $0.3 million
- Storm Drain Catch Basin Inserts - $0.1 million
Buildings decreased by $2.0 million and infrastructures increased by $19.3 million, mainly due to the fire station modernization and street/traffic safety improvements, respectively.
Additional information on the City's assets can be found in the notes to basic financial statements in note 11.
21
Long-Term Liabilities
Total outstanding long-term debt on June 30, 2023 is $200.9 million, a decrease of $8.9 million from the prior fiscal year.
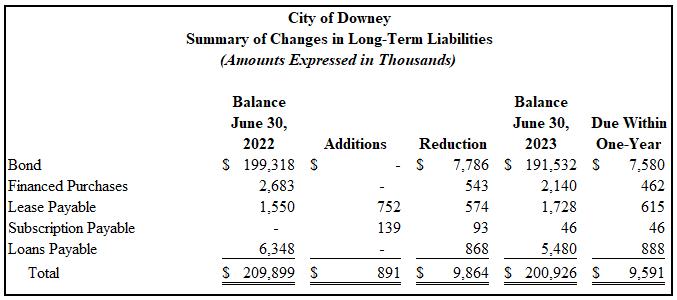
Long-term debt-related events during the fiscal year ended June 30, 2023 included:
Bonded debt reductions by $7.7 million from debt service payments and amortizations of premiums and discounts.
Financed purchased decreased by $543 thousand from debt payment.
The City leases vehicles owned by Enterprise Fleet Management with terms range from 2.92 years to 5 years as of the contract commencement date. As of June 30, 2023, the value of the lease liability is $1,728,464. The City is required to make annual fixed payments ranging from $142 to $1,084. The lease has an interest rate of 0.3150% to 2.3660%.
Subscription Payable was added this fiscal year because of the implementation of GASB Statement No. 96, Subscription-Based Information Technology. On July 1, 2022, the City of Downey entered into a 15-month subscription for the use of Library Catalog Software Subscription and Hosting Services. An initial subscription liability was recorded in the amount of $139,116. As of June 30, 2023, the value of the subscription liability is $45,963. The City of Downey is required to make annual fixed payments of $46,750. The subscription has an interest rate of 1.71%. The value of the right to use asset as of June 30, 2023 of $139,116 with accumulated amortization of $111,293
Loans payable decreased by $868 thousand from debt payments made during the year.
Additional information on the City's long-term liabilities can be found in Note 12 of the Notes to Basic Financial Statements.
22
ECONOMIC FACTORS AND NEXT YEAR’S BUDGETS AND RATES
With the US economy continuing on an uncertain path, many major economic factors that are key indicators for sustaining local government revenue streams are impacted. Some of the top factors are inflation, sustained high interest rates, weakened housing market, unemployment rate, and diminished consumer confidence. As much as the effects of these factors are borne at an individual level, local Governments are also faced with its financial impacts and the City continues to assess and navigate through these to minimize the impact on City’s finances.
As the housing market has slowed, the median price of a single-family home in Downey remained just under $775,000. However, the number of home sales fell 31.7 percent to 373 when compared to prior year’s total of 546. This reduction in the number of sales combined with the levelling off of the median sales price indicates a slowing of property tax revenue growth in future years.
When the budget was adopted, Sales Tax revenues for the City are expected to grow slightly from there $26.2 million received during FY 2022-23. However, economic pressures, especially inflation and the decline in consumer confidence, has undermined this original estimate. The City now anticipates either flat or slight decline in Sale Tax revenues for FY 2023-24. With the rise in interest rates has come a rapid increase in investment revenues. This increase in revenues is expected to well exceed the $950 thousand projected in the adopted budget. The opening of the SpringHill Suites by Marriot and other hotels in the hospitality industry bought more visitors to the City and increased TOT revenues to $2.2 million, an increase of 26.4 percent when compared to the prior year.
In spite of all these uncertainties City has focused on strengthening its long-term Fiscal health by using a conservative approach and building its reserves to accomplish its strategic goals. To ensure long-term fiscal viability, the City has made substantial changes to compensation, retirement, and healthcare structure; sought federal, state, local and private funding for projects to support our parks, Library, police, fire, water, and community development needs; and supported state and federal legislation to increase funding for infrastructure projects.
Longstanding infrastructure and maintenance projects will update City facilities and ensure viability for the next 20-30 years, thanks to funds from Downey’s Measure S, the County’s Measure M, and the State’s SB 1. Specifically, the 2017 transportation funds and local sales tax dollars have helped to stabilize infrastructure resources over the next twenty to thirty years. Additionally, the City’s bond issuance using Measure M and Measure R funds helped accelerate projects and limit future increased construction costs. Over $30,000,000 in street repairs were completed this past year. Additionally, the City maximized one-time federal revenue dollars such as ARPA funds, to advance City infrastructure creating generational impacts.
Downey is on a sustainable long-term path in terms of state-of-the art infrastructure repair and regional economic development opportunities that will have tremendous impacts for decades. These include the redevelopment of the Rancho Los Amigos South Campus, expansion of the
23
Columbia Memorial Space Center, and the development of the West Santa Ana Branch Corridor light rail line and station in Downey. Incorporating these various projects and future legacy projects, the City completes long-range revenue and expenditure projections to assist with this effort of financial stewardship.
As the City remains focused on long-term infrastructure and economic development efforts, the City is also proactively exploring methods of expanding its revenue base to support and enhance services.
Fees for Services
It is important to note that the City annually reviews all of its fees for services to ensure, when possible, fees collected fully support the cost of providing City services. In June 2023, the City adopted a new fee schedule from a City-wide study which updated the rates for FY 2023-24.
Utility Rates
The City’s water rates were last increased in July 2015. The water rates remain unchanged for FY 2023-24.
Fiscal Year 2023-2024 Budget Adoption
On June 27, 2023, the City Council adopted and approved FY 2023-24 budget with total appropriation of $272.2 million. Adequate resources are available to fund the proposed expenditures. The City Council approved the FY 2023-24 budget with an increase of 3.6% over last year’s general fund budget due to the expenditures related to MOU increases, the filling of vacancies and new positions.
REQUESTS FOR INFORMATION
This financial report is designated to provide a general overview of the City's finances for all those with an interest in the City's finances. Questions concerning any of the information provided in this report or requests for additional financial information should be addressed to the Department of Finance & Information Technology, City of Downey, 11111 Brookshire Avenue, Downey, California 90241-0607.
24
THIS PAGE INTENTIONALLY LEFT BLANK
25
CITY OF DOWNEY Statement of Net Position GovernmentalBusiness-Type Activities Activities Total Assets: Cash and investments 114,641,665 $ 25,085,019 $ 139,726,684 $ Receivables: Accounts 5,727,130 5,004,172 10,731,302 Taxes 9,175,430 - 9,175,430 Notes and loans 13,511,808 - 13,511,808 Accrued interest 914,954 - 914,954 Leases 19,884,163 940,697 20,824,860 Internal balances 6,300,915 (6,300,915)Prepaid costs 2,619,410 21,714 2,641,124 Due from other governments 4,965,922 4,181 4,970,103 Inventories 94,515 373,301 467,816 Restricted assets: Cash with fiscal agent 11,001,653 - 11,001,653 Advances to Successor Agency 9,144,691 - 9,144,691 Capital assets not being depreciated 49,277,419 22,573,222 71,850,641 Capital assets, net of depreciation/amortization 242,712,605 63,714,375 306,426,980 Total Assets 489,972,280 111,415,766 601,388,046 Deferred Outflows of Resources: Deferred pension related items 61,527,797 1,178,654 62,706,451 Deferred OPEB related items 2,617,911 - 2,617,911 Total Deferred Outflows of Resources 64,145,708 1,178,654 65,324,362 Liabilities: Accounts payable 7,091,253 3,541,483 10,632,736 Accrued liabilities 1,770,470 347,866 2,118,336 Accrued interest 491,099 43,290 534,389 Unearned revenue 17,304,164 82,830 17,386,994 Deposits payable 3,121,097 64,610 3,185,707 Due to other governments 5,365 - 5,365 Noncurrent liabilities: Due within one year Long-term debt 8,254,310 675,917 8,930,227 Compensated absences 1,399,776 51,920 1,451,696 Claims and judgements 4,666,000 - 4,666,000 Leases payable 614,603 - 614,603 Subscriptions payable 45,963 - 45,963 Due in more than one year Long-term debt 184,276,309 5,945,118 190,221,427 Compensated absences 15,717,908 583,008 16,300,916 Claims and judgements 18,982,000 - 18,982,000 Leases payable 1,113,860 - 1,113,860 Net OPEB liability 6,903,787 - 6,903,787 Net pension liability 121,646,500 2,565,598 124,212,098 Total Liabilities 393,404,464 13,901,640 407,306,104 Deferred Inflows of Resources: Deferred pension related items 3,112,233 58,194 3,170,427 Deferred OPEB related items 1,153,037 - 1,153,037 Deferred inflow related to leases 19,694,036 931,446 20,625,482 Total Deferred Inflows of Resources 23,959,306 989,640 24,948,946
Position (Deficit): Net investment in capital assets 227,706,855 83,506,533 311,213,388 Restricted for: Community development 371,291 - 371,291 Public safety 37,901,857 - 37,901,857 Capital projects 2,849,499 6,522,319 9,371,818 Low and moderate income housing 7,936,685 - 7,936,685 Unrestricted (Deficit) (140,011,969) 7,674,288 (132,337,681) Total Net Position (Deficit) 136,754,218 $ 97,703,140 $ 234,457,358 $ Primary
June 30, 2023 See Notes to Financial Statements. 26
Net
Government
For the year ended June 30, 2023
General Revenues: Taxes: Property taxes, levied for general purpose
Transient occupancy taxes
Sales taxes
Property taxes in lieu of sales and use tax
Franchise taxes
Utility users tax
Other taxes
Restatement
Program Revenues
CITY OF DOWNEY
Activities OperatingCapital Charges forContributionsContributions ExpensesServicesand Grantsand Grants
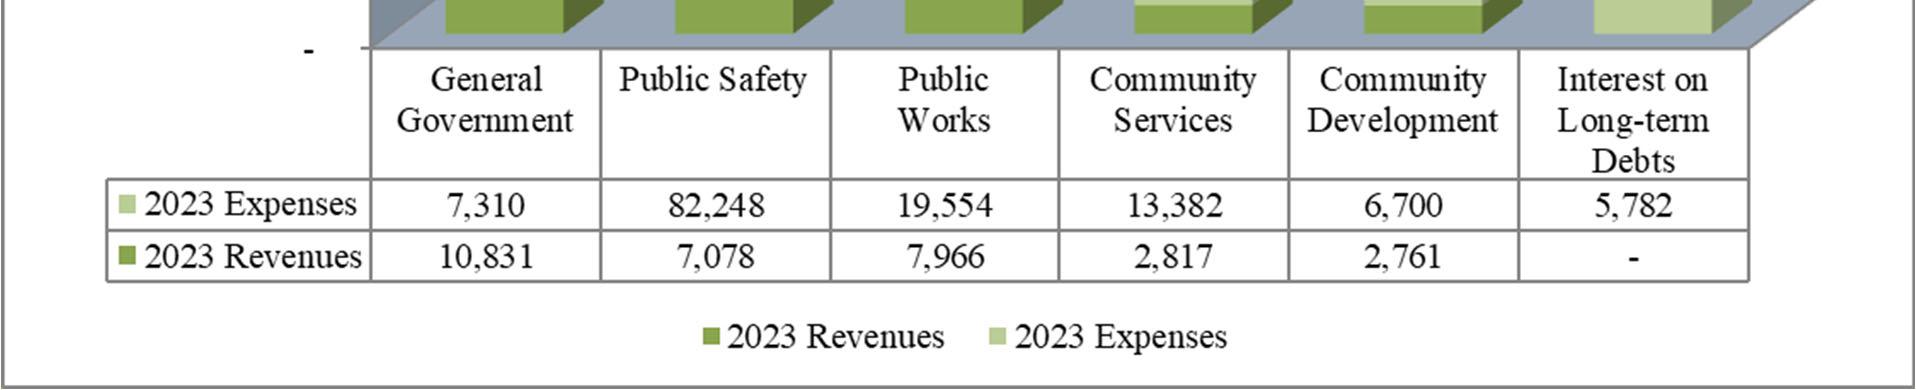
Governmental Activities: General government7,309,617 $ 9,647,470 $ 1,183,948 $ - $ Public safety82,247,776 6,360,650 717,539Community development6,700,226 1,512,565 - 1,248,192 Community services13,382,222 2,817,026 -Public works19,553,981 3,517,320 4,448,603Interest on long-term debt5,781,617 - -Total Governmental Activities134,975,439 23,855,031 6,350,090 1,248,192 Business-Type Activities: Water Fund 15,837,317 17,621,485 -Golf Fund 2,968,497 4,273,369 -Sewer and Storm Drain 2,671,907 1,430,688 -Total Business-Type Activities 21,477,721 23,325,542 -Total Primary Government 156,453,160 $ 47,180,573 $ 6,350,090 $ 1,248,192 $
Statement of
Functions/Programs Primary Government:
Use of money and property Other Gain on sale of capital asset Transfers Total General Revenues and Transfers Change in Net Position Net Position at Beginning of Year
of Net Position Net Position at End of Year
See Notes to Financial Statements. 27
Net (Expenses) Revenues and Changes in Net Position
Primary Government GovernmentalBusiness-Type ActivitiesActivitiesTotal 3,521,801 $ - $ 3,521,801 $ (75,169,587) - (75,169,587) (3,939,469) - (3,939,469) (10,565,196) - (10,565,196) (11,588,058) - (11,588,058) (5,781,617) - (5,781,617) (103,522,126) - (103,522,126) - 1,784,168 1,784,168 - 1,304,872 1,304,872 - (1,241,219) (1,241,219) - 1,847,821 1,847,821 (103,522,126) 1,847,821 (101,674,305) 34,554,878 - 34,554,878 2,236,398 - 2,236,398 37,050,193 - 37,050,193 12,864,842 - 12,864,842 3,239,477 - 3,239,477 10,328,335 - 10,328,335 3,245,191 - 3,245,191 4,700,567 647,475 5,348,042 7,107,092 1,800 7,108,892 129,431 - 129,431 893,346 (893,346)116,349,750 (244,071) 116,105,679 12,827,624 1,603,750 14,431,374 124,569,360 96,099,390 220,668,750 (642,766) - (642,766) 136,754,218 $ 97,703,140 $ 234,457,358 $
See Notes to Financial Statements. 28
June 30, 2023
CITY OF DOWNEY Balance Sheet Governmental
General Assets: Pooled cash and investments27,063,568 $ 2,666,990 $ 1,500,000 $ Receivables: Accounts 796,047 - 4,277,213 Taxes 8,424,705 -Notes and loans992,014 7,388,057Accrued interest576,772 338,182Leases19,884,163 -Prepaid costs 342,810 -Due from other governments1,753,761 - 1,376,559 Due from other funds7,928,416 -Inventories - -Restricted assets: Cash and investments with fiscal agents198,000 -Advances to Successor Agency7,707,214 1,437,477Total Assets 75,667,470 $ 11,830,706 $ 7,153,772 $ Liabilities, Deferred Inflows of Resources, and Fund Balances (Deficit): Liabilities: Accounts payable 4,458,175 $ - $ 147,293 $ Accrued liabilities 982,704 - 20,753 Unearned revenues 102,938 - 1,500,000 Deposits payable 3,121,097 -Due to other governments - -Due to other funds - - 4,918,095 Total Liabilities 8,664,914 - 6,586,141 Deferred Inflows of Resources: Unavailable revenues 61,432 7,726,239 2,849,499 Deferred inflows for leases 19,694,036 -Total Deferred Inflows of Resources 19,755,468 7,726,239 2,849,499 Fund Balances: Nonspendable: Nonspendable 9,042,038 -Restricted - 4,104,467Assigned 38,200,050 -Unassigned (Deficit) 5,000 - (2,281,868) Total Fund Balances (Deficit) 47,247,088 4,104,467 (2,281,868) Total Liabilities, Deferred Inflows of Resources, and Fund Balances (Deficit) 75,667,470 $ 11,830,706 $ 7,153,772 $
Funds
Housing Authority CIP Grant Fund Special Revenue Funds See Notes to Financial Statements. 29
Balance Sheet
Governmental Funds
June 30, 2023
Assets:
Pooled cash and investments
Receivables: Accounts Taxes
Notes and loans
Accrued interest
Leases
Prepaid costs
Due from other governments
Due from other funds
Inventories
Restricted assets:
Cash and investments with fiscal agents
Advances to Successor Agency
Total Assets
Liabilities, Deferred Inflows of Resources, and Fund Balances (Deficit):
Liabilities: Accounts payable
Accrued liabilities
Unearned revenues
Deposits payable Due to other governments
Due to other funds
Total Liabilities
Deferred Inflows of Resources: Unavailable revenues Deferred inflows for leases
Total Deferred Inflows of Resources Fund Balances: Nonspendable: Nonspendable Restricted Assigned Unassigned (Deficit)
Total Fund Balances (Deficit) Total Liabilities, Deferred Inflows of Resources, and Fund Balances (Deficit)
COVID-19 Grants
3,121,097
5,154,966 35,486,172
11,242,234
33,581,102 37,901,857
15,035,411 53,235,461
(332,420) (2,609,288)
99,770,264
$ 172,201,141 $
CITY OF DOWNEY
Special Revenue Funds OtherTotal GovernmentalGovernmental FundsFunds 15,430,242
40,737,085 $ 87,397,885
- 650,866 5,724,126 - 750,725 9,175,430 - 5,131,737 13,511,808 - - 914,954 - -
- 2,200,196
52,863 1,777,579
- - 7,928,416 - 14,247 14,247 - 10,803,653 11,001,653 - - 9,144,691 15,483,105 $ 62,066,088 $ 172,201,141 $ 32,513 $ 2,230,195 $ 6,868,176
1,990 712,040
15,232,314 468,912
- -
- 5,365
- 3,010,321
15,266,817 6,426,833 36,944,705 - 5,154,966
- -
-
-
216,288
-
216,288
15,483,105
62,066,088
$
$
19,884,163
2,543,006
4,960,762
$
1,717,487
17,304,164
5,365
7,928,416
15,792,136
19,694,036
2,200,196
-
50,484,289
$
See Notes to Financial Statements. 30
THIS PAGE INTENTIONALLY LEFT BLANK
31
Reconciliation of the Balance Sheet of Governmental Funds to the Statement of Net Position
30, 2023
Amounts reported for governmental activities in the statement of net position are different because:
Capital assets net of depreciation/amortization have not been included as financial resources in governmental fund activity.
Deferred outflows related to pension items for:
Accrued interest payable for the current portion of interest due on Bonds has not been reported in the governmental funds.
Governmental funds report all OPEB contributions as expenditures, however in the statement of net position any excesses or deficiencies in contributions in relation to the Actuarially Determined Contribution (ADC) are recorded as an asset or liability. (6,903,787)
Pension liabilities are not included in the governmental fund statements, however they are reported in the governmental activities in the Statement of Net Position:
Deferred inflows related to pension items due to: Pension related items:
differences between expected and actual experiences (824,390)
differences between expected and actual experiences (2,278,309)
OPEB related items:
and actual experiences
Revenues reported as unavailable revenue in the governmental funds and recognized in the statement of activities. These are included in the intergovernmental revenues in the governmental fund activity. 15,792,136
Internal service funds are used by management to charge the costs of certain activities, such as equipment management and employee benefits, to individual funds. The assets and liabilities of the internal service funds must be added to the statement of net position. 15,333,387 Net
CITY OF DOWNEY
Fund balances of governmental funds 99,770,264 $
287,763,345
Pension related items: Miscellaneous contributions made subsequent to measurement date 3,610,512 $ Miscellaneous changes of assumptions 3,056,525 Safety changes of assumptions 10,630,734 Safety contributions made subsequent to measurement date 9,971,088 Safety differences between expected and actual experience 445,964 Miscellaneous net difference between projected and actual earnings on pension plan investments 10,030,145 Safety net difference between projected and actual earnings on pension plan investments 23,589,733 OPEB related items: OPEB contributions made subsequent to measurement date 888,618 OPEB changes in assumptions 957,828 OPEB Net difference between projected and actual earnings 771,465 63,952,612
have not been
governmental
Bonds payable (179,229,526) Unamortized bond premiums/discounts (7,326,755) Loans payable (3,225,000) Finance purchases (1,689,247) Leases payable (712,006) Subscriptions payable (45,963) Claims payable (16,272,582) Compensated absences (4,479,640) (212,980,719)
Long-term debt and claims liabilities that
included in the
fund activity:
(491,099)
Miscellaneous
(36,345,077) Safety
net pension liability
net pension liability (84,881,108) (121,226,185)
Miscellaneous
Safety
(735,214)
Changes of assumptions (417,823) OPEB differences between expected
(4,255,736)
Position of Governmental Activities
June
See Notes to Financial Statements. 32
136,754,218 $
Statement of Revenues, Expenditures and Changes in Fund Balances Governmental Funds
For the Year Ended June 30, 2023
CITY OF DOWNEY
General Revenues: Taxes 86,358,716 $ - $ - $ Licenses and permits 2,069,704 -Intergovernmental 1,236,812 - 3,540,014 Charges for services 14,270,680 -Use of money and property3,809,090 290,405Fines and forfeitures 1,769,337 -Settlement - -Developer participation - -Miscellaneous 3,787,524 144,726Total Revenues 113,301,863 435,131 3,540,014 Expenditures: Current: General government 7,434,009 -Public safety 70,935,243 -Community development 4,003,188 80Community services 9,913,461 -Public works 11,376,316 -Capital outlay 577,447 - 1,431,800 Debt service: Principal retirement 93,153 -Interest and fiscal charges - -Total Expenditures 104,332,817 80 1,431,800 Excess (Deficiency) of Revenues Over (Under) Expenditures 8,969,046 435,051 2,108,214 Other Financing Sources (Uses): Transfers in 4,369,776 -Transfers out (19,692,982) -Leases financing - -Subscriptions financing 139,116 -Total Other
(15,184,090) -Net Change in Fund Balances (6,215,044) 435,051 2,108,214 Fund Balances, Beginning of Year, as Previously Reported 53,462,132 3,669,416 (4,290,949) Restatements - - (99,133) Fund Balances, Beginning of Year, as Restated 53,462,132 3,669,416 (4,390,082) Fund Balances (Deficit), End of Year 47,247,088 $ 4,104,467 $ (2,281,868) $ Special Revenue Funds Housing Authority CIP Grant Fund
Financing Sources (Uses)
See Notes to Financial Statements. 33
Statement of Revenues, Expenditures and Changes in Fund Balances Governmental Funds
For the Year Ended June 30, 2023 Special Revenue Funds
COVID-19 Grants
Revenues: Taxes
Licenses and permits
Intergovernmental Charges for services
Use of money and property
Fines and forfeitures
Settlement
Developer participation
Miscellaneous
Total Revenues
Expenditures:
Current:
General government Public safety Community development Community services Public works
Capital outlay
Debt service: Principal retirement Interest and fiscal charges
Total Expenditures
Excess (Deficiency) of Revenues Over (Under) Expenditures
Other Financing Sources (Uses): Transfers in Transfers out Leases financing
Subscriptions financing
Total Other Financing Sources (Uses)
Net Change in Fund Balances
Fund Balances, Beginning of Year, as Previously Reported Restatements
Fund Balances, Beginning of Year, as Restated Fund Balances (Deficit), End of Year
2,069,704
3,633,569
2,475,920 2,475,920 - 1,821,475 1,821,475
4,631,942
72,464,805 9,477 2,819,493 6,832,238
992,410 10,967,345
3,817,441 15,250,729 - 19,146,042 21,155,289 - 8,194,364 8,287,517 - 5,959,720 5,959,720 303,624 42,314,309 148,382,630 257,749 (10,488,437) 1,281,623 - 21,279,982 25,649,758 (5,024) (5,058,406) (24,756,412) - 417,693 417,693 - - 139,116 (5,024) 16,639,269 1,450,155 252,725 6,150,832 2,731,778 (36,437) 44,877,090 97,681,252 - (543,633) (642,766) (36,437) 44,333,457 97,038,486 216,288 $ 50,484,289 $ 99,770,264 $
CITY
DOWNEY
OF
OtherTotal GovernmentalGovernmental FundsFunds -
17,160,598
- -
361,511 4,925,883
- 2,476,862
199,862 401,210
- 1,864,232
-
561,373 31,825,872
28,728 2,250
146,973
$
$ 103,519,314 $
10,064,220
16,747,542
4,700,567
-
699,692
149,664,253
7,464,987
1,382,589
61,474
56,972
See Notes to Financial Statements. 34
Reconciliation of the Statement of Revenues, Expenditures, and Changes in Fund Balances of Governmental Funds to the Statement of Activities
For the Year Ending June 30, 2023
Net change in fund balances - total governmental funds 2,731,778 $
Amounts reported for governmental activities in the statement of activities are different because:
Governmental funds report capital outlays as expenditures. However, in the statement of activities, the costs of those assets is allocated over their estimated useful lives as depreciation expense. This is the amount by which capital outlays exceeded depreciation in the current period.
Governmental funds report capital outlays as expenditures. However, in the statement Repayment of bond principal is an expenditure in the governmental funds, but the repayment reduces long-term liabilities in the statement of net position.
repayments
Accrued interest for long-term liabilities. This is the net change in accrued interest for the current period. 9,073
Compensated absences expenses reported in the statement of activities do not require the use of current financial resources and, therefore, are not reported as expenditures in governmental funds. (502,113)
Claims and judgements expenses reported in the statement of activities do not require the use of current financial resources and, therefore, are not reported as expenditures in governmental funds. 828,000
Governmental funds report all contributions in relation to the actuarially determined contribution (ADC) for OPEB as expenditures, however in the statement of activities only the ADC is an expense. 145,948
Pension obligation expenses reported in the statement of activities do not require the use of current financial resources and, therefore, are not reported as expenditures in the governmental funds. (7,064,614)
Revenues reported as unavailable revenue in the governmental funds and recognized in the statement of activities. These are included in the intergovernmental revenues in the governmental fund activity. (2,883,967)
Internal service funds are used by management to charge the costs of certain activities, such as equipment management and employee benefits, to individual funds. The net revenues (expenses) of the internal service funds is reported with governmental activities. (1,609,854)
Change in Net Position of Governmental Activities 12,827,624 $
CITY OF DOWNEY
Capital outlay 20,966,397 $ Depreciation/amortization (7,928,332) Gain/(loss) on sale of capital assets 8,283 13,046,348
Principal
7,527,597 Amortization of bond premiums/discounts 396,317 Leases issued (417,693) Lease repayments 313,767 Subscription issued (139,116) Subscription repayments 93,153 Loan repayments 353,000 8,127,025
See Notes to Financial Statements. 35
CITY OF DOWNEY
of Net
Proprietary
Governmental ActivitiesInternal TotalsService Funds Assets: Current: Cash and investments13,066,950 $ 4,412,766 $ 7,605,303 $ 25,085,019 $ 27,243,780 $ Receivables: Accounts 4,626,888 - 377,284 5,004,172 3,004 Leases - 940,697 - 940,697Prepaid costs 19,503 661 1,550 21,714 76,404 Due from other governments1,000 3,181 - 4,181 5,160 Inventories 373,301 - - 373,301 80,268 Total Current Assets18,087,642 5,357,305 7,984,137 31,429,084 27,408,616 Noncurrent: Capital assets - net of accumulated depreciation/amortization46,360,679 13,638,934 26,287,984 86,287,597 4,226,679 Total Noncurrent Assets46,360,679 13,638,934 26,287,984 86,287,597 4,226,679 Total Assets64,448,321 18,996,239 34,272,121 117,716,681 31,635,295 Deferred Outflows of Resources: Deferred pension related items923,556 5,064 250,034 1,178,654 193,096 Total Deferred Outflows of Resources923,556 5,064 250,034 1,178,654 193,096 Liabilities: Current: Accounts payable3,309,486 188,069 43,928 3,541,483 223,077 Accrued liabilities273,869 2,741 71,256 347,866 52,983 Accrued interest 6,657 34,765 1,868 43,290Unearned revenues - 82,830 - 82,830Deposits payable 64,610 - - 64,610Accrued compensated absences 45,336 - 6,584 51,920 704,436 Accrued claims payable - - - - 3,401,000 Bonds, notes, and loans payable 110,007 535,000 30,910 675,917 169,782 Leases payable - - - - 300,448 Total Current Liabilities 3,809,965 843,405 154,546 4,807,916 4,851,726 Noncurrent: Accrued compensated absences 509,080 - 73,928 583,008 11,933,608 Accrued claims payable - - - - 3,974,418 Bonds, notes, loans and leases 3,298,338 1,720,000 926,780 5,945,118 890,308 Leases payable - - - - 716,010 Net pension liability 2,010,322 11,023 544,253 2,565,598 420,315 Total Noncurrent Liabilities 5,817,740 1,731,023 1,544,961 9,093,724 17,934,659 Total Liabilities 9,627,705 2,574,428 1,699,507 13,901,640 22,786,385 Deferred Inflows of Resources: Deferred pension related items 45,599 250 12,345 58,194 9,534 Related to leases - 931,446 - 931,446Total Deferred Inflows of Resources 45,599 931,696 12,345 989,640 9,534 Net Position: Net investment in capital assets 45,834,615 11,383,934 26,287,984 83,506,533 2,759,570 Restricted for capital projects - - 6,522,319 6,522,319Unrestricted 9,863,958 4,111,245 - 13,975,203 6,272,902 Total Net Position (Deficit) 55,698,573 $ 15,495,179 $ 32,810,303 $ 104,004,055 $ 9,032,472 $ Reconciliation of Net Position to the Statement of Net Position Net Position per Statement of Net Position - Proprietary Funds 104,004,055 $ Prior years' accumulated adjustment to reflect the consolidation of internal service funds activities related to the enterprise funds (6,214,648) Current years' adjustments to reflect the consolidation of internal service activities related to enterprise funds (86,267) Net Position per Statement of Net Position 97,703,140 $ June
Business-Type Activities - Enterprise Funds Water Fund Golf Fund Sewer and Storm Drain See Notes to Financial Statements. 36
Statement
Position
Funds
30, 2023
Statement of Revenues, Expenses and Changes in Fund Net Position Proprietary Funds
For the Year Ended June 30, 2023
-
Funds
Reconciliation of Changes in Net Position to the Statement of Activities: Changes in Net Position, per the Statement of Revenues, Expenses and Changes in Fund Net Position - Proprietary Funds
Adjustment to reflect the consolidation of current fiscal year internal service funds activities related to enterprise funds (86,267) Changes in Net Position of Business-Type 1,603,750 $ Activities per Statement of Activities
CITY OF DOWNEY
Governmental ActivitiesInternal TotalsService Funds Operating Revenues: Sales and service charges 17,173,107 $ 4,273,369 $ 1,430,688 $ 22,877,164 $ - $ Interdepartmental charges - - - - 4,784,937 Miscellaneous 448,378 - 1,800 450,178 476,558 Total Operating Revenues 17,621,485 4,273,369 1,432,488 23,327,342 5,261,495 Operating Expenses: Purchased water 6,023,012 - - 6,023,012Maintenance and operations 4,703,928 2,528,847 278,143 7,510,918 2,580,860 General and administrative 3,937,402 110,628 778,540 4,826,570 250,772 Employee benefits 1,418 - 5,635 7,053 3,771,626 Depreciation/amortization expense 1,005,111 243,999 1,587,062 2,836,172 435,203 Total Operating Expenses 15,670,871 2,883,474 2,649,380 21,203,725 7,038,461 Operating Income (Loss) 1,950,614 1,389,895 (1,216,892) 2,123,617 (1,776,966) Nonoperating Revenues (Expenses): Interest revenue 277,782 281,882 87,811 647,475Interest expense (80,179) (85,023) (22,527) (187,729) (51,672) Grant subsidy - - - - 3,086 Gain (loss) on disposal of capital assets - - - - 129,431 Total Nonoperating Revenues (Expenses) 197,603 196,859 65,284 459,746 80,845 Income (Loss) Before Transfers 2,148,217 1,586,754 (1,151,608) 2,583,363 (1,696,121) Transfers in 5,024 - 576,630 581,654Transfers out (1,475,000) - - (1,475,000)Changes in Net Position 678,241 1,586,754 (574,978) 1,690,017 (1,696,121)
Beginning of Year 55,020,332 13,908,425 33,385,281 102,314,038 10,728,593 End of Fiscal Year 55,698,573 $ 15,495,179 $ 32,810,303 $ 104,004,055 $ 9,032,472 $
Net Position:
1,690,017 $
See Notes to Financial Statements. 37
Business-Type Activities
Enterprise
Water Fund Golf Fund Sewer and Storm Drain
For the Year Ended June 30, 2023
CITY OF DOWNEY
of Cash Flows
Governmental ActivitiesInternal TotalsService Funds Cash Flows from Operating Activities: Cash received from customers and users16,744,234 $ 4,322,383 $ 1,441,867 $ 22,508,484 $ 4,788,358 $ Cash paid to suppliers for goods and services(5,248,313) (2,548,675) (140) (7,797,128) (5,830,532) Cash paid to employees for services(10,621,238) (128,048) (1,106,271) (11,855,557) (246,791) Cash received from others448,378 - 1,800 450,178Net Cash Provided (Used) by Operating Activities1,323,061 1,645,660 337,256 3,305,977 (1,288,965) Cash Flows from Non-Capital Financing Activities: Cash transfers in 5,024 - 576,630 581,654Cash transfers out (1,475,000) - - (1,475,000)Principal paid on pension obligation bond(111,400) - (31,302) (142,702) (19,920) Interest paid on pension obligation bond(80,206) - (22,537) (102,743) (16,618) Advance from other funds - - - - 1,271,173 Grant subsidies - 49,796 - 49,796 3,086 Net Cash Provided (Used) by Non-Capital Financing Activities(1,661,582) 49,796 522,791 (1,088,995) 1,237,721 Cash Flows from Capital and Related Financing Activities: Acquisition and construction of capital assets(4,859,062) - (2,381) (4,861,443) (119,785) Principal paid on lease liability- - - - (260,201) Principal paid on capital debt - (515,000) - (515,000) (242,430) Interest paid on capital debt - (85,023) - (85,023) (23,662) Interest paid on lease liability - - - - (11,392) Proceeds(losses) from sales of capital assets - - - - 129,544 Net Cash Provided (Used) by Capital and Related Financing Activities (4,859,062) (600,023) (2,381) (5,461,466) (527,926) Cash Flows from Investing Activities: Interest received 278,616 273,943 88,090 640,649Net Cash Provided (Used) by Investing Activities 278,616 273,943 88,090 640,649Net Increase (Decrease) in Cash and Cash Equivalents (4,918,967) 1,369,376 945,756 (2,603,835) (579,170) Cash and Cash Equivalents at Beginning of Year 17,985,917 3,043,390 6,659,547 27,688,854 27,822,950 Cash and Cash Equivalents at End of Year 13,066,950 $ 4,412,766 $ 7,605,303 $ 25,085,019 $ 27,243,780 $ Reconciliation of Operating Income to Net Cash Provided (Used) by Operating Activities: Operating income (loss) 1,950,614 $ 1,389,895 $ (1,216,892) $ 2,123,617 $ (1,776,966) $ Adjustments to Reconcile Operating Income (loss) Net Cash Provided (used) by Operating Activities: Depreciation/amortization 1,005,111 243,999 1,587,062 2,836,172 435,203 (Increase) decrease in accounts receivable (425,913) - (32,419) (458,332) 3,421 (Increase) decrease in due from other governments - - - - 3,112 (Increase) decrease in inventories (59,262) - - (59,262) 7,278 (Increase) decrease in prepaid expense (15,273) (661) (140) (16,074) (6,273) (Increase) decrease in deferred pension related outflows (715,458) (4,261) (192,381) (912,100) (151,783) Increase (decrease) in accounts payable (1,234,958) (19,167) 43,598 (1,210,527) 34,272 Increase (decrease) in accrued liabilities (58,828) (1,854) (9,115) (69,797) (12,694) Increase (decrease) in deposits payable (2,960) - - (2,960)Increase (decrease) in unearned revenue - 53,439 - 53,439Increase (decrease) in compensated absences 149,062 (17,465) (31,969) 99,628 8,663 Increase (decrease) in net pension liability 1,684,042 9,764 453,858 2,147,664 355,540 Increase (decrease) in deferred pension related inflows (953,116) (3,604) (264,346) (1,221,066) (188,738) (Increase) decrease in leases receivable - 138,874 - 138,874Increase (decrease) in deferred leases revenue inflows - (143,299) - (143,299)Total Adjustments (627,553) 255,765 1,554,148 1,182,360 488,001 Net Cash Provided (Used) by Operating Activities 1,323,061 $ 1,645,660 $ 337,256 $ 3,305,977 $ (1,288,965) $ Non-Cash Investing, Capital, and Financing Activities: Lease assets acquired - $ - $ - $ - $ 334,372 $
Business-Type
Enterprise
Water Fund Golf Fund Sewer and Storm Drain See Notes to Financial Statements. 38
Statement
Proprietary Funds
Activities -
Funds
Statement of Fiduciary Net Position
Funds
1,480,451
9,209,760
CITY OF DOWNEY
Assets: Cash and investments1,137,943 $ 7,503,447 $ Receivables: Accounts - 36,722 Taxes - 3,846 Restricted cash and investments with fiscal agents663,404Accrued interest receivable- 3,587 Due from other governments- 97,417 Capital assets: Capital assets, not being depreciated- 110,490 Capital assets, net of accumulated depreciation- 2,934,702 Total Assets1,801,347 10,690,211 Liabilities: Accounts payable - 748,377 Accrued liabilities - 638,150 Accrued interest 69,188Unearned revenues810,980 14,997 Deposits payable 2,500 50,464 Due to other governments- 28,463 Long- term liabilities Due in one year Bonds payable 475,000Due in more than one year Bonds payable 2,765,000Advances from the City 9,144,691Advances from the County38,311,279Total Liabilities51,578,638
Net Position (Deficit): Restricted for organizations and other governments-
Restricted for other purposes(49,777,291)Total Net Position
$
Private-Purpose
See Notes to Financial Statements. 39
Fiduciary
9,209,760
(Deficit)(49,777,291)
$ June 30, 2023
Trust Fund Custodial Funds
Statement of Changes
Fiduciary Funds For the Year Ending June 30, 2023
CITY OF DOWNEY
Additions: Taxes 136,707 $ 107,897 $ Intergovernmental - 6,157,539 Investment income20,434 99,195 Miscellaneous2,410,095 427,975 Total Additions2,567,236
Benefits - 8,514 Administrative expenses53,682 5,486,847 Contractual services4,682 188,307 Capital outlay - 147,439 Interest expense4,254,067Depreciation expense - 165,277 Total Deductions4,312,431 5,996,384 Net
in Fiduciary
Position(1,745,195)
Net
Net Position
Custodial Funds Private-Purpose Trust Fund See Notes to Financial Statements. 40
in Fiduciary Net Position
6,792,606 Deductions:
Increase
Net
796,222
Position (Deficit) - Beginning(48,032,096) 8,413,538
(Deficit) - Ending(49,777,291) $ 9,209,760 $
THIS PAGE INTENTIONALLY LEFT BLANK
41

'iN ' J ·•.• �K ,, .
42
NOTES TO BASIC FINANCIAL STATEMENTS
THIS PAGE INTENTIONALLY LEFT BLANK
43
Notes to the Financial Statements
For the Year Ended June 30, 2023
NOTE 1: ORGANIZATION AND SUMMARY OF SIGNIFICANT ACCOUNTING POLICIES
A. Description of Entity
The basic financial statements of the City of Downey (the City) include the activities of the City of Downey Public Facilities Financing Corporation (the Corporation) the City of Downey Housing Authority (the Housing Authority) and the City of Downey Public Financing Authority (the Financing Authority).
The City of Downey was incorporated in 1956 under the General Laws of the State of California and became a charter City in 1964. The City operates under a Council-Manager form of government governed by a five-member council and provides the following services: public safety (police, fire, paramedic and ambulance), highways and streets, parks and recreation, public improvements, planning and zoning, and general administrative services.
The criteria used in determining the scope of the reporting entity are based on the provisions of the Governmental Accounting Standards Board (GASB). The City of Downey is the primary government unit. Component units are those entities which are financially accountable to the primary government, either because the City appoints a voting majority of the component unit’s board, or because the component unit will provide a financial benefit or impose a financial burden on the City. The City has accounted for the Corporation and Housing Authority as “blended” component units. Despite being legally separate, these entities are so intertwined with the City that they are, in substance, part of the City’s operations. Accordingly, these basic financial statements present the City and its component units, the City of Downey Public Facilities Financing Corporation, Housing Authority, and Public Financing Authority. Each blended component unit has a June 30 year end.
The City of Downey Public Facilities Financing Corporation, formerly known as City of Downey Civic Center Corporation, is a non-profit corporation organized June 1, 1981 for the purpose of assisting, through the issuance of revenue bonds, the financing necessary to construct public buildings and facilities for the City. The activities of the Corporation are reported in the proprietary fund financial statements as part of the golf enterprise fund. The Corporation prepares separate Basic Financial Statements and a copy can be obtained from the City’s Finance Department.
The City of Downey Housing Authority was established by the City Council on October 22, 1974 and is responsible for the administration of providing affordable housing in the City. The Housing Authority provides services entirely to the City and is governed by a five-member Board of Director which consists of members of the City Council. The City has operational responsibility over the Housing Authority. The Housing Authority’s financial transactions are reported in the Special Revenue Funds. The Housing Authority does not prepare separate Basic Financial Statements.
The City of Downey Public Financing Authority was created by the City of Downey Public Financing Authority under a Joint exercise of Powers Agreement to assist the Public Financing Authority in financing capital improvement projects, through the issuance of Lease Revenue Bonds. The Authority’s assets and liabilities are presented in the Measure S 2017 LRB fund and Measure M and R Bonds.
B. Government-Wide and Fund Financial Statements
The government-wide financial statements (i.e., the statement of net position and the statement of activities) report information on all of the nonfiduciary activities of the primary government and its component units. For the most part, the effect of interfund activity has been removed from these statements. Governmental activities, which normally are supported by taxes and intergovernmental revenues, are reported separately from business-type activities, which rely to a significant extent on fees and charges for support. Likewise, the primary government (including its blended component units) is reported separately from discretely presented component units for which the primary government is financially accountable. The City has no discretely presented component units.
CITY OF DOWNEY
44
Notes to the Financial Statements
For the Year Ended June 30, 2023
NOTE 1: ORGANIZATION AND SUMMARY OF SIGNIFICANT ACCOUNTING POLICIES (CONTINUED)
Certain eliminations have been made as prescribed by the GASB in regard to interfund activities, payables and receivables. All internal balances in the Statement of Net Position have been eliminated except those representing balances between the governmental activities and the business-type activities, which are presented as internal balances and eliminated in the total primary government column. In the Statement of Activities, internal service fund transactions have been eliminated; however, those transactions between governmental and business-type activities have not been eliminated.
The statement of activities demonstrates the degree to which the direct expenses of a given function or segment is offset by program revenues. Direct expenses are those that are clearly identifiable with a specific function or segment. Program revenues include: 1) charges to customers or applicants who purchase, use or directly benefit from goods, services or privileges provided by a given function or segment, and 2) grants and contributions that are restricted to meeting the operational or capital requirements of a particular function or segment. Taxes and other items not properly included among program revenues are reported instead as general revenues.
The underlying accounting system of the City is organized and operated on the basis of separate funds, each of which is considered to be a separate accounting entity. The operations of each fund are accounted for with a separate set of self-balancing accounts that comprise its assets, deferred outflows of resources, liabilities, deferred inflows of resources, fund equity, revenues and expenditures or expenses, as appropriate. Governmental resources are allocated to and accounted for in individual funds based upon the purposes for which they are to be spent and the means by which spending activities are controlled.
Separate financial statements for the City’s governmental, proprietary, and fiduciary funds are presented after the government-wide financial statements. These statements display information about major funds individually and other funds in the aggregate for governmental and enterprise funds. Fiduciary statements, even though excluded from the government-wide financial statements, include financial information that represent the private purpose trust fund and custodial funds.
C. Measurement Focus, Basis of Accounting and Financial Statement Presentation
The government-wide financial statements are reported using the economic resources measurement focus and the accrual basis of accounting, as are the proprietary and private purpose trust fund financial statements. Under the economic resources measurement focus, all assets, deferred outflows of resources, liabilities, and deferred inflows of resources (whether current or noncurrent) associated with their activity are included on their Statements of Net Position. Operating statements present increases (revenues) and decreases (expenses) in total net position. Under the accrual basis of accounting, revenues are recorded when earned and expenses are recorded when a liability is incurred, regardless of the timing of related cash flows.
Proprietary funds distinguish operating revenues and expenses from nonoperating items. Operating revenues and expenses generally result from providing services and producing and delivering goods in connection with a proprietary fund’s principal ongoing operations.
Nonexchange transactions, in which the City gives (or receives) value without directly receiving (or giving) equal value in exchange include property taxes, grants, entitlements, and donations. On an accrual basis, revenue from property taxes is recognized in the fiscal year in which the taxes are levied. Revenue from grants, entitlements, and donations is recognized in the fiscal year in which all the eligibility requirements have been satisfied. Operating expenses for proprietary funds include the cost of sales and services, administrative expenses, and depreciation on capital assets. All revenues and expenses not meeting this definition are reported as nonoperating revenues and expenses.
Governmental fund financial statements are reported using the current financial resources measurement focus and the modified accrual basis of accounting. Under the current financial resources measurement focus, only current assets and deferred outflows of resources and current liabilities and deferred inflows of resources are generally included on the balance sheets. The reported fund balance (net current assets) is considered to be a measure of “available spendable resources.” Governmental fund operating statements present increases
CITY OF DOWNEY
45
Notes to the Financial Statements
For the Year Ended June 30, 2023
NOTE 1: ORGANIZATION AND SUMMARY OF SIGNIFICANT ACCOUNTING POLICIES (CONTINUED)
(revenues and other financing sources) and decreases (expenditures and other financing uses) in net current assets. Accordingly, they are said to present a summary of sources and uses of “available spendable resources” during a period. Noncurrent portions of long-term receivables due to governmental funds are reported on their balance sheets in spite of their spending measurement focus. However, special reporting treatments are used to indicate that they should not be considered “available spendable resources” since they do not represent net current assets. Recognition of governmental fund type revenue represented by noncurrent receivables is reported as deferred inflows of resources.
Under the modified accrual basis of accounting, revenues are considered to be available when they are collectible within the current period or soon enough thereafter to pay liabilities of the current period. For this purpose, the City considers revenues to be available if they are collected within 90 days of the end of the current fiscal period. Expenditures generally are recorded when a liability is incurred, except for principal and interest on long-term liabilities, claims and judgments, and compensated absences which are recognized as expenditures to the extent they have matured. Capital asset acquisitions are reported as expenditures in governmental funds. Proceeds of long-term liabilities are reported as other financing sources.
Property taxes, franchise taxes, licenses and interest associated with the current fiscal period are all considered to be susceptible to accrual and so have been recognized as revenues of the current fiscal period. Only the portion of special assessments receivable due within the current fiscal period is considered to be susceptible to accrual as revenue of the current period. All other revenue items are considered to be measurable and available only when the government receives cash.
The City’s Fiduciary Funds consists of the private purpose trust fund which is reported using the economic resources measurement focus and the accrual basis for reporting its assets and liabilities.
D. Fund Classifications
The City reports the following major governmental funds:
The General Fund is the general operating fund of the City. All general tax receipts and fee revenue not allocated by law, Council policy or contractual agreement to other funds are accounted for in the General Fund. General Fund expenditures include operations traditionally associated with activities, which are not required to be accounted for or paid by another fund.
The Housing Authority Fund is used to account for revenues generated by housing assets received from former redevelopment agency and associated expenditures to be used for increasing or improving low- and moderate-income housing.
The CIP Grant Fund is used to account for revenues received for various street and infrastructure capital improvements.
The COVID-19 Grants Fund is used to account for special revenues from federal funding and payments from funding due to the coronavirus pandemic.
The City reports the following major proprietary funds:
The Water Fund is used to account for the provision of water services to residential, commercial and industrial customers.
The Golf Fund is used to account for all revenues and expenses related to the City - operated golf course, driving range and clubhouse.
The Sewer and Storm Drain Fund is used to account for charges collected for the upkeep of sanitary sewers and federally required drainage upkeep programs.
CITY OF DOWNEY
46
Notes to the Financial Statements
For the Year Ended June 30, 2023
NOTE 1: ORGANIZATION AND SUMMARY OF SIGNIFICANT ACCOUNTING POLICIES (CONTINUED)
The City’s fund structure also includes the following fund types:
The Special Revenue Funds are used to account for proceeds of specific revenue sources that are legally restricted or otherwise restricted for specific purposes.
The Debt Service Fund is used to account for the servicing of long-term debt.
The Capital Projects Funds are used to account for financial resources used for the acquisition or construction of major capital facilities.
The Internal Service Funds are used to account for the financing of special activities that provide services within the City. These activities include compensation and other employee benefits, and equipment purchase and maintenance.
The Private-Purpose Trust Fund is used to account for the activities of the Successor Agency to the Community Development Commission of the City of Downey.
The Custodial Funds are used to account for money and property held by the City as trustee, agent, or custodian.
The City’s fund structure also includes the following departmental classifications:
Operating expenditures of the City are classified by department. Departmental classifications are defined as follows:
General Government Department includes the legislative, city clerk, city attorney, city manager, personnel, finance, purchasing, and information technology divisions.
Public Safety Department includes police, fire and paramedic, and animal control operations.
Public Works Department includes maintenance and engineering divisions.
Community Services Department includes the recreation, theatre, social services, and the library divisions.
Community Development Department includes planning, redevelopment and building safety divisions.
E. Cash and investments
The City pools idle cash from all funds for purposes of increasing income through investment activities. Investments are stated at fair value (quoted market price or best available estimate thereof). The City intends to either hold the investments until maturity or until market values equal or exceed cost. Interest income on investments is allocated among funds on the basis of average monthly cash and investment balances (see Note 4).
F. Accounts Receivable
The City extends credit to customers in the normal course of operations. The City accounts for potential losses in accounts receivable utilizing the allowance method. Management evaluates all accounts receivable and if it is determined that they are uncollectible they are written off as a bad debt expense.
G. Inventories
Inventories are valued at cost on a first-in first-out basis and are accounted for under the consumption method, whereby inventories are capitalized and recorded as expenditures as used. Water Enterprise Fund inventories consist primarily of water pipes, valves, and fittings. Inventories of fuel are recorded in the Equipment Internal Service Fund.
CITY OF DOWNEY
47
Notes to the Financial Statements
For the Year Ended June 30, 2023
NOTE 1: ORGANIZATION AND SUMMARY OF SIGNIFICANT ACCOUNTING POLICIES (CONTINUED)
H. Capital Assets
Capital assets are recorded at cost where historical records are available and at an estimated original cost where no historical records exist. Donated assets and capital assets received in a service concession arrangement would be reported at acquisition value. Generally, capital asset purchases in excess of $5,000 are capitalized if they have an expected useful life of 1 year or more.
Capital assets include additions to public domain (infrastructure), certain improvements including pavement, curb and gutter, sidewalks, traffic control devices, streetlights, sewers, bridges and right-of-way corridors within the City. The City has valued and recorded all infrastructure asset data as of June 30, 2014.
Capital assets used in operations are depreciated over their estimated useful lives using the straight-line method in the Government-wide Financial Statements and in the Fund Financial Statements of the Enterprise Funds. Depreciation/amortization is charged as an expense against operations and accumulated depreciation/amortization is reported on the respective Statements of Net Position.
The lives used for depreciation/amortization purposes of each capital asset class are:
Lease assets Shorter of the leased asset’s useful life or the lease term
Subscription assets............................. Shorter of the subscription asset’s useful life or the lease term
I. Deferred Outflows/Inflows of Resources
In addition to assets, the Statement of Net Position and governmental balance sheet will sometimes report a separate section for deferred outflows of resources. This separate financial statement element, deferred outflows of resources, represents a consumption of net assets that applies to a future period(s) and so will not be recognized as an outflow of resources (expense/expenditure) until then. The City has two items that qualify for reporting in this category, the deferred outflows relating to deferred pension related items, and deferred OPEB related items, reported in the statements of net position. These outflows are the results of contributions made after the measurement period, which are recognized in the following year.
In addition to liabilities, the Statement of Net Position and Governmental Balance Sheet will sometimes report a separate section for deferred inflows of resources. This separate financial statement element, deferred inflows of resources, represents an acquisition of net assets that applies to a future period(s) and will not be recognized as an inflow of resources (revenue) until that time. The City has three types of items in this category. One arises only under a modified accrual basis of accounting that qualifies for reporting in this category. Accordingly, the item, unavailable revenues, is reported only in the governmental fund balance sheet. The governmental funds report unavailable revenues from two sources: taxes and long-term notes receivable. These amounts are deferred and recognized as an inflow of resources in the period that the amounts become available. The second item is in relation to the net pension liability and net OPEB liability, reported in the statement of net position. Gains and losses related to changes in total pension liability, total OPEB liability and fiduciary net position are recognized in pension or OPEB expense systematically over time. Amounts are first recognized in pension or OPEB expense for the year the gain or loss occurs. The remaining amounts are categorized as deferred outflows and deferred inflows of resources related to pension or OPEB and are to be recognized in future pension or OPEB expense. The third item relates to leases where the City is the lessor and relates to the future payments that will be recognized in future years.
CITY OF DOWNEY
Buildings ..................................................... ............. 50 years Improvements
........................................................................................ 20 years Water
lines ...................................... ...... 50 years Water tanks,
equipment .................................................... 15 to 40 years Vehicles ...................................................... ....... 3 to 15 years Machinery and
................................................................................................ 5 to 10 years Office furniture,
............................................................................. 10 years Infrastructure .................................................... 20
other than buildings
distribution
meters, hydrants, and other
equipment
computers and equipment
to 50 years
48
Notes to the Financial Statements
For the Year Ended June 30, 2023
NOTE 1: ORGANIZATION AND SUMMARY OF SIGNIFICANT ACCOUNTING POLICIES (CONTINUED)
The recognition period differs depending on the source of the gain or loss:
Net difference between projected and actual earning on pension or OPEB plan investments 5 years
All other amounts
Expected average remaining service lifetime (EARSL) for the OPEB plan, Miscellaneous pension plan, and Safety pension plan are 7.68 Years, 2.1 Years, and 3.6 Years, respectively at June 30, 2021)
J. Net Position Flow Assumptions
Sometimes the City will fund outlays for a particular purpose from both restricted (e.g., restricted bond or grant proceeds) and unrestricted resources. In order to calculate the amounts to report as restricted - net position and unrestricted - net position in the government-wide and proprietary fund financial statements, a flow assumption must be made about the order in which the resources are considered to be applied.
It is the City’s practice to consider restricted - net position to have been depleted before unrestricted - net position is applied.
K. Fund Balance
The fund balances reported on the fund statements consist of the following categories:
Nonspendable Fund Balance - This classification includes amounts that cannot be spent because they are either (a) not in spendable form or (b) legally or contractually required to be maintained intact.
Restricted Fund Balance - This classification includes amounts that can be spent only for specific purposes stipulated by constitution, external resource providers or through enabling legislation.
Committed Fund Balance - This classification includes amounts that can be used only for the specific purposes determined by a formal action of the government’s highest level of decision-making authority. The governing council is the highest level of decision-making authority for the government that can, by adoption of an ordinance prior to the end of the fiscal year, commit fund balance. Once adopted, the limitation imposed by the ordinance remains in place until a similar action is taken (the adoption of another ordinance) to remove or revise the limitation.
Assigned Fund Balance - This classification includes amounts intended to be used by the government for specific purposes but do not meet the criteria to be classified as committed. The governing council (council) has authorized the finance director to assign fund balance. The council may also assign fund balance as it does when appropriating fund balance to cover a gap between estimated revenue and appropriations in the subsequent year’s appropriated budget. Unlike commitments, assignments generally only exist temporarily. In other words, an additional action does not normally have to be taken for the removal of an assignment. Conversely, as discussed above, an additional action is essential to either remove or revise a commitment.
Unassigned Fund Balance - This classification includes the residual balance for the government’s general fund and includes all spendable amounts not contained in other classifications. In other funds, the unassigned classification is used only to report a deficit balance resulting from overspending for specific purposes for which amounts had been restricted, committed or assigned.
When an expenditure is incurred for purposes for which both restricted and unrestricted fund balances are available, the City’s policy is to apply restricted fund balance first.
CITY OF DOWNEY
49
CITY OF DOWNEY
Notes to the Financial Statements
For the Year Ended June 30, 2023
NOTE 1: ORGANIZATION AND SUMMARY OF SIGNIFICANT ACCOUNTING POLICIES (CONTINUED)
When an expenditure is incurred for purposes for which committed, assigned or unassigned fund balances are available, the City’s policy is to apply committed fund balance first, then assigned fund balance, and finally unassigned fund balance.
L. Compensated Absences
The City is obligated to pay all unused vacation to all employees. All vacation is accrued when incurred in the government-wide and proprietary fund financial statements. Governmental fund types recognize the vested vacation time as an expenditure in the current year to the extent it is paid during the year.
M. Claims and Judgments
Expenditures for claims and judgments are recognized when it is probable that the liability has been incurred at year-end and the amount of the loss can be reasonably estimated. Claims payable, which will be liquidated from current resources, are recorded in the General Fund and Internal Service Funds.
N. Pensions
For purposes of measuring the net pension liability, deferred outflows and inflows of resources related to pensions, and pension expense, information about the fiduciary net position and additions to/deductions from the fiduciary net position have been determined on the same basis as they are reported by the CalPERS Financial Office. For this purpose, benefit payments (including refunds of employee contributions) are recognized when currently due and payable in accordance with the benefit terms. Investments are reported at fair value. CalPERS audited financial statements are publicly available reports that can be obtained at CalPERS’ website under Forms and Publications.
GASB 68 requires that the reported results must pertain to liability and asset information within certain defined timeframes. For this report, the following timeframes are used:
Valuation Date (VD):
Measurement Date (MD):
June 30, 2021
June 30, 2022
Measurement Period (MP): July 1, 2021 to June 30, 2022
O. Other Post-Employment Benefits (OPEB) Liability
For purposes of measuring the net OPEB liability, deferred outflows of resources and deferred inflows of resources related to OPEB, and OPEB expense, information about the fiduciary net position of the City’s plan (OPEB Plan), the assets of which are held by the California Employers’ Retiree Benefit Trust Program (CERBT), and additions to/deductions from the OPEB Plan’s fiduciary net position have been determined by an independent actuary. For this purpose, benefit payments are recognized when currently due and payable in accordance with the benefit terms. Investments are reported at fair value.
Generally accepted accounting principles require that the reported results must pertain to liability and asset information within certain defined timeframes. For this report, the following timeframes are used:
Valuation Date (VD)
June 30, 2021
Measurement Date (MD) June 30, 2022
Measurement Period (MP) July 1, 2021 to June 30, 2022
P. Statement of Cash Flows
A substantial portion of the City’s investments are in short-term, highly liquid instruments, with original maturities of three months or less (excluding fiscal agent investments). The Enterprise and Internal Service Funds participate in the pooling of City-wide cash and investments. Amounts from the pool are available to these funds on demand.
50
Notes to the Financial Statements
For the Year Ended June 30, 2023
NOTE 1: ORGANIZATION AND SUMMARY OF SIGNIFICANT ACCOUNTING POLICIES (CONTINUED)
As a result, the cash and investments for the Enterprise and Internal Services Funds are considered to be cash and cash equivalents for the statement of cash flows purposes.
Q. Use of Estimates
The preparation of financial statements in conformity with accounting principles generally accepted in the United States of America requires management to make estimates and assumptions that affect the reported amounts of assets and liabilities and disclosure of contingent assets and liabilities at the date of the financial statements and the reported amounts of revenues and expenditures during the reporting period. Specifically, the City has made certain estimates and assumptions relating to the collectability of its accounts and notes receivable, depreciation/amortization of capital assets, amounts due from other funds and amounts advanced to other funds, the valuation of property held for resale, and the ultimate outcome of claims and judgments. Actual results could differ from those estimates and assumptions.
R. Leases
Lessee - The City is a lessee for noncancellable leases of equipment. The City recognizes a lease liability and an intangible right-to-use lease asset (lease asset) in the financial statements. The City recognizes lease liabilities with an initial, individual value of $10,000 or more.
At the commencement of a lease, the City initially measures the lease liability at the present value of payments expected to be made during the lease term. Subsequently, the lease liability is reduced by the principal portion of lease payments made. The lease asset is initially measured as the initial amount of the lease liability, adjusted for lease payments made at or before the lease commencement date, plus certain initial direct costs. Subsequently, the right-to-use lease asset is amortized on a straight-line basis over its useful life.
Key estimates and judgments related to leases include how the City determines (1) the discount rate it uses to discount the expected lease payments to present value, (2) lease term, and (3) lease payments.
The City uses the interest rate charged by the lessor as the discount rate. When the interest rate charged by the lessor is not provided, the City generally uses its estimated incremental borrowing rate as the discount rate for leases.
The lease term includes the noncancellable period of the lease. Lease payments included in the measurement of the lease liability are composed of fixed payments and purchase option price that the City is reasonably certain to exercise.
The City monitors changes in circumstances that would require a remeasurement of its lease and will remeasure the lease asset and liability if certain changes occur that are expected to significantly affect the amount of the lease liability.
Right-to-use lease assets are reported with other capital assets and lease liabilities are reported with long-term debt on the statement of net position.
Lessor - The City is a lessor for a noncancellable lease of a cell tower site. The City recognizes a lease receivable and a deferred inflow of resources in the financial statements.
At the commencement of a lease, the City initially measures the lease receivable at the present value of payments expected to be received during the lease term. Subsequently, the lease receivable is reduced by the principal portion of lease payments received. The deferred inflow of resources is initially measured as the initial amount of the lease receivable, adjusted for lease payments received at or before the lease commencement date. Subsequently, the deferred inflow of resources is recognized as revenue over the life of the lease term.
CITY OF DOWNEY
51
Notes to the Financial Statements
For the Year Ended June 30, 2023
NOTE 1: ORGANIZATION AND SUMMARY OF SIGNIFICANT ACCOUNTING POLICIES (CONTINUED)
Key estimates and judgments include how the City determines (1) the discount rate it uses to discount the expected lease receipts to present value, (2) lease term, and (3) lease receipts.
The City uses its estimated incremental borrowing rate as the discount rate for leases.
The lease term includes the noncancellable period of the lease. Lease receipts included in the measurement of the lease receivable is composed of fixed payments from the lessee.
S. Subscription-Based Information Technology Arrangements
The City is a subscriber for a noncancellable subscription of information technology services. The City recognizes a subscription liability and an intangible right-to-use subscription asset (subscription asset) in the government-wide financial statements. The City of Downey recognizes subscription liabilities with an initial, individual value of $5,000 or more.
At the commencement of a subscription, the City initially measures the subscription liability at the present value of payments expected to be made during the subscription term. Subsequently, the subscription liability is reduced by the principal portion of subscription payments made. The subscription asset is initially measured as the initial amount of the subscription liability, adjusted for subscription payments made at or before the subscription commencement date, plus certain initial direct costs. Subsequently, the subscription asset is amortized on a straight-line basis over its useful life. Key estimates and judgments related to subscriptions include how the City determines (1) the discount rate it uses to discount the expected subscription payments to present value, (2) lease term, and (3) subscription payments.
The City uses the interest rate charged by the vendor as the discount rate. When the interest rate charged by the vendor is not provided, the City generally uses its estimated incremental borrowing rate as the discount rate for subscriptions.
The subscription term includes the noncancellable period of the subscription. Subscription payments included in the measurement of the subscription liability are composed of fixed payments that the City is reasonably certain to exercise.
The City monitors changes in circumstances that would require a remeasurement of its subscriptions and will remeasure the subscription asset and liability if certain changes occur that are expected to significantly affect the amount of the subscription liability.
Subscription assets are reported with other capital assets and subscription liabilities are reported with long-term debt on the statement of net position.
T. New Accounting Pronouncement
The following Government Accounting Standards Board (GASB) pronouncements were effective for and/or early implemented for the fiscal year ended June 30, 2023:
1. GASB Statement No. 91, Conduit Debt Obligations
The requirements of this Statement will improve financial reporting by eliminating the existing option for issuers to report conduit debt obligations as their own liabilities, thereby ending significant diversity in practice. The clarified definition will resolve stakeholders’ uncertainty as to whether a given financing is, in fact, a conduit debt obligation. Requiring issuers to recognize liabilities associated with additional commitments extended by issuers and to recognize assets and deferred inflows of resources related to certain arrangements associated with conduit debt obligations also will eliminate diversity, thereby improving comparability in reporting by issuers Revised disclosure requirements will provide financial statement users with better information regarding the commitments issuers extend and the likelihood that they will fulfill those commitments. That information will inform users of the potential impact of such commitments on the financial resources of issuers and help users assess issuers’ roles in conduit debt obligations.
CITY OF DOWNEY
52
Notes to the Financial Statements
For the Year Ended June 30, 2023
NOTE 1: ORGANIZATION AND SUMMARY OF SIGNIFICANT ACCOUNTING POLICIES (CONTINUED)
2. GASB Statement No. 94, Public-Private and Public-Public Partnerships and Availability Payment Arrangements
The requirements of this Statement will improve financial reporting by establishing the definitions of PPPs and APAs and providing uniform guidance on accounting and financial reporting for transactions that meet those definitions. That uniform guidance will provide more relevant and reliable information for financial statement users and create greater consistency in practice. This Statement will enhance the decision usefulness of a government’s financial statements by requiring governments to report assets and liabilities related to PPPs consistently and disclose important information about PPP transactions. The required disclosures will allow users to understand the scale and important aspects of a government’s PPPs and evaluate a government’s future obligations and assets resulting from PPPs.
3. GASB Statement No. 96, Subscription-Based
Information Technology Arrangements
The requirements of this Statement will improve financial reporting by establishing a definition for SBITAs and providing uniform guidance for accounting and financial reporting for transactions that meet that definition. That definition and uniform guidance will result in greater consistency in practice. Establishing the capitalization criteria for implementation costs also will reduce diversity and improve comparability in financial reporting by governments. This Statement also will enhance the relevance and reliability of a government’s financial statements by requiring a government to report a subscription asset and subscription liability for a SBITA and to disclose essential information about the arrangement. The disclosures will allow users to understand the scale and important aspects of a government’s SBITA activities and evaluate a government’s obligations and assets resulting from SBITAs.
4. GASB Statement No. 100, Accounting Changes and Error Corrections
The requirements of this Statement will improve the clarity of the accounting and financial reporting requirements for accounting changes and error corrections, which will result in greater consistency in application in practice. In turn, more understandable, reliable, relevant, consistent, and comparable information will be provided to financial statement users for making decisions or assessing accountability. In addition, the display and note disclosure requirements will result in more consistent, decision useful, understandable, and comprehensive information for users about accounting changes and error corrections.
NOTE 2: STEWARDSHIP, COMPLIANCE AND ACCOUNTABILITY
At June 30, 2023, the following funds had a deficit fund balance:
Fund Name Fund Type
CIP Grant FundMajor Special Revenue Fund(2,281,868) $
Hazardous MaterialNonmajor Special Revenue Fund(973)
Grants Nonmajor Special Revenue Fund(13,926)
Gas Tax Nonmajor Special Revenue Fund(299,266)
Debt Service Nonmajor Debt Service Fund (8,719)
Private Purpose TrustFiduciary Fund (49,777,291)
These funds will be replenished with future revenues.
CITY OF DOWNEY
Deficit
53
Notes to the Financial Statements
For the Year Ended June 30, 2023
NOTE 3: PROPERTY TAXES
Prior to the beginning of the fiscal year, Los Angeles County, which administers property tax collections for the City of Downey, establishes the assessed valuation roll on January 1 and property taxes attach as an enforceable lien on that date. After the fiscal year has started on July 1, taxes are levied prior to September 1 and are payable in two installments on November 1 (delinquent December 10) and February 1 (delinquent April 10). Assessed valuation is computed at 100% of full cash value; however, due to the 2% annual increase limit per Article XIII-A of the State Constitution, the roll does not fully reflect cash value. Property is reassessed to full cash value when it is sold or otherwise transferred. When property is sold after the normal January 1 lien date, a supplemental property tax is levied representing the difference between the tax levy based on the property value as of January 1 and the tax based on the new value.
NOTE 4: CASH AND INVESTMENTS
As of June 30, 2023, cash and investments were reported in the accompanying financial statements as follows:
The table below identifies the investment types that are authorized for the City by the California Government Code (or the City’s investment policy, where more restrictive). The table also identifies certain provisions of the California Government Code (or the City’s investment policy, where more restrictive) that address interest rate risk, credit risk, and concentration of credit risk. This table does not address investments of debt proceeds held by bond trustees that are governed by the provisions of debt agreements of the City, rather than the general provisions of the California Government Code or the City’s investment policy.
CITY OF DOWNEY
Investments Authorized by the California Government Code and the City’s Investment Policy
Government-Wide Statement of Net Position Fiduciary Funds Statement of Net PositionTotal Cash and investments 139,726,684 $ 8,641,390 $ 148,368,074 $ Cash and investments with fiscal agents 11,001,653 663,404 11,665,057 Total Cash and Investments 150,728,337 $ 9,304,794 $ 160,033,131 $ Demand accounts 13,058,234 $ Petty cash 7,175 Investments 146,967,722 Total Cash and Investments160,033,131 $ 54
Notes to the Financial Statements
For the Year Ended June 30, 2023
NOTE 4: CASH AND INVESTMENTS (CONTINUED)
Authorized Investment Type
United States Treasury Bills, Bonds and Notes
United States Government Sponsored Agency Securities
Small Business Administration Loans
California Local Agency Obligations
5 yearsNone None
5 yearsNone None
5 yearsNone None
5 yearsNone None
Certificates of Deposits (or Time Deposits)5 yearsNone None
Negotiable Certificates of Deposits
Medium-Term Corporate Notes
Bankers' Acceptances
Commercial Paper
Repurchase Agreements
Municipal Bonds
5 years30% None
5 years30% None
180 days40% 30%
270 days25% 5%
30 daysNone
5 yearsNone
None
None
Local Agency Investment Funds (LAIF) N/ANone None
Money Market Mutual Funds N/ANone
Investments Authorized by Debt Agreements
None
Investment of debt proceeds held by bond trustee are governed by provisions of the debt agreements, rather than the general provisions of the California Government Code or the City’s investment policy. Investments authorized for funds held by bond trustee include, United States Treasury Obligations, United States Government Sponsored Agency Securities, Certificates of Deposits, Commercial Paper, Local Agency Bonds, Bankers’ Acceptances, Money Market Mutual Funds, Investment Agreements and any other investments permitted by bond insurer. There were no limitations on the maximum amount that can be invested in one issuer, maximum percentage allowed or the maximum maturity of an investment, except for the maturity of Bankers’ Acceptance and Certificates of Deposits which are limited to one year and 270 days, respectively.
Disclosures Relating to Interest Rate Risk
Interest rate risk is the risk that changes in market interest rates will adversely affect the fair value of an investment. Generally, the longer the maturity of an investment, the greater the sensitivity of its fair value to changes in market interest rates. One of the ways that the City manages its exposure to interest rate risk is by purchasing a combination of shorter-term and longer-term investments and by timing cash flows from maturities so that a portion of the portfolio is maturing or coming close to maturity evenly over time as necessary to provide the cash flow and liquidity needed for operations. Maximum Maturity Maximum Percentage Allowed Maximum Investment in One Issuer
CITY OF DOWNEY
55
Notes to the Financial Statements
For the Year Ended June 30, 2023
NOTE 4: CASH AND INVESTMENTS (CONTINUED)
Information about the sensitivity of the fair values of the City’s investments (including investments held by bond trustee) to market interest rate fluctuations is provided by the following table that shows the distribution of the City’s investments by maturity:
Investments:
Federal Farm Credit Bank7,812,8001,824,8001,978,91011,616,510
Home Loan Bank1,953,5605,668,0083,444,35011,065,918
National Mortgage Assoc. -2,727,750 2,727,750 Negotiable Certificates of Deposit4,084,0039,863,1143,582,68217,529,799
Disclosures Relating to Credit Risk
Generally, credit risk is the risk that an issuer of an investment will not fulfill its obligation to the holder of the investment. This is measured by the assignment of a rating by a nationally recognized statistical rating organization. Presented below is the minimum rating required, at the time of purchase, by (where applicable) the California Government Code, the City’s investment policy, or debt agreements, and the actual rating, as reported by Standard and Poor’s, as of yearend for each investment type:
Concentration of Credit Risk
The investment policy of the City contains no limitations on the amount that can be invested in any one issuer beyond that stipulated by the California Government Code.
CITY OF DOWNEY
12 months or less 13 - 36 Months 37 - 60 Months Total
Local
$ - $ -58,334,865 $
Agency Investment Fund58,334,865 $
US Treasury Note9,751,20024,118,950 -33,870,150 Money Market Mutual Funds157,673 - -157,673 Held by Bond Trustee Money Market Mutual Funds 11,665,057 - -11,665,057 93,759,158 $ 44,202,622 $ 9,005,942 $ 146,967,722 $ Investment
Total as of June 30, 2023 Minimum Legal Rating AA+A+Unrated Investments: United States Government Sponsored Agency Securities FFCB11,616,510 $ N/A11,616,510 $ - $ - $ FHLB11,065,918 N/A11,065,918 -FNMA2,727,750 N/A2,727,750 -Negotiable Certificates of Deposit17,529,799 N/A- - 17,529,799 U.S. Treasury Note33,870,150 A- - 33,870,150 Local Agency Investment Fund58,334,865 N/A- - 58,334,865 Money Market Mutual Funds157,673 A- - 157,673 Held by Bond Trustee Money Market Mutual Funds11,665,057 A- - 11,665,057 146,967,722 $ 25,410,178 $ - $ 121,557,544 $ 56
Federal
Federal
Maturities (in Months)
Notes to the Financial Statements
For the Year Ended June 30, 2023
NOTE 4: CASH AND INVESTMENTS (CONTINUED)
Investments in any one issuer that represent 5% or more of total City’s investments (excluding held by trustees) are as follows:
Fair Value Hierarchy
The City categorizes its fair value measurements within the fair value hierarchy established by generally accepted accounting principles. The hierarchy is based on the valuation inputs used to measure the fair value of the asset. Level 1 inputs are quoted prices in active markets for identical assets; Level 2 inputs are significant other observable inputs; Level 3 inputs are significant unobservable inputs.
The City has the following recurring fair value measurements as of June 30, 2023:
as of June 30, 2023
Money market funds are classified in Level 1 of the fair value hierarchy and valued using prices quoted in active markets for those securities. Federal government agency investment, corporate note, and LAIF are classified in Level 2 of the fair value hierarchy and valued using institutional bond
or specified fair market value factors.
CITY OF DOWNEY
Issuer Investment TypeReported Amount Percent of Investment Federal Farm CreditUnited States Government Bank Sponsored Agency Securities Federal Home Loan BankUnited States Government Sponsored Agency Securities $11,616,5107.90% 11,065,9187.53% Total
12N/A Investments: Federal Government Agency25,410,178 $ - $ 25, 410,178 $ - $ US Treasury Note33,870,150 - 33, 870,150Certificate of Deposit17,529,799 - 17, 529,799Money Market Funds157,673 157,673 -Local Agency Investment Fund58,334,865 - - 58, 334,865 Total Cash Investments 135,302,665 157,673 76, 810,127 58, 334,865 Investments with Fiscal Agents: Money Market Funds11,665,057 25, 130,397 -Total Investments with Fiscal A gent11,665,057 25, 130,397 -Total Investments 146,967,722 $ 25, 288,070 $ 76, 810,127 $ 58, 334,865 $ Level 57
quotes
Notes to the Financial Statements
For the Year Ended June 30, 2023
NOTE 4: CASH AND INVESTMENTS (CONTINUED)
Custodial Credit Risk
Custodial credit risk for deposits is the risk that, in the event of the failure of a depository financial institution, a government will not be able to recover its deposits or will not be able to recover collateral securities that are in the possession of an outside party. The custodial credit risk for investments is the risk that, in the event of the failure of the counterparty (e.g., broker-dealer) to a transaction, a government will not be able to recover the value of its investment or collateral securities that are in the possession of another party. The California Government Code and the City’s investment policy do not contain legal or policy requirements that would limit the exposure to custodial credit risk for deposits or investments, other than the following provision for deposits: The California Government Code requires that a financial institution secure deposits made by state or local governmental units by pledging securities in an undivided collateral pool held by a depository regulated under state law (unless so waived by the governmental unit). The market value of the pledged securities in the collateral pool must equal at least 110% of the total amount deposited by the public agencies. California law also allows financial institutions to secure City deposits by pledging first trust deed mortgage notes having a value of 150% of the secured public deposits.
At June 30, 2023, the City deposits (bank balances) were all insured by the Federal Deposit Insurance Corporation or collateralized.
Investment in State Investment Pool
The City is a voluntary participant in the Local Agency Investment Fund (LAIF) that is regulated by California Government Code Section 16429 under the oversight of the Treasurer of the State of California. The fair value of the City’s investment in this pool is reported in the accompanying financial statements at amounts based upon the City’s pro-rata share of the fair value provided by LAIF for the entire LAIF portfolio (in relation to the amortized cost of that portfolio). The balance available for withdrawal is based on the accounting records maintained by LAIF, which are recorded on an amortized cost basis.
NOTE 5: INTERFUND RECEIVABLES/PAYABLES AND TRANSFERS
As of June 30, 2023, amounts due from/to other funds were as follows:
The amounts loaned by the General Fund to the Other Governmental Funds were to provide short-term loans to fund operations of the various funds.
CITY OF DOWNEY
Due from Other Funds Due to Other FundsGeneral Governmental Funds: CIP Grant Fund4,918,095 $ Other Nonmajor Governmental 3,010,321 Total7,928,416 $ 58
Notes to the Financial Statements
For the Year Ended June 30, 2023
NOTE 5: INTERFUND RECEIVABLES/PAYABLES AND TRANSFERS (CONTINUED)
Interfund transfers at June 30, 2023, consisted of the following:
Transfers In
The General Fund transferred $19,692,982 to Other Governmental Funds to provide for capital expenditures, subsidize for various project operations, and to reimburse funds negative fund balance.
The Covid-19 Grants fund transferred $5,024 to cover Water Well Projects.
Other Governmental Funds transferred $4,056,776 to the General Fund, $1,000,000 to Other Governmental Funds, and $1,630 to the Sewer & Storm Drain Fund for various street and related program expenditures.
The Water fund transferred $900,000 to the General fund and $575,000 to the Sewer and Storm Drain fund, to fund administrative costs or certain program, administrative and overhead expenditures.
NOTE 6: ADVANCES RECEIVABLE FROM SUCCESSOR AGENCY
The advances from the General Fund and Housing Authority in the amount of $9,144,691 to the Successor Agency are to provide for operations of the Successor Agency. The collectability of the balance is subject to the approval of the Department of Finance. See Note 22 for additional information.
NOTE 7: LOANS RECEIVABLE
The City has provided deferred-payment rehabilitation loans to qualifying low-income households in connection with the CDBG, Home Investment Partnership and Housing Authority housing rehabilitation programs. Loans receivable totaled $12,519,794 as of June 30, 2023.
Additionally, The City’s general fund entered into loan receivable agreements with two local auto dealerships. The City loaned $1,250,000, in April 2017, in order to assist the dealership to relocate to a larger location within the City. The loan is to be repaid over 12 years at a simple interest rate of 4.25%. In fiscal year 2019, the City entered into another operating covenant and loan receivable in agreement in the amount of $500,000. The outstanding balance on the general fund loans receivable as of June 30, 2023, is $992,014.
NOTE 8: DEFERRED COMPENSATION PLAN
The City has adopted a deferred compensation plan in accordance with Internal Revenue Code 457 for its eligible employees wherein they may execute an individual agreement with the City for amounts earned by them to be paid at a future date when certain circumstances are met. These circumstances are termination by reason of death, disability, resignation or retirement, or unforeseeable emergency.
The plan permits all city employees to defer a portion of their salaries until future years. Amounts accumulated under the plan have been invested by third party operators at the direction of the employee.
CITY OF DOWNEY
Transfers out General Nonmajor Governmental Sewer and Storm DrainWater Total Governmental Funds: General $ -19,692,982 $ $ - $ -19,692,982 $ Covid 19 - - -5,024 5,024 Other Nonmajor Governmental3,469,7761,587,0001,630 -5,058,406 Enterprise Fund: Water 900,000 -575,000 -1,475,000 Total 4,369,776 $ 21,279,982 $ 576,630 $ 5,024 $ 26,231,412 $
59
Notes to the Financial Statements
For the Year Ended June 30, 2023
NOTE 8: DEFERRED COMPENSATION PLAN (CONTINUED)
Pursuant to changes in August 1996 of IRC Section 457, the City formally established a trust in which it placed the 457 Plan assets and income. The assets, all property and rights purchased with such amounts, and all income attributable to such amounts, property, or rights are held in trust for the exclusive benefit of all participants and their beneficiaries. These assets are not the property of the City, and as such are not subject to the claims of the City’s general creditors. As a result, these 457 plan assets are not reported in the City’s annual comprehensive financial report.
NOTE 9: LEASES
A. Leases Receivable and Deferred Inflows of Resources
Leases are financings of the right to use an underlying asset. Under this Statement, a lessee is required to recognize a lease liability and an intangible right-to-use lease asset, and a lessor is required to recognize a lease receivable and a deferred inflow of resources. For additional information, refer to the following below.
The City leases land to various companies for installation of cellular towers. The term is an 8.75-year lease. The City also leases land to Discovery Park, Downey Landing and Industrial Realty Group with term ranging from 3.92 years to 38 years with an option to extend of 5 to 10 years.
As of June 30, 2023, the value of the lease receivable is $20,824,860. The value of the deferred inflow of resources as of June 30, 2023 was $20,625,482, and the City recognized lease revenue of $766,602 during the fiscal year.
The principal and interest payments that are expected to maturity are as follows:
Governmental Activities
2029 - 20331,986,795 1,447,447 3,434,242
2034 - 20382,201,942 1,272,877 3,474,819
2039 - 20432,568,406 1,070,105 3,638,511
2044 - 20482,984,522 834,050 3,818,572
2049 - 20533,456,414 560,226 4,016,640
2054 - 20583,990,917 243,597 4,234,514
2059 - 2060786,194 7,111 793,305 19,884,163 $ 7,043,326 $ 26,927,489 $
CITY OF DOWNEY
Fiscal Year Principal Payments Interest Payments Total Payments 2024387,928 $ 333,703 $ 721,631 $ 2025368,600 327,715 696,315 2026376,262 321,686 697,948 2027384,091 315,539 699,630
701,362
2028392,092 309,270
60
Notes to the Financial Statements
For the Year Ended June 30, 2023
NOTE 9: LEASES (CONTINUED)
Business-Type Activities
Leases Payable and Right to Use Lease Assets
The City leases vehicles owned by Enterprise Fleet Management with terms range from 2.92 years to 5 years as of the contract commencement date. As of June 30, 2023, the value of the lease liability is $1,728,463. The City is required to make annual fixed payments ranging from $142 to $1,084. The lease has an interest rate of 0.3150% to 2.3660%.
Right-to-use leased assets include the following at June 30, 2023:
Future principal and interest requirements to maturity for each lease liability are as follows:
NOTE 10: SUBSCRIPTION-BASED TECHNOLOGY ARRANGEMENTS
The City implemented GASB Statement No. 96, Subscription-Based Information Technology Arrangements in the fiscal year ended June 30, 2023. The primary objective of this statement is to enhance the relevance and consistency of information about governments' subscription activities. This statement establishes a single model for subscription accounting based on the principle that subscriptions are financings of the right to use an underlying asset. Under this Statement, an organization is required to recognize a subscription liability and an intangible right-to-use subscription asset. For additional information, refer to the disclosures below.
CITY OF DOWNEY
Fiscal Year Principal Payments Interest Payments Total Payments 2024140,403 $ 9,597 $ 150,000 $ 2025141,948 8,052 150,000 2026143,510 6,490 150,000 2027145,089 4,911 150,000 2028146,686 3,314 150,000 2029 - 2033223,061 1,939 225,000 940,697 $ 34,303 $ 825,000 $
Lease TypeMajor Class of Underlying AssetLeased Capital Amortization Vehicle LeaseRight-to-Use Lease - Vehicles3,385,018 $ 955,169 $ Total3,385,018 $ 955,169 $ Fiscal Year Principal Payments Interest Payments Total Payments 2024 $ 614,603 $ 20,915 $ 635,518 2025 500,989 14,756 515,745 2026 313,119 9,154 322,273 2027 229,188 4,090 233,278 2028 70,564 584 71,148 Total1,728,463 $ 49,499 $ 1,777,962 $ Governmental Activities 61
Notes to the Financial Statements
For the Year Ended June 30, 2023
NOTE 10: SUBSCRIPTION-BASED TECHNOLOGY ARRANGEMENTS (CONTINUED)
On July 1, 2022, the City of Downey entered into a 15-month subscription for the use of Library Catalog Software Subscription and Hosting Services. An initial subscription liability was recorded in the amount of $139,116. As of June 30, 2023, the value of the subscription liability is $45,963. The City of Downey is required to make annual fixed payments of $46,750. The subscription has an interest rate of 1.71%. The value of the right to use asset as of June 30, 2023 of $139,116 with accumulated amortization of $111,293 is included with Software on the Subscription Class activities table found below. The City of Downey has 1 extension option for 12 months.
The future principal and interest subscription payments as of June 30, 2023, were as follows:
CITY OF DOWNEY
Asset ClassMajor Class of Underlying Asset Subscription Asset Value Accumulated Amortization SoftwareRight-to-Use Subscription Asset139,116 $ 111,293 $ Total139,116 $ 111,293 $ Governmental Activities Fiscal Year Principal Payments Interest Payments Total Payments 202445,963 $ 786$ 46,749 $ Total45,963 $ 786$ 46,749 $ Governmental Activities 62
CITY OF DOWNEY
Notes to the Financial Statements For the Year Ended June 30, 2023
NOTE 11: CAPITAL ASSETS
A summary of changes in the Governmental Activities capital assets as of June 30, 2023, is as follows:
Governmental Activities: Capital assets, not being depreciated/amortized:
Total Capital Assets, Not Being Depreciated/amortized50,400,692
Capital assets, being depreciated/amortized:
Governmental Activities depreciation/amortization expense was charged to functions/programs of the primary government as follows: Balances atTransfers Balances at June 30, 2022of CIPAdditionsDeletionsJune 30, 2023
Land
- $ - $ - $ 26,360,821
Projects-in-progress24,039,871 (20,306,979) 19,183,706 - 22,916,598
(20,306,979) 19,183,706
49,277,419
Buildings85,380,767 - - - 85,380,767 Land Improvements27,436,361 - - - 27,436,361 Equipment 22,563,689 - 1,345,666 (785,821) 23,123,534 Lease assets2,670,202 - 752,066 (37,250) 3,385,018 Subscription asset- - 139,116 - 139,116 Infrastructure308,232,640 20,306,979 - - 328,539,619 Total Capital Assets,
20,306,979 2,236,848 (823,071) 468,004,415 Less accumulated depreciation/amortization: Buildings26,870,382 - 1,862,695 - 28,733,077 Land Improvements6,680,078 - 1,204,520 - 7,884,598 Equipment 12,427,131 - 1,291,426 (777,704) 12,940,853 Lease assets411,888 - 560,583 (17,302) 955,169 Subscription asset- - 139,116 (27,823) 111,293 Infrastructure171,361,625 - 3,305,195 - 174,666,820 Total Accumulated Depreciation/amortization 217,751,104 - 8,363,535 (822,829) 225,291,810 Total Capital Assets, Being Depreciated/amortized, Net 207,963,067 20,306,979 (6,126,687) (242) 242,712,605 Governmental Activities Capital Assets, Net 268,342,425 $ - $ 13,057,019 $ (242) $ 291,990,024 $ General Government 263,194 $ Public Safety 1,808,519 Community Development 4,092 Community Services 2,257,039 Public Works 3,595,488 Internal Service Funds 435,203 Total depreciation/amortization expense governmental activities 8,363,535 $ 63
and improvements26,360,821 $
$
-
Being Depreciated/amortized446,283,659
Notes to the Financial Statements For the Year Ended June 30, 2023
NOTE 11: CAPITAL ASSETS (CONTINUED)
A summary of changes in the Water Business-type Activities capital assets at June 30, 2023, are as follows:
CITY OF DOWNEY
Balances
Balances
June 30, 2022TransfersAdditionsDeletionsJune 30, 2023
Capital assets, not being depreciated: Land 2,459,598 $ - $ - $ - $ 2,459,598 $ Projects-in-progress5,293,053 (4, 870,336) 4,822,645 - 5,245,362 Water Rights4,290,880 - - - 4,290,880 Total Capital Assets, Not Being Depreciated12,043,531 (4, 870,336) 4,822,645 - 11,995,840 Capital assets,
depreciated: Buildings and improvements 398,073 - - - 398,073 Furniture and Equipment 2,394,506 - 36,417 - 2,430,923 Infrastructure 50,639,625 4, 870,336 - - 55,509,961 Total Capital Assets, Being Depreciated 50,467,781 4, 870,336 36,417 - 58,338,957 Less accumulated depreciation: Buildings and improvements 269,313 - 7,269 - 276,582 Furniture and Equipment 1,765,129 - 90,148 - 1,855,277 Infrastructure 20,934,565 - 907,694 - 21,842,259 Total Accumulated Depreciation 22,044,548 - 1, 005,111 - 23,974,118 Total Capital Assets, Being Depreciated, Net 28,423,233 4, 870,336 (968,694) - 34,364,839 Water Fund Capital Assets, Net 39,314,324 $ - $ 3, 853,951 $ - $ 46,360,679 $ WATER FUND 64
at
at
Business-type Activities:
being
Notes to the Financial Statements For the Year Ended June 30, 2023
NOTE 11: CAPITAL ASSETS (CONTINUED)
A summary of changes in the Golf Business-type Activities capital assets at June 30, 2023, are as follows:
not being depreciated:
CITY OF DOWNEY
Balances at Balances at June 30, 2022AdjustmentsAdditionsDeletionsJune 30, 2023 Capital assets,
Land 8,294,387 $ - $ - $ - $ 8,294,387 $ Total Capital Assets, Not Being Depreciated 8,294,387 - - - 8,294,387 Capital assets, being depreciated: Land improvements 4,710,076 - - - 4,710,076 Buildings and improvements 8,217,041 - - - 8,217,041 Machinery and equipment 476,128 - - - 476,128 Total Capital Assets, Being Depreciated 13,396,262 - - - 13,403,245
accumulated
Land improvements 4,418,685 - 119,526 - 4,538,211 Buildings and improvements 2,926,780 - 164,710 - 3,091,490 Machinery and equipment 469,234 (94,441) 54,204 - 428,997 Total Accumulated Depreciation 7,548,965 (94,441) 338,440 - 8,058,698 Total Capital Assets, Being Depreciated, Net 5,847,297 94,441 (338,440) - 5,344,547 Golf Fund Capital Assets, Net 14,141,684 $ 94,441 $ (338,440) $ - $ 13,638,934 $ GOLF FUND 65
Less
depreciation:
Notes to the Financial Statements For the Year Ended June 30, 2023
NOTE 11: CAPITAL ASSETS (CONTINUED)
A summary of changes in the Sewer and Storm Drain Business-type Activities capital assets at June 30, 2023, are as follows:
SEWER AND STORM DRAIN FUND
being
Capital Project Commitments
The City has active construction projects as of June 30, 2023. At year end, the City’s projects-in-progress totaled $30,444,955. The following material construction commitments existed at June 30, 2023.
CITY OF DOWNEY
Balances at Balances at June 30, 2022AdditionsDeletionsJune 30, 2023 Capital assets, not being depreciated: Projects-in-progress 2,282,995 $ - $ - $ 2,282,995 Total Capital Assets, Not Being Depreciated 2,282,995 - - 2,282,995 Capital assets,
depreciated: Machinery and equipment 1,085,585 2,381 - 1,087,966 Infrastructure 77,062,223 - - 77,062,223 Total Capital Assets, Being Depreciated 78,147,808 2,381 - 78,150,189 Less accumulated depreciation: Machinery and equipment 378,872 8,460 - 387,332 Infrastructure 52,179,266 1,578,602 - 53,757,868 Total Accumulated Depreciation 51,011,445 1,587,062 - 54,145,200 Total Capital Assets, Being Depreciated, Net 27,136,363 (1,584,681) - 24,004,989 Sewer and Storm Drain Fund Capital Assets, Net 29,419,358 $ (1,584,681) $ - $ 26,287,984 $
Project Name Contract Amount Expenditures to date as of June 30, 2023 Remaining Commitments Professional Engineering Services 799,936 $ 211,075 $ 588,861 $ Furnman Parl Stormwater Capture & Infiltration Improvements1,043,462 330,607 712,855 Space Shuttle Exhibit and Education Building 310,515 37,403 273,113 Firestone Blvd at Lakewood Blvd Water System Improvements2,928, 508 1,414,645 1,513,863 Lakewood Blvd Traffic Signal Upgrades 1,150,545 95,431 1,055,114 Playground Equipment - Rio San Gabriel Park 1,581,947 701,926 880,021 Citywide Bus Signal Priority Project 1,972,577 - 1,972,577 Manzanar Ave and Bergman Lane Street Improvements 320,000 - 320,000 Total Construction Commitments 10,107,491 $ 2,791,087 $ 7,316,403 $ 66
CITY OF DOWNEY
Notes to the Financial Statements
For the Year Ended June 30, 2023
NOTE 12: LONG-TERM DEBT
Noted below is a summary of changes in long-term debt for the year ended June 30, 2023:
Governmental Activities
Bonds Payable
2005 Pension Obligation Bonds
In June 2005, the City issued $20,635,000 taxable pension obligation bonds. Bond proceeds were used to satisfy a portion of the City’s requirement to amortize the unfunded actuarial accrued liability with respect to retirement benefits accruing to members of the City. The par amount of the bonds comprised of $1,955,000 serial bonds and $18,680,000 term bonds. Principal on serial bonds mature in amounts from $90,000 to $395,000, the interest at 4.030% to 4.775% through June 1, 2015. Principal on the term bonds mature on June 1, 2021, 2025 and 2034, the interest rate at 4.885% to 5.083%. The term bonds are subject to optional redemption prior to their maturity at the
Balance BalanceDue Within June 30, 2022AdditionsReductionsJune 30, 2023One Year Governmental
Bond payable 2005 Pension Obligation Bonds13,845,000 $ - $ 1,050,000 $ 12,795,000 $ 1,160,000 $ 2017 Lease Revenue Bonds38,760,000 - 1,815,000 36,945,000 1,905,000 2021 Pension Obligation Bonds109,076,263 - 3,452,298 105,623,965 3,409,083 Sales Tax Revenue Bonds 2021A Measure M Bond 14,610,000 - 470,000 14,140,000 485,000 2021B Measure M Bond 10,795,000 - 460,000 10,335,000 480,000 Bond premiums 7,808,381 - 403,425 7,404,956Bond discount (85,309) - (7,108) (78,201)Total Bonds 194,809,335 7,643,615187,165,7207,439,083 Direct borrowings Financed purchases 2,682,548 - 542,6492,139,899 462,227 Lease payable (Note 9) 1,550,366 752,065573,9681,728,463 614,603 Subscription payable (Note 10) - 139,11693,153 45,963 45,963 HUD Section 108 Loans 2011 - Section 108 324,000 - 81,000 243,000 81,000 2018 - Section 108 2,684,000 - 158,000 2,526,000 158,000 2019 - Section 108 570,000 - 114,000 456,000 114,000 Total governmental activities long-term liabilities 202,620,249 $ 891,181 $ 9,206,385 $ 194,305,045 $ 8,914,876 $ Business-type Activities: Bond payable 2021 Pension Obligation Bonds4,508,737 $ $ -142,702 $ 4,366,035 $ 140,917 $ Loans payable Golf Course 2014 2,770,000 -515,0002,255,000535,000 Total business-type activities long-term liabilities $7,278,737 - $657,702$6,621,035$675,917 67
Activities:
Notes to the Financial Statements
For the Year Ended June 30, 2023
NOTE 12: LONG-TERM DEBT (CONTINUED)
option of the City, in whole or in part on any date, at the redemption price equal to the lesser of (a) 100% of the principal amount on the term bonds to be redeemed; or (b) the sum of the present value of the remaining scheduled payments of the principal and interest to be redeemed.
The future debt service requirements on these bonds are as follows:
The outstanding bonds contain a provision that if any event of default should occur, the sole legal remedy of any Holder or Beneficial Owner of the Bonds or the Participating Underwriter shall be an action to compel performance. No Bondholder or Beneficial Owner may institute such action, suit or proceeding to compel performance unless they shall have first delivered to the Local Agency satisfactory written evidence of their status as such, and a written notice of and request to cure such failure, and the Local Agency shall have refused to comply therewith within a reasonable time.
2017 Lease Revenue Bonds
In December 2017, the City issued $45,415,000 lease revenue bonds. Bond proceeds will be used to finance the acquisition and construction of certain public capital improvements of benefit to the City and pay the cost of issuing the bonds. Principal on the bonds mature in amounts from $1,600,000 to $3,390,000, beginning December 1, 2018 through December 1, 2036, and the interest at 2.000% to 5.000% is due semiannually on June 1 and December 1, commencing on June 1, 2018.
The future debt service requirements on these bonds are as follows:
Year Ending June 30, Principal Interest
2029-203313,435,000 3,713,813 17,148,813 2034-203512,985,000 808,256 13,793,256
Total36,945,000
CITY OF DOWNEY
Principal Interest Total 20241,160,000 $ 649,047 $ 1,809,047 $ 2025730,000 590,896 1,320,896 2026 810,000 554,301 1,364,301 2027 895,000 513,129 1,408,129 2028 985,000 467,636 1,452,636 2029-2033 6,535,000 1,481,695 8,016,695 2034-2035 1,680,000 85,394 1,765,394 Total 12,795,000 $ 4,342,098 $ 17,137,098 $
Year Ending June 30,
Total
1,544,163
3,449,163 $
1,446,538 3,446,538 20262,100,000 1,344,038 3,444,038 20272,205,000
20241,905,000 $
$
20252,000,000
1,236,413 3,441,413 20282,315,000 1,123,413 3,438,413
68
$ 11,216,633 $ 48,161,634 $
Notes to the Financial Statements
For the Year Ended June 30, 2023
NOTE 12: LONG-TERM DEBT (CONTINUED)
The outstanding bonds contain a provision that if any event of default should occur and continues to occur, the Authority is authorized under the terms of the Property Lease to exercise any and all remedies available under law or generated under the Property Lease. There is no remedy of acceleration of the total Base Rental payments due over the term of the Property Lease. The Trustee is not empowered to sell the Site and Facilities and use the proceeds of such sale to prepay the 2017 Bonds or pay debt service on the 2017 Bonds.
2021 Pension Obligation Bonds
In February 2021, the City issued $113,585,000 pension obligation bonds. Bond proceeds will be used to refinance the City’s statutory obligation to appropriate and make payments to CalPERS for certain amounts arising as a result of retirement benefits accruing to members of the System. Principal on the bonds mature in amounts from $3,595,000 to $7,325,000, beginning June 30, 2023 through June 30, 2044, and the interest at .317% to 2.995% is due semiannually on June 1 and December 1, ending 2045.
The future debt service requirements on these bonds are as follows:
Governmental Activity
Year Ending June 30, Principal Interest
20243,409,083 $
20283,884,434
2029-203319,739,073 10,463,418 30,202,491
2034-203827,493,537 7,818,974 35,312,511
2039-204333,481,040 3,402,618 36,883,658
2044-20455,963,495 89,303 6,052,798
Total105,623,965 $ 33,763,142 $ $139,387,107
Business Type Activity
Year Ending June 30, Principal Interest
Total 2024140,917 $ 101,946 $ 242,863 $ 2025161,161 100,981262,142 2026160,367 99,580259,947 2027160,169 97,706257,875 2028160,566 95,353255,919 2029-2032815,927 432,5121,248,439 2033-20371,136,463 323,2021,459,665 2038-20421,383,960 140,6491,524,609 2043-2045246,505 3,691250,196
Total4,366,035 $ 1,395,620 $ 5,761,655 $
CITY OF DOWNEY
Total
2,466,309
5,875,392
2,442,958 6,341,797
$
$ 20253,898,839
20263,879,633 2,409,053 6,288,686
20273,874,831 2,363,714 6,238,545
2,306,795 6,191,229
69
Notes to the Financial Statements
For the Year Ended June 30, 2023
NOTE 12: LONG-TERM DEBT (CONTINUED)
The outstanding bonds contain a provision that if any event of default should occur and continues to occur, the City and Trustee have no liability to the Holders of Series 2021 bonds or any other party related to or arising from such rescission of redemption.
Sales Tax Revenue Bonds Measure M Series 2021A and Measure R Series 2021B
In October 2021, the City issued $15,275,000 Measure M Series 2021A bonds and $11,385,000 Measure R Series 2021 bonds. The bonds are being issued to finance the design, acquisition, and construction of certain local roadway and street improvement projects in the City, purchase a debt service reserve fund insurance policy to satisfy the reserve requirement for the 2021B Bonds and pay the costs incurred in connection with the issuance of the 2021B Bonds.
Principal on the Measure M Series A bonds mature in amounts from $470,000 to $1,790,000, beginning June 1, 2022 through June 1, 2041, and the interest at 2.25% to 4.0% is due semiannually on June 1 and December 1. Principal on the Measure R Series 2021B bonds mature in amounts from $460,000 to $815,000 beginning June 1, 2022 through June 1, 2039, and the interest at 2.125% to 4.0% is due semiannually on June 1 and December 1.
The future debt service requirements on these bonds are as follows:
CITY OF DOWNEY
2021A
Year Ending June 30, Principal Interest Total Governmental105,623,965 $ 33,763,142 $ 139,387,107 $ Business4,366,035 1, 395,620 5,761,655 Total109,990,000 $ 35,158,762 $ 145,148,762 $ Year Ending June 30, Principal Interest Total 2024485,000 $ 536,756 $ 1,021,756 $ 2025505,000 517,356 1,022,356 2026530,000 497,156 1,027,156 2027545,000 475,956 1,020,956 2028570,000 454,156 1,024,156 2029-2033 3,215,000 1,909,381 5,124,381 2033-2038 3,915,000 1,212,981 5,127,981 2039-2043 4,375,000 372,944 4,747,944 Total 14,140,000 $ 5,976,687 $ 20,116,686 $ 70
Measure M Bond – Governmental Activity
Notes to the Financial Statements
For the Year Ended June 30, 2023
NOTE 12: LONG-TERM DEBT (CONTINUED)
2021B Measure R Bond – Governmental Activity
Finance Purchases
The future minimum lease obligations and the net present value of these minimum lease payments are as follows: Loans from Federal Government
HUD Section 108 Loans
In 2011, the City received a Section 108 Loan from the United States Department of Housing and Urban Development. The payment schedule as of June 30, 2023, is as follows:
CITY OF DOWNEY
Year Ending June 30, Principal Interest Total 2024480,000 $ 356,831 $ 836,831 $ 2025500,000 337,631 837,631 2026515,000 317,631 832,631 2027540,000 297,031 837,031 2028560,000 275,431 835,431 2029-2033 3,150,000 1,023,156 4,173,156 2033-2038 3,775,000 400,881 4,175,881 2039-2043 815,000 19,356 834,356 Total 10,335,000 $ 3,027,949 $ 13,362,949 $ Year Ending June 30, Principal Interest Total 2024 462,227 $ 76,323 $ 538,550 $ 2025 478,978 59,573 538,551 2026 483,386 42,206 525,592 2027 350,708 24,661 375,369 2028 364,600 10,766 375,366 Total 2,139,899 $ 213,529 $ 2,353,428 $ Year Ending June 30,PrincipalInterest Total 2024 81,000 $ 6,014 $ 87,014 $ 2025 81,000 3,637 84,637 2026 81,000 1,219 82,219 Total 243,000 $ 10,870 $ 253,870 $ 71
Notes to the Financial Statements
For the Year Ended June 30, 2023
NOTE 12: LONG-TERM DEBT (CONTINUED)
In 2018, the City requested an advance in the amount of $1,000,130 pursuant to Section 108 of the Housing and Community Development Act of 1974. The City of Downey elected to deduct HUD’s $25,800 loan and $70 advance fees from the original $1,026,000 Section 108 Loan amount. The payment schedule as of June 30, 2023, is as follows:
In 2019, the City received a Section 108 Loan from the United States Department of Housing and Urban Development. The payment schedule as of June 30, 2023, is as follows:
Year Ending June 30, Principal Interest
Business-type Activities
2014 Golf Course Loan Agreement
The 2014 Loan Agreement, consisting of $6,350,000, were issued by the City of Downey to prepay the 2002 Lease Agreement and Certificates of Participation (Golf Course Financing). Principal payments are due August, the interest is due February and August of every year at a rate of 3.70% maturing in August 2026.
Future debt service requirements on these certificates are as follows:
Year Ending June 30, Principal Interest
CITY OF DOWNEY
Year Ending June 30,PrincipalInterest Total 2024 114,000 $ 10,916 $ 124,916 $ 2025 114,000 7,902 121,902 2026 114,000 4,821 118,821 2027 114,000 1,630 115,630 Total 456,000 $ 25,269 $ 481,269 $
2024158,000 $ 78,185 $ 236,185 $ 2025158,000 74,009 232,009 2026158,000 69,738 227,738 2027158,000 65,316 223,316 2028158,000 60,789 218,789 2029-2033 790,000 230,573 1,020,573 2034-2038 790,000 97,972 887,972 2039-2040 156,000 2,835 158,835 Total 2,526,000 $ 679,417 $ 3,205,417 $
Total
Total 2024 535,000 $ 73,538 $ 608,538 $ 2025 550,000 53,465 603,465 2026 575,000 32,653 607,653 2027 595,000 11,008 606,008 Total 2,255,000 $ 170,664 $ 2,425,664 $ 72
CITY OF DOWNEY
Notes to the Financial Statements
For the Year Ended June 30, 2023
NOTE 13: COMPENSATED ABSENCES
Compensated Absences
For the fiscal year ended June 30, 2023, compensated absences are as follows:
The compensated absences are predominantly associated with the General fund.
NOTE 14: CLAIMS AND JUDGEMENTS
Claims Payable (Self-Insurance)
The City has two types of claims it has to manage and account for. The City is a member of Independent Cities Risk Management Authority (ICRMA), an Authority that provides liability insurance for several California Cities, and employs independent claims administrators to accomplish this task. The two types of claims are workers’ compensation and general liability. The self-insured retention and limits of insurance coverage (each occurrence or per employee, per year) for the respective claims are as follows:
Changes in the workers’ compensation, employee health benefits, and general
for the fiscal year ended June 30, 2023, were as follows:
Payable, June 30, 20216,365,000
liability
claims liability
Balance BalanceDue Within June 30, 2022AdditionsReductionsJune 30, 2023One Year Compensated absences: Governmental activities 16,606,908 $ 5,457,207 $ 4, 946,431 $ 17,117,684 $ 1,399,776 $ Business-type activities 535,300 202,419 102,791 634,928 51,920 Total compensated absences 17,142,208 $ 5,659,626 $ 5, 049,222 $ 17,752,612 $ 1,451,696 $ Self-Insured Retention Limit of Insurance Coverage Workers' Compensation 750,000 $ 5,000,000 $ General Liability 2,000,000 20,000,000 General Liability Workers' Compensation Employee Health BenefitTotal Claims
$ 17,623,000 $ 85,000 $ 24,073,000 $ Adjustments due to actuarial valuation(461,478) - - (461,478) Claims and Changes in Estimates- 4,199,287 - 4,199,287 Claims Payments(553,522) (2,781,287) - (3,334,809) Claims Payable, June 30, 20225,350,000 $ 19,041,000 $ 85,000 $ 24,476,000 $ Claims payable, due within one year1,132,000 $ 3,372,000 $ - $ 4,504,000 $ Claims Payable,
30,
$ 19,041,000 $ 85,000 $ 24,476,000 $ Adjustments due to actuarial valuation- (736,000) - (736,000) Claims and
Estimates358,194 3,103,472 - 3,461,666 Claims
-
Claims
$ 18,305,000 $ 85,000 $ 23,648,000 $ Claims payable, due within one year1,265,000 $ 3,401,000 $ - $ 4,666,000 $ 73
outstanding
June
20225,350,000
Changes in
Payments(450,194) (3,103,472)
(3,553,666)
Payable, June 30, 20235,258,000
Notes to the Financial Statements
For the Year Ended June 30, 2023
NOTE 14: CLAIMS AND JUDGEMENTS (CONTINUED)
The amounts payable include Incurred but Not Reported (IBNR) claims. Payments are typically paid from the General Fund and Employee Benefits Internal Service Fund. The various amounts are based on information provided by the City’s claims administrators.
NOTE 15: CITY EMPLOYEE RETIREMENT PLAN
A. General Information about the Pension Plans
The City of Downey contributes to the State of California Public Employees Retirement System (CalPERS), which is an agent multiple-employer public employee defined benefit pension plan. All qualified permanent and probationary employees are eligible to participate in the City’s separate Safety (police and fire) and Miscellaneous (all other) Plans administered by CalPERS, which acts as a common investment and administrative agent for its participating member employers. CalPERS provides retirement and disability benefits, annual cost-of-living adjustments, and death benefits to plan members and beneficiaries. Benefit provisions and all other requirements are established by state statute and city ordinance. Copies of PERS’ annual financial report may be obtained from their Executive Office - 400 P Street Sacramento, California 95814, or downloaded from the website at www.calpers.ca.gov.
Benefits Provided
CalPERS provides service retirement and disability benefits, annual cost of living adjustments and death benefits to plan members, who must be public employees and beneficiaries. Benefits are based on years of credited service, equal to one year of full-time employment. Members with five years of total service are eligible for non-duty disability benefits after 10 statutorily reduced benefits.
Pension related balances presented on the Statement of Net Position as of June 30, 2023 by individual plan are described in the following table:
The Plans’ provisions and benefits in effect at June 30, 2022, are summarized as follows:
CITY OF DOWNEY
The Miscellaneous and Safety Classic Plans
Deferred Deferred Deferred EmployerOutflowsNet Pension Inflows Pension ContributionsPension Liability Pension Expense CalPERS Miscellaneous Plan3,907,132 $ 14,161,800 $ (39,330,990) $ (892,118) $ 6,876,599 $ CalPERS Safety Plan 9,971,088 34,666,431 (84,881,108) (2,278,309) 13,399,195 Total pension plans 13,878,220 $ 48,828,231 $ (124,212,098) $ (3,170,427) $ 20,275,794 $ Miscellaneous Classic Miscellaneous Classic - 2nd Tier PEPRA MiscellaneousSafety Classic Safety Classic2nd Tier PEPRA Safety Police PEPRA Safety Fire
January
January
2013
after Prior to January 1, 2013 October 10,2012
January 1, 2013 January
2013
after January
2013
after Benefit formula2.7% @ 552.0% @ 602% @ 623% @ 503% @ 552.7% @ 57 2.7% @ 57 Benefit vesting schedule5 years service5 years service5 years service5 years service5 years service5 years service5 years service Benefit payments monthly for lifemonthly for lifemonthly for lifemonthly for lifemonthly for lifemonthly for lifemonthly for life Retirement age minimum 50 yrsminimum 50 yrsminimum 52 yrsminimum 50 yrsminimum 50 yrsminimum 52 yrsminimum 52 yrs Monthly benefits,
%
eligible compensation 2.0%
2.7%, 50
2.0%
2.7%, 50
1.0%
2.5%, 52
67+
3.0%, 50 yrs
55+
3.0%, 50 yrs
55+ yrs 2.0% - 2.7%, 50 yrs
57+
2.0%
2.7%, 50
Required employee contribution rates 8.000%7.000% 6.250% 9.000% 9.000%12.000%12.000% Required employer contribution rates 10.240%10.240%10.240%19.990%19.990%19.990%19.990% Required unfunded liability payment $ 2,369,896 $ - $ - $ 4,957,335 $ - $ - $Miscellaneous agent plans Safety agent plans 74
are closed to new entrants.
Hire date Prior to January 1, 2013
11,2012January 1, 2013
1,
and
-
1,
and
1,
and
as a
of
-
yrs - 55+ yrs, respectively
-
yrs - 55+ yrs, respectively
-
yrs -
yrs, respectively
-
yrs
-
-
yrs, respectively
-
yrs - 57+ yrs, respectively
Notes to the Financial Statements
For the Year Ended June 30, 2023
NOTE 15: CITY EMPLOYEE RETIREMENT PLAN (CONTINUED)
Employees Covered
At the June 30, 2022 measurement date, the following employees were covered by the benefit terms for each Plan:
MiscellaneousSafety
Inactive employees or beneficiaries currently receiving benefits
323 Inactive employees entitled to but not yet receiving benefits
Contribution Description
Section 20814(c) of the California Public Employees’ Retirement Law (PERL) requires that the employer contribution rates for all public employers be determined on an annual basis by the actuary and shall be effective on the July 1 following notice of a change in the rate. The total plan contributions are determined through CalPERS’ annual actuarial valuation process. The actuarially determined rate is the estimated amount necessary to finance the costs of benefits earned by employees during the year, with an additional amount to finance any unfunded accrued liability. The employer is required to contribute the difference between the actuarially determined rate and the contribution rate of employees.
B. Net Pension Liability
The City’s net pension liability for each Plan is measured as the total pension liability, less the pension plan’s fiduciary net position. The net pension liability of each of the Plans is measured as of June 30, 2022, using an annual actuarial valuation as of June 30, 2021, rolled forward to June 30, 2022, using standard update procedures. A summary of principal assumptions and methods used to determine the net pension liability is shown below.
Actuarial Assumptions
The total pension liabilities in the June 30, 2022, actuarial report were determined using the following actuarial assumptions:
Actuarial Cost Method
Actuarial Assumptions
Salary Increases
Entry Age Actuarial Cost Method
Varies by Entry Age and Service
Mortality Rate Table (1) Derived using CalPERS’ Membership Data for all Funds
Post Retirement Benefit Increase
Contract COLA up to 2.30% until Purchasing Power Protection Allowance Floor on Purchasing Power applies, 2.30% thereafter
(1)ThemortalitytableusedwasdevelopedbasedonCalPERS’specificdata .Formore details on this table, please refer to the 2017 experience stud y report.
Change of Assumptions - Effective with the June 30, 2021 valuation date (2022 measurement date), the accounting discount rate was reduced from 7.15% to 6.90%.
CITY OF DOWNEY
Active employees 241 177 1,263 591
463
559 91
Discount Rate 6.90% Inflation 2.30%
75
Notes to the Financial Statements
For the Year Ended June 30, 2023
NOTE 15: CITY EMPLOYEE RETIREMENT PLAN (CONTINUED)
Subsequent Events - On July 12, 2021, CalPERS reported a preliminary 21.3% net return on investments for fiscal year 2020-21. Based on the thresholds specified in CalPERS Funding Risk Mitigation policy, the excess return of 14.3% prescribes a reduction in investment volatility that corresponds to a reduction in the discount rate used for funding purposes of 0.20%, from 7.00% to 6.80%. Since CalPERS was in the final stages of the four-year Asset Liability Management (ALM) cycle, the board elected to defer any changes to the asset allocation until the ALM process concluded, and the board could make its final decision on the asset allocation in November 2021.
On November 17, 2021, the board adopted a new strategic asset allocation. The new asset allocation along with the new capital market assumptions, economic assumptions and administrative expense assumption support a discount rate of 6.90% (net of investment expense but without a reduction for administrative expense) for financial reporting purposes. This includes a reduction in the price inflation assumption from 2.50% to 2.30% as recommended in the November 2021 CalPERS Experience Study and Review of Actuarial Assumptions. This study also recommended modifications to retirement rates, termination rates, mortality rates and rates of salary increases that were adopted by the board. These new assumptions will be reflected in the GASB 68 accounting valuation reports for the June 30, 2022, measurement date.
Discount Rate - The discount rate used to measure the total pension liability was 6.90%. The projection of cash flows used to determine the discount rate assumed that contributions from plan members will be made at the current member contribution rates and that contributions from employers will be made at statutorily required rates, actuarially determined. Based on those assumptions, the Plan’s fiduciary net position was projected to be available to make all projected future benefit payments of current plan members. Therefore, the long-term expected rate of return on plan investments was applied to all periods of projected benefit payments to determine the total pension liability.
Long-term Expected Rate of Return - The long-term expected rate of return on pension plan investments was determined using a building-block method in which expected future real rates of return (expected returns, net of pension plan investment expense and inflation) are developed for each major asset class. In determining the long-term expected rate of return, CalPERS took into account both short-term and long-term market return expectations. Using historical returns of all of the funds’ asset classes, expected compound (geometric) returns were calculated over the next 20 years using a building-block approach. The expected rate of return was then adjusted to account for assumed administrative expenses of 10 Basis points. The expected real rates of return by asset class are as follows:
Asset Class 1
Global Equity Non-Cap-weighted
Private Equity
Treasury
Mortgage-Backed Securities
Investment Grade Corporates
1 An expected price inflation of 2.30% used for this period.
2 Figures are based on the 2021 Asset Liability Management study
CITY
OF DOWNEY
New Strategic AllocationReal Return 1, 2 Global Equity - Cap-weighted 30.00% 4.54% 12.00% 3.84% 13.00% 7.28% 5.00% 0.27% 5.00% 0.50% 10.00% 1.56% High Yield 5.00% 2.27% Emerging Market Debt 5.00% 2.48% Private Debt 5.00% 3.57% Real Assets 15.00% 3.21% Leverage -5.00% -0.59% Total 100.00%
76
Notes to the Financial Statements For the Year Ended June 30, 2023
NOTE 15: CITY EMPLOYEE RETIREMENT PLAN (CONTINUED)
C. Changes in Net Pension Liability
in
CITY OF DOWNEY
measurement date
Plan
Miscellaneous Plan Total Pension Liability (a) Plan Fiduciary Net Position (b) Net Pension Liability/(Assets) (c)=(a)-(b) Balance at: 6/30/2021 (Measurement date)215,800,173 $ 210,016,169 $ 5,784,004 $ Changes Recognized for the Measurement Period: Service Cost3,157,044 - 3,157,044 Interest on the Total Pension Liability14,909,880 - 14,909,880 Difference between Expected and Actual Experience(1,655,691) - (1,655,691) Changes of Assumptions6,314,571 - 6,314,571 Contribution from the Employer- 3,686,157 (3,686,157) Contributions from Employees- 1,246,789 (1,246,789) Net Investment Income- (15,623,270) 15,623,270 Plan to Plan Resource Movement- (30) 30 Benefit Payments including Refunds of Employee Contributions(11,904,687) (11,904,687)Administration Expenses- (130,828) 130,828 Net Changes During 2021-2210,821,117 (22,725,869) 33,546,986 Balance at: 6/30/2022 (Measurement Date)226,621,290 $ 187,290,300 $ 39,330,990 $ Safety Plan Total Pension Liability (a) Plan Fiduciary Net Position (b) Net Pension Liability/(Assets) (c)=(a)-(b) Balance at: 6/30/2021 (Measurement date)454,568,233 $ 444,255,490 $ 10,312,743 $ Changes Recognized for the Measurement Period: Service Cost7,775,844 - 7,775,844 Interest on the Total Pension Liability31,720,758 - 31,720,758 Difference between Expected and Actual Experience (1,467,525) - (1,467,525) Changes of Assumptions 14,719,478 - 14,719,478 Contribution from the Employer - 9,088,696 (9,088,696) Contributions from Employees - 2,538,089 (2,538,089) Net Investment Income - (33,169,880) 33,169,880 Plan to Plan Resource Movement - 30 (30) Benefit Payments including Refunds of Employee Contributions (23,973,965) (23,973,965)Administration Expenses - (276,745) 276,745 Net Changes During 2021-22 28,774,590 (45,793,775) 74,568,365 Balance at: 6/30/2022 (Measurement Date) 483,342,823 $ 398,461,715 $ 84,881,108 $ Increase (Decrease) 77
The changes
the Net Pension Liability recognized over the
for each
follows:
Notes to the Financial Statements
For the Year Ended June 30, 2023
NOTE 15: CITY EMPLOYEE RETIREMENT PLAN (CONTINUED)
Sensitivity of the Net Pension Liability to Changes in the Discount Rate
The following presents the net pension liability of the Plan as of the measurement date, calculated using the discount rate of 6.90 percent, as well as what the net pension liability would be if it were calculated using a discount rate that is 1 percentage-point lower (5.90 percent) or 1 percentage-point higher (7.90 percent) than the current rate:
Plan's Net Pension Liability
Recognition of Gains and Losses
Under GASB 68, gains and losses related to changes in total pension liability and fiduciary net position are recognized in pension expense systematically over time.
The first amortized amounts are recognized in pension expense for the year the gain or loss occurs. The remaining amounts are categorized as deferred outflows and deferred inflows of resources related to pensions and are to be recognized in future pension expense.
The amortization period differs depending on the source of the gain or loss:
Difference between projected and actual earnings 5 year straight-line amortization
All other amounts
Straight-lineamortizationoverthe expectedaverageremainingservice lifetime (EARSL) of all members that areprovidedwithbenefits(active, inactive,andretired)asofthe beginningofthemeasurement period.
The expected average remaining service lifetime (EARSL) is calculated by dividing the total future service years by the total number of plan participants (active, inactive, and retired).
The EARSL for the Plan for the measurement period ending June 30, 2022 is 3.6 years for safety and 2.1 years for Miscellaneous, which was obtained by dividing the total service years of 2,203 safety and 2,646 miscellaneous (the sum of remaining service lifetimes of the active employees) by 605 safety and 1,290 miscellaneous (the total number of participants: active, inactive, and retired). Note that inactive employees and retirees have remaining service lifetimes equal to 0. Also note that total future service is based on the members’ probability of decrementing due to an event other than receiving a cash refund.
Pension Plan Fiduciary Net Position
Detailed information about each pension plan’s fiduciary net position is available in the separately issued CalPERS financial reports.
CITY OF DOWNEY
Plans Discount Rate1% (5.90%) Discount Rate (6.90%) Discount Rate + 1% (7.90%) Miscellaneous68,813,244 $ 39,330,990 $ 15,034,786 $ Safety 150,439,263 84,881,108 31,232,207 219,252,507 $ 124,212,098 $ 46,266,993 $
78
Notes to the Financial Statements
For the Year Ended June 30, 2023
NOTE 15: CITY EMPLOYEE RETIREMENT PLAN (CONTINUED)
D. Changes in Net Pension Liability
For the measurement period ending June 30, 2022, the City incurred pension expense in the amount of $6,876,599 and $13,399,195 for the Miscellaneous and Safety Plans, respectively, totaling $20,275,794 for all plans. The City recognized a reduction of net pension liability of $124,212,098, $39,330,990 from the Miscellaneous Plan and $84,881,108 from the Safety Plan. At June 30, 2023, the City reported deferred outflows of resources and deferred inflows of resources related to pensions from the following sources:
Pension contributions subsequent to measurement date3,907,132 $ - $ Changes of Assumptions 3,307,632
between Expected and Actual Experiences
Net difference between projected and actual earnings on pension plan investments
Plan
to measurement date9,971,088
The $3,907,132 and $9,971,088 reported as deferred outflows of resources related to miscellaneous and safety plan contributions subsequent to the measurement date will be recognized as a reduction of the net pension liability in the year ended June 30, 2024. Other amounts reported as deferred outflows and deferred inflows of resources related to pensions will be recognized in future pension expense as follows:
Deferred Outflows/(Inflows) of Resources
Measurement Period
CITY OF DOWNEY
Miscellaneous
Deferred Outflows of Resources Deferred Inflows of Resources
Plan
10,854,168
18,068,932
Safety
Deferred Outflows of Resources Deferred Inflows of Resources
$
10,630,734
Differences
445,964
pension plan investments 23,589,73344,637,519 $ (2,278,309) $ Total Deferred Outflows and Inflows of resources 62,706,451 $ (3,170,427) $
Differences
- (892,118)
-
$ (892,118) $
Pension contributions subsequent
$ -
Changes of Assumptions
-
between Expected and Actual Experiences
(2,278,309) Net difference between projected and actual earnings on
Ended June Miscellaneous Safety Total Plans 20234,115,329 $ 7,427,995 $ 11,543,324 $ 20242,001,477 7,340,541 9,342,018 20251,183,419 4,943,050 6,126,469 20265,969,457 12, 676,536 18,645,993 13,269,682 $ 32, 388,122 $ 45,657,804 $
79
Notes to the Financial Statements
For the Year Ended June 30, 2023
NOTE 16: POST-EMPLOYMENT BENEFITS OTHER THAN PENSIONS
Plan Description
In connection with the retirement benefits for employees described in Note 13, the City provides post-retirement medical benefits to retirees. The Plan is an agent-multiple employer plan. These benefits are available to employees who retire with the City with at least 10 years of service or those who satisfy certain disability requirements. The Plan does not issue a publicly available financial report.
Funding Policy
The City’s funding policy affects the calculation of liabilities by impacting the discount rate that is used to develop the plan liability and expense. “Prefunding” is the term used when an agency consistently contributes an amount based on an actuarially determined contribution (ADC) each year. GASB 75 allows prefunded plans to use a discount rate that reflects the expected earnings on trust assets. Pay-as- you-go, or “PAYGO”, is the term used when an agency only contributes the required retiree benefits when due. When an agency finances retiree benefits on a pay-as-you-go basis, GASB 75 requires the use of a discount rate equal to a 20-year high grade municipal bond rate.
The City has been and continues to prefund its OPEB liability, contributing 100% or more of the Actuarially Determined Contributions each year. Therefore, with the City’s approval, the discount rate used in this valuation is 6.10%, the City’s expectation of the long-term return on trust assets.
Employees Covered
As of the June 30, 2022 actuarial valuation, the following current and former employees were covered by the benefit terms under the OPEB Plan:
Inactive members currently receiving benefits
Inactive members entitled to but not yet receiving benefits
Active members
Contributions
The OPEB Plan and its contribution requirements are established by Memoranda of Understanding with the applicable employee bargaining units and may be amended by agreements between the City and the bargaining units. The annual contribution is based on the actuarially determined contribution. For the measurement date ended June 30, 2021, the City’s cash contributions were $977,849 in total payments, which were recognized as a reduction to the OPEB liability.
Net OPEB Liability
The City’s net OPEB liability was measured as of June 30, 2022 using an actuarial valuation as of June 30, 2021. The Liability was determined based on the following actuarial methods and assumptions:
Mortality Rate (1) MacLeod Watts Scale 2022 applied generationally from 2015 Healthcare Trend Rate 5.6% in 2024 fluctuating down to 3.9% by 2076
CITY OF DOWNEY
238
210
424
872 Actuarial Cost Method Entry Age Normal Actuarial Assumptions Discount Rate 6.10% Inflation 2.50% Salary Increases 3.00% per year Investment Rate of Return 6.15%
Total
80
Notes to the Financial Statements
For the Year Ended June 30, 2023
NOTE 16: POST-EMPLOYMENT BENEFITS OTHER THAN PENSIONS (CONTINUED)
Notes:
(1) Mortality rates used were those published by CalPERS, adjusted to back out 15 years of Scale MP 2016 to central year 2015, then projected as described above.
The long-term expected rate of return on OPEB plan investments was determined using a building-block method in which expected future real rates of return (expected returns, net of OPEB plan investment expense and inflation) are developed for each major asset class. These ranges are combined to produce the long-term expected rate of return by weighting the expected future real rates of return by the target asset allocation percentage and by adding expected inflation. The target allocation and best estimates of arithmetic real rates of return for each major asset class are summarized in the following table:
Discount Rate
The discount rate used to measure the total OPEB liability was 6.10 percent. The projection of cash flows used to determine the discount rate assumed that City contributions will be made at rates equal to the actuarially determined contribution rates. Based on those assumptions, the OPEB plan’s fiduciary net position was projected to be available to make all projected OPEB payments for current active and inactive employees and beneficiaries. Therefore, the long-term expected rate of return on OPEB plan investments was applied to all periods of projected benefit payments to determine the total OPEB liability.
CITY OF DOWNEY
Asset Class Target Allocation Long-term expected real rate of return Global Equity 49.00% 6.80% Global Debt Securities23.00% 4.50% Inflation Assets 5.00% 3.60% REITs 20.00% 6.20% Commodities 3.00% 3.50% Total 100.00% 81
Notes to the Financial Statements
For the Year Ended June 30, 2023
NOTE 16: POST-EMPLOYMENT BENEFITS OTHER THAN PENSIONS (CONTINUED)
Changes in the OPEB Liability
The changes in the net OPEB liability are as follows:
Balance at June 30, 2021 (Measurement
recognized for the measurement period:
Sensitivity of the Net OPEB Liability to Changes in the Discount Rate
The following presents the net OPEB liability of the City if it were calculated using a discount rate that is one percentage point lower or one percentage point higher than the current rate, for measurement period ended June 30, 2022:
Sensitivity of the Net OPEB Liability to Changes in the Health Care Cost Trend Rates
The following presents the net OPEB liability of the City if it were calculated using health care cost trend rates that are one percentage point lower or one percentage point higher than the current rate, for measurement period ended June 30, 2022:
OPEB Plan Fiduciary Net Position
CalPERS issues a separate Annual Comprehensive Financial Report. Copies of the annual financial report may be obtained from the CalPERS Executive Office at 400 P Street, Sacramento, California, 95814.
CITY OF DOWNEY
Total OPEBPlan FiduciaryNet OPEB LiabilityNet PositionLiability/(Asset) (a)(b)(c) = (a) -
date)15,711,493 $ 10,767,675 $ 4,943,818 $
Service cost434,244 - 434,244 Interest on total OPEB liability 966,883 - 966,883 Changes
92,955 - 92,955 Contributions-employer - 977,849 (977,849) Net investment income - (1,441,009) 1,441,009 Benefit payments,
employee contributions Administrative expense - (2,727) 2,727 Net changes during 2021-22 645,962 (1,314,007) 1,959,969 Balance
$ 9,453,668 $ 6,903,787 $ Discount RateCurrentDiscount Rate -1 PercentDiscount Rate+1 Percent (5.10%)(6.10%)(7.10%) Plan's net OPEB liability/(asset)8,956,350 $ 6,903,787 $ 5,197,340 $ Current 1 PercentHeathcare1 Percent DecreaseTrend RateIncrease Plan's net OPEB liability/(asset)5,417,689 $ 6,903,787 $ 8,843,814 $ 82
(b)
Changes
of assumptions
including refunds of (848,120) (848,120)
at June 30, 2022 (Measurement date)16,357,455
CITY OF DOWNEY
Notes to the Financial Statements
For the Year Ended June 30, 2023
NOTE 16: POST-EMPLOYMENT BENEFITS OTHER THAN PENSIONS (CONTINUED)
OPEB Expense and Deferred Outflows/Inflows of Resources Related to OPEB
For the fiscal year ended June 30, 2023, the City recognized OPEB expense of $742,670. As of fiscal year ended June 30, 2023, the City reported deferred outflows of resources related to OPEB from the following sources:
Deferred OutflowsDeferred Inflows of Resourcesof Resources
Contributions subsequent to the measurement date *888,618 $ - $
Changes of assumptions957,828 417,823
Differences between expected and actual experience- 735,214
Net difference between projected and actual earnings on OPEB plan investments 771,465 -
Total 2,617,911 $ 1,153,037 $
* Includes implied subsidy of $429,703
The $888,618 reported as deferred outflows of resources related to contributions subsequent to the June 30, 2022 measurement date will be recognized as a reduction of the net OPEB liability during the fiscal year ending June 30, 2024. Other amounts reported as deferred outflows of resources related to OPEB will be recognized as expense as follows:
Deferred Outflows/(Inflows) Fiscal year ended June 30,of Resources 202412,506 $ 2025(5,993) 2026(61,402)
Total576,256 $
NOTE 17: JOINT VENTURES
The City is a participant in four joint ventures. The joint ventures are not considered part of the reporting entity, as the City does not exercise primary oversight responsibilities for their operations and does not have financial responsibility. These agencies do not depend on revenue from the City to continue in existence. Each participating agency in these joint ventures has proportionate control over management, budgets, and financial decisions.
Southeast Area Animal Control Authority
.
This joint venture provides animal control services to nine cities in the Southeast Los Angeles County area. The Authority is governed by a nine-member board with one representative from each member city. Each member is obligated to contribute annually.
2028128,872 Thereafter99,733
2027402,540
83
Notes to the Financial Statements
For the Year Ended June 30, 2023
NOTE 17: JOINT VENTURES (CONTINUED)
The Authority is not currently experiencing financial stress on accumulating significant resources. The City has no equity interest in the Authority and does not receive a share of operating results. Separate audited financial statements for the Authority may be obtained at 9777 Seaaca Street, Downey, California 90241.
Joint Fire Dispatching Center
In this joint venture, the City operates as a cooperative program with the cities of Santa Fe Springs and Compton. The City receives all calls for fire emergency services and dispatches fire units for the four-city area. The program is financed with contributions from each city per a Joint Powers Agreement. Pro-rata expenditures and revenues are reported as part of the Fire Department. Separate audited financial statements are not prepared for the joint venture.
Gateway Authority (Gateway Region IRWM Joint Powers Authority).
This joint venture was formed through a directive of COG (Gateway Cities Council of Governments) in 2007 and was designated by the State of California as an Integrated Regional Water Management Group. This coalition is currently comprised of 19 cities and government entities and is responsible for the regional water planning needs in the Gateway Cities Region. The Gateway Authority is governed by the member cities and agencies and financed with contributions from each city per a Joint Powers Agreement. Separate audited financial statements for the Authority may be obtained at City of Signal Hill, City Hall. The City of Signal Hill acts as lead agency.
Southeast Water Coalition.
This joint venture was formed in 1991 to protect the quantity and quality of the regional water supply. This coalition is currently comprised of 11 cities. The Southeast Water Coalition is governed by the member cities and three advisory agencies. The City of Whittier acts as lead agency.
NOTE 18: MORTGAGE REVENUE BONDS
On March 13, 1985, the City of Downey issued, in conjunction with the cities of Covina, Rancho Cucamonga, and Calexico, Residential Mortgage Revenue Bonds, 1985 Series A, to provide funds in the amount of $1,937,040 to purchase loans to be secured by single-family condominium units in the City. The bonds are special obligations of the Covina, Rancho Cucamonga, Calexico, Downey Housing Finance Agency. Seattle First National Bank serves as trustee.
On May 15, 1985, the City of Downey issued, in conjunction with the cities of El Monte and San Jacinto, Single-Family Residential Mortgage Revenue Bonds, Issue of 1985, to provide funds in the amount of $1,950,000 to purchase loans to be secured by single-family condominium units in the City. The bonds are special obligations of the El Monte-Downey-San Jacinto Housing Finance Agency. Seattle First National Bank serves as trustee.
On August 8, 2001, the City of Downey issued, in conjunction with the California Statewide Communities Development Authority, Multi-Family Housing Revenue Bonds, Series S and S-T, to provide funds in the amount of $3,300,000 to purchase loans to be secured by multifamily apartment complex in the City. The bonds are limited obligations of the California Statewide Communities Development Authority payable solely from the revenues from the multifamily apartment complex. U.S. Bank Trust National serves as trustee.
The above debt issues are special obligations of the respective Housing Finance Agencies and are payable solely from payments made on mortgage loans and are secured by a pledge of such mortgage loans. Neither the faith and credit nor the taxing power of the City of Downey have been pledged to the payment of the bonds. Accordingly, these debts are not reported as liabilities in the accompanying financial statements.
CITY OF DOWNEY
84
Notes to the Financial Statements
For the Year Ended June 30, 2023
NOTE 19: SALES TAX ABATEMENT
The City has entered into a tax abatement agreement with a local businesses. The abatement may be granted to any business located within or promising to relocate to the City. For the Fiscal Year ended June 30, 2023, the City abated taxes totaling $177,896. Under this program, the City has the following Tax abatement agreements:
A sales tax abatement to assist a local auto dealership in relocating to a larger facility within the City in order to retain jobs within the City and generate increased sales taxes. Per the Agreement, the dealership is required to maintain no less than thirty- five full time equivalent positions. The City authorized a loan in the amount of $1,250,000, repayable over 12 years at an interest rate of 4.25 percent per year. Additionally, of any sales tax revenues exceeding $400,000 and up to $670,000, 50% of sales tax revenues shall be credited to the loan. For any sales tax revenue over $670,000, an additional 30% of the revenues shall be credited against the loan. Total tax abatements were $142,835 for the fiscal year.
A sales tax rebate with a local auto dealership in which the City authorized a loan in the amount of $500,000. The sales tax base will be 100% of the sales projections and the City will retain the first 50% of the sales tax collected. The second 50% will be shared will be shared by the City and the dealership. The City will use the portion to be credited against the $500,000 loan. Upon payment of the $500,000 loan, the City will then disburse the sales tax collected up to a maximum of $500,000. A combination of the sales tax credit for the loan of $500,000 plus the sales tax rebate will not exceed $1,000,000. Due to COVID 19 pandemic there was delay in construction and operation at the new dealership. City expects the dealership will be in operation during fiscal year 23-24, at which point abatement of sales tax will begin.
A tax abatement to assist a new RV dealership to serve as a sales tax rebate and job creation covenant. City will rebate 26% of the sales tax portion over $180,000 if the gross taxable sales at the property exceeds $18,000,000. The rebate is restricted to a maximum of $72,000 per year and shall not exceed $504,000 over 7 year period. Tax rebated in fiscal year was $35,061.
A. Net investment in capital assets
The breakdown for net investment in capital assets for the year ended June 30, 2023 is as follows:
CITY
OF DOWNEY
NOTE 20: FUND BALANCE AND NET POSITION
Total GovernmentalWaterGolfSewer and StormBusiness-Type ActivitiesFundFundDrain FundActivities Capital assets, net of accumulated depreciation291,990,025 $ 46,360,679 $ 13,638,934 $ 26,287,984 $ 86,287,597 $ Less: Bonds, notes and finance purchase agreements (70,964,855) - (2,255,000) - (2,255,000) Leases payable (1,728,464) - - -Subscriptions payable (45,963) Capital related, non-debt payable (1,146,535) (526,064) - - (526,064) Add: Unspent bond proceeds 9,602,647 Net investment in capital assets 227,706,855 $ 45,834,615 $ 11,383,934 $ 26,287,984 $ 83,506,533 $ Business-Type Activities 85
Notes to the Financial Statements For the Year Ended June 30, 2023
NOTE 20: FUND BALANCE AND NET POSITION (CONTINUED)
B. Restatements
The CIP Grant Fund and Transit Measure M and Measure W funds were restated due to the following adjustments:
Position (Deficit), Beginning of Year(4,290,949)
Net Position (Deficit), Beginning of Year, as Restated(4,390,082)
Beginning net position of the CIP Grant Fund and Transit Measure M Funds has been restated by $99,133 and $221,557, respectively due to expenditures relating to FY 21-22 which were not accrued in the prior fiscal year.
The Measure W – Sewer and Storm Drain Fund was also restated by $322,076 to adjust unearned revenue for the Safe Clean Water Program grant.
C. Fund Balance Classifications
CITY OF DOWNEY
CIP Grant Fund Non-Major Special Revenue FundsTransit Measure M Non-Major Special Revenue FundsMeasure W Sewer & Storm Drain Governmental Activities
$ 2,322,500 $ 1, 949,786 $ 124,569,360 $
(221,557) (322,076) (642,766)
$ 2,100,943 $ 1, 627,710 $ $123,926,594 CIP Other Total HousingGrantCovid-19GovernmentalGovernmental GeneralAuthorityFund GrantsFunds Funds Nonspendable Notes and Loans Receivable 992,014 $ - $ - $ - $ - $ 992,014 $ Prepaid Costs 342,810 - - - 2,200,196 2,543,006 Advances to Other Funds 7,707,214 - - - - 7,707,214 Total Nonspendable 9,042,038 - - - 2,200,196 11,242,234 Restricted Purpose of Grant Program - 4,104,467 - 216,288 23,962,683 28,283,438 Street Lighting - - - - 1,018,072 1,018,072 CATV Public Access - - - - 1,199,173 1,199,173 Art in Public Places - - - - 371,360 371,360 Unspent Bond Proceeds - - - - 7,029,814 7,029,814 Total Restricted - 4,104,467 - 216,288 33,581,102 37,901,857 Assigned Assigned for Emergency Reserve15,103,000 - - - - 15,103,000 Assigned for Stability Reserve 20,138,000 - - - - 20,138,000 Assigned for Capital Projects 356,742 - - - 12,379,641 12,736,383 Assigned for Measure S 2,602,308 - - - 2,655,770 5,258,078 Total Assigned 38,200,050 - - - 15,035,411 53,235,461 Unassigned 5,000 - (2,281,868) - (332,420) (2,609,288) Total Fund Balance / (Deficit) 47,247,088 $ 4,104,467 $ (2,281,868) $ 216,288 $ 50,484,289 $ 99,770,264 $ 86
Net
Restatements(99,133)
Notes to the Financial Statements
For the Year Ended June 30, 2023
NOTE 21: SUCCESSOR AGENCY TRUST FOR ASSETS OF FORMER REDEVELOPMENT AGENCY
On December 29, 2011, the California Supreme Court upheld Assembly Bill 1X 26 (“the Bill”) that provides for the dissolution of all redevelopment agencies in the State of California. This action impacted the reporting entity of the City of Downey that previously had reported a redevelopment agency within the reporting entity of the City as a blended component unit.
The Bill provides that upon dissolution of a redevelopment agency, either the city or another unit of local government will agree to serve as the “successor agency” to hold the assets until they are distributed to other units of state and local government. The City Council elected to become the Successor Agency for the former redevelopment agency. The assets and liabilities of the former redevelopment agency were transferred to the Successor Agency to the Community Development Commission of the City of Downey on February 1, 2012, as a result of the dissolution of the former redevelopment agency.
After enactment of the law, which occurred on June 28, 2011, redevelopment agencies in the State of California cannot enter into new projects, obligations or commitments. Subject to the control of a newly established oversight board, remaining assets can only be used to pay enforceable obligations in existence at the date of dissolution (including the completion of any unfinished projects that were subject to legally enforceable contractual commitments).
In future fiscal years, successor agencies will only be allocated revenue in the amount that is necessary to pay the estimated annual installment payments on enforceable obligations of the former redevelopment agency until all enforceable obligations of the prior redevelopment agency have been paid in full and all assets have been liquidated.
Management believes, in consultation with legal counsel, that the obligations of the former redevelopment agency due to the City are valid enforceable obligations payable by the successor agency trust under the requirements of the Bill. The City’s position on this issue is not a position of settled law and there is considerable legal uncertainty regarding this issue. It is reasonably possible that a legal determination may be made at a later date by an appropriate judicial authority that would resolve this issue unfavorably to the City.
The City is acting in a fiduciary capacity for the assets and liabilities. Disclosures related to these transactions are as follows:
A. Cash and investments
Cash and investments reported in the accompanying financial statements consisted of the following: Cash and investments pooled with the City 1,137,943 $ Cash and investments with fiscal agent 663,404 1,801,347 $
CITY OF DOWNEY
87
CITY OF DOWNEY
Notes to the Financial Statements
For the Year Ended June 30, 2023
NOTE 21: SUCCESSOR AGENCY TRUST FOR ASSETS OF FORMER REDEVELOPMENT AGENCY (CONTINUED)
B. Long-Term Debt
The following long-term debts were transferred from the Redevelopment Agency to the Successor Agency on February 1, 2012, as a result of the dissolution. A description of long-term debt outstanding (excluding defeased debt) of the Successor Agency as of June 30, 2023, follows:
Bonds Payable
1997 Tax Allocation Bonds Payable
In 1997 the Community Development Commission issued $9,925,000 in Tax Allocation Bonds, partially to advance refund the existing 1990 Tax Allocation bond issue, which had a balance outstanding of $4,470,000, and to repay the City for advances of $3,970,508 plus interest. The bonds have an average interest rate of 5.1%. U.S. Bank serves as trustee for payment of principal and interest. The balance outstanding at June 30, 2023, is $3,240,000.
The future debt service requirements on these bonds are as follows:
The outstanding bonds contain a provision that if any event of default should occur or continue to occur, the Trustee may, with the prior written consent of the Bond Insurer, and if request by the Bond Insurer and at the written direction of the Owners of a majority in aggregate principal amount of the Bonds at the time outstanding shall, (a) upon notice in writing to the Commission, declare the principal of all of the Bonds then outstanding, and the interest accrued thereon, to be due and payable immediately, of (b) enforce any rights of the Trustee under or with respect to the Owners of the Bonds for the purpose of exercising and prosecuting on their behalf such rights and remedies as may be available to such Owners under the provisions of the Bonds, the Indenture and applicable provisions of any law.
Pledged Revenue
The City pledged, as a security for bonds issued through the Community Development Commission, a portion of tax increment revenue that it receives. Assembly Bill 1X26 provided that upon dissolution of the Redevelopment Agencies (known as the Community Development Commission), property taxes allocated to redevelopment agencies no longer are deemed tax increment but rather property tax revenues and will be allocated first to successor agencies to make payments on the indebtedness incurred by the dissolved redevelopment agency. Total
Balance BalanceDue Within June 30, 2022AdditionDeletionJune 30, 2023One Year Bonds payable 3,690,000 $ - $ 450,000 $ 3,240,000 $ 475,000 $ Advances from City 8,392,454 2,909,297 2,157,060 9,144,691Advances from County38,184,552 2,438,413 2,311,686 38,311,279
Total long-term liabilities50,267,006 $ 5,347,710 $ 4,918,746 $ 50,695,970 $ 475,000 $ Year Ending June 30,PrincipalInterest Total 2024 475,000 $ 153,878 $ 628,878 $ 2025 500,000 128,894 628,894 2026 525,000 102,628 627,628 2027 550,000 75,081 625,081 2028 580,000 46,125 626,125 2029 610,000 15,631 625,631 Total3,240,000 $ 522,237 $ 3,762,237 $ 88
-
CITY OF DOWNEY
Notes to the Financial Statements
For the Year Ended June 30, 2023
NOTE 21: SUCCESSOR AGENCY TRUST FOR ASSETS OF FORMER REDEVELOPMENT AGENCY (CONTINUED)
principal and interest remaining on the debt is $3,762,237 with annual debt service requirements indicated above. For the current year, the total property tax revenue recognized by the Successor Agency for the payment of indebtedness incurred by the dissolved redevelopment agency was $136,707 and the debt obligation on the bonds was $627,582.
Advances from City
The DOF issued a Finding of Completion on May 15, 2013, in which DOF concurred that the Successor Agency has made full payments of any payments required as a result of the due diligence reviews. The Finding of Completion allows the placement of loan agreements between the former redevelopment agency and the City on the ROPS, as an enforceable obligation, provided the oversight board makes a finding that the loan was for legitimate redevelopment purposes. Loan repayments could begin in the 2015-16, fiscal year as governed by the criteria in the health and code safety section. When the repayments begin, 20% of the repayments of the loan agreement amounts are to be allocated to the Housing Successor Agency. As of June 30, 2023, the long-term advances totaled $9,144,691. As of June 30, 2023, $7,707,214 is reported in the General Fund and $1,437,477 is reported in the Housing Authority Special Revenue Fund.
Advances from County
As part of the City’s redevelopment program, the City and County of Los Angeles have entered into a tax increment pass-through deferral agreement. This agreement specifies that the City will defer the payment of all current tax increment pass-through due to the County, until some future date, when certain conditions are met. Until that time, the County will charge 7% interest on the outstanding deferral amount. During the year, there were no pass-through agreement amounts owed to the County that were deferred. Interest of $2,438,413 was also accrued during the year on the outstanding deferral amount still owing. The amount owed the County, including accrued interest, at June 30, 2023, was $38,311,279.
89
THIS PAGE INTENTIONALLY LEFT BLANK
90


REQUIRED SUPPLEMENTAL INFORMATION 91
THIS PAGE INTENTIONALLY LEFT BLANK
92
Agent Multiple-Employer Miscellaneous Plan
Schedule of Changes in the Net Pension Liability and Related Ratios
As of June 30, For the Last Ten Fiscal Years (1)
Notes to Schedule:
Benefit Changes:Thefiguresabovegenerallyincludeanyliabilityimpactthatmayhaveresultedfromvoluntarybenefitchangesthatoccurredonor beforetheMeasurementDate.However,offersofTwoYearsAdditionalServiceCredit(a.k.a.GoldenHandshakes)thatoccurredaftertheValuation Date are not included in the figures above, unless the liability impact is deemed to be material by the plan actuary.
Changes of Assumptions:EffectivewiththeJune30,2021valuationdate(2022measurementdate),theaccountingdiscountratewasreducedfrom 7.15%to6.90%.Indeterminingthelong-termexpectedrateofreturn,CalPERStookintoaccountlong-termmarketreturnexpectationsaswellasthe expectedpensionfundcashflows.Projectedreturnsforallassetclassesareestimated,combinedwithriskestimates,andareusedtoproject compound(geometric)returnsoverthelongterm.Thediscountrateusedtodiscountliabilitieswasinformedbythelong-termprojectedportfolioreturn. Inaddition,demographicassumptionsandtheinflationrateassumptionwerechangedinaccordancewiththe2021CalPERSExperienceStudyand ReviewofActuarialAssumptions.Theaccountingdiscountratewas7.15%formeasurementdates2017through2021,7.65%formeasurementdates 2015 through 2016, and 7.50% for measurement date 2014.
(1) Fiscal Year 2015 was the first year of implementation, therefore only nine years are shown.
CITY OF DOWNEY
2023202220212020 Total Pension Liability Service Cost 3,157,044 $ 2,872,012 $ 2,859,113 $ 2,845,628 $ Interest on total pension liability 14,909,880 14,690,041 14,297,751 13,871,616 Differences between expected and actual experience (1,655,691) (521,832) (82,862) 279,451 Changes in assumptions 6,314,571 - -Benefit payments, including refunds of employee contributions (11,904,687) (11,561,991) (10,747,851) (10,614,492) Net change in total pension liability 10,821,117 5,478,230 6,326,151 6,382,203 Total pension liability - beginning215,800,173 210,321,943 203,995,792 197,613,589 Total pension liability - ending (a)226,621,290 $ 215,800,173 $ 210,321,943 $ 203,995,792 $ Plan fiduciary net position Contributions - employer 3,686,157 $ 39,587,168 $ 5,960,428 $ 5,194,316 $ Contributions - employee 1,246,789 1,233,750 1,211,665 1,290,943 Differences in projected and actual earnings - - -Net investment income (15,623,270) 35,352,353 7,030,477 8,947,221 Plan to plan resource movement (30) 3,965 -Administration expense (130,828) (145,392) (200,597) (98,174) Benefit payments (11,904,687) (11,561,991) (10,747,851) (10,614,492) Other miscellaneous income (expense) - - - 320 Net change in plan fiduciary net position (22,725,869) 64,469,853 3,254,122 4,720,134 Plan fiduciary net position - beginning210,016,169 145,546,316 142,292,194 137,572,060 Plan fiduciary net position - ending (b)187,290,300 $ 210,016,169 $ 145,546,316 $ 142,292,194 $ Net pension liability - ending (a)-(b) 39,330,990 $ 5,784,004 $ 64,775,627 $ 61,703,598 $ Plan fiduciary net position as a percentage of the total pension liability 82.64%97.32%69.20%69.75% Covered payroll 16,964,041 $ 15,170,622 $ 14,924,957 $ 14,982,015 $ Net pension liability as a percentage of covered payrol 231.85%38.13%434.01%411.85%
93
2019 2018 2017 2016 2015 2,747,310 $ 2,636,289 $ 2,361,815 $ 2,372,336 $ 2,312,390 $ 13,432,640 13,024,839 12,804,332 12,400,751 12,026,911 793,693 (1,684,960) (437,509) (872,403)(1,002,999) 10,503,420 - (2,930,596)(10,123,596) (9,484,059) (9,182,237) (8,927,251) (8,720,279) 5,847,048 14,995,529 5,546,401 2,042,837 5,619,022 191,766,541 176,771,012 171,224,611 169,181,774 163,562,752 197,613,589 $ 191,766,541 $ 176,771,012 $ 171,224,611 $ 169,181,774 $ 4,644,243 $ 4,191,836 $ 3,645,344 $ 3,324,338 $ 2,487,187 $ 1,259,290 1,209,428 1,158,399 1,307,613 1,333,703 - - - (6,742,788)10,970,946 13,489,599 600,935 9,576,038 19,329,661 (320) (957) - 9,214(204,781) (180,405) (76,817) (141,638)(10,123,596) (9,484,059) (9,182,237) (8,927,251) (8,720,279) (388,883) - - -6,156,899 9,225,442 (3,854,376) (1,594,474) 14,430,272 131,415,161 122,189,719 126,044,095 127,599,058 113,168,786 137,572,060 $ 131,415,161 $ 122,189,719 $ 126,004,584 $ 127,599,058 $ 60,041,529 $ 60,351,380 $ 54,581,293 $ 45,220,027 $ 41,582,716 $ 69.62%68.53%69.12%73.59%75.42% 14,116,181 $ 13,171,100 $ 12,471,112 $ 11,295,425 $ 11,873,874 $ 425.34%458.21%437.66%400.34%350.20% 94
Agent Multiple-Employer Miscellaneous Plan
Schedule of Plan Contributions
As of June 30, For the Last Ten Fiscal Years (1)
(1) Historical information is required only for measurement for which GASB 68 is applicable. Fiscal Year 2015 was the first year of implementation, therefore only nine years are shown.
Note to Schedule:
Valuation Date: June 30, 2021
7.00%netofpensioninvestmentandadministrativeexpenses,including inflation.
Theprobabilitiesofretirementarebasedonthe2017CalPERS Experience Study for the period from 1997 to 2015.
Theprobabilitiesofmortalityarebasedonthe2017CalPERS Experience Study for the period from 1997 to 2015. Pre-retirementandpost-retirementmortalityratesinclude15yearsof projectedmortalityimprovementusing90%ofScaleMP-2016published by the Society of Actuaries.
CITY OF DOWNEY
2023202220212020 MISCELLANEOUS PLAN: Actuarially Determined Contribution3,907,132 $ 3,688,975 $ 6,483,145 $ 5,961,098 $ Contribution in Relation to the Actuarially Determined Contributions (3,907,132) (3,688,975) (39,588,358) (5,961,098) Contribution Deficiency (Excess) - $ - $ (33,105,213) $ - $ Covered payroll 16,918,780 $ 16,964,041 $ 15,170,622 $ 14,924,957 $ Contributions as a Percentage of Covered Payroll 23.09%21.75%260.95%39.94%
Covered-employee payroll Single and Agent Employers Entry age normal Amortization method Level Percent of Payroll Assets valuation method Direct rate smoothing Inflation 2.50% Payroll growth 2.75% Investment rate of return Retirement age
Mortality
95
2019 2018 2017 2016 2015 5,196,100 $ 4,645,952 $ 4,191,472 $ 3,642,086 $ 3,324,338 $ (5,196,100) (4,645,952) (4,191,472) (3,642,086) (3,324,338) - $ - $ - $ - $ - $ 14,982,015 $ 14,116,181 $ 13,171,100 $ 12,471,112 $ 11,295,425 $ 34.68%32.91%31.82%29.20%29.43% 96
CITY OF DOWNEY
Agent Multiple-Employer Safety Plan
Schedule of Changes in the Net Pension Liability and Related Ratios
As of June 30, For the Last Ten Fiscal Years (1)
Notes to Schedule:
Benefit Changes:Thefiguresabovegenerallyincludeanyliabilityimpactthatmayhaveresultedfromvoluntarybenefitchangesthatoccurredonor beforetheMeasurementDate.However,offersofTwoYearsAdditionalServiceCredit(a.k.a.GoldenHandshakes)thatoccurredaftertheValuation Date are not included in the figures above, unless the liability impact is deemed to be material by the plan actuary.
Changes of Assumptions:EffectivewiththeJune30,2021valuationdate(2022measurementdate),theaccountingdiscountratewasreducedfrom 7.15%to6.90%.Indeterminingthelong-termexpectedrateofreturn,CalPERStookintoaccountlong-termmarketreturnexpectationsaswellasthe expectedpensionfundcashflows.Projectedreturnsforallassetclassesareestimated,combinedwithriskestimates,andareusedtoproject compound(geometric)returnsoverthelongterm.Thediscountrateusedtodiscountliabilitieswasinformedbythelong-termprojectedportfolioreturn. Inaddition,demographicassumptionsandtheinflationrateassumptionwerechangedinaccordancewiththe2021CalPERSExperienceStudyand ReviewofActuarialAssumptions.Theaccountingdiscountratewas7.15%formeasurementdates2017through2021,7.65%formeasurementdates 2015 through 2016, and 7.50% for measurement date 2014.
(1) Fiscal Year 2015 was the first year of implementation, therefore only nine years are shown.
2023202220212020 Total Pension Liability Service Cost 7,775,844 $ 7,124,490 $ 7,169,250 $ 6,716,100 $ Interest on total pension liability 31,720,758 30,838,840 29,942,370 28,659,471 Differences between expected and actual experience (1,467,525) (3,092,936) 2,675,792 3,650,077 Changes in assumptions 14,719,478 - -Benefit payments, including refunds of employee contributions (23,973,965) (22,290,600) (20,625,915) (20,044,668) Net change in total pension liability 28,774,590 12,579,794 19,161,497 18,980,980 Total pension liability - beginning454,568,233 441,988,439 422,826,942 403,845,962 Total pension liability - ending (a)483,342,823 $ 454,568,233 $ 441,988,439 $ 422,826,942 $ Plan fiduciary net position Contributions - employer 9,088,696 $ 94,012,641 $ 13,218,555 $ 11,639,905 $ Contributions - employee 2,538,089 2,467,916 2,433,973 2,388,761 Differences in projected and actual earnings - - -Net investment income (33,169,880) 73,568,416 14,351,500 18,021,079 Plan to plan resource movement 30 (3,965) -Administration expense (276,746) (296,482) (405,763) (196,971) Benefit payments (23,973,965) (22,290,600) (20,625,915) (20,044,668) Other miscellaneous income (expense) - - - 642 Net change in plan fiduciary net position (45,793,776) 147,457,926 8,972,350 11,808,748 Plan fiduciary net position - beginning444,255,491 296,797,565 287,825,215 276,016,467 Plan fiduciary net position - ending (b)398,461,715 $ 444,255,491 $ 296,797,565 $ 287,825,215 $ Net pension liability - ending (a)-(b) 84,881,108 $ 10,312,742 $ 145,190,874 $ 135,001,727 $ Plan fiduciary net position as a percentage of the total pension liability 82.44%97.73%67.15%68.07% Covered payroll 24,780,834 $ 19,537,373 $ 19,075,819 $ 22,440,568 $ Net pension liability as a percentage of covered payrol 342.53%52.78%761.13%601.60%
97
2019 2018 2017 2016 2015 6,437,149 $ 6,338,175 $ 5,590,668 $ 5,458,319 $ 5,427,672 $ 27,362,871 26,270,785 25,769,928 24,744,572 23,998,427 2,585,511 (5,710,849) 160,089 (3,331,302)(1,530,502) 22,209,649 - (6,140,951)(18,865,980) (18,013,052) (17,329,717) (16,721,908) (16,257,568) 15,989,049 31,094,708 14,190,968 4,008,730 13,168,531 387,856,913 356,762,205 342,571,237 338,562,507 325,393,976 403,845,962 $ 387,856,913 $ 356,762,205 $ 342,571,237 $ 338,562,507 $ 10,227,586 $ 8,809,223 $ 8,092,171 $ 6,745,873 $ 5,817,524 $ 2,184,777 2,003,302 1,996,000 1,919,372 1,883,501 - - - (13,442,866)21,925,706 26,775,670 1,189,163 18,916,599 38,057,937 (642) - - (191)(407,843) (358,050) (151,578) (279,890)(18,865,980) (18,013,052) (17,329,717) (16,721,908) (16,257,568)
- - -14,289,103 19,217,093 (6,203,961) (2,863,011) 29,501,394 261,727,364 242,510,271 248,714,232 251,581,146 222,079,752 276,016,467 $ 261,727,364 $ 242,510,271 $ 248,718,135 $ 251,581,146 $ 127,829,495 $ 126,129,549 $ 114,251,934 $ 93,853,102 $ 86,981,361 $ 68.35%67.48%67.98%72.60%74.31% 17,853,242 $ 17,580,987 $ 17,580,987 $ 17,248,670 $ 18,232,334 $
98
(774,501)
716.00%717.42%649.86%544.12%477.07%
Agent Multiple-Employer Safety Plan
Schedule of Plan Contributions
As of June 30, For the Last Ten Fiscal Years (1)
(1)HistoricalinformationisrequiredonlyformeasurementforwhichGASB68isapplicable.FiscalYear2015wasthefirstyearofimplementation, therefore only nine years are shown.
Note to Schedule:
Valuation Date: June 30, 2021
7.00%NetofPensionPlanInvestmentandAdministrativeExpenses; includes Inflation
Theprobabilitiesofretirementarebasedonthe2017CalPERS Experience Study for the period from 1997 to 2015.
MortalityTheprobabilitiesofmortalityarebasedonthe2017CalPERS Experience Study for the period from 1997 to 2015. Pre-retirementandpost-retirementmortalityratesinclude15yearsof projectedmortalityimprovementusing90%ofScaleMP-2016published by the Society of Actuaries.
CITY OF DOWNEY
2023202220212020 SAFETY PLAN: Actuarially Determined Contribution9,971,088 $ 9,058,878 $ 14,194,005 $ 13,217,885 $ Contribution in Relation to the Actuarially Determined Contributions (9,971,088) (9,058,878) (94,011,449) (13,217,885) Contribution Deficiency (Excess) - $ - $ (79,817,444) $ - $ Covered payroll 24,922,578 $ 24,780,834 $ 19,537,373 $ 19,075,819 $ Contributions as a Percentage of Covered Payroll 40.01%36.56%481.19%69.29%
Methods and assumptions used to determine contribution rates Single and Agent Employers Entry age normal Amortization method Level percentage of payroll Assets valuation method Direct rate smoothing Inflation 2.50% Payroll growth 2.75% Investment rate of return
Retirement age
99
2019 2018 2017 2016 2015 11,638,120 $ 10,225,876 $ 8,809,589 $ 8,092,171 $ 6,745,873 $ (11,638,120) (10,225,876) (8,809,589) (8,092,171) (6,745,873) - $ - $ - $ - $ - $ 22,440,568 $ 17,853,242 $ 17,580,987 $ 14,881,199 $ 11,125,500 $ 51.86%57.28%50.11%54.38%60.63% 100
Schedule of Changes in the Net OPEB Liability and Related Ratios
As of June 30, For the Last Ten Fiscal Years (1)
(1)HistoricalinformationisrequiredonlyforthemeasurementperiodsforwhichGASB75isapplicable.FiscalYear2018wasthefirst year of implementation. Future years' information will be displayed up to 10 years as information becomes available.
Notes to Schedule: None.
Changesinassumptions: Thediscountratedecreasedfrom6.15%to6.10%,reflectingupdatedlongtermratesofreturndescribed above,themunicipalbondindexrateasofthemeasurementdateandtheresultsofanalysisdescribedinGASB75paragraphs36-41. ThemortalityimprovementscalewasupdatedfromMacLeodWattsScale2018toMacLeodWattsScale2022,reflectingcontinued updatesinavailableinformation(seeAddendum3).UpdatedthebasehealthcaretrendscalefromGetzenModel2019_btoGetzenModel 2022_b, as published by the Society of Actuaries.
CITY OF DOWNEY
202320222021 Total OPEB Liability Service cost 434,244 $ 383,096 $ 371,938 $ Interest on the total OPEB liability 966,883 985,640 953,019 Actual and expected experience difference- (288,995)Changes in assumptions92,955 1,185,773Benefit payments (848,120) (911,116) (815,594) Net change in total OPEB liability 645,962 1,354,398 509,363 Total OPEB liability - beginning15,711,493 14,357,095 13,847,732 Total OPEB liability - ending (a)16,357,455 15,711,493 14,357,095 Plan Fiduciary Net Position Contribution - employer 977,849 911,116 1,104,427 Net investment income(1,441,009) 2,322,102 276,981 Benefit payments (848,120) (911,116) (815,594) Administrative expense(2,727) (3,196) (3,937) Other expenses - -Net change in plan fiduciary net position(1,314,007) 2,318,906 561,877 Plan fiduciary net position - beginning10,767,675 8,448,769 7,886,892 Plan fiduciary net position - ending (b)9,453,668 10,767,675 8,448,769 Net OPEB Liability/(Assets) - ending (a) - (b) 6,903,787 $ 4,943,818 $ 5,908,326 $ Plan fiduciary net position as a percentage of the total OPEB liability 57.79%68.53%58.85% Covered Payroll 48,236,864 $ 46,751,162 $ 46,420,079 $ Net OPEB liability as a percentage of covered payroll 14.31%10.57%12.73%
See Notes Required to Supplementary Information. 101
2020 2019 2018 359,310 $ 347,999 $ 337,046 $ 1,102,708 1,056,820 1,015,622
- -
-(814,729) (756,887) (838,553) (1,347,405) 647,932 514,115 15,195,137 14,547,205 14,033,090 13,847,732 15,195,137 14,547,205 814,729 966,887 1,008,553 458,848 532,762 623,878 (814,729) (756,887) (838,553)
- (8,860)457,257 730,333 790,711 7,429,635 6,699,302 5,908,591 7,886,892 7,429,635 6,699,302 5,960,840 $ 7,765,502 $ 7,847,903 $ 56.95%48.89%46.05% 44,034,470 $ 36,149,553 $ 34,730,877 $ 13.54%21.48%22.60% See Notes Required to Supplementary Information. 102
(1,107,411)
(887,283)
(1,591) (3,569) (3,167)
Schedule of Contributions - OPEB
As of June 30, For the Last Ten Fiscal Years (1)
Actuarially Determined Contribution Contribution in Relation to the Actuarially Determined Contributions Contribution Deficiency (Excess)
Covered payroll
(1)HistoricalinformationisrequiredonlyforthemeasurementperiodsforwhichGASB75isapplicable.FiscalYear2018wasthefirstyearof implementation. Future years' information will be displayed up to 10 years as information becomes available.
Notes to Schedule: None.
*ActuarialmethodsandassumptionsusedtosettheactuariallydeterminedcontributionforFiscalYear2023werefromtheJune30,2021 actuarial valuation.
Methods and assumptions used to determine contributions:
CITY OF DOWNEY
202320222021 1,098,290 $ 977,849 $ 958,316 $ (888,618) (977,849) (911,116) 209,672 $ - $ 47,200 $ 45,140,019 $ 48,236,864 $ 46,751,162 $ 1.97%2.03%2.05%
Amortization Valuation Method/Period Asset Valuation Method Market value Inflation 2.50% Payroll Growth 3.00% Investment
Retirement
Actuarial Cost Method
Rate of Return Healthcare cost-trend rates
Age Mortality
Entry
percent of payroll 5.6% in 2024 fluctuating down to 3.9%
50 to 75 6.15% net of plan investment expenses
inflation
Contributions as a percentage of covered payroll
Age Normal Level
by 2076
and including
2017 CalPERS Experience study; Improvement using MacLeod Watts Scale
See Notes Required to Supplementary Information. 103
2020 2019 2018 1,112,086 $ 1,103,345 $ 957,045 $ (1,104,427) (814,699) (966,887) 7,659 $ 288,646 $ (9,842) $ 46,420,079 $ 44,034,470 $ 36,149,553 $ 2.40% 2.51% 2.65% See Notes Required to Supplementary Information. 104
Budgetary Comparison Schedule General
For the Year Ended June 30, 2023
(331,921)
CITY OF DOWNEY
Variance with Final Budget Budget AmountsActualPositive OriginalFinalAmounts(Negative) Budgetary Fund Balance, July 153,462,132 $ 53,462,132 $ 53,462,132 $ - $ Revenues Taxes: Property33,578,037 33,578,037 34,554,878 976,841 Transient occupancy2,150,000 2,150,000 2,236,398 86,398 Sales28,127,214 28,127,214 27,088,508 (1,038,706) Franchise and other17,753,510 17,753,510 22,478,932 4,725,422 Licenses and permits1,623,800 1,623,800 2,069,704 445,904 Intergovernmental1,110,070 1,140,070 1,236,812 96,742 Charges for services11,792,561 11,792,561 14,270,680 2,478,119 Use of money and property1,849,695 1,849,695 3,809,090 1,959,395 Fines and forfeitures1,560,700 1,560,700 1,769,337 208,637 Miscellaneous2,722,830 2,722,830 3,787,524 1,064,694 Transfers In5,672,799 5,372,799 4,369,776 (1,003,023) Subscriptions financing- - 139,116 139,116 Total Revenues161,403,348 161,133,348 171,272,887 10,139,539 Expenditures General Government: General Government Administration1,106,716 1,106,716 1,019,851 86,865 City Council 377,984 377,984 338,508 39,476 City Attorney 225,969 225,969 808,555 (582,586) City Clerk863,974 863,974 1,600,017 (736,043) City Manager1,440,929 1,440,929 1,092,540 348,389 Human Resources 1,621,750 1,621,750 1,593,358 28,392 Finance 7,731,356 7,731,356 981,180 6,750,176 Total General Government 13,368,678 13,368,678 7,434,009 5,934,669 Public Safety: Police 41,843,060 41,843,060 42,993,227 (1,150,167) Fire 26,077,771 26,077,771 27,942,016 (1,864,245) Total Public Safety 67,920,831 67,920,831 70,935,243 (3,014,412) Public Works: Public Works Administration 923,005 923,005 892,993 30,012 Engineering 1,921,459 1,921,459 1,359,047 562,412 Maintenance 4,656,089 4,656,089 6,188,498 (1,532,409) Utilities 2,680,820 2,695,262 2,935,778 (240,516) Total Public Works 10,181,373 10,195,815 11,376,316 (1,180,501) Community Development: Building and Safety 1,280,511 1,280,511 1,441,154 (160,643) Code Enforcement 1,336,956 1,336,956 1,316,382 20,574 Planning 2,714,430 2,714,430 1,245,652 1,468,778 Total Community Development 5,331,897 5,331,897 4,003,188 1,328,709 Community Services: Recreation Department 9,327,520 9,357,520 9,913,461 (555,941) Total Community Services 9,327,520 9,357,520 9,913,461 (555,941) Capital Outlay 245,526 245,526 577,447
Debt service: Principal retirement - - 93,153 (93,153) Total Debt Service - - 93,153 (93,153) Total Expenditures 106,375,825 106,420,267 104,332,817 2,087,450 Other Financing Uses: Transfers out 10,240,819 10,526,817 19,692,982 (9,166,165) Total Financing Uses 10,240,819 10,526,817 19,692,982
Budgetary
June 30 44,786,704 $ 44,186,264 $ 47,247,088 $ 3,060,824 $
Fund
(9,166,165)
Fund Balance,
See Notes to Required Supplementary Information. 105
Budgetary Comparison Schedule
Housing Authority
For the Year Ended June 30, 2023
Fund Balance, July
Revenues
Fund Balance, June 30
CITY OF DOWNEY
Variance with Final Budget Budget Amounts Actual Positive Original Final Amounts(Negative) Budgetary
13,669,416 $ 3,669,416 $ 3,669,416 $ - $
Use of money and property 14,000 14,000 290,405 276,405 Miscellaneous50,000 50,000 144,726 94,726 Total
3,733,416 4,104,547 371,131 Expenditures Economic Dev & Housing 82,000 82,000 80 81,920 Total Expenditures 82,000 82,000 80 81,920 Budgetary
3,651,416 $ 3,651,416 $ 4,104,467 $ 453,051 $
Revenues3,733,416
See Notes to Required Supplementary Information. 106
CIP Grant Fund
For the Year Ended June 30, 2023
CITY OF DOWNEY
Budgetary Comparison Schedule
Variance with Final Budget Budget Amounts Actual Positive Original Final Amounts(Negative) Budgetary Fund Deficit, July 1(4,390,082) $ (4,390,082) $ (4,390,082) $ - $ Revenues Intergovernmental 23,883,321 26,248,738 3,540,014 (22,708,724) Total Revenues 19,493,239 21,858,656 (850,068) (22,708,724) Expenditures Capital outlay 23,883,321 26,248,738 1,431,800 24,816,938 Total Expenditures 23,883,321 26,248,738 1,431,800 24,816,938 Budgetary
Deficit, June 30 (4,390,082) $ (4,390,082) $ (2,281,868) $
$
Fund
2,108,214
See Notes to Required Supplementary Information. 107
Budgetary Comparison Schedule
COVID-19 Grants
For the Year Ended June 30, 2023
Budgetary Fund Balance, June 30
CITY OF DOWNEY
Variance with Final Budget Budget Amounts Actual Positive Original Final Amounts(Negative) Budgetary
July 1(36,437) $ (36,437) $ (36,437) $ - $
Intergovernmental- - 361,511 361,511 Use of money and property - - 199,862 199,862 Total Revenues(36,437) (36,437) 524,936 561,373
General government - - 28,728 (28,728) Public safety - 409,656 146,973 262,683 Community development - - 9,477 (9,477) Parks and recreation- - 61,474 (61,474) Public works- - 56,972 (56,972) Transfers out- - 5,024 (5,024) Total Expenditures- 409,656 308,648 101,008
Fund Deficit,
Revenues
Expenditures
(36,437) $ (446,093) $ 216,288 $ 662,381 $
See Notes to Required Supplementary Information. 108
Notes to Required Supplementary Information
For the Year Ended June 30, 2023
NOTE 1: BUDGETARY DATA
General Budget Policies
The City is required by its charter to adopt an annual budget on or before June 30th for the ensuing fiscal year. From the effective date of the budget, the proposed expenditures become appropriations to the various City departments. This “appropriated budget” covers substantially all City expenditures, with the exception of debt service on bonds, which expenditures constitute legally authorized “non-appropriated budget.” There are no significant non-budgeted activities. The City Council passes various amendments to the budget during the year.
The City prepares its budgets on the basis of actual expenditures and, accordingly, the budget amounts included in the accompanying financial statements are presented on a basis substantially consistent with generally accepted accounting principles. The level of budgetary control is the department level, classified in accordance with Note 1D, within the fund. However, the City Manager is authorized to transfer amounts between divisions within a department without seeking City Council approval.
The LSTA Grant, Asset Forfeiture-State, and Debt Service funds did not adopt budgets for fiscal year 2022-23 and therefore budgetary information is not presented.
Expenditures in Excess of Appropriations
The following funds reported expenditures in excess of appropriations:
The following departments/funds reported expenditures in excess of appropriations:
CITY OF DOWNEY
Other
Revenue Funds: Hazardous Material3,779 $ CDBG 208,143 Gas Tax266,335 Measure S102,011 Art in Public Places32,094 Major Fund: General Fund City Attorney (582,586) $ City Clerk (736,043) Police (1,150,167) Fire (1,864,245) Maintenance (1,532,409) Utilities (240,516) Building and Safety (160,643) Recreation Department (639,879) (6,906,488) $ 109
Governmental Funds - Other Special
OTHER SPECIAL REVENUE FUNDS
(CONTINUED)
Measure S Sales Tax Fund is used to account for debt related transactions for debt secured by the Measure S half cent sales tax revenues. This includes the debt service for the 2017 Lease Revenue Bonds and various lease payments made for the acquisition of Public Safety equipment and vehicles.
Transit Measure M Fund This revenue is derived from a County voter approved sales tax to meet the transportation needs of the County of Los Angeles. The expenditures for this fund must be related to the transportation projects and programs, such as roadway repairs, traffic signal synchronization and pedestrian walkways and paths, Measure M increases to 1% once Measure R expires in 2039.
Asset Forfeiture - State Fund is used to account for all revenues and expenditures related to the state asset forfeiture program.
Measure W -Sewer & Storm Drain Fund This revenue is derived from a County voter approved parcel tax to provide funding for projects to improve sewer and storm drain filtration.
Art in Public Places Fund is used to account for revenues and expenditures for the original artworks that are accessible to the public throughout the City.
Measure M Bond 2021A Fund is used to track the issuances of new bonds to be used to finance street projects funded by Measure M and Measure R sales tax revenues.
Measure R Bond 2021A Fund is used to track the issuances of new bonds to be used to finance street projects funded by Measure M and Measure R sales tax revenues.
CAPITAL PROJECTS FUND
City Capital Project Fund is used to account for City projects funded by various sources.
DEBT SERVICE FUND
Debt Service Fund is used to account for the Pension obligation bonds.
112
THIS PAGE INTENTIONALLY LEFT BLANK
113
Sheet
Governmental Funds
CITY
Nonmajor
Assets: Pooled cash and investments32,303 $ 1,181,243 $ 647,120 $ 9,248 $ Receivables: Accounts49,555 - -Taxes - 55,435 -Notes and loans- - 4,760,446Prepaid costs- - -Due from other governments- - 123,755 1,415 Inventories- - -Restricted assets: Cash and investments with fiscal agents- - -Total Assets81,858 $ 1,236,678 $ 5,531,321 $ 10,663 $ Liabilities, Deferred
of Resources, and Fund Balances
Liabilities: Accounts payable12,376 $ 216,663 $ 44,892 $ 2,006 $ Accrued liabilities 43,816 1,943 1,019 9,630 Unearned revenues - - -Due to other governments - - 5,365Due to other funds - - -Total Liabilities 56,192 218,606 51,276 11,636 Deferred Inflows of Resources: Unavailable revenues - - 4,760,446Total Deferred Inflows of Resources - - 4,760,446Fund Balances: Nonspendable - - -Restricted 25,666 1,018,072 719,599Assigned - - -Unassigned - - - (973) Total Fund Balances (Deficit) 25,666 1,018,072 719,599 (973) Total Liabilities, Deferred Inflows of Resources, and Fund Balances (Deficit) 81,858 $ 1,236,678 $ 5,531,321 $ 10,663 $ Waste Reduction Street Lighting HOME Hazardous Material June 30,
Special Revenue Funds 114
OF DOWNEY Combining Balance
Inflows
(Deficit):
2023
Combining Balance Sheet
Nonmajor Governmental Funds
June 30, 2023 (CONTINUED)
Assets:
Pooled cash and investments
Receivables: Accounts Taxes
Notes and loans
Prepaid costs
Due from other governments
Inventories
Restricted assets: Cash and investments with fiscal agents
Total Assets
Liabilities, Deferred Inflows of Resources, and Fund Balances (Deficit): Liabilities: Accounts payable
Accrued liabilities
Unearned revenues
Due to other governments
Due to other funds
Total Liabilities
Deferred Inflows of Resources:
Unavailable revenues
Total Deferred Inflows of Resources
Fund Balances:
Total Fund Balances (Deficit)
Total Liabilities, Deferred Inflows of Resources, and Fund Balances (Deficit)
CITY OF DOWNEY
Restricted Assigned
Nonspendable
Unassigned
1,168,171 $ 382,184 $ 118,721 $ - $ - - 132,942- - -- - - 371,291 - - 9,53631,002 37,548 18,316 1,034,225 - - 14,247- - - 949,900 1,199,173 $ 419,732 $ 293,762 $ 2,355,416 $ - $ 1,060 $ 52,643 $ 151,884 $ - 9,595 30,429 37,796 - - 143,699- - -- - 78,688 918,708 - 10,655 305,459 1,108,388 - - 2,229 371,291 - - 2,229 371,291 - - 9,5361,199,173 409,077 - 875,737 - - -- - (23,462)1,199,173 409,077 (13,926) 875,737 1,199,173 $ 419,732 $ 293,762 $ 2,355,416 $ CATV
Air
CDBG Special
115
Public Access
Quality Grants
Revenue Funds
Combining Balance Sheet
Nonmajor Governmental Funds
June 30, 2023
Assets:
Pooled cash and investments
Receivables: Accounts Taxes
Notes and loans
Prepaid costs
Due from other governments
Inventories
Restricted assets: Cash and investments with fiscal agents
Total Assets
Liabilities, Deferred Inflows of Resources, and Fund Balances (Deficit):
Liabilities: Accounts payable
Accrued liabilities
Unearned revenues
Due to other governments
Due to other funds
Total Liabilities
Deferred Inflows of Resources:
Unavailable revenues Total Deferred Inflows of Resources
Total Fund Balances (Deficit) Total Liabilities, Deferred Inflows of Resources, and Fund Balances (Deficit)
CITY OF DOWNEY
Fund Balances: Nonspendable Restricted Assigned Unassigned
21,218 $ 2,930,015 $ 5,085,229 $ 2,017,206 $ - 317,697 137,937- - -- - -- - -- 21,000 -- - -- - -21,218 $ 3,268,712 $ 5,223,166 $ 2,017,206 $ 4,572 $ 32,858 $ 155,467 $ 23,566 $ 13,185 5,150 70,923 35,336 3,137 - -- - -- - -20,894 38,008 226,390 58,902 - 21,000 -- 21,000 -- - -324 3,209,704 4,996,776 1,958,304 - - -- - -324 3,209,704 4,996,776 1,958,304 21,218 $ 3,268,712 $ 5,223,166 $ 2,017,206 $ Transit Prop A Transit Measure R Asset Forfeiture Transit Prop C Special Revenue Funds 116
Combining Balance Sheet
Nonmajor Governmental Funds
June 30, 2023 (CONTINUED)
Assets:
Pooled cash and investments
Receivables: Accounts Taxes
Notes and loans
Prepaid costs
Due from other governments
Inventories
Restricted assets: Cash and investments with fiscal agents
Total Assets
Liabilities, Deferred Inflows of Resources, and Fund Balances (Deficit):
Liabilities: Accounts payable
Accrued liabilities
Unearned revenues
Due to other governments
Due to other funds
Total Liabilities
Deferred
Total Fund Balances (Deficit)
Total Liabilities, Deferred Inflows of Resources, and Fund Balances (Deficit)
CITY OF DOWNEY
Resources Fund Balances: Nonspendable Restricted Assigned Unassigned
Inflows of Resources: Unavailable revenues Total Deferred Inflows of
- $ 384 $ - $ 3,752,089 $ 12,735 - -249,663 - - 445,627 - - -- - 2,190,660- - -- - -- - -262,398 $ 384 $ 2,190,660 $ 4,197,716 $ 896 $ - $ - $ 17,545 $ 6,985 - - 2,687 - - -- - -553,783 - -561,664 - - 20,232 - - -- - -- - 2,190,660- 384 - 4,177,484 - - -(299,266) - -(299,266) 384 2,190,660 4,177,484 262,398 $ 384 $ 2,190,660 $ 4,197,716 $ Gas Tax LSTA Grant Measure S 2017 LRB SB1 Transportation Special Revenue Funds 117
Combining Balance Sheet
Nonmajor Governmental Funds
June 30, 2023
Assets:
Pooled cash and investments
Receivables: Accounts Taxes
Notes and loans
Prepaid costs
Due from other governments
Inventories
Restricted assets: Cash and investments with fiscal agents
Total Assets
Liabilities, Deferred Inflows of Resources, and Fund Balances (Deficit):
Liabilities: Accounts payable
Accrued liabilities
Unearned revenues
Due to other governments
Due to other funds
Total Liabilities
Deferred Inflows of Resources:
Unavailable revenues Total Deferred Inflows of Resources Fund Balances:
Total Fund Balances (Deficit)
Total Liabilities, Deferred Inflows of Resources, and Fund Balances (Deficit)
CITY OF DOWNEY
Nonspendable Restricted Assigned Unassigned
2,823,655 $ 2,687,923 $ 50,485 $ 5,269,788 $ - - -- - -- - -- - -- - -- - -702 - -2,824,357 $ 2,687,923 $ 50,485 $ 5,269,788 $ 35,938 $ 27,397 $ - $ 23,458 $ 132,649 45,637 -- - - 322,076 - - -- - -168,587 73,034 - 345,534 - - -- - -- - -- 2,614,889 50,485 4,924,254 2,655,770 - -- - -2,655,770 2,614,889 50,485
2,824,357 $ 2,687,923 $ 50,485 $ 5,269,788 $ Measure S (Sales Tax) Transit Measure M Asset ForfeitureState Measure WSewer & Storm Drain Special Revenue Funds 118
4,924,254
Combining Balance Sheet
Nonmajor Governmental Funds
June 30, 2023
Assets:
Pooled cash and investments
Receivables: Accounts Taxes
Notes and loans
Prepaid costs
Due from other governments
Inventories
Restricted assets: Cash and investments with fiscal agents
Total Assets
Liabilities, Deferred Inflows of Resources, and Fund Balances (Deficit): Liabilities: Accounts payable
Accrued liabilities
Unearned revenues
Due to other governments
Due to other funds
Total Liabilities
Deferred Inflows of Resources:
Unavailable revenues Total Deferred Inflows of Resources Fund Balances:
Total Fund Balances (Deficit) Total Liabilities, Deferred Inflows of Resources, and Fund Balances (Deficit)
CITY OF DOWNEY
Nonspendable Restricted Assigned Unassigned
Capital Projects Funds 371,360 $ - $ - $ 12,188,743 $ - - -- - -- - -- - -- - - 510,318 - - -- 5,443,452 4,159,195371,360 $ 5,443,452 $ 4,159,195 $ 12,699,061 $ - $ 952,775 $ 156,724 $ 317,475 $ - 2,571 1,621 1,945 - - -- - -- 1,281,405 177,737- 2,236,751 336,082 319,420 - - -- - -- - -371,360 3,206,701 3,823,113- - - 12,379,641 - - -371,360 3,206,701 3,823,113 12,379,641 371,360 $ 5,443,452 $ 4,159,195 $ 12,699,061 $ City Capital Projects Measure M Bond 2021A Measure R Bond 2021B Art In Public Places Special Revenue Funds 119
(CONTINUED)
Combining Balance Sheet
Nonmajor Governmental Funds
Assets:
Pooled cash and investments
Receivables: Accounts Taxes
Notes and loans
Prepaid costs
Due from other governments
Inventories
Restricted assets: Cash and investments with fiscal agents
Total Assets
Liabilities, Deferred Inflows of Resources, and Fund Balances (Deficit): Liabilities: Accounts payable
Accrued liabilities
Unearned revenues
Due to other governments
Due to other funds
Total Liabilities
Deferred Inflows of Resources: Unavailable revenues
Total Deferred Inflows of Resources
Fund Balances: Nonspendable Restricted Assigned Unassigned
Total Fund Balances (Deficit)
June 30, 2023 Debt Service Funds Total Nonmajor Governmental Funds - $ 40,737,085 $ - 650,866 - 750,725 - 5,131,737 - 2,200,196 - 1,777,579 - 14,247 250,404 10,803,653 250,404 $ 62,066,088 $ - $ 2,230,195 $ 259,123 712,040 - 468,912 - 5,365 - 3,010,321 259,123 6,426,833 - 5,154,966 - 5,154,966 - 2,200,196 - 33,581,102 - 15,035,411 (8,719) (332,420) (8,719) 50,484,289 250,404 $ 62,066,088 $ Debt Service
Total Liabilities, Deferred Inflows of Resources, and Fund Balances (Deficit)
DOWNEY
CITY OF
120
Combining Statement of Revenues, Expenditures and Changes in Fund Balances Nonmajor Governmental Funds
For the Year Ending June 30, 2023
CITY OF DOWNEY
Revenues: Taxes$ 1,449,466 $ - $ - $ Intergovernmental17,242 - 339,078Charges for services422,589 1,691,285 - 177,806 Use of money and property (72) 2,916 8,380Fines and forfeitures - - -Settlement - - -Developer participation - - -Miscellaneous - 10,536 -Total Revenues 439,759 3,154,203 347,458 177,806 Expenditures: Current: General government - - -Public safety - - - 214,297 Community development - - 560,522Community services - - -Public works 552,121 2,333,804 -Capital outlay - - -Debt service: Principal retirement - - -Interest and fiscal charges - - -Total Expenditures 552,121 2,333,804 560,522 214,297 Excess (Deficiency) of Revenues Over (Under) Expenditures (112,362) 820,399 (213,064) (36,491) Other Financing Sources (Uses): Transfers in 138,000 - - 35,518 Transfers out - - -Leases financing - - -Total Other Financing Sources (Uses) 138,000 - - 35,518 Net Change in Fund Balances 25,638 820,399 (213,064) (973) Fund Balances (Deficit), Beginning of Year 28 197,673 932,663Restatements - - -Fund Balances, Beginning of Year, as Restated 28 197,673 932,663Fund Balances (Deficit), End of Year 25,666 $ 1,018,072 $ 719,599 $ (973) $ Waste ReductionStreet LightingHOME Hazardous Material
Special Revenue Funds 121
CITY OF DOWNEY
Combining Statement of Revenues, Expenditures and Changes in Fund Balances
Nonmajor Governmental Funds
Revenues: Taxes
Intergovernmental Charges for services
Use of money and property Fines and forfeitures
Settlement
Developer participation
Miscellaneous
Total Revenues
Expenditures: Current: General government Public safety Community development Community services
Public works
Capital outlay
Debt service: Principal retirement Interest and fiscal charges
Total Expenditures
Excess (Deficiency) of Revenues Over (Under) Expenditures
Other Financing Sources (Uses): Transfers in Transfers out Leases financing
Total Other Financing Sources (Uses)
Net Change in Fund Balances
Fund Balances (Deficit), Beginning of Year Restatements
Fund Balances, Beginning of Year, as Restated Fund Balances (Deficit), End of Year For the Year Ending June 30, 2023
Special Revenue Funds
(CONTINUED) 131,664 $ - $ - $ - $ - 148,617 304,089 1,218,605 - - 180,418- 5,092 542- - -- - -- - -- - 51,824131,664 153,709 536,873 1,218,605 - - -- - 251,936- - 1,521,776 737,195 - - -- 141,419 -- 9,070 35,830- - - 353,000 - - - 105,611 - 150,489 1,809,542 1,195,806 131,664 3,220 (1,272,669) 22,799 - - 1,371,051- - - (26,907) - - -- - 1,371,051 (26,907) 131,664 3,220 98,382 (4,108) 1,067,509 405,857 (112,308) 879,845 - - -1,067,509 405,857 (112,308) 879,845 1,199,173 $ 409,077 $ (13,926) $ 875,737
$
CATV Public Access Air Quality Grants CDBG
122
CITY OF DOWNEY
Combining Statement of Revenues, Expenditures and Changes in Fund Balances
Nonmajor Governmental Funds
Revenues: Taxes
Intergovernmental Charges for services
Use of money and property
Fines and forfeitures
Settlement
Developer participation
Miscellaneous
Total Revenues
Expenditures:
Current: General government Public safety Community development Community services
Public works
Capital outlay
Debt service: Principal retirement Interest and fiscal charges
Total Expenditures
Excess (Deficiency) of Revenues Over (Under) Expenditures
Other Financing Sources (Uses): Transfers in Transfers out Leases financing
Total Other Financing Sources (Uses)
Net Change in Fund Balances
Fund Balances (Deficit), Beginning of Year Restatements
Fund Balances, Beginning of Year, as Restated Fund Balances (Deficit), End of Year For the Year Ending June 30, 2023
Special Revenue Funds
- $ 2,429,333 $ 2,928,772 $ - $ - - -- - -277 22,423 41,850 20,862 - - -- - -- - - 1,821,475 - - 550,347277 2,451,756 3,520,969 1,842,337 - - -- - -- - -- - 992,410- 17,500 307,977 14,433 - 50,029 1,083,371 550,131 - - 300,219 460,000 - - 70,737 373,698 - 67,529 2,754,714 1,398,262 277 2,384,227 766,255 444,075 - 31,006 1,191,719 12,066 - (1,000,000) -- - -- (968,994) 1,191,719 12,066 277 1,415,233 1,957,974 456,141 47 1,794,471 3,038,802 1,502,163 - - -47 1,794,471 3,038,802 1,502,163 324 $ 3,209,704 $ 4,996,776 $ 1,958,304 $ Transit Prop A Transit Measure R Asset ForfeitureTransit Prop C
123
CITY OF DOWNEY
Combining Statement of Revenues, Expenditures and Changes in Fund Balances
Nonmajor Governmental Funds
Revenues: Taxes
Intergovernmental Charges for services
Use of money and property Fines and forfeitures
Settlement
Developer participation
Miscellaneous
Total Revenues
Expenditures:
Current:
General government Public safety Community development Community services
Public works
Capital outlay
Debt service: Principal retirement Interest and fiscal charges
Total Expenditures
Excess (Deficiency) of Revenues Over (Under) Expenditures
Other Financing Sources (Uses): Transfers in Transfers out Leases financing
Total Other Financing Sources (Uses)
Net Change in Fund Balances
Fund Balances (Deficit), Beginning of Year Restatements
Fund Balances, Beginning of Year, as Restated Fund Balances (Deficit), End of Year For the Year Ending June 30, 2023
Special Revenue Funds
(CONTINUED) - $ - $ - $
2,848,542 - -- - -- 5 - 16,923 - - -- - -- - -- - -2,848,542 5 - 2,560,026 - - 2,250- - -- - -- - -26,760 - -106,465 - 141,760 419,567 - - -- - -133,225 - 144,010 419,567 2,715,317 5 (144,010) 2,140,459 587,000 - 2,838,997(2,794,499) - -- - -(2,207,499) - 2,838,997507,818 5 2,694,987 2,140,459 (807,084) 379 (504,327) 2,037,025 - - -(807,084) 379 (504,327) 2,037,025 (299,266) $ 384 $ 2,190,660 $ 4,177,484 $ Gas TaxLSTA Grant Measure S 2017 LRB SB1 Transportation
124
2,543,103 $
CITY OF DOWNEY
Combining Statement of Revenues, Expenditures and Changes in Fund Balances
Nonmajor Governmental Funds
Revenues: Taxes
Intergovernmental Charges for services
Use of money and property Fines and forfeitures
Settlement
Developer participation
Miscellaneous
Total Revenues
Expenditures: Current:
General government Public safety Community development Community services Public works Capital outlay
Debt service: Principal retirement Interest and fiscal charges
Total Expenditures
Excess (Deficiency) of Revenues Over (Under) Expenditures
Other Financing Sources (Uses): Transfers in Transfers out Leases financing
Total Other Financing Sources (Uses)
Net Change in Fund Balances
Fund Balances (Deficit), Beginning of Year Restatements
Fund Balances, Beginning of Year, as Restated
Fund Balances (Deficit), End of Year For the Year Ending June 30, 2023
4,181,989 $ 2,060,477 $ - $ 1,435,794 $ - - 49,710- - -41,720 32,623 775 12,624 - - -- - -
- - -- 468 -4,223,709 2,093,568 50,485 3,924,338 - - -916,356 - -- - -- - -- 83,927 - 151,941 518,476 471,705 - 475,853 2,128,767 470,000 -1,629,600 553,990 -5,193,199 1,579,622 - 627,794 (969,490) 513,946 50,485 3,296,544 - - -(650,000) - -417,693 - -(232,307) - -(1,201,797) 513,946 50,485 3,296,544 3,857,567 2,322,500 - 1,949,786 - (221,557) -
3,857,567 2,100,943 - 1,627,710 2,655,770 $ 2,614,889 $ 50,485 $
Measure S
Transit Measure M Asset ForfeitureState Measure WSewer & Storm Drain Special
125
2,475,920
(322,076)
4,924,254 $
(Sales Tax)
Revenue Funds
Combining Statement of Revenues, Expenditures and Changes in Fund Balances
Nonmajor Governmental Funds
Revenues: Taxes
Intergovernmental Charges for services
Use of money and property
Fines and forfeitures
Settlement
Developer participation
Miscellaneous
Total Revenues
Expenditures:
Current: General government Public safety Community development Community services
Public works Capital outlay
Debt service: Principal retirement Interest and fiscal charges
Total Expenditures
Excess (Deficiency) of Revenues Over (Under) Expenditures
Other Financing Sources (Uses): Transfers in Transfers out Leases financing
Total Other Financing Sources (Uses)
Net Change in Fund Balances
Fund Balances (Deficit), Beginning of Year Restatements
Fund Balances, Beginning of Year, as Restated Fund Balances (Deficit), End of Year For the Year Ending June 30, 2023
Special Revenue Funds
(587,000)
CITY OF DOWNEY
(CONTINUED) Capital Projects Funds - $ - $ - $ - $ - - -- - - 4,764 - 575 344 3,319 - - - 1,864,232 - - -- - -86,517 - -86,517 575 344 1,872,315 - - -- - -- - -- - -32,094 - 139,118 16,347 - 10,638,916 3,638,402 1,006,467 - - -- - -32,094 10,638,916 3,777,520 1,022,814 54,423 (10,638,341) (3,777,176) 849,501 - - -
- - -
- - -- - - 6,977,914 54,423 (10,638,341) (3,777,176) 7,827,415 316,937 13,845,042 7,600,289 4,552,226 - - -316,937 13,845,042 7,600,289 4,552,226 371,360 $ 3,206,701 $ 3,823,113 $
Measure
2021A
2021B
7,564,914
12,379,641 $ City Capital Projects
M Bond
Measure R Bond
Art In Public Places
126
Combining Statement of Revenues, Expenditures and Changes in Fund Balances Nonmajor Governmental Funds
Revenues: Taxes
Intergovernmental Charges for services
Use of money and property Fines and forfeitures
Settlement
Developer participation
Miscellaneous
Total Revenues
Expenditures:
Current:
General government Public safety Community development Community services
Public works Capital outlay
Debt service: Principal retirement Interest and fiscal charges
Total Expenditures
Excess (Deficiency) of Revenues Over (Under) Expenditures
Other Financing Sources (Uses): Transfers in Transfers out Leases financing
Total Other Financing Sources (Uses) Net Change in Fund Balances
Fund Balances (Deficit), Beginning of Year Restatements
Fund Balances, Beginning of Year, as Restated Fund Balances (Deficit), End of Year For the Year Ending June 30, 2023 Debt Service Funds Total Nonmajor Governmental Funds - $ 17,160,598 $ - 4,925,883 - 2,476,862 190,032 401,210 - 1,864,232 - 2,475,920 - 1,821,475 - 699,692 190,032 31,825,872 - 2,250 - 1,382,589 - 2,819,493 - 992,410 - 3,817,441 - 19,146,042 4,482,378 8,194,364 3,226,084 5,959,720 7,708,462 42,314,309 (7,518,430) (10,488,437) 7,509,711 21,279,982 - (5,058,406) - 417,693 7,509,711 16,639,269 (8,719) 6,150,832 - 44,877,090 - (543,633) - 44,333,457 (8,719) $ 50,484,289 $
Debt Service
CITY OF DOWNEY
127
the Year Ended June 30, 2023
Waste
Variance with Final Budget Budget Amounts Actual Positive Original Final Amounts(Negative) Budgetary Fund Deficit, July 128 $ 28 $ 28 $ - $ Revenues Intergovernmental60,000 60,000 17,242 (42,758) Charges for services422,000 422,000 422,589 589 Use of money and property - - (72) (72) Transfers in138,000 138,000 138,000Total Revenues620,028 620,028 577,787 (42,241) Expenditures Public works595,090 595,090 552,121 42,969 Total Expenditures595,090 595,090 552,121 42,969 Budgetary Fund Balance, June 30 24,938 $ 24,938 $ 25,666 $ 728 $
128
CITY OF DOWNEY Budgetary Comparison Schedule
Reduction
For
Budgetary Comparison Schedule
For the Year Ended June 30, 2023
Budgetary Fund Balance, June 30
CITY OF DOWNEY
Street
Variance with Final Budget Budget Amounts Actual Positive Original Final Amounts(Negative) Budgetary Fund Balance, July 1197,673 $ 197,673 $ 197,673 $ - $ Revenues Taxes573,000 573,000 1,449,466 876,466 Charges for services 1,501,600 1,501,600 1,691,285 189,685 Use of money and property 2,500 2,500 2,916 416 Miscellaneous1,000 1,000 10,536 9,536 Total Revenues2,275,773 2,275,773 3,351,876 1,076,103 Expenditures Public works2,206,243 2,206,243 2,333,804 (127,561) Capital outlay 400,000 400,000 - 400,000 Total Expenditures2,606,243 2,606,243 2,333,804 272,439
Lighting
(330,470) $ (330,470) $ 1,018,072 $ 1,348,542 $
129
Budgetary Comparison Schedule
For the Year Ended June 30, 2023
Revenues
Expenditures
CITY OF DOWNEY
Variance with Final Budget Budget Amounts Actual Positive Original Final Amounts(Negative) Budgetary
1932,663 $ 932,663 $ 932,663 $ - $
Intergovernmental426,788 426,788 339,078 (87,710) Use of money and property - - 8,380 8,380 Total Revenues1,359,451 1,359,451 1,280,121 (79,330)
Economic Dev & Housing686,138 686,138 560,522 125,616 Total Expenditures686,138 686,138 560,522 125,616 Budgetary
30 673,313 $ 673,313 $ 719,599 $ 46,286 $
130
Home
Fund Balance, July
Fund Balance, June
the Year Ended June 30, 2023
Hazardous
Variance with Final Budget Budget AmountsActualPositive OriginalFinalAmounts(Negative) Budgetary Fund Deficit, July 1$ - $ - $ - $ Revenues Charges for services175,000 175,000 177,806 2,806 Transfers in35,518 35,518 35,518Total Revenues210,518 210,518 213,324 2,806 Expenditures Public safety 210,518 210,518 214,297 (3,779) Total Expenditures210,518 210,518 214,297 (3,779) Budgetary Fund Balance (Deficit), June 30 - $ - $ (973) $ (973) $
131
CITY OF DOWNEY Budgetary Comparison Schedule
Material
For
Budgetary Comparison Schedule
For the Year Ended June 30, 2023
CITY OF DOWNEY
Variance with Final Budget Budget Amounts Actual Positive Original Final Amounts(Negative) Budgetary Fund Balance, July 11,067,509 $ 1,067,509 $ 1,067,509 $ - $ Revenues Taxes 150,000 150,000 131,664 18,336 Total Revenues 1,217,509 1,217,509 1,199,173 18,336 Budgetary Fund Balance, June 30 1,217,509 $ 1,217,509 $ 1,199,173 $ 18,336 $
CATV Public Access
132
Budgetary Comparison Schedule
For the Year Ended June 30, 2023
Revenues
Budgetary Fund Balance, June 30
CITY OF DOWNEY
Variance with Final Budget Budget Amounts Actual Positive Original Final Amounts(Negative) Budgetary
1405,857 $ 405,857 $ 405,857 $ - $
Intergovernmental145,000 145,000 148,617 3,617 Use of money and property 2,500 2,500 5,092 2,592 Total Revenues553,357 553,357 559,566 6,209
Public works 133,545 133,545 141,419 (7,874) Capital outlay 180,000 180,000 9,070 170,930 Total Expenditures313,545 313,545 150,489 163,056
239,812
239,812 $ 409,077 $ 169,265 $
Air Quality
Fund Balance, July
Expenditures
$
133
Budgetary Comparison Schedule Grants
For the Year Ended June 30, 2023
CITY OF DOWNEY
Variance with Final Budget Budget Amounts Actual Positive Original Final Amounts(Negative) Budgetary
1(112,308) $ (112,308) $ (112,308) $ - $
Intergovernmental310,000 1,195,800 304,089 (891,711) Charges for services 122,200 122,200 180,418 58,218 Use of money and property - - 542 542 Miscellaneous30,600 30,600 51,824 21,224 Transfers in1,352,301 1,371,051 1,371,051Total revenues1,702,793 2,607,343 1,795,616 (811,727) Expenditures Public safety - 730,000 251,936 478,064 Community development 1,462,547 1,537,547 1,521,776 15,771 Capital outlay 7,990 407,540 35,830 371,710 Total expenditures1,470,537 2,675,087 1,809,542 865,545 Budgetary Fund Deficit, June 30 232,256 $ (67,744) $ (13,926) $ 53,818 $
134
Fund Deficit, July
Revenues
Budgetary Comparison Schedule CDBG
For the Year Ended June 30, 2023
(208,143) Budgetary Fund Balance, June 30
CITY OF DOWNEY
Variance with Final Budget Budget Amounts Actual Positive Original Final Amounts(Negative) Budgetary Fund
July 1879,845 $ 879,845 $ 879,845 $ - $
Intergovernmental1,038,156 1,038,156 1,218,605 180,449 Total Revenues 1,918,001 1,918,001 2,098,450 180,449 Expenditures Community development 557,162 557,162 737,195 (180,033) Debt service: Principal retirement 353,000 353,000 353,000Interest and fiscal charges 104,408 104,408 105,611 (1,203) Transfers out- - 26,907 (26,907) Total Expenditures1,014,570 1,014,570 1,222,713
903,431 $ 903,431 $ 875,737 $ (27,694) $
Balance,
Revenues
135
Budgetary Comparison Schedule Asset Forfeiture
For the Year Ended June 30, 2023
CITY OF DOWNEY
Variance with Final Budget Budget Amounts Actual Positive Original Final Amounts(Negative) Budgetary Fund Balance, July 147 $ 47 $ 47 $ - $ Revenues Intergovernmental75,000 75,000 - (75,000) Use of money and property 500 500 277 (223) Transfers in395,000 395,000 - (395,000) Total Revenues470,547 470,547 324 (470,223) Charges to Appropriation
Public safety 289,140 289,140 - 289,140 Total Expenditures289,140 289,140 - 289,140 Budgetary Fund Balance, June 30 181,407 $ 181,407 $ 324 $ (181,083) $
136
(Outflow):
Budgetary Comparison Schedule Transit Prop C
CITY OF DOWNEY
Variance with Final Budget Budget Amounts Actual Positive Original Final Amounts(Negative) Budgetary Fund Balance, July 11,794,471 $ 1,794,471 $ 1,794,471 $ - $ Revenues Taxes2,254,851 2,254,851 2,429,333 174,482 Use of money and property 5,000 5,000 22,423 17,423 Transfers in- 31,006 31,006Total Revenues4,054,322 4,085,328 4,277,233 191,905 Expenditures Public works339,636 339,636 17,500 322,136 Capital outlay 1,850,000 1,850,000 50,029 1,799,971 Transfers out 1,000,000 1,000,000 1,000,000Total Expenditures 3,189,636 3,189,636 1,067,529 2,122,107 Budgetary Fund Balance, June 30 864,686 $ 895,692 $ 3,209,704 $ 2,314,012 $
137
For the Year Ended June 30, 2023
Budgetary Comparison Schedule
For the Year Ended June 30, 2023
CITY OF DOWNEY
Transit
Variance with Final Budget Budget Amounts Actual Positive Original Final Amounts(Negative) Budgetary Fund Balance, July 13,038,802 $ 3,038,802 $ 3,038,802 $ - $ Revenues Taxes2,718,412 2,718,412 2,928,772 210,360 Use of money and property 5,000 5,000 41,850 36,850 Miscellaneous10,000 10,000 550,347 540,347 Transfers in1,000,000 1,191,719 1,191,719Total Revenues 6,772,214 6,963,933 7,751,490 787,557 Expenditures Parks and recreation 1,543,819 1,543,819 992,410 551,409 Public works 357,040 357,040 307,977 49,063 Capital outlay 1,359,692 1,359,692 1,083,371 276,321 Debt service: Principal retirement 277,770 277,770 300,219 (22,449) Interest and fiscal charges 150,300 150,300 70,737 79,563 Total Expenditures3,688,621 3,688,621 2,754,714 933,907 Budgetary Fund Balance, June 30 3,083,593 $ 3,275,312 $ 4,996,776 $ 1,721,464 $
Prop A
138
Budgetary Comparison Schedule
Measure R
For the Year Ended June 30, 2023
CITY OF DOWNEY
Variance with Final Budget Budget Amounts Actual Positive Original Final Amounts(Negative) Budgetary Fund Balance, July 11,502,163 $ 1,502,163 $ 1,502,163 $ - $ Revenues Use of money and property 15,000 15,000 20,862 5,862 Developer participation1,691,138 1,691,138 1,821,475 130,337 Transfers in - 12,066 12,066Total Revenues 3,208,301 3,220,367 3,356,566 136,199 Expenditures Public works 354,910 354,910 14,433 340,477 Capital outlay 1,530,884 1,530,884 550,131 980,753 Debt service: Principal retirement 460,000 460,000 460,000Interest and fiscal charges 375,232 375,232 373,698 1,534 Total Expenditures2,721,026 2,721,026 1,398,262 1,322,764 Budgetary Fund Balance, June 30 487,275 $ 499,341 $ 1,958,304 $ 1,458,963 $
139
Transit
the Year Ended June 30, 2023
Gas Tax Variance with Final Budget Budget Amounts Actual Positive Original Final Amounts(Negative) Budgetary Fund Deficit, July 1(807,084) $ (807,084) $ (807,084) $ - $ Revenues Intergovernmental2,891,948 2,891,948 2,848,542 (43,406) Use of money and property 100 100 - (100) Transfers in587,000 587,000 587,000Total Revenues2,671,964 2,671,964 2,628,458 (43,506) Expenditures Public works 27,953 27,953 26,760 1,193 Capital outlay 110,637 110,637 106,465 4,172 Transfers out2,522,799 2,522,799 2,794,499 (271,700) Total Expenditures 2,661,389 2,661,389 2,927,724 (266,335) Budgetary Fund Deficit, June 30 10,575 $ 10,575 $ (299,266) $ (309,841) $
140
CITY OF DOWNEY Budgetary Comparison Schedule
For
Budgetary Comparison Schedule
Measure S 2017 LRB
For the Year Ended June 30, 2023
CITY OF DOWNEY
Variance with Final Budget Budget Amounts Actual Positive Original Final Amounts(Negative) Budgetary Fund Deficit, July 1(504,327) $ (504,327) $ (504,327) $ - $ Revenues Transfers in1,215,000 1,215,000 2,838,997 1,623,997 Total Revenues710,673 710,673 2,334,670 1,623,997 Expenditures General government - - 2,250 (2,250) Capital outlay 642,653 2,833,313 141,760 2,691,553 Total Expenditures642,653 2,833,313 144,010 2,689,303 Budgetary Fund Deficit, June 30 68,020 $ (2,122,640) $ 2,190,660 $ 4,313,300 $
141
Budgetary Comparison Schedule
SB1 Transportation
For the Year Ended June 30, 2023
CITY OF DOWNEY
Variance with Final Budget Budget Amounts Actual Positive Original Final Amounts(Negative) Budgetary Fund Balance, July 12,037,025 $ 2,037,025 $ 2,037,025 $ - $
Taxes 2,315,077 2,315,077 2,543,103 228,026 Use of money and property - - 16,923 16,923 Total Revenues4,352,102 4,352,102 4,597,051 244,949
Capital outlay 4,260,000 4,260,000 419,567 3,840,433 Total Expenditures4,260,000 4,260,000 419,567 3,840,433 Budgetary
92,102 $ 92,102 $ 4,177,484 $
$
142
Revenues
Expenditures
Fund Balance, June 30
4,085,382
Budgetary Comparison Schedule
Measure S (Sales Tax)
For the Year Ended June 30, 2023
CITY OF DOWNEY
Variance with Final Budget Budget Amounts Actual Positive Original Final Amounts(Negative) Budgetary Fund Balance, July 13,857,567 $ 3,857,567 $ 3,857,567 $ - $ Revenues Taxes 6,298,500 6,298,500 4,181,989
Use of money and property 25,000 25,000 41,720 16,720 Other financing sources - leases - - 417,693 417,693 Total Revenues10,181,067 10,181,067 8,498,969 (1,682,098) Expenditures Public safety 205,762 205,762 916,356 (710,594) Capital outlay 1,038,263 1,038,263 518,476 519,787 Debt service: Principal retirement 1,815,000 1,815,000 2,128,767
Interest and fiscal charges 1,637,163 1,637,163 1,629,600 7,563 Transfers out 1,345,000 1,045,000 650,000 395,000 Total Expenditures 6,041,188 5,741,188 5,843,199
Budgetary
30 4,139,879 $ 4,439,879 $ 2,655,770 $
(2,116,511)
(313,767)
(102,011)
Fund Balance, June
(1,784,109) $
143
the Year Ended June 30, 2023
Transit
Variance with Final Budget Budget AmountsActualPositive OriginalFinal Amounts(Negative) Budgetary Fund Balance, July 1, as restated2,100,943 $ 2,100,943 $ 2,100,943 $ - $ Revenues Taxes 1,916,624 1,916,624 2,060,477 143,853 Use of money and property 15,000 15,000 32,623 17,623 Miscellaneous - - 468 468 Total Revenues4,032,567 4,032,567 4,194,511 161,944 Expenditures Public works- - 83,927 (83,927) Capital outlay 2,893,060 2,893,060 471,705 2,421,355 Debt service: Principal retirement470,000 470,000 470,000Interest and fiscal charges555,557 555,557 553,990 1,567 Total Expenditures3,918,617 3,918,617 1,579,622 2,338,995 Budgetary Fund Balance, June 30 113,950 $ 113,950 $ 2,614,889 $ 2,500,939 $ For
144
CITY OF DOWNEY Budgetary Comparison Schedule
Measure M
Budgetary Comparison Schedule
Measure W - Sewer & Storm Drain
For the Year Ended June 30, 2023
CITY OF DOWNEY
Variance with Final Budget Budget Amounts Actual Positive Original Final Amounts(Negative) Budgetary Fund Balance, July 1, as restated 1,627,710 $ 1,627,710 $ 1,627,710 $ - $ Revenues Taxes 1,500,000 1,500,000 1,435,794 (64,206) Use of money and property 5,000 5,000 12,624 7,624 Miscellaneous- - 2,475,920 2,475,920 Total Revenues 3,132,710 3,132,710 5,552,048 2,419,338 Expenditures Public works270,300 270,300 151,941 118,359 Capital outlay # 3,345,000 3,345,000 475,853 2,869,147 Total Expenditures3,615,300 3,615,300 627,794
Budgetary
(482,590) $ (482,590) $ 4,924,254 $ 5,406,844 $
2,987,506
Fund Balance, June 30
145
Budgetary Comparison Schedule Art in Public Places
For the Year Ended June 30, 2023
CITY OF DOWNEY
Variance with Final Budget Budget Amounts Actual Positive Original Final Amounts(Negative) Budgetary
July 1316,937 $ 316,937 $ 316,937 $ - $ Revenues Miscellaneous35,000 35,000 86,517 51,517 Total Revenues351,937 351,937 403,454 51,517 Expenditures Public works - - 32,094 (32,094) Total Expenditures - - 32,094 (32,094) Budgetary Fund
30 351,937 $ 351,937 $ 371,360 $ 19,423 $
Fund Balance,
Balance, June
146
Budgetary Comparison Schedule
Measure M Bond 2021A
For the Year Ended June 30, 2023
CITY OF DOWNEY
Variance with Final Budget Budget Amounts Actual Positive Original Final Amounts(Negative) Budgetary Fund Balance, July 113,845,042 $ 13,845,042 $ 13,845,042 $ - $ Revenues Use of money and property 100 100 575 475 Total Revenues13,845,142 13,845,142 13,845,617 475 Expenditures Capital outlay 13,025,000 15,386,139 10,638,916 4,747,223 Total Expenditures13,025,000 15,386,139 10,638,916 4,747,223 Budgetary Fund Balance,
30 820,142 $ (1,540,997) $ 3,206,701 $ 4,747,698 $
147
June
Budgetary Comparison Schedule
Measure R Bond 2021B
For the Year Ended June 30, 2023
CITY OF DOWNEY
Variance with Final Budget Budget Amounts Actual Positive Original Final Amounts(Negative) Budgetary Fund Balance, July 17,600,289 $ 7,600,289 $ 7,600,289 $ - $ Revenues Use of money and property - - 344 344 Total Revenues7,600,289 7,600,289 7,600,633 344 Expenditures Public works - - 139,118 (139,118) Capital outlay 6,350,000 6,535,000 3,638,402 2,896,598 Total Expenditures6,350,000 6,535,000 3,777,520 2,757,480 Budgetary Fund Balance, June 30 1,250,289 $ 1,065,289 $ 3,823,113 $ 2,757,824 $
148
Budgetary Comparison Schedule
For the Year Ended June 30, 2023
CITY OF DOWNEY
Variance with Final Budget Budget Amounts Actual Positive Original Final Amounts(Negative) Budgetary Fund Balance, July 1 4,552,226 $ 4,552,226 $ 4,552,226 $ - $ Revenues Charges for services - - 4,764 4,764 Use of money and property - - 3,319 3,319 Fines and forfeitures1,800,000 1,800,000 1,864,232 64,232 Transfers in7,500,000 7,532,457 7,564,914 32,457 Total Revenues 13,852,226 13,884,683 13,989,455 104,772
Public works - - 16,347 (16,347) Capital outlay 11,861,000 12,110,467 1,006,467 11,104,000 Transfers out 587,000 587,000 587,000Total Expenditures12,448,000 12,697,467 1,609,814 11,087,653 Budgetary Fund Balance, June 30 1,404,226 $ 1,187,216 $ 12,379,641 $ 11,192,425 $
149
City Capital Projects
Expenditures
STATISTICAL INFORMATION


()�) 160
THIS PAGE INTENTIONALLY LEFT BLANK
161
DESCRIPTION OF STATISTICAL SECTION CONTENTS
June 30, 2023
This part of the City of Downey’s annual comprehensive financial report presents detailed information as a context for understanding what the information in the financial statements, note disclosures, and required supplementary information say about the government’s overall financial health.
Contents: Pages
Financial Trends - These schedules contain trend information to help the reader understand how the City’s financial performance and well-being have changed over time ..............................................................................................................................
Revenue Capacity - These schedules contain information to help the reader assess the City’s most significant local revenue source, the property tax
Debt Capacity - These schedules present information to help the reader assess the affordability of the City’s current levels of outstanding debt and the City’s ability to issue additional debt in the future
Demographic and Economic Information - These schedules offer demographic and economic indicators to help the reader understand the environment within which the City’s financial activities take place .............................................................................................
Operating Information - These schedules contain service and infrastructure data to help the reader understand how the information in the City’s financial report relates to the services the City provides and the activities it performs .............................................
163-172
.................................................. 173-180
............ 181-187
188-190
191-196 162
CITY OF DOWNEY
NET POSTION BY COMPONENT (amounts expressed in thousands)
Last Ten Fiscal Years (modified accrual basis of accounting) Source: Finance Department, City of Downey
Note: Transit was transferred to governmental activities during fiscal year 2014-15. Transit revenues are grouped under operating grants and contributions.
2013-142014-152015-162016-172017-18 Governmental Activities: Net investment in capital assets193,071 $ 206,576 $ 211,020 $ 212,244 $ 151,973 $ Restricted 26,203 23,592 30,009 30,653 82,066 Unreserved 48,162 (98,403) (103,853) (109,605) (173,874) Total governmental activities 267,436 131,765 137,176 133,292 60,165 Business-type Activities: Net investment in capital assets 41,719 34,744 35,577 35,265 64,401 Restricted 1,478 469 469 469 36,006 Unrestricted 5,941 1,084 6,032 11,124 (23,706) Total business-type activities 49,138 36,297 42,078 46,858 76,701
Government: Net investment in capital assets 234,790 241,320 246,597 247,509 216,374 Restricted 27,681 24,061 30,478 31,122 118,072 Unassigned 54,103 (97,319) (97,821) (98,481) (197,580) Total primary government 316,574 $ 168,062 $ 179,254 $ 180,150 $ 136,866 $
Primary
163
CITY OF DOWNEY
NET POSITION BY COMPONENT (amounts expressed in thousands)
Last Ten Fiscal Years (modified accrual basis of accounting)
Note: Transit was transferred to governmental activities during fiscal year 2014-15. Transit revenues are grouped under operating grants and contributions.
2018-192019-202020-212021-222022-23 Governmental Activities: Net investment in capital assets191,436 $ 246,763 $ 216,976 $ 231,094 $ 227,707 $ Restricted78,437 44,502 36,143 63,539 49,059 Unreserved(184,334) (208,799) (170,512) (170,064) (140,012) Total governmental activities85,539 82,466 82,607 124,569 136,754 Business-type Activities: Net investment in capital assets73,287 77,286 74,989 76,539 83,507 Restricted35,064 34,007 34,130 33,854 6,522 Unrestricted(25,220) (26,669) (16,020) (14,293) 7,674 Total business-type activities83,131 84,624 93,099 96,100 97,703 Primary Government: Net investment in capital assets264,723 324,049 291,965 307,633 311,214 Restricted113,501 78,509 70,273 97,393 55,581 Unassigned(209,554) (235,468) (186,532) (184,357) (132,338) Total primary government 168,670 $ 167,090 $ 175,706 $ 220,669 $ 234,457 $
Source: Finance Department, City of Downey 164
Expenses
Program Revenues Governmental
CITY OF DOWNEY
CHANGES IN NET POSITION - EXPENSES AND PROGRAM REVENUES Source: Finance Department, City of Downey
Net (Expenses)/Revenues:
(amounts expressed in thousands)
Last Ten Fiscal Years (modified accrual basis of accounting)
Note: Transit was transferred to governmental activities during fiscal year 2014-15. Transit revenues are grouped under operating grants and contributions.
2013-142014-152015-162016-172017-18
Governmental Activities: General government12,856 $ 12,419 $ 14,884 $ 14,735 $ 10,530 $ Public safety 52,127 54,196 58,397 65,666 70,552 Public works 10,209 13,598 15,479 15,486 15,075 Community services 5,821 6,703 7,975 9,404 10,152 Community development 5,115 4,893 7,257 5,870 7,626 Transit 3,317 - - -Interest on long term debt 1,052 1,617 1,662 1,704 2,588 Total expenses for governmental activities 90,497 93,426 105,654 112,865 116,523 Business-type Activities: Water 12,102 12,355 10,580 11,376 15,881 Golf 3,054 3,188 2,667 2,794 2,899 Sewer and Storm Drain - - - - 4,102 Total expenses for business-type activities 15,156 15,543 13,247 14,170 22,882 Total expenses for primary government 105,653 $ 108,969 $ 118,901 $ 127,035 $ 139,405 $
Activities: Charges for services: General government 5,109 $ 5,530 $ 6,436 $ 7,700 $ 7,674 $ Public safety 4,550 3,980 5,136 4,650 5,244 Public works 2,045 2,950 5,545 4,332 1,157 Community services 2,766 2,977 3,233 3,561 2,166 Community development 1,080 1,307 1,550 1,408 1,232 Operating grants and contributions 9,981 12,690 15,108 13,548 9,853 Capital grants and contributions 981 1,503 2,281 1,805 2,195 Total revenues for governmental activities 26,512 30,937 39,289 37,004 29,521 Business-type Activities: Charges for services: Water 18,104 17,399 16,120 16,874 18,026 Golf 2,765 2,763 2,798 2,800 2,947 Sewer and Storm Drain - - - - 1,507 Operating grants and contributions - - - - 388 Total revenues for business-type activities 20,869 20,162 18,918 19,674 22,868 Total revenues for primary government 47,381 $ 51,099 $ 58,207 $ 56,678 $ 52,389 $
Governmental activities (63,985) $ (62,489) $ (66,365) $ (75,861) $ (87,001) $ Business-type activities 5,713 4,619 5,671 5,504 (13) Total net position for primary government (58,272) $ (57,870) $ (60,694) $ (70,357) $ (87,014) $
165
Expenses
Net (Expenses)/Revenues:
CITY OF DOWNEY
CHANGES IN NET POSITION - EXPENSES AND PROGRAM REVENUES (amounts expressed in thousands)
Last Ten Fiscal Years (modified accrual basis of accounting)
Note: Transit was transferred to governmental activities during fiscal year 2014-15. Transit revenues are grouped under operating grants and contributions.
Finance Department, City of Downey
2018-192019-202020-212021-222022-23
Governmental Activities: General government13,340 $ 15,763 $ 19,271 $ 13,930 $ 7,310 $ Public safety74,434 82,960 83,139 64,532 82,248 Public works13,289 14,320 15,176 15,338 19,554 Community services13,171 11,050 9,281 9,978 13,383 Community development6,856 6,187 6,636 6,156 6,700 Interest on long term debt3,298 2,773 3,209 6,650 5,780 Total expenses for governmental activities124,388 133,053 136,712 116,584 134,975 Business-type Activities: Water14,157 14,789 10,825 15,778 15,837 Golf2,853 2,979 3,119 3,081 2,968 Sewer and Storm Drain3,657 3,812 1,933 2,268 2,672 Total expenses for business-type activities20,667 21,580 15,877 21,127 21,477 Total expenses for primary government 145,055 $ 154,633 $ 152,589 $ 137,711 $ 156,452 $ Program Revenues Governmental Activities: Charges for services: General government8,477 $ 8,226 $ 8,206 $ 9,190 $ 9,647 $ Public safety5,102 5,128 5,295 5,759 6,361 Public works3,566 3,305 3,467 4,461 3,517 Community services2,137 1,119 723 2,177 2,817 Community development1,025 1,004 1,149 1,735 1,513 Operating grants and contributions11,678 13,151 22,366 19,997 6,350 Capital grants and contributions8,281 2,301 1,288 1,007 1,248 Total revenues for governmental activities40,266 34,234 42,494 44,326 31,453 Business-type Activities: Charges for services: Water17,711 18,132 18,875 18,197 17,621 Golf2,853 2,687 4,248 4,508 4,273 Sewer and Storm Drain1,471 1,477 1,497 1,521 1,431 Total revenues for business-type activities22,035 22,296 24,620 24,226 23,325 Total revenues for primary government 62,301 $ 56,530 $ 67,114 $ 68,552 $ 54,778 $
Governmental activities(84,122) $ (98,819) $ (94,218) $ (72,258) $ (103,522) $ Business-type activities1,368 716 8,743 3,099 1,848 Total net position for primary government (82,754) $ (98,103) $ (85,475) $ (69,159) $ (101,674) $
Source:
166
CITY OF DOWNEY
CHANGES IN NET POSITION - GENERAL REVENUES (amounts expressed in thousands)
Last Ten Fiscal Years (modified accrual basis of accounting)
General Revenues and Other Changes in Net Position:
Activities:
Activities:
Changes in Net Position
Note: Transit was transferred to governmental activities during fiscal year 2014-15. Transit revenues are grouped under operating grants and contributions.
Source: Finance Department, City of Downey
2013-142014-152015-162016-172017-18
Governmental
Property taxes, levied for general purposes21,842 $ 23,152 $ 24,709 $ 25,378 $ 26,976 $ Transient occupancy taxes 1,315 1,317 1,629 1,701 1,705 Sales and use taxes 11,395 17,062 20,039 24,606 26,993 Property tax in lieu of sales and use taxes 4,385 4,231 3,349 2,106 9,154 Franchise taxes 2,282 2,257 2,625 2,433 2,670 Utility taxes 7,562 7,595 7,229 7,065 6,735 Other taxes 1,633 1,661 1,903 1,898 2,128 Earning on investments 5,189 3,343 3,738 1,089 1,682 Gain/(loss) on sales of capital assets - - 45 (112)Miscellaneous 16,321 7,201 4,759 4,806 5,639 Transfer-in 1,311 1,777 1,359 1,051 148 Total governmental activities 73,235 69,596 71,384 72,021 83,830
Sales taxes 4,685 - - -Earning on investments 489 458 519 300 500 Gain/(loss) on sales of capital assets - - 39 (1)Miscellaneous 648 2,291 970 27 176 Transfer-in (1,311) (1,777) (1,359) (1,050) (147) Total business-type activities 4,511 972 169 (724) 529 Total primary government 77,746 $ 70,568 $ 71,553 $ 71,297 $ 84,359 $
Business-type
Governmental activities 9,250 $ 69,596 $ 71,384 $ (14,980) $ (292) $ Business-type activities 10,224 972 169 (737) 1,897 Total net position for primary government 19,474 $ 70,568 $ 71,553 $ (15,717) $ 1,605 $
167
CITY OF DOWNEY
CHANGES IN NET POSITION - GENERAL REVENUES (amounts expressed in thousands)
Last Ten Fiscal Years (modified accrual basis of accounting)
General Revenues and Other Changes in Net Position:
Changes in Net Position
Note: Transit was transferred to governmental activities during fiscal year 2014-15. Transit revenues are grouped under operating grants and contributions.
Finance Department, City of Downey
2018-192019-202020-212021-222022-23
Governmental
Property taxes, levied for general purposes28,817 $ 30,184 $ 32,209 $ 32,699 $ 34,555 $ Transient occupancy taxes1,537 1,348 1,298 1,769 2,236 Sales and use taxes31,673 30,055 32,777 37,791 37,050 Property tax in lieu of sales and use taxes10,384 9,937 11,192 12,421 12,865 Franchise taxes2,778 2,854 2,981 3,284 3,240 Utility taxes6,411 6,303 6,617 10,394 10,328 Other taxes2,516 2,404 2,012 2,101 3,245 Earning on investments4,173 3,481 1,416 48 4,701 Gain/(loss) on sales of capital assets1,345 4,712 91 9,029 129 Miscellaneous4,396 4,263 4,708 4,334 7,107 Transfer-in153 205 898 351 893 Total governmental activities108,446 95,746 96,199 114,221 116,349 Business-type Activities: Earning on investments1,076 779 138 (149) 647 Gain/(loss) on sales of capital assets14 - 16 6Miscellaneous249 202 477 397 2 Transfer-in(153) (205) (898) (351) (893) Total business-type activities1,186 776 (267) (97) (244) Total primary government 109,632 $ 96,522 $ 95,932 $ 114,124 $ 116,105 $
Governmental activities24,324 $ (3,073) $ 1,981 $ 41,963 $ 12,828 $ Business-type activities2,554 1,492 8,476 3,002 1,603 Total net position for primary government 26,878 $ (1,581) $ 10,457 $ 44,965 $ 14,431 $
Activities:
168
Source:
CITY OF DOWNEY
FUND BALANCES OF GOVERNMENTAL FUNDS (amounts expressed in thousands)
Last Ten Fiscal Years
(modified accrual basis of accounting)
Other Governmental Funds:
Notes:
1. GASB Statement #54 was implemented in 2011; prior years have no comparable data.
2. Transit was transferred to governmental activities during fiscal year 2014-15. Transit revenues are grouped under operating grants and contribution
Source: Finance Department, City of Downey
2013-142014-152015-162016-172017-18 General Fund: Nonspendable7,146 $ 7,592 $ 7,609 $ 7,413 $ 8,308 $ Restricted 4,877 - - -Assigned 15,689 17,578 20,003 20,003Unassigned 7,401 11,922 10,662 7,894 25,553 Total general fund 35,113 $ 37,092 $ 38,274 $ 35,310 $ 33,861 $ All
Nonspendable - $ 3,279 $ 11 $ 11 $ - $ Restricted 9,683 6,237 13,935 14,480 65,680 Assigned 6,298 5,092 2,073 3,295 3,490 Unassigned (525) 760 (2,189) (3,686) (1,774) Total all other governmental funds 15,456 $ 15,368 $ 13,830 $ 14,100 $ 67,396 $
169
CITY OF DOWNEY
FUND BALANCES OF GOVERNMENTAL FUNDS (amounts expressed in thousands)
Last Ten Fiscal Years (modified accrual basis of accounting)
Notes:
1. GASB Statement #54 was implemented in 2011; prior years have no comparable data.
2. Transit was transferred to governmental activities during fiscal year 2014-15. Transit revenues are grouped under operating grants and contribution
Source: Finance Department, City of Downey
2018-192019-202020-212021-222022-23 General Fund: Nonspendable8,503 $ 8,240 $ 8,093 $ 6,882 $ 9,042 $ Assigned - - - - 38,200 Unassigned 29,732 25,896 26,355 46,580 5 Total general fund 38,235 $ 34,136 $ 34,448 $ 53,462 $ 47,247 $ All Other Governmental Funds: Nonspendable - $ - $ - $ - $ 2,200 $ Restricted 62,336 26,797 18,513 45,418 37,902 Assigned 3,362 4,392 4,412 4,552 15,035 Unassigned (1,565) (4,527) (5,824) (5,751) (2,614) Total all other governmental funds 64,133 $ 26,662 $ 17,101 $ 44,219 $ 52,523 $
170
CITY OF DOWNEY
CHANGES IN FUND BALANCES OF GOVERNMENTAL FUNDS
(amounts expressed in thousands)
Last Ten Fiscal Years (modified accrual basis of accounting)
Note:
Transit was transferred to governmental activities during fiscal year 2014-15. Transit revenues are grouped under operating grants and contributions.
2013-142014-152015-162016-172017-18 Revenues: Taxes 52,054 $ 57,363 $ 61,521 $ 65,130 $ 76,104 $ License and permits1,390 1,726 2,173 1,999 1,837 Fines and forfeitures1,435 1,512 1,856 2,851 3,051 Investment and rental4,785 1,784 2,046 1,497 1,918 Intergovernmental revenue9,846 14,945 17,304 15,333 12,167 Charges for services12,379 12,280 14,094 14,213 13,262 Other revenue16,401 5,883 6,119 6,183 6,954 Total revenues 98,290 95,493 105,113 107,206 115,293 Expenditures: Current: General government12,660 10,789 12,091 11,387 10,786 Public safety44,837 46,683 51,103 56,712 58,694 Public works10,040 12,983 14,431 14,707 13,835 Community services4,990 5,862 6,413 8,540 9,263 Community development4,013 4,412 6,097 5,430 7,236 Capital outlay6,593 13,264 16,794 13,272 8,309 Debt service: Principal250 645 460 611 681 Interest and fiscal charges38 975 1,630 1,652 2,696 Total expenditures 83,421 95,613 109,019 112,311 111,500 Excess of revenues over (under) expenditures 14,869 (120) (3,906) (5,105) 3,793 Other Financing Sources (Uses): Transfers in 3,926 9,118 9,210 5,820 5,552 Transfers out (5,709) (8,341) (7,823) (4,770) (6,216) Proceeds from long-term debt - - - - 51,949 Issuance of debt 600 - 668 705 744 Sale of capital assets - 350 2,163 700Total other financing sources (uses) (1,183) 1,127 4,218 2,455 52,028 Net change in fund balances 13,686 1,007 312 (2,650) 55,821 Fund balances - July 1 36,883 52,747 51,793 52,060 45,436 Fund balances - June 30 50,569 $ 53,754 $ 52,105 $ 49,410 $ 101,257 $ Debt service as a percentage of noncapital expenditures 0.37%1.97%2.22%2.30%3.26%
Source: Finance Department, City of Downey 171
CITY OF DOWNEY
CHANGES IN FUND BALANCES OF GOVERNMENTAL FUNDS (amounts expressed in thousands)
Last Ten Fiscal Years (modified accrual basis of accounting)
Transit was transferred to governmental activities during fiscal year 2014-15. Transit
2018-192019-202020-212021-222022-23 Revenues: Taxes 84,299 $ 82,993 $ 89,097 $ 100,213 $ 103,519 $ License and permits1,486 1,536 1,681 1,781 2,069 Fines and forfeitures3,456 3,586 3,469 3,725 3,634 Investment and rental4,769 3,726 1,416 48 4,701 Intergovernmental revenue13,325 13,615 23,742 20,477 10,064 Charges for services13,535 12,104 12,093 15,924 16,748 Other revenue12,579 5,819 6,305 6,226 8,929 Total revenues 133,449 123,379 137,803 148,394 149,664 Expenditures: Current: General government11,649 13,661 10,822 13,424 7,465 Public safety62,543 65,129 70,062 65,372 72,465 Public works11,781 13,565 13,812 14,453 15,251 Community services11,950 10,295 8,178 9,261 10,968 Community development6,929 5,969 8,586 6,534 6,832 Capital outlay36,176 58,254 29,345 26,733 21,155 Debt service: Principal2,844 2,822 3,346 5,230 8,288 Interest and fiscal charges3,513 2,958 3,447 6,669 5,959 Total expenditures 147,385 172,653 147,598 147,676 148,383 Excess of revenues over (under) expenditures (13,936) (49,274) (9,795) 718 1,281 Other Financing Sources (Uses): Transfers in 11,126 11,455 18,734 12,682 25,650 Transfers out (5,148) (11,250) (17,336) (12,457) (24,756) Proceeds from long-term debt 3,000 - - -Leases 3,433 192 356 854 417 Issuance of debt - - 108,446 30,465 139 Sale of capital assets 2,514 5,404 - 13,870Total other financing sources (uses) 14,925 5,801 110,200 45,414 1,450 Special Item: Pension contribution due to bond issuanc - - (107,814) -Net change in fund balances 989 (43,473) (7,409) 46,132 2,731 Fund balances - July 1, as restated 101,378 102,367 58,958 51,549 97,039 Fund balances - June 30 102,367 $ 58,894 $ 51,549 $ 97,681 $ 99,770 $ Debt service as a percentage of noncapital expenditures 5.76%4.56%4.26%10.05%11.12%
Note:
grouped under operating grants
e: Finance Department, City of Downey 172
revenues are
and contributions.
Note: Homeowner Exemptions are not included in Total Exemptions.
CITY OF DOWNEY
ASSESSED VALUATION (amounts expressed in thousands)
Last Ten Fiscal Years
Net TotalPercent FiscalPublicLessNet TotalLessNet TotalUnsecuredIncrease YearSecuredUtilitiesExemptionsSecuredUnsecuredExemptionsUnsecuredand Secured(Decrease) 2013-149,558,959 560 722,297 8,837,222 415,315 154,317 260,998 9,098,220 5.22% 2014-159,898,550 560 694,759 9,204,351 438,298 117,035 321,263 9,525,614 4.70% 2015-1610,318,316 560 715,185 9,603,691 546,557 151,877 394,680 9,998,371 4.96% 2016-1710,914,243 560 724,987 10,189,816 507,620 112,353 395,267 10,585,083 5.87% 2017-1811,461,902 1,011 716,615 10,746,298 379,305 45 379,260 11,125,558 5.11% 2018-1912,239,422 1,011 786,926 11,453,507 428,769 117,407 311,362 11,764,869 5.75% 2019-2012,981,632 1,011 870,877 12,111,766 441,308 29,325 411,983 12,523,749 6.45% 2020-2113,593,718 1,011 880,312 12,714,417 453,911 32,007 421,904 13,136,321 4.89% 2022-2314,694,624 1,619 783,581 13,912,662 467,399 62,342 405,057 14,317,719 8.99%
Source: HdL Coren Cone, Los Angeles County Assessor 2019/20 Combined Tax Rolls 173
THIS PAGE INTENTIONALLY LEFT BLANK
174
Note:
CITY OF DOWNEY
ASSESSED
Last Ten Fiscal Years
2013-142014-152015-162016-172017-18 Residential 7,042,493 $ 7,393,326 $ 7,803,812 $ 8,284,859 $ 8,709,975 $ Commercial 1,131,2941,144,9381,191,1371,277,9601,400,109 Industrial 396,484378,085312,043321,456334,314 Government owned - - - 620 632 Institutional 62,57865,96166,17670,99576,903 Miscellaneous 132,4581,0121,0273,549 Recreational 25,78025,86026,51631,95332,592 Unknown 3,384 499 509 517 527 Vacant Land 44,15459,70367,13261,29946,663 SBE Nonunitary 560 560 560
Possessory Int. 130,482132,961
Unsecured 260,999321,263394,680395,266379,260 Exempt - - (83,552) (82,326)(82,336) TOTALS 9,098,221 $ 9,525,614 $ 9,863,577 $ 10,584,462 $ 11,125,559 $ Total Direct Rate 0.1387%0.1390%0.1393%0.1396%0.1396%
5601,011
- 138,570140,024
Total.
Exempt values are not included in
VALUE OF TAXABLE PROPERTY (amounts expressed in thousands)
Source: HdL Coren Cone, L.A. County Assessor 2010/11 - 2019/20 Combined Tax Rolls 175
Note:
CITY OF DOWNEY
2018-192019-202020-212021-222022-23 Residential 9,232,913 $ 9,738,633 $ 10,218,058 $ 10,585,620 $ 11,219,901 $ Commercial 1,447,9811,617,9091,690,3141,681,9521,797,756 Industrial 396,068394,148426,171450,432503,719 Government owned 1,0251,1781,2021,0781,238 Institutional 96,08772,37086,24390,88185,852 Miscellaneous 3,6193,6923,7653,804 13 Recreational 98,86799,407101,47896,659103,031 Unknown - - - -Vacant Land
SBE Nonunitary
Possessory Int. 136,628140,933145,026149,775145,408 Unsecured 311,363411,983421,904395,251405,057 Exempt (82,245)(82,245)(81,846)(81,558)(81,558) TOTALS 11,764,870 $ 12,523,750 $ 13,136,321 $ 13,510,566 $ 14,317,720 $ Total Direct Rate 0.1401%0.1411%0.1419%0.1414%0.1417%
39,30842,48641,14953,49454,125
1,0111,0111,0111,6201,620
Exempt values are not included in Total.
Source: HdL Coren Cone, L.A. County Assessor 2010/11 - 2019/20 Combined Tax Rolls 176
ASSESSED VALUE OF TAXABLE PROPERTY (amounts expressed in thousands) Last Ten Fiscal Years
CITY OF DOWNEY
2013-142014-152015-162016-172017-18
Basic Levy 1
City of Downey Tax District 10.139700.139700.139700.139700.13970
Cerritos Community College District0.026200.026200.026200.026200.02620
Childrens Institutional Tuition Fund0.002910.002910.002910.002910.00291
County Sanitation District No. 2 Operating0.013940.013940.013940.013940.01394
County School Service Fund-Downey0.007430.007430.007430.007430.00743
County School Service 0.001460.001460.001460.001460.00146
Development Ctr For Handicapped Minors0.000520.000520.000520.000520.00052
Downey Cemetery District0.000890.000890.000890.000890.00089
Downey Unified School District0.215400.215400.215400.215400.21540
Educational Augmentation Fund Impound0.163100.163100.163100.163100.16310
Educational Revenue Augmentation0.073400.073400.073400.073400.07340
Great L.A. County Vector Control Dist0.000390.000390.000390.000390.00039
L. A. County Accum Cap Outlay0.000120.000120.000120.000120.00012
L. A. County Fire 0.007680.007680.007680.007680.00768
L. A. County Flood Ctrl Drain Imp Dist Maint0.001830.001830.001830.001830.00183
L. A. County Flood Ctrl Maintenance0.010350.010350.010350.010350.01035
L. A. County General0.334500.334500.334500.334500.33450 Water Replenishment District of Southern Calif0.000180.000180.000180.000180.00018
Total Basic Levy Rate1.000001.000001.000001.000001.00000
Cerritos Community College Dist0.025020.048090.048290.046980.04370
Compton Community College Dist0.009630.009870.009260.009200.00954
County Detention Facilities 1987 Debt0.000000.000000.000000.000000.00000
Downey Unified School District0.066030.065490.114660.114730.10538
LA Community College District0.044540.040170.035750.035960.04599
LA County Flood Control0.000000.000000.000000.000000.00000
Little Lake City School District0.085370.079640.065220.075270.07876
Los Angeles Unified School District0.146440.146880.129710.131100.12219
Notes:
1. In 1978, California voters passed Proposition 13 which set the property tax rate at a 1% fixed amount. This 1% is shared by all taxing agencies for which the subject property resides within. In addition to the 1% fxied amount, property owners are charged tax as a percentage of assessed property values for the payment of any voter approved bonds.
2. Overlapping rates are those of local and county governments that apply to property owners within the City. Not all overlapping rates apply to all city property owners.
3. City's share of 1% Levy is based on the City's share of the general fund tax rate area with the largest net taxable value within the city. ERAF general fund tax shifts may not be included in tax ratio figures.
4. Redevelopment Rate is based on the largest RDA tax rate area (RA) and includes only rate(s) from indebtedness adopted prior to 1989 per California State statute. RDA direct and overlapping rate are applied only to the incremental property values. The approved of ABX1 26 eliminated Redevelopment from the State of California for the fiscal year 2012/13 and years thereafter.
5. Because basic and debt and rates vary by tax rate area individual rates cannot be summed. The Total Direct Rate is the weighted average of all individual direct rates applied by the government preparing the statistical section information.
Metropolitan Water District0.003500.003500.003500.003500.00350 Montebello
Mirada Unified0.072380.070630.141140.134000.13818 Rio Hondo Community College Dist0.028920.028210.027120.028080.02748 Whittier Union High School Dist0.044730.052700.050630.060350.05781 Total Voter Approved Rate0.621130.632680.712440.786210.76768 TOTAL DIRECT & OVERLAPPING2 TAX RATE 1.62113 1.63268 1.71244 1.78621 1.76768 Rate producing Revenue for City
Agency (RDA) City General Fund Direct Rate 3 0.0139730.0139730.0139730.0139730.013973 Total Direct Rate5 0.1387400.1390200.1392900.1396000.139590
Unified School District0.094570.087500.087150.147050.13514 Norwalk-La
and Redevelopment
DIRECT AND OVERLAPPING PROPERTY TAX RATES (Rate per $100 of Taxable Value)
Ten
Years
Last
Fiscal
Source: HdL Coren Cone, L. A. County Assessor 2010/11 - 2019/20 Tax Rate Table 177
Basic Levy 1
CITY OF DOWNEY
2018-192019-202020-212021-222022-23
City of Downey Tax District 10.139700.139700.139700.139700.13970
Cerritos Community College District0.026200.026200.026200.026200.02620
Childrens Institutional Tuition Fund0.002910.002910.002910.002910.00291
County Sanitation District No. 2 Operating0.013940.013940.013940.013940.01394
County School Service Fund-Downey0.007430.007430.007430.007430.00743
County School Service 0.001460.001460.001460.001460.00146
Development Ctr For Handicapped Minors0.000520.000520.000520.000520.00052
Downey Cemetery District0.000890.000890.000890.000890.00089
Downey Unified School District0.215400.215400.215400.215400.21540
Educational Augmentation Fund Impound0.163100.163100.163100.163100.16310
Educational Revenue Augmentation0.073400.073400.073400.073400.07340
Great L.A. County Vector Control Dist0.000390.000390.000390.000390.00039
L. A. County Accum Cap Outlay0.000120.000120.000120.000120.00012
L. A. County Fire 0.007680.007680.007680.007680.00768
L. A. County Flood Ctrl Drain Imp Dist Maint0.001830.001830.001830.001830.00183
L. A. County Flood Ctrl Maintenance0.010350.010350.010350.010350.01035
L. A. County General0.334500.334500.334500.334500.33450
Water Replenishment District of Southern Calif0.000180.000180.000180.000180.00018
Total Basic Levy Rate1.000001.000001.000001.000001.00000
Cerritos Community College Dist0.044460.444900.043480.042510.04361
Compton Community College Dist0.023350.023230.008990.009060.01575
County Detention Facilities 1987 Debt0.000000.000000.000000.000000.00000
Downey Unified School District0.101130.097080.087710.095040.09106
LA Community College District0.046210.027170.040160.043760.02488
LA County Flood Control0.000000.000000.000000.000000.00000
Little Lake City School District0.076110.065320.066060.062000.06811
Los Angeles Unified School District0.123230.125520.139930.113230.12107 Metropolitan Water District0.003500.003500.003500.003500.00350
Montebello Unified School District0.139210.093060.097060.090310.12770
Notes:
1. In 1978, California voters passed Proposition 13 which set the property tax rate at a 1% fixed amount. This 1% is shared by all taxing agencies for which the subject property resides within. In addition to the 1% fxied amount, property owners are charged tax as a percentage of assessed property values for the payment of any voter approved bonds.
2. Overlapping rates are those of local and county governments that apply to property owners within the City. Not all overlapping rates apply to all city property owners.
3. City's share of 1% Levy is based on the City's share of the general fund tax rate area with the largest net taxable value within the city. ERAF general fund tax shifts may not be included in tax ratio figures.
4. Redevelopment Rate is based on the largest RDA tax rate area (RA) and includes only rate(s) from indebtedness adopted prior to 1989 per California State statute. RDA direct and overlapping rate are applied only to the incremental property values. The approved of ABX1 26 eliminated Redevelopment from the State of California for the fiscal year 2012/13 and years thereafter.
individual direct rates applied by the government preparing the statistical section information.
of
Total Voter Approved Rate0.775211.100700.677030.671120.69746 TOTAL DIRECT & OVERLAPPING2 TAX RATE 1.77521 1.70029 1.677021.67113 1.69746 Rate
City General Fund Direct Rate 3 0.0139730.139730.139730.139730.13973 Total Direct Rate5 0.1401300.141120.141850.141420.14169
Norwalk-La Mirada Unified0.134250.140190.122200.142500.13301 Rio Hondo Community College Dist0.025540.025710.013610.015260.01535 Whittier Union High School Dist0.058220.055020.054330.053950.05342
producing Revenue for City and Redevelopment Agency (RDA)
DIRECT AND OVERLAPPING PROPERTY TAX RATES (Rate per $100 of Taxable Value)
Ten
basic
debt
rates vary by tax rate area individual rates cannot be summed. The
weighted average
Last
Fiscal Years 5. Because
and
and
Total Direct Rate is the
all
Source: HdL Coren Cone, L. A. County Assessor 2010/11 - 2019/20 Tax Rate Table 178
Years
Taxable% of Total CityTaxable% of Total City AssessedTaxable AssessedTaxable TaxpayerValueAssessed ValueValueAssessed Value US VI Downey LLC180,803 $ 1.26%$Gary L. Ball Trust121,551 0.85%102,731 1.13% Downey Landing LLC105,929 0.74%69,913 0.77% Reyes Coca-Cola Bottling LLC100,388 0.70%122,094 1.34% PRC Multi-Family LLC93,855 0.66%32,281 0.35% Macerich Stonewood LLC65,303 0.46%56,387 0.62% Kaiser Foundation Health Plan, Inc.60,524 0.42%68,027 0.75% Lone Oak-Downey, LLC55,347 0.39%- 0.00% Fremont Rancho Limited51,492 0.36%44,374 0.49% Hall Stewart and Gray Road LLC50,393 0.35%- 0.00% Top Ten Total885,585 $ 6.34%495,807 $ 5.45%
value data for both the City and the Redevelopment Agency.
Note: The amounts shown above include assessed
CITY OF DOWNEY
179
PRINCIPAL PROPERTY TAX PAYERS Current Year and Nine
Prior 2022-232013-14 (amounts expressed in thousands) Source: HdL Coren Cone
Source: L.A. County Auditor Controller's Office 2019-20
Fiscal YearTaxes LeviedCurrent TaxPercent ofCollectionsTaxPercent of Ended for theCollected Levyin Subsequent CollectedTotal Tax June 30Fiscal YearAmountCollectedFiscal YearAmountCollections 2013-14 12,710 12,313 96.88% 38 12,351 97.18% 2014-15 13,307 13,142 98.76% 165 13,307 100.00% 2015-16 13,587 13,164 96.89% 26 13,190 97.08% 2016-17 14,416 14,241 98.79% 26 14,267 98.97% 2017-18 15,165 15,140 99.84% 3 15,143 99.85% 2018-19 16,050 15,301 95.33% 4 15,305 95.36% 2019-20 17,099 16,252 95.05% 17 16,269 95.15% 2020-21 18,009 17,266 95.87% - 17,266 95.87% 2021-22 18,465 17,798 96.39% 14 17,812 96.46% 2022-23 19,580 18,765 95.84% 10 18,775 95.89%
PROPERTY TAX LEVIES AND COLLECTIONS (amounts expressed in thousands)
Total Collections to Date
180
CITY OF DOWNEY
Last Ten Fiscal Years
CITY OF
DOWNEY
TotalCapital TotalTotalPercentageDebt Fiscal GovernmentalLease Business-typePrimaryof PersonalPer YearBondsOtherActivitiesAgreement*OtherActivitiesGovernmentIncomeCapita 2013-1418,933 13,893 32,826 6,783 - 6,783 39,609 1556.5%349 2014-1518,545 13,949 32,494 5,875 - 5,875 38,369 2349.6%537 2015-1618,092 16,165 34,257 5,480 - 5,480 39,737 2719.7%625 2016-1717,569 16,630 34,199 5,070 - 5,070 39,269 1485.9%345 2017-1867,580 17,470 85,050 4,645 281 4,926 89,976 3258.4%788 2018-1964,691 9,321 74,012 4,200 213 4,413 78,425 2697.5%687 2019-2062,368 9,168 71,536 3,740 144 3,884 75,420 2440.7%664 2020-21168,675 8,593 177,268 3,265 4,581 7,846 185,114 5725.5%1,661 2021-22194,809 7,811 202,620 2,770 4,509 7,279 209,899 6165.0%1,864 2022-23187,165 7,139 194,304 2,255 4,366 6,621 200,925 5525.1%1,806
Governmental Activities
* Capital lease agreement was issued to prepay the 2002 Certificates of Participation Business-type Activities
OUTSTANDING
Source:
181
RATIOS OF
DEBT BY TYPE (amounts expressed in thousands) Last Ten Fiscal Years
Finance Department, City of Downey
CITY OF DOWNEY
RATIO OF GENERAL BONDED DEBT TO ASSESSED VALUE AND NET BONDED DEBT PER CAPITA (amounts expressed in thousands) Source: Finance Department, City of Downey
Last Ten Fiscal Years
* Gross Bonded Debt Restated for prior years due to exclusion of Business Type Activities
Ratio of Net AssessedGrossNetBonded DebtNet Bonded CalendarValueBondedBondedto AssessedDebt Per YearPopulation(in thousands)DebtDebtValueCapita 2013-14113,3639,098 32,826 32,826 360.8%29.0% 2014-15113,4179,526 32,494 32,494 341.1%28.7% 2015-16114,1819,998 34,257 34,257 342.6%30.0% 2016-17113,83210,585 34,199 34,199 323.1%30.0% 2017-18114,14611,126 85,050 85,050 764.5%74.5% 2018-19114,21211,765 74,012 74,012 629.1%64.8% 2019-20113,52912,524 71,536 71,536 571.2%63.0% 2020-21111,42513,136 177,268 177,268 1349.5%159.1% 2021-22112,58413,511 202,620 202,620 1499.7%180.0% 2022-23111,26114,318 194,304 194,304 1357.1%174.6%
182
THIS PAGE INTENTIONALLY LEFT BLANK
183
CITY OF DOWNEY
SCHEDULE OF DIRECT AND OVERLAPPING DEBT
Total Overlapping Tax and Assessment Debt
Direct and Overlapping General Fund Debt:
Total Gross Direct and Overlapping General Fund Debt
TOTAL GROSS DIRECT DEBT
TOTAL NET DIRECT DEBT TOTAL OVERLAPPING DEBT
GROSS COMBINED TOTAL DEBT (2) NET COMBINED TOTAL DEBT
(2) Excludes tax and revenue anticipation notes, enterprise revenue, mortage revenue and non-bonded capital lease obligations
Ratios to 2022-23 Assessed Valuation
Total Overlapping Tax and Assessment Debt……………………… 3.15%
Ratios to Redevelopment Successor Agency Incremental Valuation ($885,898,136):
Total Overlapping Tax and Assessment Debt ……………………… 0.37%
161,985,000 $ 159,730,000 $ 474,716,530 $ 636,701,530 $ 634,446,530 $
2022-23 Assessed Valuation: $14,317,719,833 City's Share Total DebtPercent of Debt Overlapping Tax and Assessment Debt: 6/30/2023Applicable (1)6/30/2023 Metropolitan Water District19,215,000 $ 0.394%75,707 $ Cerritos Community College District445,232,887 24.008106,891,512 Compton Community College District 104,371,964 0.643671,112 Los Angeles Community District 4,500,730,000 0.00290,015 Rio Honda Community College District170,234,080 0.367624,759 Whittier Union High School District127,929,361 0.571730,477 Downey Unified School District371,698,240 91.552340,297,173 Montebello Unified School District248,196,585 0.117290,390 Little Lake City School District57,449,901 3.4131,960,765
$ Los Angeles County General Fund Obligation2,601,551,282 $ 0.756%19,667,728 $ Los Angeles County Superintendent of Schools Certificates of Participation 3,403,487 0.75625,730 Los Angeles County Sanitation District No. 2 Authority776,732 18.577144,294 Los Angeles County Sanitation District No. 18 Authority 434,236 0.3381,468 Montebello Unified School District Certificates of Participation 4,615,000 0.1175,400 City of Downey General Fund Obligations39,200,000 10039,200,000 City of Downey Pension Obligation Bonds122,785,000 100122,785,000 181,829,620 $ Less:City of Downey Lease Agreement supported by golf course revenue 2,255,000 Total Net Direct and Overlapping General Fund Debt 179,574,620 $ Overlapping Tax Increment Debt (Successor Agency): 3,240,000 $ 0.756%3,240,000 $
percentage of overlapping debt applicable to the city is estimated using taxable essessed property value. Applicable percentages were estimated by determining the portion of the overlapping district's assessed value that is within the boundaries of the city divided by the district's total taxable assessed value.
451,631,910
(1) The
Total
Total
Gross Combined Total Debt………………………………………... 4.45% Net Combined Total Debt…………………………………………... 4.43%
Gross Direct Debt ($161,985,000)………………………. 1.13%
Net Direct Debt ($159,730,000)…………………………… 1.12%
Source: HdL Coren Cone, Los Angeles County Assessor and Auditor Combined 2019/20 Lien Date Tax Rolls 184
(15% of Assessed Valuation)
CITY OF DOWNEY
SCHEDULE OF LEGAL DEBT MARGIN (amounts expressed in thousands)
Last Ten Fiscal Years Source: L. A. County
Note: The Government Code of the State of California provides for a legal debt limit of 15% of gross assessed valuation.
2013-142014-152015-162016-172017-18 Assessed Valuation 8,820,915 $ 9,525,614 $ 9,998,371 $ 10,585,083 $ 11,125,558 $ Charter
1,428,842 1,499,756 1,587,762 1,668,834
Legal Debt Margin1,323,137 $ 1,428,842 $ 1,499,756 $ 1,587,762 $ 1,668,834 $ Total
percentage
debt limit0%0%0%0%0%
Debt Limited1,323,137
Debt applicable to the limit as a
of
Combined Tax Rolls 185
Assessor 2010/11 - 2019/20
CITY OF DOWNEY
SCHEDULE OF LEGAL DEBT MARGIN (amounts expressed in thousands)
Last Ten Fiscal Years
(15% of Assessed Valuation)
Total Debt applicable to the limit as a percentage of debt
Note: The Government Code of the State of California provides for a legal debt limit of 15% of gross assessed valuation.
2018-192019-202020-212021-222022-23 Assessed Valuation 11,764,870 $ 12,523,750 $ 13,136,321 $ 13,510,567 $ 14,317,719 $ Charter Debt Limited1,764,731 1,878,563 1,970,448 2,026,585 2,147,658
Legal Debt Margin 1,764,731 $ 1,878,563 $ 1,970,448 $ 2,026,585 $ 2,147,658 $
limit0%0%0%0%0%
Source:
Assessor 2010/11 - 2019/20 Combined Tax Rolls 186
L. A. County
CITY OF DOWNEY
GOLF COURSE REVENUE COVERAGE (amounts expressed in thousands)
Last Ten Fiscal Years
Note: Direct operating expenses does not include inter-fund transfers and debt services.
Debt Service Requirement
Net DirectAvailable FiscalGrossOperatingfor
YearRevenueExpensesServicePrincipalInterestTotalCoverage 2013-143,325 2,696 629 365 335 700 0.90 2014-153,019 2,966 53 475 132 607 0.09 2015-163,249 2,453 796 395 210 605 1.32 2016-173,128 2,593 535 410 195 605 0.88 2017-183,223 2,733 490 425 180 605 0.81 2018-193,213 2,703 510 445 163 609 0.84 2019-202,776 2,832 (56) 460 147 607 (0.09) 2020-214,313 2,991 1,322 475 130 605 2.19 2021-224,694 2,978 1,716 495 112 607 2.83 2022-234,555 2,883 1,672 515 93 608 2.75
Debt
Source:
City of Downey 187
Finance Department,
CITY OF DOWNEY
DEMOGRAPHIC AND ECONOMIC STATISTICS
Last Ten Calendar Years Source: HdL Coren Cone
Personal Per Capita Calendar Income PersonalUnemployment YearPopulation (in thousands) Income Rate 2013-14 113,363 2,544,773 22,448 7.6% 2014-15 113,417 2,589,877 22,835 6.3% 2015-16 114,181 2,625,354 22,992 6.0% 2016-17 113,832 2,642,801 23,216 4.6% 2017-18 114,146 2,761,333 24,191 3.5% 2018-19 114,212 2,907,308 25,455 4.5% 2019-20 113,529 3,090,130 27,218 4.1% 2020-21 111,425 3,233,140 29,016 12.6% 2021-22 112,584 3,404,669 30,241 8.9% 2022-23 111,261 3,636,609 32,685 4.7%
188
THIS PAGE INTENTIONALLY LEFT BLANK
189
CITY OF DOWNEY
PRINCIPAL EMPLOYERS
Current Year and Nine Years Prior
Percent of Percent of Number ofTotalNumber ofTotal Employer EmployeesEmploymentEmployeesEmployment Kaiser Permanente5,400 14.24%4,500 8.20% Stonewood Shopping Center 1,800 4.75%1,765 3.20% Rancho Los Amigos Medical Center 1,630 4.30%1,410 2.60% PIH Health
Regional Medical Center)1,500 3.95%1,250 2.30% Office of Education, County of Los Angeles 1,425 3.76%2,262 4.10% Downey Unified School District 1,360 3.59%2,693 4.90% Coca-Cola Bottling Company 800 2.11%800 1.50% County of Los Angeles, Internal Service Department 712 1.88%712 1.30% City of Downey 723 1.91%766 1.40% Lakewood Health Center 400 1.05%314 0.60%
(formally Downey
2022-23 2013-14
190
Source: City of Downey, Finance Department and Community Development Department and Downey Chamber of Commerce
Last Ten Fiscal Years
1. Fire department was authorized to hire 12 paramedic operators upon receipt of Federal grant.
2. Increase to Fire Dept during FY14 & FY15 is due to having Ambulance Operators hired as employees rather than using an Ambulance Contract Service.
3. The part time employees hours were reduced to keep them below the requirements for offering insurance benefits. Staffing had to increase to cover the reduction in current staff hours.
Source: Finance Department, City of Downey
Function 2013-142014-152015-162016-172017-18 General Government 31 32363839 Police 167 161166166181 Fire 94 19828994115 Community Services 379 4693477373441 Public Works 74 76817979 Community Development 21 21212123 Total 766 857 870 771 878
CITY OF DOWNEY FULL-TIME AND PART-TIME CITY EMPLOYEES BY FUNCTION
Notes:
191
DOWNEY
Last Ten Fiscal Years
Notes:
1. Fire department was authorized to hire 12 paramedic operators upon receipt of Federal grant.
2. Increase to Fire Dept during FY14 & FY15 is due to having Ambulance Operators hired in as employees rather than using an Ambulance Contract Service
3. The part time employees hours were reduced to keep them below the requirements for offering insurance benefits. Staffing had to increase to cover the reduction in current staff hours.
Function 2018-192019-202020-212021-222022-23 General Government 4140403835 Police 189195188185184 Fire 105125120113110 Community Services 402369249275304 Public Works 8183837274 Community Development 2322202016 Total 841834700703723
PART-TIME CITY
CITY OF
FULL-TIME AND
EMPLOYEES BY FUNCTION
192
Source: Finance Department, City of Downey
CITY OF DOWNEY
OPERATING INDICATORS
Last Ten Fiscal Years
2013-142014-152015-162016-172017-18
Number of arrests3,368 3,942 3,947 3,4983,471 Number of collision reports issued 1,170 1,199 1,280 1,1121,023 Number of traffic citations issued 35,643 16,008 14,696 14,11114,085 Number of reported crimes & incidents 8,198 9,331 9,729 8,57612,839 Fire: Number of emergency incidents 6,996 7,346 8,081 7,9158,114 Number of fire & other incidents 1,363 1,339 1,635 1,6891,424 Number of special service & other incidents 312 410 374 449416 Number of traffic accidents 853 1,026 1,121 1,073907 Parks and Recreation: Number of general park attendance 1,404,361 1,652,469 2,004,311 1,620,0001,954,297 Number of participants in theatre 42,219 45,869 51,762 45,500107,130 Number of library attendance 363,640 360,211 371,625 326,941320,311 Public works: Engineering (CIP related improvement) Street striping (lineal feet) 39,750 39,218 55,392 93,64040,205 Asphalt replacement (tons) 21,484 19,998 30,728 39,73023,150 Trees planted (each) n/a437 105 118106 Trees removed (each) 220 100 332 8946 Maintenance Pavement markings (square feet) 57,229 38,485 24,985 48,07041,640 Street stripping (linear feet) 29,751 8,721 2,084 803,231792 Asphalt repair (tons) 375 403 422 450417 Graffiti removed (square feet) 645,000 676,623 752,655 581,479568,449 Trees trimmed (each) 8,169 3,677 8,034 8,8898,220 Trees planted (each) 204 81 95 473129 Trees removed (each) 228 205 185 145124 Vehicles serviced - preventative maintenance (each) 455 1,604 1,494 5501,031 Vehicles serviced - repairs (each) 660 656 547 646532 Water: Number of customers 22,961 23,039 23,341 23,31423,336 Annual supply (acre feet) 17,279 15,768 13,911 14,35214,796 Maximum daily capacity 45,000 45,000 45,000 45,00040,000 (thousands of gallons) Sanitary Sewer: Sewer main cleaned (no. of miles) 45 35 70 7877 Vector coating applied to sewer manholes 1,350 1,650 25 1,6501,650 Golf
Golf rounds played 60,152 52,828 58,576 65,65863,574
Police:
course:
Source: Finance Department, City of Downey 193
CITY OF DOWNEY
OPERATING INDICATORS
Last Ten Fiscal Years
2018-192019-202020-212021-222022-23
Police:
Number of arrests4,5163,0162,4642,5352,492
Number of collision reports issued1,0551,0758319571,023
Number of traffic citations issued16,01713,00413,17512,0489,896
Number of reported crimes & incidents9,7367,5557,6258,8348,666
Fire:
Number of emergency incidents
8,0549,0278,3148,9169,042
Number of fire & other incidents 1,3351,2601,1611,7481,621
Number of special service & other incidents377464395345337
Number of traffic accidents1,004632475581575
Parks and Recreation:
Number of general park attendance1,950,0002,250,0001,764,8652,592,9592,792,920
Number of participants in theatre110,000115,000- 97,09295,897
Number of library attendance181,821- 11,629150,030211,721
Public works:
Engineering (CIP related improvement)
Street striping (lineal feet)
19,805887,5094,36069,10170,062
Asphalt replacement (tons)11,95728,56618,92373,65861,517
Trees planted (each)1621413835129
Trees removed (each)- 1926156137
Maintenance
Pavement markings (square feet)12,3867,1542,6392,9332,933
Street stripping (linear feet)- 896- - 1,001
Asphalt repair (tons) 274355311256244
Graffiti removed (square feet)378,070408,418444,339390,236388,260
Trees trimmed (each)8,8738,6467,1836,9907,820
Trees planted (each)5442,0341178167
Trees removed (each)23921212220563
Vehicles serviced - preventative maintenance (each)1,113921827836823
Vehicles serviced - repairs (each)537379267272276
Water:
Number of customers23,48223,55523,01023,04423,489
Annual supply (acre feet)14,29813,80214,28914,45613,228
Maximum daily capacity 40,00040,00040,00040,00040,000 (thousands of gallons)
Sanitary Sewer:
Sewer main cleaned (no. of miles)918586100120
Vector coating applied to sewer manholes1,6501,6501,7501,8001,750
Golf course: Golf rounds played 63,50062,00085,02786,64579,515
Source:
194
Finance Department, City of Downey
CITY OF DOWNEY
CAPITAL ASSET STATISTICS BY FUNCTION
Source: Finance Department, City of Downey
Function 2013-142014-15 2015-162016-172017-18 Public Safety Number of Police stations 1 1 1 1 1 Number of Fire stations 4 4 4 4 4 Highways and streets Miles of streets 210 210 210 210210 Traffic signals 116 116 116 116116 No. of street lights 5,430 5,430 5,430 54305430 Water Number of active water wells20 20 20 2020 Number of reservoirs 1 1 1 1 1 Miles of lines & mains 276 276 276 276276 Sewer Miles of sanitary sewer 187 193 193 193193 Sewer lift station 2 2 2 2 1 Culture and Recreation Number of parks 12 12 12 1212 Number of community centers1 1 1 1 1 Number of golf course 1-18-hole1-18-hole1-18-hole1-18-hole1-18-hole
Last Ten Fiscal Years
195
Function
Highways and streets
CITY OF DOWNEY
CAPITAL ASSET STATISTICS BY FUNCTION
Last Ten Fiscal Years
2018-192019-202020-212021-222022-23
Miles of streets210210210215215
Traffic signals116116118118118
No. of street lights54305436544054405440
Water
Number of active water wells2020202020
Number of reservoirs11111
Miles of lines & mains276276276276276
Sewer
Miles of sanitary sewer193193193193193
Sewer lift station11111
Culture and Recreation
Number of parks1212121313
Number of community centers11111
Number of golf course1-18-hole1-18-hole1-18-hole1-18-hole1-18-hole
Source: Finance Department, City of Downey
196
THIS PAGE INTENTIONALLY LEFT BLANK
197


 Stephen Hannah Director of Finance and Information Technology


 Stephen W Hannah Director of Finance and IT


 Executive Director/CEO