


 By
By

Finance Department Mark Scott Interim City Manager
Anil H. Gandhy

YEAR ENDED 2022 California
Director of Finance and Information Technology Prepared
ANNUAL COMPREHENSIVE FINANCIAL REPORT FISCAL
THIS PAGE INTENTIONALLY LEFT BLANK
CITY OF DOWNEY ANNUAL COMPREHENSIVE FINANCIAL REPORT FOR THE YEAR ENDED JUNE 30, 2022
OF CONTENTS Page Number INTRODUCTORY SECTION Letter of Transmittal ..................................................................................................i Mayor and City Council ......................................................................................... viii Organization Chart .................................................................................................. ix Certificate of Achievement for Excellence in Financial Reporting ............................x FINANCIAL SECTION INDEPENDENT AUDITORS’ REPORT .................................................................. 1 MANAGEMENT'S DISCUSSION AND ANALYSIS ................................................. 5
FINANCIAL STATEMENTS
Financial Statements: Statement of Net Position ........................................................................... 27 Statement
Activities ................................................................................ 28
Statements: Balance Sheet - Governmental Funds ........................................................ 30 Reconciliation of the Balance Sheet of Governmental Funds to the
Net Position ................................................................. 33
Expenditures and Changes
Fund Balances - Governmental Funds ................................................................ 34
the
and Changes
Fund
Funds to the
Activities ................................................................................ 36
-
Funds ........................................... 37
TABLE
BASIC
Government-Wide
of
Fund Financial
Statement of
Statement of Revenues,
in
Reconciliation of
Statement of Revenues, Expenditures
in
Balances of Governmental
Statement of
Statement of Net Position
Proprietary
Statement of Revenues, Expenses and Changes in Fund Net Position - Proprietary Funds................................................................. 38
Statement of Cash Flows - Proprietary Funds
Statement of Fiduciary Net Position - Fiduciary Funds
Statement of Changes in Fiduciary Net Position - Fiduciary Funds
REQUIRED SUPPLEMENTARY INFORMATION
Schedule
Schedule
Schedule
Schedule
Schedule
CITY OF DOWNEY
ANNUAL COMPREHENSIVE FINANCIAL REPORT FOR THE YEAR ENDED JUNE 30, 2022
TABLE OF CONTENTS Page Number
............................................ 39
............................... 40
............ 41
Notes to Financial Statements ......................................................................... 45
of Changes in the Net Pension Liability and Related RatiosMiscellaneous Plan ..................................................................................... 92
of Contributions – Miscellaneous Plan ............................................. 94
of Changes in the Net Pension Liability and Related RatiosSafety Plan ................................................................................................. 96
of Contributions – Safety Plan .......................................................... 98
Schedule of Changes in the Net OPEB Liability and Related Ratios ............. 100
of Contributions - OPEB ................................................................. 101
.................................................................................................
Budgetary Comparison Statement (Budgetary Basis) –General Fund
102
.....................................................
Budgetary Comparison Statement (Budgetary Basis)Housing Authority Special Revenue Fund
103
..................................................................
Budgetary Comparison Statement (Budgetary Basis)CIP Grant Special Revenue Fund
104
.....................................................
Budgetary Comparison Statement (Budgetary Basis)COVID-19 Grants Special Revenue Fund
105
CITY OF DOWNEY ANNUAL COMPREHENSIVE FINANCIAL REPORT FOR THE YEAR ENDED JUNE 30, 2022
OF CONTENTS Page Number Notes to Required Supplementary Information .............................................. 106 COMBINING AND INDIVIDUAL FUND STATEMENTS AND SCHEDULES Combining Balance Sheet - Governmental Funds ......................................... 110 Combining Statement of Revenues, Expenditures and Changes in Fund Balances - Governmental Funds ....................................................... 118 Budgetary Comparison Schedules (Budgetary Basis) - Special Revenue Funds: Waste Reduction Fund ............................................................................. 125 Street Lighting Fund ................................................................................. 126 Home ........................................................................................................ 127 Hazardous Material Fund ......................................................................... 128 CATV Public Access Fund ....................................................................... 129 Air Quality Fund ........................................................................................ 130 Grants Fund.............................................................................................. 131 CDBG Fund .............................................................................................. 132 Asset Forfeiture Fund ............................................................................... 133 Transit Prop C Fund ................................................................................. 134 Transit Prop A Fund ................................................................................. 135 Transit Measure R Fund ........................................................................... 136 Gas Tax .................................................................................................... 137 LSTA Grant............................................................................................... 138 Measure S 2017 LRB ............................................................................... 139 SB 1 Transportation ................................................................................. 140 Measure S (Sales Tax) ............................................................................ 141 Transit Measure M ..................... 142 Measure W – Sewer & Storm Drain .......................................................... 143 Art In Public Places .................................................................................. 144 Measure M Bond 2021A ........................................................................... 145 Measure R Bond 2021B ........................................................................... 146 Budgetary Comparison Schedules (Budgetary Basis) - Capital Project Funds: City Capital Projects Fund ........................................................................ 147
TABLE
CITY OF DOWNEY
ANNUAL COMPREHENSIVE FINANCIAL REPORT
FOR THE YEAR ENDED JUNE 30, 2022
TABLE OF CONTENTS Page Number
COMBINING AND INDIVIDUAL FUND STATEMENTS AND SCHEDULES (Continued)
Combining Statement of Net Position - Internal Service Funds ..................... 150
Combining Statement of Revenues, Expenses and Changes in Fund Net Position - Internal Service Funds ................................................... 151
Combining Statement of Cash Flows - Internal Service Funds ...................... 152
Combining Statement of Fiduciary Net Position –All Custodial Funds ........................................................................................ 154
Combining Statement of Changes in Fiduciary Net Position –All Custodial Funds ........................................................................................ 156
CITY OF DOWNEY
ANNUAL COMPREHENSIVE FINANCIAL REPORT
FOR THE YEAR ENDED JUNE 30, 2022
TABLE OF CONTENTS Page Number
STATISTICAL SECTION
Financial Trends:
Net Position by Component – Last Ten Fiscal Years ............................... 162
Change in Net Position – Expenses and Program Revenues –Last Ten Fiscal Years ............................................................................... 164
Change in Net Position – General Revenues – Last Ten Fiscal Years..... 166 Fund Balances of Governmental Funds – Last Ten Fiscal Years ............. 168
Changes in Fund Balances of Governmental Funds –Last Ten Fiscal Years ............................................................................... 170
Revenue Capacity:
Assessed Valuation – Last Ten Fiscal Years ........................................... 173
Assessed Value of Taxable Property – Last Ten Fiscal Years ................. 174
Direct and Overlapping Property Tax Rates – Last Ten Fiscal Years ....... 176
Principal Property Taxpayers – Current Year and Nine Years Ago .......... 178 Property Tax Levies and Collections – Last Ten Fiscal Years .................. 179
Debt Capacity:
Ratios of Outstanding Debt by Type – Last Ten Fiscal Years .................. 180 Ratios of General Bonded Debt to Assessed Value and Net Bonded Debt per Capita – Last Ten Fiscal Years .............................. 181
Direct and Overlapping Debt .................................................................... 183
Legal Debt Margin Information – Last Ten Fiscal Years ........................... 184 Golf Course Revenue Bond Coverage ..................................................... 186
Demographic and Economic Information:
Demographic and Economic Statistics – Last Ten Calendar Years.......... 187
Principal Employers – Current Year and Nine Years Ago ........................ 189
Operating Information:
Full-Time and Part-Time City Employees by Function –Last Ten Fiscal Years ............................................................................... 190
Operating Indicators by Function – Last Ten Fiscal Years ....................... 192
Capital Asset Statistics by Function – Last Ten Fiscal Years ................... 194
THIS PAGE INTENTIONALLY LEFT BLANK


THIS PAGE INTENTIONALLY LEFT BLANK


i

ii
.
,
iii
iv
v
vi

vii


viii
ix
Certificate of Achievement for Excellence in Financial Reporting
Presented to
City of Downey California
For its Annual Comprehensive Financial Report For the Fiscal Year Ended June 30, 2021
Executive Director/CEO

 Government Finance Officers Association
x


THIS PAGE INTENTIONALLY LEFT BLANK
INDEPENDENT AUDITORS’ REPORT
To the Honorable Mayor and Members of the City Council City of Downey, California
Report on the Financial Statements
Opinions
We have audited the accompanying financial statements of the governmental activities, the business-type activities, each major fund, and the aggregate remaining fund information of the City of Downey, California, (the “City”) as of and for the year ended June 30, 2022, and the related notes to the financial statements, which collectively comprise the City’s basic financial statements as listed in the table of contents.
In our opinion, the financial statements referred to above present fairly, in all material respects, the respective financial position of the governmental activities, the business-type activities, each major fund, and the aggregate remaining fund information of the City as of June 30, 2022, and the respective changes in financial position and, where applicable, cash flows thereof for the year then ended in accordance with accounting principles generally accepted in the United States of America.
Basis for Opinions
We conducted our audit in accordance with auditing standards generally accepted in the United States of America (GAAS) and the standards applicable to financial audits contained in Government Auditing Standards, issued by the Comptroller General of the United States. Our responsibilities under those standards are further described in the Auditor’s Responsibilities for the Audit of the Financial Statements section of our report. We are required to be independent of the City and to meet our other ethical responsibilities, in accordance with the relevant ethical requirements relating to our audits. We believe that the audit evidence we have obtained is sufficient and appropriate to provide a basis for our audit opinions.
Emphasis of Matter
Change in Accounting Principle
As described in Note 1 to the financial statements, in the fiscal year ended June 30, 2022, the City adopted new accounting guidance, GASB Statement No. 87, Leases. Our opinion is not modified with respect to this matter.
Responsibilities of Management for the Financial Statements
Management is responsible for the preparation and fair presentation of these financial statements in accordance with accounting principles generally accepted in the United States of America; and for the design, implementation, and maintenance of internal control relevant to the preparation and fair presentation of financial statements that are free from material misstatement, whether due to fraud or error.
In preparing the financial statements, management is required to evaluate whether there are conditions or events, considered in the aggregate, that raise substantial doubt about the City’s ability to continue as a going concern for twelve months beyond the financial statement date, including any currently known information that may raise substantial doubt shortly thereafter.
Auditor’s Responsibilities for the Audit of the Financial Statements

Our objectives are to obtain reasonable assurance about whether the financial statements as a whole are free from material misstatement, whether due to fraud or error, and to issue an auditor’s report that includes our opinion. Reasonable assurance is a high level of assurance but is not absolute assurance and therefore is not a guarantee that an audit conducted in accordance with GAAS and Government Auditing Standards will always detect a material misstatement when it exists. The risk of not detecting a material misstatement resulting from fraud is higher than for one resulting from error, as fraud may involve collusion, forgery, intentional omissions, misrepresentations, or the override of internal control. Misstatements are considered material if, there is a substantial likelihood that, individually or in the aggregate, they would influence the judgment made by a reasonable user based on the financial statements.
In performing an audit in accordance with GAAS and Government Auditing Standards, we:
Exercise professional judgment and maintain professional skepticism throughout the audit.
Identify and assess the risks of material misstatement of the financial statements, whether due to fraud or error, and design and perform audit procedures responsive to those risks. Such procedures include examining, on a test basis, evidence regarding the amounts and disclosures in the financial statements.
Obtain an understanding of internal control relevant to the audit in order to design audit procedures that are appropriate in the circumstances, but not for the purpose of expressing an opinion on the effectiveness of the City’s internal control. Accordingly, no such opinion is expressed.
Evaluate the appropriateness of accounting policies used and the reasonableness of significant accounting estimates made by management, as well as evaluate the overall presentation of the financial statements.
Conclude whether, in our judgment, there are conditions or events, considered in the aggregate, that raise substantial doubt about the City’s ability to continue as a going concern for a reasonable period of time.
We are required to communicate with those charged with governance regarding, among other matters, the planned scope and timing of the audit, significant audit findings, and certain internal control-related matters that we identified during the audit.
Other Reporting Responsibilities
Required Supplementary Information
Accounting principles generally accepted in the United States of America require that the management’s discussion and analysis, budgetary comparison schedules for the General Fund, Housing Authority, and COVID-19 Grants, the schedule of changes in net pension liability and related ratio, the schedule of employer contributions – pension, the schedule of changes in net OPEB liability and related ratio, and the schedule of contributions – OPEB, as listed on the table of contents, be presented to supplement the basic financial statements. Such information is the responsibility of management and, although not a part
To the Honorable Mayor and Members of the City Council City of Downey, California
2
To the Honorable Mayor and Members of the City Council City of Downey, California
of the basic financial statements, is required by the Governmental Accounting Standards Board, who considers it to be an essential part of financial reporting for placing the basic financial statements in an appropriate operational, economic, or historical context. We have applied certain limited procedures to the required supplementary information in accordance with auditing standards generally accepted in the United States of America, which consisted of inquiries of management about the methods of preparing the information and comparing the information for consistency with management’s responses to our inquiries, the basic financial statements, and other knowledge we obtained during our audit of the basic financial statements. We do not express an opinion or provide any assurance on the information because the limited procedures do not provide us with sufficient evidence to express an opinion or provide any assurance.

Supplementary Information
Our audit was conducted for the purpose of forming opinions on the financial statements that collectively comprise the City’s basic financial statements. The combining and individual nonmajor fund financial statements and budgetary schedules (supplementary information) are presented for purposes of additional analysis and are not a required part of the basic financial statements. Such information is the responsibility of management and was derived from and relates directly to the underlying accounting and other records used to prepare the financial statements. The information has been subjected to the auditing procedures applied in the audit of the basic financial statements and certain additional procedures, including comparing and reconciling such information directly to the underlying accounting and other records used to prepare the basic financial statements or to the basic financial statements themselves, and other additional procedures in accordance with auditing standards generally accepted in the United States of America. In our opinion, the supplementary information is fairly stated, in all material respects in relation to the basic financial statements as a whole.
Other Information
Management is responsible for the other information included in the annual report. The other information comprises the introductory section and statistical section but does not include the basic financial statements and our auditor’s report thereon. Our opinions on the financial statements does not cover the other information, and we do not express an opinion or any form of assurance thereon.
In connection with our audit of the financial statements, our responsibility is to read the other information and consider whether a material inconsistency exists between the other information and the financial statements, or the other information otherwise appears to be materially misstated. If, based on the work performed, we conclude that an uncorrected material misstatement of the other information exists, we are required to describe it in our report.
Other Reporting Required by Government Auditing Standards
In accordance with Government Auditing Standards, we have also issued our report dated December 19, 2022 on our consideration of the City’s internal control over financial reporting and on our tests of its compliance with certain provisions of laws, regulations, contracts, and grant agreements and other matters. The purpose of that report is solely to describe the scope of our testing of internal control over financial reporting and compliance and the results of that testing, and not to provide an opinion on the effectiveness of the City’s internal control over financial reporting or on compliance. That report is an integral part of an audit performed in accordance with Government Auditing Standards in considering the City’s internal control over financial reporting and compliance.
Brea, California
December 19, 2022
3
THIS PAGE INTENTIONALLY LEFT BLANK
4
MANAGEMENT'S DISCUSSION AND ANALYSIS
As management of the City of Downey, we offer readers of the City of Downey’s financial statements this narrative overview and analysis of the financial activities of the City of Downey for the fiscal year ended June 30, 2022. We encourage readers to consider the information presented here in conjunction with additional information that we have furnished in our letter of transmittal, which can be found on pages i-vii of this report. All amounts, unless otherwise indicated, are expressed in millions of dollars.
Financial Highlights
• The assets and deferred outflows of resources of the City exceeded its liabilities and deferred inflows of resources, at June 30, 2022, by $220.6 million (net position). Of this amount, $18.2 million is restricted for low- and moderate-income housing, $9.0 million for public works projects, $65 million for capital projects; $416 thousand is restricted for community development and $3.8 million for public safety.
• At the fiscal year ended June 30, 2022, the government's total net position increased by $44.9 million. The increase in net position is primarily due to implementation of GASB Statement 87. This statement establishes a single model for lease accounting based on the principle that leases are financings of the right to use an underlying asset. As part of assets the category of Leases has a balance of $21.3 million due to the GASB 87. Additionally, the City sold 11.4 acres of land and as a result the City had a gain on sale of $9.0 million. Furthermore, due to the recovering economy Sales Taxes, Charges for Services and Utility Users Taxes revenue increased from prior year by $5 million, $4 million, and $3 million respectively.
• The City's total long-term liabilities decreased by $176 million during the current fiscal year. The decrease is due to the pension pay offs and contribution paid last year from the pension obligation bond issuances $113.5 million.
• As of June 30, 2022, the City's governmental funds reported combined ending fund balances of $97.7 million, an increase of $46.1 million in comparison with the prior year. Approximately 46.45% of this total amount, $45.3 million, is available for spending at the government's discretion (committed, assigned, and unassigned fund balance) within the guidelines of the funding sources.
• As of June 30, 2022, assigned and unassigned fund balance for the general fund was $46 6 million or 45.11% of total general fund expenditures. This represents an increase of $19.4 million or 41.72%, from the prior year. The key reason sale of land for $13 million dollars. The increase is also attributed to growth in sales and property taxes due to the recovering economy and strong housing market. The unassigned fund balance which is unrestricted in use and is designated by City Council for specific purposes at a future City Council meeting.
5
OVERVIEW OF THE BASIC FINANCIAL STATEMENTS
This discussion and analysis are intended to serve as an introduction to the City's basic financial statements. The City's basic financial statements are comprised of three components: 1) government wide financial statements, 2) fund financial statements, and 3) notes to basic financial statements. This report also contains other supplementary information in addition to the basic financial statements themselves.
Government-wide financial statements
The government-wide financial statements are designed to provide the reader with a broad overview of the City's finances, in a manner similar to a private-sector business.
The Statement of Net Position presents information on all of the City's assets and deferred outflows of resources, and liabilities and deferred inflows of resources, including capital assets and long-term liabilities, with the difference between the two reported as net position. Over time, increases or decreases in the net position may serve as a useful indicator of whether the financial position of the City as a whole is improving or deteriorating.
The Statement of Activities presents information showing how the City's net position changed during the most recent fiscal year. All changes in net position are reported as soon as the underlying event giving rise to the change occurs, regardless of the timing of related cash flows. Thus, revenues and expenses are reported in this statement for some items that will only result in cash flows in future fiscal periods (e.g., uncollected taxes and earned but unused vacation leave).
The government-wide financial statements distinguish functions of the City that are principally supported by taxes and intergovernmental revenues (governmental activities). The governmental activities of the City include general government, public safety, public works, community services, community development, unallocated infrastructure depreciation, and interest on long term debt.
The business-type activities of the City include a water utility. sewer and storm drain utility and golf course. The revenue generated from these functions that intended to recover all or a significant portion of their costs through user fees and charges.
The government-wide financial statements include not only the City itself (known as the primary government), but also four legally separate entities: The City of Downey Public Facilities Financing Corporation, the City of Downey Housing Authority, the City of Downey Water Facilities Corporation and The Downey Public Financing Authority. The City is financially accountable for these entities and financial information for these blended component units is reported within the financial information presented for the primary government itself. The government-wide financial statements can be found immediately following this discussion and analysis.
6
Fund financial statements
The fund financial statements focus on current available resources and are organized and operated on the basis of funds. A fund is a self-balancing group of related accounts that is used to maintain control over resources that have been segregated for specific activities or objectives in accordance with special regulations, restrictions or limitations. Like other state and local governments, the City uses fund accounting to ensure and demonstrate compliance with finance-related legal requirements. All of the funds of the City can be divided into three categories: governmental funds, proprietary funds, and fiduciary funds.
Governmental Fund
Governmental funds are used to account for essentially the same functions reported as governmental activities in the government-wide financial statements. However, unlike government-wide financial statements, governmental fund financial statements focus on near-term inflows and outflows of spendable resources, as well as on balances of spendable resources available at the end of the fiscal year. Such information may be useful in evaluating a government's near-term financing requirements.
Because the focus of the government fund is narrower than that of the government-wide financial statements, it is useful to compare the information presented for the governmental funds with similar information presented for governmental activities in the government-wide financial statements. By doing so, readers may better understand the long-term impact of the City's nearterm financing decisions. Both the governmental fund balance sheet and the governmental fund statement of revenues, expenditures, and changes in fund balances provide a reconciliation to facilitate this comparison between governmental funds and governmental activities.
The City maintains various individual governmental funds. Information is presented separately in the Governmental Funds Balance Sheet, and in the Governmental Funds Statement of Revenues, Expenditures, and Changes in Fund Balances, for the General Fund, Housing Authority Special Revenue Fund, CIP Grant Special Revenue Fund, and Covid-19 Grant Special Revenue Fund; all of which are considered to be major funds. Data from other governmental funds are combined into a single, aggregated presentation. Individual fund data for each of these other governmental funds is provided in the form of combining statements elsewhere in this report.
The basic financial statements also include budgetary comparison statements for the General Fund, to demonstrate compliance with the annual budget as adopted and amended.
The basic governmental fund financial statements can be found immediately following the government-wide financial statements.
Proprietary funds
The City maintains two different types of proprietary funds Enterprise funds are used to report the same functions presented as business-type activities in the government-wide financial statements. The City uses its enterprise funds to account for its water utility, sewer and storm drain utility and golf course. Internal service funds are an accounting device used to accumulate
7
and allocate costs internally among the City's various functions. The City uses internal service funds to account for its employee benefits and self-insurance activities, vehicle fleet operations, and miscellaneous equipment replacement and maintenance, and duplication and telecommunications services. Because these services predominantly benefit governmental rather than business-type functions, they have been included with governmental activities in the government-wide financial statements.
Proprietary funds provide the same type of information as the government-wide financial statements, only in more detail. The proprietary funds financial statements provide separate information for all of the enterprise funds, which are considered to be major funds of the City. Conversely, all of the internal service funds are combined into a single, aggregated presentation in the proprietary fund’s financial statements. Individual fund data for the Internal Service funds is provided in the form of combining statements in the Supplementary Schedule section of this report.
Fiduciary funds
Fiduciary funds are used to account for resources held for the benefit of parties outside the government. Fiduciary funds include Special Deposit Fund, Cemetery District Fund, and other funds. Fiduciary funds are not reflected in the government-wide financial statements because the resources of those funds are not available to support the City's own programs. The accounting used for fiduciary funds is similar with that used for proprietary funds. The fiduciary fund financial statements can be found in the Basic Financial Statements section of this report.
Notes to basic financial statements
The notes to the basic financial statements provide additional information that is essential to a full understanding of the data provided in the government-wide and fund financial statements. The notes to the basic financial statements can be found immediately following the basic fiduciary fund financial statements.
Other information
In addition to the basic financial statements and accompanying notes, this report also presents certain required supplementary information concerning the City’s progress in funding its obligation to provide Defined Benefit Pension Plans and Other Post Employment Benefit Plans to its employees. It includes Schedules of Funding Progress for the City Employee Retirement Plan and Postemployment Benefits Other Than Pensions, and Budgetary Comparison Schedules for the General Fund, Housing Authority Special Revenue Funds, CIP Grant Special Revenue Funds, and Covid-19 Special Revenue Fund.
The combining statements referred to earlier in connection with other governmental funds and internal service funds are presented for Other Special Revenue Funds, Other Capital Projects Funds, Internal Service Funds and Fiduciary Funds. These combining and individual fund statements and schedules can be found immediately following the required supplementary information.
8
GOVERNMENT-WIDE FINANCIAL ANALYSIS
The government-wide financial statements provide long-term and short-term information about the City's overall financial condition. This analysis addresses the financial statements of the City as a whole.
In the case of the City of Downey, assets and deferred outflows of resources exceeded liabilities and deferred inflows of resources by $124.5 million for governmental activities and $96.1 million for business-type activities for a total of $220.6 million at the close of the most recent fiscal year.
The largest portion of the City's net position, $307.6 million reflects its net investment in capital assets (e.g., land, buildings and systems, improvements other than buildings, machinery and equipment, infrastructure, and construction in progress); less any related outstanding debt used to acquire those assets. The City's only outstanding debt against financed purchase options are the loans from the federal government and several finance purchase options for public safety vehicles, ambulance and various types of fire equipment. The City uses these financed purchase options to provide services to residents; consequently, these assets are not available for future spending. Although the City's investment in its capital assets is reported net of related debt, it should be noted that the resources needed to repay this debt must be provided from other sources, since the capital assets themselves cannot be used to liquidate these liabilities.
Of the remaining total net position, $97.3 million is restricted to specifically stipulated spending agreements originated by law, contract or other agreements with external parties.
Governmental Activities
The City’s net position in the Governmental activities increased by $41.9 million. The increase in net position is primarily due to implementation of GASB Statement 87. This statement establishes a single model for lease accounting based on the principle that leases are financings of the right to use an underlying Asset. As part of Assets the category of Leases has a balance of $20.2 million due to the GASB 87 as opposed to a zero-balance last fiscal year. Additionally, the City sold 11.4 acres of land and as a result the City had a gain on sale of $9.0 million. Furthermore, due to the recovering economy Sales taxes, Charges for Services and Utility Users Taxes revenue increased from prior year by $5 million, $4 million, and $3 million respectively with a cumulative total of $12.0 million.
9
City of Downey Summary of Net Position
For Fiscal Year Ended June 30, 2022 and 2021 (Amounts Expressed in Thousands)
Governmental ActivitiesBusiness-Type ActivitiesTotal
202220212022202120222021
ASSETS
Current and Other Assets202,002 $ 128,995$ 27,474 $ 25,881 $ 229,476 $ 154,876 $ Capital Assets 278,933 268,342 84,263 82,836 363,196 351,178
Total Assets480,935 397,337 111,737 108,717 592,672 506,054 Deferred Outflows of Resources16,370 136,652 267 5,514 16,637 142,166
LIABILITIES
Current Liabilties 48,744 38,417 6,153 4,574 54,896 42,991 Non-current Liabilities 246,190 411,280 7,397 16,552 253,588 427,832
Total Liabilities 294,934 449,697 13,550 21,126 308,484 470,823 Deferred Inflows of Resources77,801 1,685 2,354 6 80,155 1,691
NET POSITION
Net Investment Capital Assets 231,094 216,976 76,539 74,989 307,633 291,965 Restricted 63,539 36,143 33,854 34,130 97,393 70,273 Unrestricted (170,064) (170,512) (14,293) (16,020) (184,357) (186,532)
Total Net Position124,569 $ 82,607 $ 96,100 $ 93,099 $ 220,669 $ 175,706 $
10
City of Downey Summary of Net Position
For Fiscal Year Ended June 30, 2022 and 2021 (Amounts Expressed in Thousands)
Governmental Activities
Amount Increase
REVENUES:20222021(Decrease)
Program Revenues: Charges for Services 23,322 $ 18,841 $ 4,481 $ Operating Grants and Contributions 19,997 22,682 (2,685) Capital Grants and Contributions 1,007 971 36
General Revenues: Taxes
Property Taxes 32,699 32,208 491 Transient Occupancy Taxes 1,769 1,298 471 Sales and Use Taxes 37,791 32,777 5,014 Property Taxes in Lieu Sales and Use Taxes 12,421 11,192 1,229 Franchise Taxes 3,284 2,982 302 Utilities Users' Taxes 10,394 6,617 3,777 Other Taxes 2,101 2,011 90 Use of Money and Property 49 1,416 (1,367) Gain on Sale of Capital Asset 9,029 91 8,938 Other Revenues 4,334 4,708 (374)
Total Revenues 158,196 137,794 20,402
EXPENSES:
Program Activities
General Government 13,930 19,271 (5,341) Public Safety 64,532 83,139 (18,607) Public Works 15,338 15,176 162 Community Services 9,978 9,281 697 Community Development 6,156 6,636 (480) Interest on Long-term Debts 6,650 3,209 3, 441
Total Expenses 116,584 136, 712 (20,128)
Excess/(Shortage) of Revenues Over Expenses 41,612 1,082 40,530
TRANSFERS: Transfers 351 898 (547) Changes in Net Position 41,963 1,980 39,983 Net Position at Beginning of Year (Restated) 82,606 80,626 1, 980 Net Position at End of Year 124,569 $ 82, 606 $ 41,963 $
11
Top Governmental Activity Revenue Sources

As shown below, our top four general revenues are sales tax, property tax, In-lieu sales and use tax and utility users’ tax accounted for approximately 81.7% of total governmental activities revenues excluding other taxes and other revenues, with franchise taxes at 2.9%, use of money and property accounted for .0042%, transient occupancy tax at 1.5%, gain on sale of capital asset at 7.9%. Generally, revenues for FY 2021-22 increased from those of the prior fiscal year due to the economic recovery.
In‐lieu Sales and Use
Taxes 10.9% Franchise Taxes 2.9% Utilities Users' Taxes 9.1% Other Taxes 1.8% Other Revenues 3.8% Gain on Sale of Capital Assets 7.9%
Transient Occupancy Taxes 1.6%
The following narrative addresses the significant variances in key revenues and expenses from the prior fiscal year:
1. Sales Tax: General sales tax receipts were $5.0 million or 15.30% over prior year. There has been an increase of online retail triggering a rise in Sales Tax Revenue. Additional, consumer confidence grew because of the COVID 19 vaccine, and the government stimulus have formed an economic recovery.
2. Gain on Sale of Capital Asset: The revenues increased by $9.0 million because of the sale of parcel of land and property during the fiscal year.
3. Transient Occupancy Taxes: TOT taxes were $471 thousand or 36.26% over prior year. The upsurge is as a result of increase travel due to the COVID-19 recovery and thus hotel revenue growth.
Sales and Use Taxes 33.2% Governmental Activities ‐General Revenue by Source 2022 12
Use of Money and Property 0.0% Property Taxes 28.7%

4. Property taxes: Property tax increased by $491 thousand over the prior year. Property taxes grew 1.52% thanks to a strong housing sales market.
5. Charges for Services: These revenues increased by approximately $4.4 million or 23.78% from prior year. These revenues were impacted by the pandemic, but this fiscal year have recovered considerably. The City was impacted by decrease in revenue as a result of COVID-19 pandemic closures of The Downey Theatre and Space Center. In addition to continued decline in Parks and Recreation sports supported fees. However, this fiscal year because of the vaccine and COVID-19 recovery all facilities were open and revenues are at a pre-pandemic level.
6. Use of Money and Property: These revenues decreased by $1.3 million or 96.57% less than prior year. Due to reduced gains on investment earnings from the unspent proceeds of 2017 Revenue Bonds. In FY20-21 the ending balance was $500 thousand in FY21-22 a zero balance this fiscal year. The unspent proceeds reduced significantly because of completion of Measure S Capital Projects. In addition, to lower interest rates on investments from prior fiscal year. The City had a market value adjustment of 2.2 million unrealized loss.
7. Program Expenses: Program activities experienced a decrease of $20.1 million or 14.73% from prior year. The large part is due to decreases in the liability for pension and OPEB. The other difference is for the claims and judgement expense of $4.0 million last year while it was only $403 thousand this year.

10,000 20,000
General Governme nt Public Safety Public Works Communit y Services Communit y Developm ent Interest on Long-term Debts 2022 Expenses 13,93064,53215,3389,9786,1566,650 2022 Revenues 10,86013,18415,3632,1772,741Governmental Activities by Program/Function 2022 Revenues 2022 Expenses 13
30,000 40,000 50,000 60,000
Summary of Business-Type Activities

Revenue Sources – charges for services reflect a decrease of $394 thousand or 1.6% from the prior fiscal year. The main revenue decrease is due to a reduced amount of water consumption. This is the result of City mandated water use restrictions to save water during the drought. Variances are as follows:
1. Water revenues - total operating revenues decrease of $678 thousand or 3.59% from the prior year. The city has not changed the water rates. The decrease is due to less water consumption from City’s water customers because of restrictions due to the drought.
2. Sewer revenues – total operating revenues increase by $24 thousand or 1.59% from the prior year.
3. Golf revenues - the overall revenue increase by $261 thousand over prior year. The Golf Course has been open for the entire Fiscal Year and the strong economic recovery has assisted with this recreational activity involvement. Furthermore, golf is an outside sport and there are less COVID -19 restrictions than sports centers or gyms. Consequently, residents favored golf over an inside sport or gym.
BUSINESS-TYPE ACTIVITIES -REVENUE BY SOURCE
Charges for Services,$24,225 99%
Other, $403 , 2% Water, $18,197, 75%
Use of money & property,(149) -1%

Golf, $4,508, 18%
Sewer & Storm Drain, $1,521, 6%
Program Expenses – the program expenses for enterprises funds have a net increase of $5.2 million or an increase of 32.6% over the prior year. From this amount, water activities ended with an increase of $4.9 million and Sewer had an increase of $275 thousand. The increase in expenditures in Water is because of late billings of utility company paid in FY20-21. Golf had $38 thousand or 1.21%. decrease in expenditures.
14
City of Downey Summary of Net Position
Business- Type Activities
For Fiscal Year Ended June 30, 2022 and 2021 (Amounts Expressed in Thousands)
Business-Type Activities
Amount Increase
REVENUES:20222021(Decrease)
Program Revenues: Charges for Services24,226 $ 24,620 $ (394) $ General Revenues: Use of Money and Property(149) 138 (287) Other Revenues403 493 (90)
Total Revenues24,479 25,251 (772)
EXPENSES:
Program Activities Water15,777 10,825 4,952 Golf3,083 3,119 (36) Sewer and Storm Drain2,268 1,933 335 Total Expenses21,128 15,877 5,251
Excess/(Shortage) of Revenues Over Expenses3,351 9,374 (6,023)
TRANSFERS: Transfer-out(351) (898) 547 Changes in Net Position3,000 8,476 (5,476)
Net Position at Beginning of year93,099 84,623 8,476 Net Position at End of year96,099 $ 93,099 $ 3,000 $
15
FINANCIAL ANALYSIS OF THE GOVERNMENT'S FUNDS

As noted earlier, the City uses fund accounting to ensure and demonstrate compliance with finance-related legal requirements. The following funds have been classified as either governmental or proprietary fund types.

Governmental Funds
The focus of the City's governmental funds is to provide information on near-term inflows, outflows, and balances of spendable resources. Such information is useful in assessing the City's financing requirements.
As of June 30, 2022, the City's governmental funds reported combined ending fund balances of $97.7 million, a net increase of $46.1 million or 89.49% over the prior year. Approximately 46.45% of the City’s governmental fund ending fund balances, or $45.4 million, consisted of assigned and unassigned fund balance, which is available for spending at the City’s discretion within the guidelines of the funding sources. The remainder of fund balance, $52.3 million, is either non-spendable or restricted for purposes imposed by creditors, grantors, contributors, laws or regulations of other governments or through enabling legislation. Nonspendable fund balance of $6.9 million is not available for use and are comprised of advances to Successor Agency, notes and loans and prepaid costs. Restricted fund balance of $45.4 million can only be used for specific purposes pursuant to constraints imposed by applicable law and regulations and external parties such as grantors and creditors. The restricted funds are comprised of $3.9 million for public safety, $317 thousand for parks and recreation activity, $9.0 million for public works, $26.7 million for Capital Projects, and $5.5 million for low- and moderate-income housing.
16
General Fund Financial Highlights
The general fund is the chief operating fund of the City. At June 30, 2022, assigned and unassigned fund balance of the general fund was $46.6 million, while total fund balance was $53 4 million. As a measure of the general fund’s liquidity, it is useful to compare committed, assigned and unassigned fund balance to total fund expenditures. Assigned, and unassigned fund balance represents 44.98% of the total general fund expenditures. As mentioned above, however, the City Council has designated all of the committed, assigned, and unassigned fund balance for specified purpose.
For the fiscal year ended June 30, 2022, the cash and investments balance in the general fund was $38.6 million, an increase of $19.7 million from the prior fiscal year. Mainly because of the sale of land $13.8 million. In addition to Sales Tax, UUT and Property Tax deposits.
Other Financing Sources include transfer $8.5 million. Please see note 5 for details on interfund transfers. Additionally, the city sold land for 13.8 million. However, there was an 81% decrease over last year because last fiscal year the City included city bond issuance of $108.4 to pay down CALPERS pension obligation as opposed to this year.
Overall, General Fund revenues for the fiscal year ended June 30, 2022 increased by $6.7 million, or 7 01%, over the prior year. The majority of this increase is attributed to an increase in sales and property taxes due to the recovering economy and strong housing market.
Use of Money and Property Tax decreased due to lower interest rates on investments from prior fiscal year. The General Fund had a market value adjustment of $1.4 million unrealized loss.
City of Downey
General Fund Revenues and Other Financing Sources For Fiscal Year Ended June 30, 2022 and 2021 (Amounts Expressed in Thousands)
2022Percent of2021Percent ofIncrease ActualsTotalActualsTotal(Decrease)
Taxes 81,181 $ 64.7%75,113 $ 35.0%6,068 $ Licenses and Permits 1,781 1.4%1,681 0.8%100
Fines and Forfeitures 1,749 1.4%1,623 0.8%126
Use of Money and Property 248 0.2%1,394 0.6%(1,146)
Intergovernmetal Revenues1,634 1.3%2,405 1.1%(771)
Charges for Services 13,007 10.3%9,786 4.6%3,221
Other Revenues 3,831 3 0% 4,654 2 2% (823) Total Revenues103,431 82.2%96,656 45.1%6,775
Other Financing Sources22,409 17.8% 118,049 55.0% (95,640) Total Revenues & Other Financing Sources125,840 $ 100.0% 214,705 $ 100.1% (88,865) $
17
Expenditures and Other Financing Uses for the General Fund, including comparative amounts from the preceding year, are shown in the following table:
City of Downey General Fund Expenditures and Other Financing Uses
For Fiscal Year Ended June 30, 2022 and 2021 (Amounts Expressed in Thousands)
2022Percent of2021Percent ofIncrease ActualsTotalActualsTotal(Decrease)
General Government12,912 $ 12.1%10,395 $ 4.9%2,516$
Public Safety 63,443 59.3%68,760 32.6%(5,317)
Public Works 10,315 9.7%9,530 4.5%785
Community Services 7,779 7.3%6,956 3.3%823
Community Development 3,567 3.3%3,779 1.8%(212)
Capital Outlay 363 0.3%337 0.2%26
Principal retirement 950 0.9%855 0.4%95 Debt Services 4,071 3.8% 1,430 0.7% 2,641
Total Expenditures 103,400 96.8%102,042 48.3%1,358
Other Financing Uses 3,427 3.3%2,132 0.9%1,294
Extraordinary Items - 0.0% 107,815 50.9% (107,815)
Total Expenditures & Other Financing Sources106,826 $ 100.1% 211,989$ 100.0% (105,162) $
The General Fund’s total expenditures, not including Other Financing Sources, increased by $1.4 million or 1.33%, from the previous fiscal year. All departments’ expenditures increased except the expenditures in Public Safety and Community Development. Changes in expenditures, by function, occurred as follows during the fiscal year ended June 30, 2022:
General Government expenditures increased by $2.5 million, to $12.9 million. Increase in litigation expenditures, general liability insurance premiums and other general administrative expenses.
Public Safety expenditures decreased by $5.3 million, to $63.4 million attributable to the decrease in pension costs.
Public Works expenditures increased by $785 thousand, to $10.3 million, as a result of increased maintenance in land and buildings, cost of living.
18
Community Services expenditures increased by $823 thousand to $7.7 million. as a result of an increase in temporary personal expenditures due to increased attendance to fee supported programs such as gym and pre-school classes. These classes were partially closed in prior fiscal year but are fully open since COVID-19 restrictions have ended.
Debt Service increased in expenditure by $2.6 million mainly because of initial payment toward the Pension Obligation Bond 2021 issued in the amount of $113 million that was used to pay down the cities pension obligation.
Current fiscal year there are no extraordinary transactions. FY20-21 Extraordinary Item of $107 million is the payment to CalPERS pension from the bond proceeds mentioned in the above paragraph.
General Fund Budgetary Highlights
The difference between the general fund original budget expenditures and the final amended budget is $4,497,530.
Per the Agenda Memo dated May 10, 2022, the City Council approved appropriation of $1,851,095 from the General Fund to purchase a ladder truck to replace the 2005 ladder truck currently in service.
Transfer of $931,370 from General Fund reserve to reimburse negative fund balance in Special Revenue Funds Learning Center and Waste Reduction.
The City Council approved September 28, 2021 appropriation to the general fund of $84,072 to upgrade and improve the existing Downey Fire Communications analog UHF and VHF radio signals to digital UHF and VHF signals.
City Council approved November 9, 2021, appropriation of $209,143 from general fund to purchase Playground Equipment for Crawford and Temple Parks. The General Fund will be reimbursed by the State’s Per Capita Program.
Per the Agenda Memo dated November 9, 2021, the City Council approved appropriation of $29,500 from the General Fund to enter into an agreement with Calmet Services Ince for abandoned bulky item collection services.
The City Council approved December 14, 2021 appropriation to the general fund of $253,710 to replace electrical transformers at City Hall, Police Department, Barbara J. Riley Senior Center and replacement of roof at the Downey Theatre.
19
City Council approved January 25, 2022 appropriation of $378,263 from general fund to complete Rio San Gabriel Park Turf Restoration Improvement.
Per Agenda Memo’s in March 2022 the City Council approved appropriation of $136,728 from the General Fund for the shared cost of replacing the filtration system at the Downey High School Pool, per the current joint usage agreement with the Downey Unified School District. Also approved on the same month was appropriation from General Fund of $150,000 to pay for review of new franchise transfer application.
The City Council approved March 22, 2022 appropriation to the general fund of $25,000 to support the Downey Pride Festival.
City Council approved May 24, 2022 appropriation of $300,000 from general fund to complete City Maintenance Yard Pavement Rehabilitation.
Per the Agenda Memo dated June 14, 2022 the City Council approved appropriation of $91,563 from the General Fund for purchase of cardiac monitor and defibrillator units. Also approved on the same day was appropriation from General Fund of $54,589 to pay for replacement of Civic Theatre Exterior Building. Finally, also approved from general fund reserves was $11,641 for purchase of Software One Cloud Server.
In the functional expenditure categories actual expenditures were $4.3 million more than final budgeted amount, totaling $103.4 million, and $99.1 million, respectively. The Finance department was $666 thousand over the actual expenditures as opposed to budget.
In addition, actual revenue exceeded budgetary estimates, by $23.4 million, bringing actual revenue at June 30, 2022 to $160.3 million. The key reason for increase in budget is proceeds from sale of land of $13.8 million, in addition to an increase in revenues from sales tax, charges from services, franchise and other due to the recovery from the pandemic that lead to a strong economy.
Financial Analysis of the Other Major Funds
Housing Authority
The Housing Authority Special Revenue Fund account for revenues generated by housing assets received from former redevelopment agency. The total revenue generated in fiscal year 2021-22 was $234 thousand. The revenues are from housing loan repayments. Total expenditures for the Housing Authority Fund are $56 thousand. The fund balance of $3.7 is restricted for low-and moderate-income housing. The fund balance increased by $179 thousand primarily due to increased collection in subsidy loans. Increase in homeowners who sold their homes during the year also increased the number of homeowners paying off their loans.
20
CIP Grant Fund
The CIP Grant fund is used to account for the majority of City capital improvement projects funded from various federal, state and local sources such as Caltrans, Metropolitan Transit Authority and joint ventures with the Downey Unified School District and surrounding Cities.
The CIP grant had expenditures of $8.1 million and grant revenues of $7 million. The net decrease in fund balance is $1.1 million. The decrease in fund balance is primarily due to reimbursements from various agencies not received within the 90-day timeframe. Revenues not collected within the 90-day period after the city closed its books are booked as unavailable revenues.
As of June 30, 2022, the CIP Grant fund has a negative fund balance of $4.2 million. However, this is offset by the $4.9 million of unavailable revenues. The unavailable revenues are expected to be received in the future, which will eventually cover the negative fund balance.
Below is a description and amount of expenditures for the key projects.
$906 thousand Imperial Highway Signalization & Safety (Caltrans)
$949 thousand Florence Ave. Pavement Rehabilitation (Caltrans)
$4.4 million Telegraph Traffic Safety Enhancement (Caltrans, Pico Rivera, Measure M)
$313 thousand Paramount Blvd. Signal & Safety Enhancement (Caltrans)
$311 thousand Stewart & Gray Rd. Signal & Safety Enhancement (Caltrans)
$369 thousand Street Intersections (Various streets mainly funded by LACMTA)
Expenditures during the year also included other projects such as Safe Routes to School, Bicycle Master Plan, Inspiration Space Shuttle Ed Building, Systematic Safety Analysis Program and Street Improvements.
COVID-19 Grant Fund
Covid-19 grant fund is used to account for all revenues and expenditures related to Covid-19 grant funding. The total grant proceeds spent for FY 2021-22 were $6.7 million of these amounts $6.1 million is from ARPA Grant. The remaining $700 thousand are from the Covid 19 SVOG Theatre Grant, Community Development Block Grant (CDBG) and Justice Assistance Grant (JAG). These grant funds were used for rental assistance, small business support through grants, food drives, senior wellness, distance learning and personal protective equipment.
As of June 30, 2022, the Covid-19 Grant Fund has a negative fund balance of $36,437. This should be offset by the $52,864 unavailable revenue. The net decrease in fund balance of $52,864 is primarily attributable to the revenue from JAG that was not received within 90 days. However, this revenue is expected to be received in the future, which will eventually cover the negative fund balance.
21
CAPITAL ASSET AND DEBT ADMINISTRATION
Capital assets
The City's investment in capital assets for its government and business-type activities at June 30, 2022 amounted to $363.2 million, net of accumulated depreciation. This investment in capital assets includes land, projects in progress, buildings, equipment, fixtures and infrastructures. The total increase over prior fiscal year in the City’s investment in capital assets was $12 million or a 3% increase. The increase is primarily due to projects in progress that were capitalized during the year, mainly in the categories of buildings and infrastructures.
City of Downey
Summary of Captial Assets (Net of Depreciation)
For Fiscal Year Ended June 30, 2022 and 2021 (Amounts Expressed in Thousands)
Governmental ActivitiesBusiness-Type ActivitiesTotal
202220212022202120222021
Land and Improvements26,361 $ 31,373 $ 10,754 $ 10,754 $ 37,115 $ 42,127 $ Projects in Progress24,040 29,007 7,576 6,424 31,616 35,431 Water Rights - - 4,291 4,291 4,291 4,291 Buildings 58,510 51,426 5,419 5,591 63,929 57,017 Land Improvements 20,756 21,979 197 316 20,953 22,295 Machinery & Equipment 10,847 13,117 808 883 11,655 14,000 Furniture & Fixtures - - 630 605 630 605 Right-to-use Leased Asset 1,548 - - - 1,548Infrastructures 136,871 121,441 54,589 53,971 191,460 175,412
Total Capital Assets278,933 $ 268,343 $ 84,264 $ 82,835 $ 363,197 $ 351,178 $
Major capital asset transactions during the current fiscal year included the following:
Projects in progress decreased by $3.8 million, which is the net of a decrease in governmental activities of $5 million and an increase in business-type activities of $1.2 million.
The projects in progress added during the year amounted to $29.2 million minus the capitalized amount of $33 million. The net effect is a decrease of $3.8 million, leaving a balance of $31.6 million in projects in progress as of June 30, 2022. The capitalized amount of $33 million are:
- City Hall, City Library, Fire Station Modernization- $9 million
- Street/Traffic Safety Improvements- $21 million
- Water System & Sewer Improvement- $3 million
Buildings increased by $6.9 million and infrastructures increased by $16 million, mainly due to the fire station modernization and street/traffic safety improvements, respectively.
22
Machinery and Equipment decreased by $1.7 million mainly because the leased assets are now reported under its own category (See Right-to-use assets in the table above).
Additional information on the City's assets can be found in the notes to basic financial statements in note 10.
Long-term liabilities
Total outstanding long-term debt at June 30, 2022 is $209.9 million, an increase of $24.8 million from the prior fiscal year.
City of Downey Summary of Changes in Long-Term Liabilities
(Amounts Expressed in Thousands)
Balance Balance June 30, June 30,Due Within 2021AdditionsReduction2022One-Year Bond 173,184 $ 30,465 $ 4,331 $ 199,318 $ 7,370 $ Financed Purchases 4,735 - 2,053 2,683 542 Lease Payable - 1,960 410 1,550 480 Loans Payable 7,196 - 848 6,348 868
Total 185,115 $ 32,425 $ 7,642 $ 209,899 $ 9,260 $
Long-term debt-related events during the fiscal year ended June 30, 2022 included:
• Bonded debt additions of $30.4 from issuance of Measure M and Measure R Sales Tax Revenue Bonds
• Bonded debt reductions by $4.3 million from debt service payments and amortizations of premiums and discounts.
• Financed purchases decreased by $2 million from debt service payments and lease payable increased by $1.9 million due to the implementation of GASB 87 for leases during the year.
• Loans payable decreased by $848 thousand from debt payments made during the year.
Additional information on the City's long-term liabilities can be found in Note 11 of the Notes to Basic Financial Statements.
ECONOMIC FACTORS AND NEXT YEAR’S BUDGETS AND RATES
As the US economy continues to recover from the effects of COVID-19, there are still many major economic factors that present uncertainty for the local governments. Some of the top factors are
23
local Governments are also faced with its financial impacts and the City continues to assess and navigate through these to minimize the impact on City’s finances.
In spite of all these uncertainties City has focused on strengthening its long-term Fiscal health by using a conservative approach and building its reserves to accomplish its strategic goals. From the Federal Economic Recovery Program ARPA, the City was allocated to receive approximately $25.4 million over two years. These funds helped City to offset some of Covid 19 related cost, recover lost revenues as well as use the funds for certain utility projects. City continued to assist the businesses and residents to recover from Covid-19 by providing business grants and rental assistance to the residents. The funding from the issuance of Measure M and Measure R Sales Tax Revenue bonds for $25.6 million during FY 2021-22 also resulted in starting the residential street and alley repair projects.
After the reopening of businesses from last June along with the development of new businesses such as Footlocker and other new eateries, the City has started to see an improvement in the Sales tax Revenue and based on budget expected to have a steady growth of around 13% over FY 2022-2023. The opening of new SpringHill Suites by Marriot and other hotels in the hospitality industry will bring more visitors to the City which expects to increase TOT revenues. Revenues from fees is expected to increase normally, as the City will be implementing a Consumer Price Index increase on user fees.
As we approach the end of 2022, housing experts are keeping a close eye on the economy, which is still moving in all directions due to the record high inflation rates, rising interest rates and ongoing political uncertainties. Despite of these challenging times and the cooling off of the housing market, the median price of a house in Downey is still around $780,000 and the number of homes sold in Downey were 442 which is still about 10% more when compared to prior year’s numbers. Although there is a possibility of seeing no change in property tax revenues but the increased number of construction projects and new constructions within the City still provides the hope of gradual increase in Property Tax revenues over next few years.
Regardless of these disruptions, 74% of FY 2021-22 budget goals were successfully completed which included the Installation of Solar Roof Mounts at various City facilities, saving the City $10 million over next 25 years. This growth indicates City’s efficiency and effectiveness in navigating through a difficult economic environment while still remaining mindful of complex shifts in US economy resulting from Covid-19 and its aftereffects.
On June 15, 2022, the City Council adopted and approved FY 2022-23 budget with total appropriation of $262.4 million. Adequate resources are available to fund the proposed expenditures. The City Council approved the FY 2022-23 budget with an increase of 19.41% over last year’s general fund budget due to the expenditures included for capital infrastructure needs using the revenues from a one-time real property sale of $13,869,000 that the City received in Fiscal Year 2021-2022.
24
Fees for Services
It is important to note that the City annually reviews all of its fees for services to ensure, when possible, fees collected fully support the cost of providing City services. In June 2022, the City adopted a new fee schedule from a City-wide study which updated the rates for FY 2022-23.
Utility Rates
The City’s water rates were last increased in July 2015. The water rates remain unchanged for FY 2021-22.
REQUESTS FOR INFORMATION
This financial report is designated to provide a general overview of the City's finances for all those with an interest in the City's finances. Questions concerning any of the information provided in this report or requests for additional financial information should be addressed to the Department of Finance & Information Technology, City of Downey, 11111 Brookshire Avenue, Downey, California 90241-0607.
25
THIS PAGE INTENTIONALLY LEFT BLANK
26
STATEMENT OF NET POSITION
GovernmentalBusiness-Type ActivitiesActivities Total
Assets:
Cash and investments 107,758,126 $ 27,688,854 $ 135,446,980 $
Receivables: Accounts 6,952,6604,545,84011,498,500 Taxes 9,030,801-9,030,801
Notes and loans 13,945,396-13,945,396 Accrued interest 528,242-528,242 Leases 20,257,4001,079,57121,336,971
Internal balances 6,214,648(6,214,648)-
Prepaid costs 76,9905,64082,630 Due from other governments 4,260,12353,9774,314,100 Inventories 97,648314,039411,687
Restricted assets: Cash with fiscal agent 24,487,146-24,487,146 Advances to Successor Agency 8,392,454 -8,392,454
Capital assets not being depreciated50,400,69222,620,91373,021,605 Capital assets, net of depreciation 228,532,55461,642,526290,175,080
Total Assets 480,934,880111,736,712592,671,592
Deferred Outflows of Resources:
Deferred pension related items 14,361,095266,55414,627,649 Deferred OPEB related items 2,009,224-2,009,224
Total Deferred Outflows of Resources 16,370,319266,55416,636,873
Liabilities:
Accounts payable 7,434,1204,752,01012,186,130
Accrued liabilities 4,778,736417,6635,196,399
Accrued interest 508,58351,266559,849 Unearned revenue 15,185,35729,39115,214,748
Deposits payable 2,696,69967,5702,764,269 Due to other governments 5,365-5,365
Noncurrent liabilities:
Due within one year Long-term debt 8,602,024 657,703 9,259,737 Compensated absences 5,489,479176,9455,666,424 Claims and judgements 4,504,000 Due in more than one year
Long-term debt 194,018,225 6,621,034 Compensated absences 11,117,429 358,355
- 4,504,000 200,639,259 11,475,784
Claims and judgements 19,972,000-19,972,000 Net OPEB liability 4,943,818-4,943,818
Net pension liability 15,678,812417,93416,096,746
Total Liabilities 294,934,64713,549,871308,484,518
Deferred Inflows of Resources:
Deferred pension related items 54,833,5861,279,26056,112,846
Deferred OPEB related items 2,650,267-2,650,267
Deferred inflow related to leases 20,317,3391,074,74521,392,084
Total Deferred Inflows of Resources 77,801,1922,354,00580,155,197
Net Position (Deficit):
Net investment in capital assets 231,093,80176,538,584307,632,385
Restricted for:
Community development 416,925-416,925
Public safety 3,857,642-3,857,642
Parks and recreation 317,316-317,316
Public works 9,069,366-9,069,366
Capital projects 31,647,06233,385,28165,032,343
Debt service -469,039469,039
Low and moderate income housing18,231,501-18,231,501 Unrestricted (Deficit) (170,064,253)(14,293,514)(184,357,767)
Total Net Position (Deficit) 124,569,360 $ 96,099,390 $ 220,668,750 $
CITY OF DOWNEY
JUNE 30, 2022
See Notes to Financial Statements. 27
Primary Government
STATEMENT OF ACTIVITIES
YEAR ENDED JUNE 30, 2022
Program Revenues
OperatingCapital Charges forContributionsContributions ExpensesServicesand Grantsand Grants
Functions/Programs
Primary Government:
Governmental Activities: General government
13,930,139 $ 9,190,389 $ 1,670,178 $ - $ Public safety 64,531,7715,759,0937,424,517Community development 6,156,1341,734,379 -1,006,938 Community services 9,978,0042,177,179 -Public works 15,337,6044,460,88210,902,453Interest on long-term debt 6,650,405 - - -
Total Governmental Activities116,584,05723,321,92219,997,1481,006,938
Business-Type Activities: 15,777,46618,196,941 -3,083,2924,507,874 -Water Golf Sewer and Storm Drain 2,267,6531,520,769 - -
Total Business-Type Activities21,128,41124,225,584--
Total Primary Government 137,712,468 $ 47,547,506 $ 19,997,148 $ 1,006,938 $
General Revenues: Taxes:
Property taxes, levied for general purpose
Transient occupancy taxes Sales taxes
Property taxes in lieu of sales and use tax Franchise taxes Utility users tax Other taxes Use of money and property Other Gain on sale of capital asset Transfers
Total General Revenues and Transfers
Change in Net Position
Net Position at Beginning of Year
Net Position at End of Year
CITY OF DOWNEY
See Notes to Financial Statements. 28
Net (Expenses) Revenues and Changes in Net Position
Primary Government
GovernmentalBusiness-Type Activities Activities Total
(3,069,572) $ - $ (3,069,572) $ (51,348,161) - (51,348,161) (3,414,817) - (3,414,817) (7,800,825) - (7,800,825) 25,731 - 25,731 (6,650,405) - (6,650,405) (72,258,049) - (72,258,049) - 2,419,475 2,419,475 - 1,424,582 1,424,582 - (746,884) (746,884) - 3,097,173 3,097,173 (72,258,049) 3,097,173 (69,160,876)
32,699,106 - 32,699,106 1,768,645 - 1,768,645 37,790,631 - 37,790,631 12,420,548 - 12,420,548 3,284,024 - 3,284,024 10,393,762 - 10,393,762 2,101,486 - 2,101,486 48,533 (149,321) (100,788) 4,334,289 397,513 4,731,802 9,029,206 5,571 9,034,777 350,682 (350,682)114,220,912 (96,919) 114,123,993 41,962,863 3,000,254 44,963,117 82,606,497 93,099,136 175,705,633 124,569,360 $ 96,099,390 $ 220,668,750 $
See Notes to Financial Statements. 29
BALANCE SHEET GOVERNMENTAL FUNDS JUNE
30, 2022 General
Special Revenue Funds
Housing Authority CIP Grant Fund
Assets: Pooled cash and investments 38,645,934 $ 2,314,900 $ - $ Receivables: Accounts 771,770- 5,803,377 Taxes 7,404,260-Notes and loans 1,108,9677,519,927Accrued interest 197,204331,038Leases 20,257,400-Prepaid costs 6,859 -Due from other governments 1,865,095 - 1,348,887 Due from other funds 7,764,213 -InventoriesRestricted assets: Cash and investments with fiscal agents 258,372 -Advances to Successor Agency 5,766,7051,354,576 -
Total Assets 84,046,779 $ 11,520,441 $ 7,152,264 $
Liabilities, Deferred Inflows of Resources, and Fund Balances (Deficit): Liabilities: Accounts payable 3,019,458 $ 60 $ 665,377 $ Accrued liabilities 4,077,720 - 26,176 Unearned revenuesDeposits payable 2,690,669 -Due to other governmentsDue to other funds 5,796,349
Total Liabilities 9,787,847 606,487,902
Deferred Inflows of Resources: Unavailable revenues 479,4617,850,965 4,955,311 Leases 20,317,339 - -
Total Deferred Inflows of Resources 20,796,8007,850,9654,955,311
Fund Balances: Nonspendable: Prepaid costs 6,859 -Notes and loans 1,108,967 -Advances to Successor Agency 5,766,705 -Restricted for: Public safetyParks and recreationPublic works -
Capital ProjectsLow and moderate income housing -3,669,416Assigned to: Capital projectsUnassigned (Deficit) 46,579,601-(4,290,949)
Total Fund Balances (Deficit) 53,462,1323,669,416(4,290,949)
Total Liabilities, Deferred Inflows of Resources, and Fund Balances (Deficit)84,046,779 $ 11,520,441 $ 7,152,264 $
CITY OF DOWNEY
See Notes to Financial Statements. 30
BALANCE SHEET GOVERNMENTAL FUNDS JUNE
30, 2022
Special Revenue Funds
Assets: Pooled cash and investments Receivables: Accounts Taxes Notes and loans Accrued interest Leases Prepaid costs Due from other governments Due from other funds Inventories
Restricted assets: Cash and investments with fiscal agents Advances to Successor Agency
Total Assets
Liabilities, Deferred Inflows of Resources, and Fund Balances (Deficit): Liabilities: Accounts payable Accrued liabilities Unearned revenues Deposits payable Due to other governments Due to other funds
Total Liabilities
Deferred Inflows of Resources: Unavailable revenues Leases
Total Deferred Inflows of Resources
Fund Balances: Nonspendable: Prepaid costs
Notes and loans Advances to Successor Agency Restricted for: Public safety Parks and recreation Public works
Capital Projects Low and moderate income housing Assigned to: Capital projects Unassigned (Deficit)
Total Fund Balances (Deficit)
Total Liabilities, Deferred Inflows of Resources, and Fund Balances (Deficit)
Covid-19 Grants
Other Total GovernmentalGovernmental Funds Funds 15,172,400 $ 23,801,942 $ 79,935,176 $
52,863318,225 6,946,235 -1,626,541 9,030,801 -5,316,502 13,945,396 528,242 20,257,400 6,859 51,350 986,519 4,251,851 7,764,213 - 10,102 10,102 -24,228,774 24,487,146 7,121,281
15,276,613 $ 56,288,605 $ 174,284,702 $ 56,426 $ 3,503,996 $ 7,245,317 $ 18,403590,758 4,713,057 15,185,357 - 15,185,357 - 6,030 2,696,699 - 5,365 5,365 -1,967,864 7,764,213 15,260,1866,074,01337,610,008 52,8645,337,502 18,676,103 20,317,339 52,8645,337,50238,993,442 - - 6,859 - - 1,108,967 - - 5,766,705
-3,857,642 3,857,642 -317,316 317,316 -9,069,366 9,069,366 -26,691,751 26,691,751 -1,812,508 5,481,924
-4,552,226 4,552,226 (36,437)(1,423,719) 40,828,496 (36,437)44,877,09097,681,252
15,276,613 $ 56,288,605 $ 174,284,702 $
CITY OF DOWNEY
See Notes to Financial Statements. 31
THIS PAGE INTENTIONALLY LEFT BLANK
32
RECONCILIATION OF THE BALANCE SHEET OF GOVERNMENTAL FUNDS TO THE STATEMENT OF NET POSITION JUNE 30, 2022
Fund balances of governmental funds 97,681,252 $
Amounts reported for governmental activities in the statement of net position are different because:
Capital assets net of depreciation have not been included as financial resources in governmental fund activity. 274,725,408
Deferred outflows related to pension items for:
Pension related items:
Miscellaneous contributions made subsequent to measurement date 3,381,108 $ Safety contributions made subsequent to measurement date 9,058,878 Safety differences between expected and actual experience 1,879,796
OPEB related items:
OPEB contributions made subsequent to measurement date 977,849 OPEB changes in assumptions 1,031,37516,329,006
Long-term debt and claims liabilities that have not been included in the governmental fund activity:
Bonds payable (186,456,904)
Unamortized bond premiums/discounts (7,723,072)
Loans payable (3,578,000)
Finance purchases (1,989,466)
Leases payable (608,080)
Claims payable (17,100,582)
Compensated absences (3,977,527)(221,433,631)
Accrued interest payable for the current portion of interest due on Bonds has not been reported in the governmental funds. (508,583)
Governmental funds report all OPEB contributions as expenditures, however in the statement of net position any excesses or deficiencies in contributions in relation to the Actuarially Determined Contribution (ADC) are recorded as an asset or liability. (4,943,818)
Pension liabilities are not included in the governmental fund statements, however they are reported in the governmental activities in the Statement of Net Position:
Miscellaneous net pension liability (5,301,295) Safety net pension liability (10,312,742) (15,614,037)
Deferred inflows related to pension items due to:
Pension related items:
Miscellaneous differences between expected and actual experiences(254,146) Safety differences between expected and actual experiences (2,155,683)
Miscellaneous net difference between projected and actual earnings on pension plan investments (15,972,652)
Safety net difference between projected and actual earnings on pension plan investments (36,252,833)
OPEB related items:
Changes of assumptions (535,188)
OPEB differences between expected and actual experiences(919,327) Net difference between projected and actual earnings on OPEB plan investments(1,195,752)(57,285,581)
Revenues reported as unavailable revenue in the governmental funds and recognized in the statement of activities. These are included in the intergovernmental revenues in the governmental fund activity. 18,676,103
Internal service funds are used by management to charge the costs of certain activities, such as equipment management and self-insurance, to individual funds. The assets and liabilities of the internal service funds must be added to the statement of net position. 16,943,241
Net Position of Governmental Activities 124,569,360 $
CITY OF DOWNEY
See Notes to Financial Statements. 33
STATEMENT OF REVENUES, EXPENDITURES AND CHANGES IN FUND BALANCES GOVERNMENTAL FUNDS
YEAR ENDED JUNE 30, 2022
Special Revenue Funds
Revenues:
General
Housing Authority CIP Grant Fund
Taxes 81,180,592 $ - $ - $ Licenses and permits 1,781,141 -Intergovernmental 1,633,682 - 6,982,732
Charges for services 13,007,414 -Use of money and property 248,292 15,434Fines and forfeitures 1,749,473 -Developer participationMiscellaneous 3,830,620 218,644 -
Total Revenues 103,431,214 234,078 6,982,732
Expenditures:
Current: General government 12,911,817 -Public safety 63,443,026 -Community development 3,566,892 55,570Community services 7,778,787 -Public works 10,315,232 -Capital outlay 362,690 - 8,106,403
Debt service: Principal retirement 950,000 -Interest and fiscal charges 4,071,380 - -
Total Expenditures103,399,82455,570 8,106,403
Excess (Deficiency) of Revenues Over (Under) Expenditures31,390178,508 (1,123,671)
Other Financing Sources (Uses): Transfers in 8,539,114 -Transfers out (3,426,602) -Other debts issuedProceeds from sale of capital assets 13,869,713 -Other financing sources - leases -
Total Other Financing Sources (Uses) 18,982,225- -
Net Change in Fund Balances19,013,615178,508(1,123,671)
Fund Balances (Deficit), Beginning of Year 34,448,5173,490,908 (3,167,278)
Fund Balances (Deficit), End of Year 53,462,132 $ 3,669,416 $ (4,290,949) $
CITY OF DOWNEY
See Notes to Financial Statements. 34
STATEMENT OF REVENUES, EXPENDITURES AND CHANGES IN FUND BALANCES GOVERNMENTAL FUNDS
YEAR ENDED JUNE 30, 2022
Revenues:
Taxes
Licenses and permits Intergovernmental Charges for services Use of money and property Fines and forfeitures Developer participation Miscellaneous
Total Revenues
Expenditures: Current: General government Public safety Community development Community services Public works Capital outlay Debt service: Principal retirement Interest and fiscal charges
Total Expenditures
Excess (Deficiency) of Revenues Over (Under) Expenditures
Other Financing Sources (Uses): Transfers in Transfers out Other debts issued Proceeds from sale of capital assets Other financing sources - leases
Total Other Financing Sources (Uses)
Net Change in Fund Balances
Fund Balances (Deficit), Beginning of Year
Fund Balances (Deficit), End of Year
Special Revenue Funds
Other Total Governmental Governmental Funds Funds - $ 19,032,100 $ 100,212,692 $ 1,781,141 6,734,682 5,125,627 20,476,723 - 2,916,772 15,924,186 - (215,193) 48,533 - 1,975,717 3,725,190 - 1,783,269 1,783,269 - 393,161 4,442,425 6,734,68231,011,453 148,394,159
Covid-19 Grants
43,777 468,694 13,424,288 256,919 1,671,781 65,371,726 700,092 2,211,563 6,534,117 292,492 1,189,322 9,260,601 218,908 3,918,487 14,452,627 -18,263,891 26,732,984 - 4,280,414 5,230,414 - 2,597,928 6,669,308 1,512,18834,602,080 147,676,065 5,222,494 (3,590,627) 718,094 - 4,290,102 12,829,216 (5,275,358)(3,901,873) (12,603,833) -30,465,375 30,465,375 13,869,713 - 853,429 853,429 (5,275,358)31,707,033 45,413,900 (52,864)28,116,40646,131,994 16,42716,760,684 51,549,258 (36,437) $ 44,877,090 $ 97,681,252 $
CITY OF DOWNEY
See Notes to Financial Statements. 35
RECONCILIATION OF THE STATEMENT OF REVENUES, EXPENDITURES, AND CHANGES IN FUND BALANCES OF GOVERNMENTAL FUNDS TO THE STATEMENT OF ACTIVITIES
YEAR ENDED JUNE 30, 2022
Net change in fund balances - total governmental funds 46,131,994 $
Amounts reported for governmental activities in the statement of activities are different because:
Governmental funds report capital outlays as expenditures. However, in the statement of activities, the costs of those assets is allocated over their estimated useful lives as depreciation expense. This is the amount by which capital outlays exceeded depreciation in the current period.
Capital outlay 26,515,586 $ Depreciation (10,070,927)
Proceeds from sale of capital assets (13,869,713) Gain/(loss) on sale of capital assets 8,056,639 10,631,585
Governmental funds report capital outlays as expenditures. However, in the statement Repayment of bond principal is an expenditure in the governmental funds, but the repayment reduces long-term liabilities in the statement of net position.
Principal repayments 4,877,414
Amortization of bond premiums/discounts 396,317
Lease repayments 245,349
Loan repayments 353,0005,872,080
Other debts issued is a other financing sources in the governmental funds, but issuance the increases long-term liabilities in the statement of net position.
Bonds issuance (26,660,000) Bonds premium (3,805,375) Lease issuance (853,429)
Accrued interest for long-term liabilities. This is the net change in accrued interest for the current period. (268,268)
Compensated absences expenses reported in the statement of activities do not require the use of current financial resources and, therefore, are not reported as expenditures in governmental funds. (25,057)
Claims and judgements expenses reported in the statement of activities do not require the use of current financial resources and, therefore, are not reported as expenditures in governmental funds. (403,000)
Governmental funds report all contributions in relation to the actuarially determined contribution (ADC) for OPEB as expenditures, however in the statement of activities only the ADC is an expense. 654,899
Pension obligation expenses reported in the statement of activities do not require the use of current financial resources and, therefore, are not reported as expenditures in the governmental funds. 9,512,411
Revenues reported as unavailable revenue in the governmental funds and recognized in the statement of activities. These are included in the intergovernmental revenues in the governmental fund activity. 772,873
Internal service funds are used by management to charge the costs of certain activities, such as equipment management and self-insurance, to individual funds. The net revenues (expenses) of the internal service funds is reported with governmental activities. 402,150
Change in Net Position of Governmental Activities 41,962,863 $
CITY OF DOWNEY
See Notes to Financial Statements. 36
STATEMENT OF NET POSITION PROPRIETARY FUNDS
JUNE 30, 2022
Assets and Deferred Outflows of Resources:
Business-Type Activities - Enterprise Funds
Water Fund Golf Fund
Sewer and Storm Drain
Governmental ActivitiesInternal TotalsService Funds
Assets: Current: Cash and investments 17,985,917 $ 3,043,390 $ 6,659,547 $ 27,688,854 $ 27,822,950 $ Receivables: Accounts 4,200,975 -344,8654,545,840 6,425 Leases -1,079,571-1,079,571 -
Prepaid costs 4,230 - 1,410 5,640 70,131
Due from other governments 1,00052,977 - 53,977 8,272 Inventories 314,039 - -314,039 87,546 Advance to Successor Agency 1,271,173
Total Current Assets 22,506,1614,175,9387,005,82233,687,92129,266,497
Noncurrent:
Capital assets - net of accumulated depreciation/amortization 42,507,56213,882,93327,872,94484,263,439 4,207,838
Total Noncurrent Assets 42,507,56213,882,93327,872,94484,263,4394,207,838
Total Assets 65,013,72318,058,87134,878,766117,951,36033,474,335
Deferred Outflows of Resources:
Deferred pension related items 208,098 80357,653266,554 41,313
Total Deferred Outflows of Resources 208,098 80357,653266,554 41,313
Total Assets and Deferred Outflows of Resources 65,221,821 $ 18,059,674 $ 34,936,419 $ 118,217,914 $ 33,515,648 $
Liabilities, Deferred Inflows of Resources, and Net Position:
Liabilities:
Current:
Accounts payable
4,544,444 $ 207,236 $ 330 $ 4,752,010 $ 188,803 $ Accrued liabilities 332,6974,59580,371417,66365,679 Accrued interest 6,68442,7041,87851,266Unearned revenues -29,391-29,391Deposits payable 67,570--67,570Accrued compensated absences 133,991 5,77237,182176,9451,511,952 Accrued claims payable ----3,372,000 Bonds, notes, and loans payable 111,401515,00031,302657,703 507,444
Total Current Liabilities 5,196,787804,698151,0636,152,5485,645,878
Noncurrent:
Accrued compensated absences 271,36311,69375,299358,35511,117,429
Accrued claims payable ----4,003,418 Bonds, notes, loans and leases 3,408,3442,255,000957,6906,621,0341,757,283 Net pension liability 326,2801,25990,395417,93464,775
Total Noncurrent Liabilities 4,005,9872,267,9521,123,3847,397,32316,942,905
Total Liabilities 9,202,7743,072,6501,274,44713,549,87122,588,783
Deferred Inflows of Resources:
Deferred pension related items
998,715 3,854276,6911,279,260 198,272
Related to Leases -1,074,745-1,074,745-
Total Deferred Inflows of Resources 998,7151,078,599276,6912,354,005 198,272
Net Position (Deficit):
Net investment in capital assets 38,541,69911,112,93326,883,95276,538,584 2,572,470
Restricted for capital projects - -6,501,3296,501,329Restricted for debt service -469,039 -469,039Unrestricted (Deficit) 16,478,6332,326,453 -18,805,086 8,156,123
Total Net Position (Deficit) 55,020,33213,908,42533,385,281102,314,03810,728,593
Total Liabilities, Deferred Inflows of Resources, and Net Position (Deficit) 65,221,821 $ 18,059,674 $ 34,936,419 $ 118,217,914 $ 33,515,648 $
Reconciliation of Net Position to the Statement of Net Position
Net Position per Statement of Net Position - Proprietary Funds 102,314,038 $
Prior years' accumulated adjustment to reflect the consolidation of internal service funds activities related to the enterprise funds(6,222,974)
Current years' adjustments to reflect the consolidation of internal service activities related to enterprise funds 8,326
Net Position per Statement of Net Position 96,099,390 $
CITY OF DOWNEY
See Notes to Financial Statements. 37
STATEMENT OF REVENUES, EXPENSES AND CHANGES IN FUND NET POSITION PROPRIETARY FUNDS
YEAR ENDED JUNE 30, 2022
Operating Revenues: Sales and service charges
Business-Type Activities - Enterprise Funds
Water Fund Golf Fund
Sewer and Storm Drain
Governmental ActivitiesInternal TotalsService Funds
18,196,941 $ 4,507,874 $ 1,520,769 $ 24,225,584 $ - $ Interdepartmental charges ----5,617,261 Miscellaneous 397,513--397,513400,000
Total Operating Revenues 18,594,4544,507,8741,520,76924,623,0976,017,261
Operating Expenses:
Purchased water 6,466,869 - -6,466,869Maintenance and operations 4,751,8092,584,095237,7877,573,691 2,010,786 General and administrative 3,337,425128,489330,7403,796,654 82,730 Employee benefits 120,666 - 9,689130,355 3,430,533 Depreciation/amortization expense 980,263265,7341,613,6122,859,609 326,688
Total Operating Expenses 15,657,0322,978,3182,191,82820,827,1785,850,737
Operating Income (Loss) 2,937,4221,529,556(671,059)3,795,919166,524
Nonoperating Revenues (Expenses):
Interest revenue (246,898)186,656(89,079)(149,321)Interest expense (128,760)(104,974)(34,054)(267,788)(52,530)
Gain (loss) on disposal of capital assets 5,571 -(41,771)(36,200) 171,183
Total Nonoperating Revenues (Expenses) (370,087)81,682(164,904)(453,309)118,653
Income (Loss) Before Transfers 2,567,3351,611,238(835,963)3,342,610285,177
Transfers in 627,699 -576,6301,204,329 136,500 Transfers out (1,537,998) (494)(16,519)(1,555,011) (11,201)
Changes in Net Position 1,657,0361,610,744(275,852)2,991,928410,476
Net Position:
Beginning of Year
53,363,29612,297,68133,661,13399,322,110 10,318,117 End of Fiscal Year 55,020,332 $ 13,908,425 $ 33,385,281 $ 102,314,038 $ 10,728,593 $
Reconciliation of Changes in Net Position to the Statement of Activities:
Changes in Net Position, per the Statement of Revenues, Expenses and Changes in Fund Net Position - Proprietary Funds 2,991,928 $ Adjustment to reflect the consolidation of current fiscal year internal service funds activities related to enterprise funds 8,326
Changes in Net Position of Business-Type Activities per Statement of Activities 3,000,254 $
CITY OF DOWNEY
See Notes to Financial Statements. 38
STATEMENT OF CASH FLOWS PROPRIETARY FUNDS
YEAR ENDED JUNE 30, 2022
Cash Flows from Operating Activities:
Business-Type Activities - Enterprise Funds
Water Fund Golf Fund
Sewer and Storm Drain
Governmental ActivitiesInternal TotalsService Funds
Cash received from customers and users 18,080,039 $ 4,525,731 $ 1,526,362 $ 24,132,132 $ 5,621,050 $
Cash paid to suppliers for goods and services (1,916,757)(2,660,661)(1,303)(4,578,721) (2,102,226)
Cash paid to employees for services (12,769,675)(110,842)(982,633)(13,863,150) (3,293,892)
Cash received from others 397,513 - -397,513Net Cash Provided (Used) by Operating Activities 3,791,1201,754,228542,4266,087,774 224,932
Cash Flows from Non-Capital Financing Activities:
Cash transfers in 627,699 -576,6301,204,329136,500 Cash transfers out (1,537,998) (494)(16,519)(1,555,011) (11,201)
Advance from other funds 104,749
Net Cash Provided (Used) by Non-Capital Financing Activities (910,299)(53,471)560,111(403,659) 230,048
Cash Flows from Capital and Related Financing Activities:
Acquisition and construction of capital assets (4,175,327)(6,983)(148,695)(4,331,005) (311,288)
Principal paid on capital debt -(495,000)(73,084)(568,084) (94,796) Interest paid on capital debt (122,075)(104,974)(34,000)(261,049) (52,530)
Proceeds(losses) from sales of capital assets 7,396 - - 7,396 196,547 Net Cash Provided (Used) by Capital and Related Financing Activities (4,290,006)(606,957) (255,779)(5,152,742) (262,067)
Cash Flows from Investing Activities: Interest received (246,898)179,025(89,079)(156,952) -
Net Cash Provided (Used) by Investing Activities (246,898)179,025(89,079)(156,952)Net Increase (Decrease) in Cash and Cash Equivalents (1,656,083)1,272,825757,679374,421 192,913
Cash and Cash Equivalents at Beginning of Year 19,642,0001,770,5655,901,86827,314,433 27,630,037 Cash and Cash Equivalents at End of Year 17,985,917 $ 3,043,390 $ 6,659,547 $ 27,688,854 $ 27,822,950 $
Reconciliation of Operating Income to Net Cash Provided (Used) by Operating Activities: Operating income (loss) 2,937,422 $ 1,529,556 $ (671,059) $ 3,795,919 $ 166,524 $ Adjustments to Reconcile Operating Income (loss) Net Cash Provided (used) by Operating Activities: Depreciation/amortization 980,263265,7341,613,6122,859,609 326,688 (Increase) decrease in accounts receivable (116,457) - 5,593(110,864) 3,789 (Increase) decrease in due from other governments - - - - 27,498 (Increase) decrease in inventories 39,926 - - 39,926 (24,122) (Increase) decrease in prepaid expense (4,230) - (1,410) (5,640) (12,664) (Increase) decrease in deferred pension related outflows 4,096,672 (803)1,151,9185,247,787 728,413
Increase (decrease) in accounts payable 1,505,638(76,566) 1071,429,179 (41,354) Increase (decrease) in accrued liabilities19,441250(3,911)15,7804,759
Increase (decrease) in deposits payable (445) - - (445)Increase (decrease) in unearned revenue -22,683 - 22,683Increase (decrease) in compensated absences (140,732)13,087 5,613(122,032) 7,434 Increase (decrease) in net pension liability (6,520,505) 1,259(1,833,440)(8,352,686) (1,159,485) Increase (decrease) in deferred pension related inflows 994,127 3,854275,4031,273,384 197,452 (Increase) decrease in leases receivable -(1,079,571) -(1,079,571)Increase (decrease) in deferred leases revenue inflows -1,074,745 -1,074,745 -
Total Adjustments 853,698224,6721,213,4852,291,855 58,408
Net Cash Provided (Used) by Operating Activities 3,791,120 $ 1,754,228 $ 542,426 $ 6,087,774 $ 224,932 $
Non-Cash Investing, Capital, and Financing Activities: Gain (Loss) on disposal of capital assets 5,571 $ - $ 41,771 $ 47,342 $ 90,875 $
CITY OF DOWNEY
See Notes to Financial Statements. 39
STATEMENT OF FIDUCIARY NET POSITION FIDUCIARY FUNDS JUNE
30, 2022
PrivatePurpose Trust Fund
Assets: Cash and investments
Custodial Funds
1,672,957 $ 6,383,602 $
Receivables: Accounts - 48,575 Taxes - 3,750 Restricted cash and investments with fiscal agents 643,250Accrued interest receivable - 976 Due from other governments - 18,001 Advances to other funds - 2,800
Capital assets: Capital assets, not being depreciated - 110,490 Capital assets, net of accumulated depreciation - 3,099,979
Total Assets 2,316,2079,668,173
Liabilities: Accounts payable - 526,601 Accrued liabilities - 600,686 Accrued interest 78,797Unearned revenues - 66,917 Deposits payable 2,500 31,967 Due to other governments - 5,835 Long- term Liabilities Due in one year Bonds payable 450,000Due in more than one year Bonds payable 3,240,000 22,629 Advances from the City 8,392,454Advances from the County 38,184,552Total Liabilities 50,348,3031,254,635
Net Position (Deficit): Restricted for organizations and other governments - 8,413,538 Restricted for other purposes (48,032,096)Total Net Position (Deficit) (48,032,096) $ 8,413,538 $
CITY OF DOWNEY, CALIFORNIA
See Notes to Financial Statements. 40
CITY OF DOWNEY, CALIFORNIA
STATEMENT OF CHANGES IN FIDUCIARY NET POSITION
FUNDS FOR THE YEAR ENDED JUNE 30, 2022
FIDUCIARY
PrivatePurpose Trust Fund
Custodial Funds
Additions:
Taxes 1,636,325 $ 99,575 $ Intergovernmental - 6,331,652 Interest and change in fair value of investments (24,503) (62,067) Miscellaneous - 397,057
Total Additions 1,611,8226,766,217
Deductions:
Benefits - 14,159
Administrative expenses 125,000 4,862,547 Contractual services 4,590 155,322
Capital outlay - 134,334 Interest expense 2,921,401Depreciation expense - 213,197
Total Deductions 3,050,9915,379,559
Net Increase in Fiduciary Net Position (1,439,169)1,386,658
Net Position (Deficit) - Beginning (46,592,927) 6,815,109
Restatement of Net Position - 211,771 Net Position - Beginning, as Restated (46,592,927) 7,026,880
Net Position (Deficit) - Ending (48,032,096) $ 8,413,538 $
See Notes to Financial Statements. 41
42
THIS PAGE INTENTIONALLY LEFT BLANK


43
THIS PAGE INTENTIONALLY LEFT BLANK
44
NOTES TO FINANCIAL STATEMENTS FOR THE YEAR ENDED JUNE 30, 2022
I. SIGNIFICANT ACCOUNTING POLICIES
Note 1: Organization and Summary of Significant Accounting Policies
a. Description of Entity
The basic financial statements of the City of Downey (the City) include the activities of the City of Downey Public Facilities Financing Corporation (the Corporation) the City of Downey Housing Authority (the Housing Authority) and the City of Downey Public Financing Authority (the Financing Authority).
The City of Downey was incorporated in 1956 under the General Laws of the State of California and became a charter City in 1964. The City operates under a Council-Manager form of government governed by a five-member council and provides the following services: public safety (police, fire, paramedic and ambulance), highways and streets, parks and recreation, public improvements, planning and zoning, and general administrative services.
The criteria used in determining the scope of the reporting entity are based on the provisions of the Governmental Accounting Standards Board (GASB). The City of Downey is the primary government unit. Component units are those entities which are financially accountable to the primary government, either because the City appoints a voting majority of the component unit’s board, or because the component unit will provide a financial benefit or impose a financial burden on the City. The City has accounted for the Corporation and Housing Authority as “blended” component units. Despite being legally separate, these entities are so intertwined with the City that they are, in substance, part of the City’s operations. Accordingly, these basic financial statements present the City and its component units, the City of Downey Public Facilities Financing Corporation, Housing Authority, and Public Financing Authority. Each blended component unit has a June 30 year end.
The City of Downey Public Facilities Financing Corporation, formerly known as City of Downey Civic Center Corporation, is a non-profit corporation organized June 1, 1981 for the purpose of assisting, through the issuance of revenue bonds, the financing necessary to construct public buildings and facilities for the City. The activities of the Corporation are reported in the proprietary fund financial statements as part of the golf enterprise fund. The Corporation prepares separate Basic Financial Statements and a copy can be obtained from the City’s Finance Department.
The City of Downey Housing Authority was established by the City Council on October 22, 1974 and is responsible for the administration of providing affordable housing in the City. The Housing Authority provides services entirely to the City and is governed by a five-member Board of Director which consists of members of the City Council. The City has operational responsibility over the Housing Authority. The Housing Authority’s financial transactions are reported in the Special Revenue Funds. The Housing Authority does not prepare separate Basic Financial Statements.
The City of Downey Public Financing Authority was created by the City of Downey Public Financing Authority under a Joint exercise of Powers Agreement to assist the Public Financing Authority in financing capital improvement projects, through the issuance of Lease Revenue Bonds. The Authority’s assets and liabilities are presented in the Measure S 2017 LRB fund and Measure M and R Bonds.
CITY OF DOWNEY
45
NOTES
TO FINANCIAL STATEMENTS
(CONTINUED) FOR THE YEAR ENDED JUNE 30, 2022
Note 1: Organization and Summary of Significant Accounting Policies (Continued)
b. Government-Wide and Fund Financial Statements
The government-wide financial statements (i.e., the statement of net position and the statement of activities) report information on all of the nonfiduciary activities of the primary government and its component units. For the most part, the effect of interfund activity has been removed from these statements. Governmental activities, which normally are supported by taxes and intergovernmental revenues, are reported separately from business-type activities, which rely to a significant extent on fees and charges for support. Likewise, the primary government (including its blended component units) is reported separately from discretely presented component units for which the primary government is financially accountable. The City has no discretely presented component units.
Certain eliminations have been made as prescribed by the GASB in regard to interfund activities, payables and receivables. All internal balances in the Statement of Net Position have been eliminated except those representing balances between the governmental activities and the business-type activities, which are presented as internal balances and eliminated in the total primary government column. In the Statement of Activities, internal service fund transactions have been eliminated; however, those transactions between governmental and business-type activities have not been eliminated.
The statement of activities demonstrates the degree to which the direct expenses of a given function or segment is offset by program revenues. Direct expenses are those that are clearly identifiable with a specific function or segment. Program revenues include: 1) charges to customers or applicants who purchase, use or directly benefit from goods, services or privileges provided by a given function or segment, and 2) grants and contributions that are restricted to meeting the operational or capital requirements of a particular function or segment. Taxes and other items not properly included among program revenues are reported instead as general revenues.
The underlying accounting system of the City is organized and operated on the basis of separate funds, each of which is considered to be a separate ac counting entity. The operations of each fund are accounted for with a separate set of self-balancing accounts that comprise its assets, deferred outflows of resources, liabilities, deferred inflows of resources, fund equity, revenues and expenditures or expenses, as appropriate. Governmental resources are allocated to and accounted for in individual funds based upon the purposes for which they are to be spent and the means by which spending activities are controlled.
Separate financial statements for the City’s governmental, proprietary, and fiduciary funds are presented after the government-wide financial statements. These statements display information about major funds individually and other funds in the aggregate for governmental and enterprise funds. Fiduciary statements, even though excluded from the government-wide financial statements, include financial information that represent the private purpose trust fund and custodial funds.
c. Measurement Focus, Basis of Accounting and Financial Statement Presentation
The government-wide financial statements are reported using the economic resources measurement focus and the accrual basis of accounting, as are the proprietary and private purpose trust fund financial statements. Under the economic resources measurement focus, all assets, deferred outflows of resources, liabilities, and deferred inflows of
CITY OF DOWNEY
46
NOTES TO
FINANCIAL STATEMENTS
(CONTINUED) FOR THE YEAR ENDED JUNE 30, 2022
Note 1: Organization and Summary of Significant Accounting Policies (Continued)
resources (whether current or noncurrent) associated with their activity are included on their Statements of Net Position. Operating statements present increases (revenues) and decreases (expenses) in total net position. Under the accrual basis of accounting, revenues are recorded when earned and expenses are recorded when a liability is incurred, regardless of the timing of related cash flows.
Proprietary funds distinguish operating revenues and expenses from nonoperating items. Operating revenues and expenses generally result from providing services and producing and delivering goods in connection with a proprietary fund’s principal ongoing operations.
Nonexchange transactions, in which the City gives (or receives) value without directly receiving (or giving) equal value in exchange include property taxes, grants, entitlements, and donations. On an accrual basis, revenue from property taxes is recognized in the fiscal year in which the taxes are levied. Revenue from grants, entitlements, and donations is recognized in the fiscal year in which all the eligibility requirements have been satisfied. Operating expenses for proprietary funds include the cost of sales and services, administrative expenses, and depreciation on capital assets. All revenues and expenses not meeting this definition are reported as nonoperating revenues and expenses.
Governmental fund financial statements are reported using the current financial resources measurement focus and the modified accrual basis of accounting. Under the current financial resources measurement focus, only current assets and deferred outflows of resources and current liabilities and deferred inflows of resources are generally included on the balance sheets. The reported fund balance (net current assets) is considered to be a measure of “available spendable resources.” Governmental fund operating statements present increases (revenues and other financing sources) and decreases (expenditures and other financing uses) in net current assets. Accordingly, they are said to present a summary of sources and uses of “available spendable resources” during a period. Noncurrent portions of long-term receivables due to governmental funds are reported on their balance sheets in spite of their spending measurement focus. However, special reporting treatments are used to indicate that they should not be considered “available spendable resources” since they do not represent net current assets. Recognition of governmental fund type revenue represented by noncurrent receivables is reported as deferred inflows of resources.
Under the modified accrual basis of accounting, revenues are considered to be available when they are collectible within the current period or soon enough thereafter to pay liabilities of the current period. For this purpose, the City considers revenues to be available if they are collected within 90 days of the end of the current fiscal period. Expenditures generally are recorded when a liability is incurred, except for principal and interest on long-term liabilities, claims and judgments, and compensated absences which are recognized as expenditures to the extent they have matured. Capital asset acquisitions are reported as expenditures in governmental funds. Proceeds of long-term liabilities are reported as other financing sources.
Property taxes, franchise taxes, licenses and interest associated with the current fiscal period are all considered to be susceptible to accrual and so have been recognized as revenues of the current fiscal period. Only the portion of special assessments receivable due within the current fiscal period is considered to be susceptible to accrual as revenue of the current period. All other revenue items are considered to be measurable and available only when the government receives cash.
CITY OF DOWNEY
47
NOTES
TO FINANCIAL STATEMENTS
(CONTINUED) FOR THE YEAR ENDED JUNE 30, 2022
Note 1: Organization and Summary of Significant Accounting Policies (Continued)
The City’s Fiduciary Funds consists of the private purpose trust fund which is reported using the economic resources measurement focus and the accrual basis for reporting its assets and liabilities.
d. Fund Classifications
The City reports the following major governmental funds:
The General Fund is the general operating fund of the City. All general tax receipts and fee revenue not allocated by law, Council policy or contractual agreement to other funds are accounted for in the General Fund. General Fund expenditures include operations traditionally associated with activities, which are not required to be accounted for or paid by another fund.
The Housing Authority Fund is used to account for revenues generated by housing assets received from former redevelopment agency and associated expenditures to be used for increasing or improving low- and moderate-income housing.
The CIP Grant Fund is used to account for revenues received for various street and infrastructure capital improvements.
The COVID-19 Grants Fund is used to account for special revenues from federal funding and payments from funding due to the coronavirus pandemic.
The City reports the following major proprietary funds:
The Water Fund is used to account for the provision of water services to residential, commercial and industrial customers.
The Golf Fund is used to account for all revenues and expenses related to the Cityoperated golf course, driving range and clubhouse.
The Sewer and Storm Drain Fund is used to account for charges collected for the upkeep of sanitary sewers and federally required drainage upkeep programs.
The City’s fund structure also includes the following fund types:
The Special Revenue Funds are used to account for proceeds of specific revenue sources that are legally restricted or otherwise restricted for specific purposes.
The Capital Projects Funds are used to account for financial resources used for the acquisition or construction of major capital facilities.
The Internal Service Funds are used to account for the financing of special activities that provide services within the City. These activities include compensation and other employee benefits, and equipment purchase and maintenance.
The Private-Purpose Trust Fund is used to account for the activities of the Successor Agency to the Community Development Commission of the City of Downey.
The Custodial Funds are used to account for money and property held by the City as trustee, agent, or custodian.
CITY OF DOWNEY
48
NOTES TO
FINANCIAL STATEMENTS
(CONTINUED) FOR THE YEAR ENDED JUNE 30, 2022
Note 1: Organization and Summary of Significant Accounting Policies (Continued)
The City’s fund structure also includes the following departmental classifications:
Operating expenditures of the City are classified by department. Departmental classifications are defined as follows:
General Government Department includes the legislative, city clerk, city attorney, city manager, personnel, finance, purchasing, and information technology divisions.
Public Safety Department includes police, fire and paramedic, and animal control operations.
Public Works Department includes maintenance and engineering divisions.
Community Services Department includes the recreation, theatre, social services, and the library divisions.
Community Development Department includes planning, redevelopment and building safety divisions.
e. Cash and Investments
The City pools idle cash from all funds for purposes of increasing income through investment activities. Investments are stated at fair value (quoted market price or best available estimate thereof). The City intends to either hold the investments until maturity or until market values equal or exceed cost. Interest income on investments is allocated among funds on the basis of average monthly cash and investment balances (see Note 4).
f. Accounts Receivable
The City extends credit to customers in the normal course of operations. The City accounts for potential losses in accounts receivable utilizing the allowance method. Management evaluates all accounts receivable and if it is determined that they are uncollectible they are written off as a bad debt expense.
g. Inventories
Inventories are valued at cost on a first-in first-out basis and are accounted for under the consumption method, whereby inventories are capitalized and recorded as expenditures as used. Water Enterprise Fund inventories consist primarily of water pipes, valves, and fittings. Inventories of fuel are recorded in the Equipment Internal Service Fund.
h. Capital Assets
Capital assets are recorded at cost where historical records are available and at an estimated original cost where no historical records exist. Donated assets and capital assets received in a service concession arrangement would be reported at acquisition value. Generally, capital asset purchases in excess of $5,000 are capitalized if they have an expected useful life of 1 year or more.
CITY OF DOWNEY
49
NOTES TO FINANCIAL STATEMENTS (CONTINUED) FOR THE YEAR ENDED JUNE 30, 2022
Note 1: Organization and Summary of Significant Accounting Policies (Continued)
Capital assets include additions to public domain (infrastructure), certain improvements including pavement, curb and gutter, sidewalks, traffic control devices, streetlights, sewers, bridges and right-of-way corridors within the City. The City has valued and recorded all infrastructure asset data as of June 30, 2014.
Capital assets used in operations are depreciated over their estimated useful lives using the straight-line method in the Government-wide Financial Statements and in the Fund Financial Statements of the Enterprise Funds. Depreciation is charged as an expense against operations and accumulated depreciation is reported on the respective Statements of Net Position.
The lives used for depreciation purposes of each capital asset class are:
Buildings ......................................................................................................... 50 years
Improvements other than buildings ................................................................ 20 years Water distribution lines ................................................................................... 50 years Water tanks, meters, hydrants, and other equipment ............ 15 to 40 years
Vehicles ...................................................... 3 to 15 years
Machinery and equipment ....................................... 5 to 10 years
Office furniture, computers and equipment .................................................... 10 years Infrastructure ................................................ 20 to 50 years
Right-to-use assets - vehicles ................................ Shorter of the leased asset’s Useful life or the lease term
i. Deferred Outflows/Inflows of Resources
In addition to assets, the Statement of Net Position and governmental balance sheet will sometimes report a separate section for deferred outflows of resources. This separate financial statement element, deferred outflows of resources, represents a consumption of net assets that applies to a future period(s) and so will not be recognized as an outflow of resources (expense/expenditure) until then. The City has two items that qualify for reporting in this category, the deferred outflows relating to the deferred pension related items, and deferred OPEB related items, reported in the statements of net position. These outflows are the results of contributions made after the measurement period, which are recognized in the following year.
In addition to liabilities, the Statement of Net Position and Governmental Balance Sheet will sometimes report a separate section for deferred inflows of resources. This separate financial statement element, deferred inflows of resources, represents an acquisition of net assets that applies to a future period(s) and will not be recognized as an inflow of resources (revenue) until that time. The City has three types of items in this category. One arises only under a modified accrual basis of accounting that qualifies for reporting in this category. Accordingly, the item, unavailable revenues, is reported only in the governmental fund balance sheet. The governmental funds report unavailable revenues from two sources: taxes and long-term notes receivable. These amounts are deferred and recognized as an inflow of resources in the period that the amounts become available. The second item is in relation to the net pension liability and net OPEB liability, reported in the statement of net position. Gains and losses related to changes in total pension liability, total OPEB liability and fiduciary net position are recognized in pension or OPEB expense systematically over time. Amounts are first recognized in pension or OPEB expense for the year the gain or loss occurs. The remaining amounts are categorized as deferred outflows and deferred inflows of resources related to pension or OPEB and are to be recognized in future pension or OPEB expense. The third item relates to leases where the City is the lessor and relates to the future payments that will be recognized in future years.
CITY OF DOWNEY
50
NOTES TO
FINANCIAL STATEMENTS
(CONTINUED) FOR THE YEAR ENDED JUNE 30, 2022
Note 1: Organization and Summary of Significant Accounting Policies (Continued)
The recognition period differs depending on the source of the gain or loss:
Net difference between projected and actual earning on pension or OPEB plan investments
All other amounts
5 years
Expected average remaining service lifetime (EARSL) for the OPEB plan, Miscellaneous pension plan, and Safety pension plan are 7.68 Years, 2.1 Years, and 3.3 Years, respectively at June 30, 2021)
j. Net Position Flow Assumptions
Sometimes the City will fund outlays for a particular purpose from both restricted (e.g., restricted bond or grant proceeds) and unrestricted resources. In order to calculate the amounts to report as restricted - net position and unrestricted - net position in the government-wide and proprietary fund financial statements, a flow assumption must be made about the order in which the resources are considered to be applied.
It is the City’s practice to consider restricted - net position to have been depleted before unrestricted - net position is applied.
k. Fund Balance
The fund balances reported on the fund statements consist of the following categories: Nonspendable Fund Balance - This classification includes amounts that cannot be spent because they are either (a) not in spendable form or (b) legally or contractually required to be maintained intact.
Restricted Fund Balance - This classification includes amounts that can be spent only for specific purposes stipulated by constitution, external resource providers or through enabling legislation.
Committed Fund Balance - This classification includes amounts that can be used only for the specific purposes determined by a formal action of the government’s highest level of decision-making authority. The governing council is the highest level of decision-making authority for the government that can, by adoption of an ordinance prior to the end of the fiscal year, commit fund balance. Once adopted, the limitation imposed by the ordinance remains in place until a similar action is taken (the adoption of another ordinance) to remove or revise the limitation.
Assigned Fund Balance - This classification includes amounts intended to be used by the government for specific purposes but do not meet the criteria to be classified as committed. The governing council (council) has authorized the finance director to assign fund balance. The council may also assign fund balance as it does when appropriating fund balance to cover a gap between estimated revenue and appropriations in the subsequent year’s appropriated budget. Unlike commitments, assignments generally only exist temporarily. In other words, an additional action does not normally have to be taken for the removal of an assignment. Conversely, as discussed above, an additional action is essential to either remove or revise a commitment.
CITY OF DOWNEY
51
NOTES TO
FINANCIAL STATEMENTS
(CONTINUED) FOR THE YEAR ENDED JUNE 30, 2022
Note 1: Organization and Summary of Significant Accounting Policies (Continued)
Unassigned Fund Balance - This classification includes the residual balance for the government’s general fund and includes all spendable amounts not contained in other classifications. In other funds, the unassigned classification is used only to report a deficit balance resulting from overspending for specific purposes for which amounts had been restricted, committed or assigned.
When an expenditure is incurred for purposes for which both restricted and unrestricted fund balances are available, the City’s policy is to apply restricted fund balance first.
When an expenditure is incurred for purposes for which committed, assigned or unassigned fund balances are available, the City’s policy is to apply committed fund balance first, then assigned fund balance, and finally unassigned fund balance.
l. Compensated Absences
The City is obligated to pay all unused vacation to all employees. All vacation is accrued when incurred in the government-wide and proprietary fund financial statements. Governmental fund types recognize the vested vacation time as an expenditure in the current year to the extent it is paid during the year.
m. Claims and Judgments
Expenditures for claims and judgments are recognized when it is probable that the liability has been incurred at year-end and the amount of the loss can be reasonably estimated. Claims payable, which will be liquidated from current resources, are recorded in the General Fund and Internal Service Funds.
n. Pensions
For purposes of measuring the net pension liability, deferred outflows and inflows of resources related to pensions, and pension expense, information about the fiduciary net position and additions to/deductions from the fiduciary net position have been determined on the same basis as they are reported by the CalPERS Financial Office. For this purpose, benefit payments (including refunds of employee contributions) are recognized when currently due and payable in accordance with the benefit terms. Investments are reported at fair value. CalPERS audited financial statements are publicly available reports that can be obtained at CalPERS’ website under Forms and Publications.
GASB 68 requires that the reported results must pertain to liability and asset information within certain defined timeframes. For this report, the following timeframes are used:
Valuation Date (VD): June 30, 2020 Measurement Date (MD): June 30, 2021 Measurement Period (MP): July 1, 2020 to June 30, 2021
o. Other Post-Employment Benefits (OPEB) Liability
For purposes of measuring the net OPEB liability, deferred outflows of resources and deferred inflows of resources related to OPEB, and OPEB expense, information about the fiduciary net position of the City’s plan (OPEB Plan), the assets of which are held by the California Employers’ Retiree Benefit Trust Program (CERBT), and additions to/deductions from the OPEB Plan’s fiduciary net position have been determined by an independent actuary. For this purpose, benefit payments are recognized when currently due and payable in accordance with the benefit terms. Investments are reported at fair value.
CITY OF DOWNEY
52
NOTES TO
FINANCIAL STATEMENTS
(CONTINUED) FOR THE YEAR ENDED JUNE 30, 2022
Note 1: Organization and Summary of Significant Accounting Policies (Continued)
Generally accepted accounting principles require that the reported results must pertain to liability and asset information within certain defined timeframes. For this report, the following timeframes are used:
Valuation Date (VD) June 30, 2021 Measurement Date (MD) June 30, 2021 Measurement Period (MP) July 1, 2020 to June 30, 2021
p. Statement of Cash Flows
A substantial portion of the City’s investments are in short-term, highly liquid instruments, with original maturities of three months or less (excluding fiscal agent investments). The Enterprise and Internal Service Funds participate in the pooling of City-wide cash and investments. Amounts from the pool are available to these funds on demand. As a result, the cash and investments for the Enterprise and Internal Services Funds are considered to be cash and cash equivalents for the statement of cash flows purposes.
q. Use of Estimates
The preparation of financial statements in conformity with accounting principles generally accepted in the United States of America requires management to make estimates and assumptions that affect the reported amounts of assets and liabilities and disclosure of contingent assets and liabilities at the date of the financial statements and the reported amounts of revenues and expenditures during the reporting period. Specifically, the City has made certain estimates and assumptions relating to the collectability of its accounts and notes receivable, depreciation of capital assets, amounts due from other funds and amounts advanced to other funds, the valuation of property held for resale, and the ultimate outcome of claims and judgments. Actual results could differ from those estimates and assumptions.
r. Leases
Lessee - The City is a lessee for noncancellable leases of equipment. The City recognizes a lease liability and an intangible right to use lease asset (lease asset) in the financial statements. The City recognizes lease liabilities with an initial, individual value of $10,000 or more.
At the commencement of a lease, the City initially measures the lease liability at the present value of payments expected to be made during the lease term. Subsequently, the lease liability is reduced by the principal portion of lease payments made. The lease asset is initially measured as the initial amount of the lease liability, adjusted for lease payments made at or before the lease commencement date, plus certain initial direct costs. Subsequently, the right-to-use lease asset is amortized on a straight line basis over its useful life.
Key estimates and judgments related to leases include how the City determines (1) the discount rate it uses to discount the expected lease payments to present value, (2) lease term, and (3) lease payments.
CITY OF DOWNEY
53
NOTES TO
FINANCIAL STATEMENTS
(CONTINUED) FOR THE YEAR ENDED JUNE 30, 2022
Note 1: Organization and Summary of Significant Accounting Policies (Continued)
The City uses the interest rate charged by the lessor as the discount rate. When the interest rate charged by the lessor is not provided, the City generally uses its estimated incremental borrowing rate as the discount rate for leases.
The lease term includes the noncancellable period of the lease. Lease payments included in the measurement of the lease liability are composed of fixed payments and purchase option price that the City is reasonably certain to exercise.
The City monitors changes in circumstances that would require a remeasurement of its lease and will remeasure the lease asset and liability if certain changes occur that are expected to significantly affect the amount of the lease liability.
Right-to-use lease assets are reported with other capital assets and lease liabilities are reported with long-term debt on the statement of net position.
Lessor - The City is a lessor for a noncancellable lease of a cell tower site. The City recognizes a lease receivable and a deferred inflow of resources in the financial statements.
At the commencement of a lease, the City initially measures the lease receivable at the present value of payments expected to be received during the lease term. Subsequently, the lease receivable is reduced by the principal portion of lease payments received. The deferred inflow of resources is initially measured as the initial amount of the lease receivable, adjusted for lease payments received at or before the lease commencement date. Subsequently, the deferred inflow of resources is recognized as revenue over the life of the lease term.
Key estimates and judgments include how the City determines (1) the discount rate it uses to discount the expected lease receipts to present value, (2) lease term, and (3) lease receipts.
The City uses its estimated incremental borrowing rate as the discount rate for leases.
The lease term includes the noncancellable period of the lease. Lease receipts included in the measurement of the lease receivable is composed of fixed payments from the lessee.
s. New Accounting Pronouncement
For 2022, the City implemented Governmental Accounting Standards Board (GASB) Statement No. 87, Leases. GASB Statement No. 87 enhances the relevance and consistency of information of the government’s leasing activities. It establishes requirements for lease accounting based on the principle that leases are financings of the right to use an underlying asset. A lessee is required to recognize a lease liability and an intangible right to use lease asset, and a lessor is required to recognize a lease receivable and a deferred inflow of resources. These changes were incorporated in the City’s 2022 financial statements.
CITY OF DOWNEY
54
NOTES TO FINANCIAL STATEMENTS (CONTINUED) FOR THE YEAR ENDED JUNE
30, 2022
Note 2: Stewardship, Compliance and Accountability
Deficit Fund Balance
At June 30, 2022, the following funds had a deficit fund balance:
CIP Grant Fund (4,290,949) $ Gas Tax (807,084) COVID 19 Grants (36,437) Grants (112,308) Measure S 2017 LRB (504,327) Private Purpose Trust (48,032,096)
These funds will be replenished with future revenues.
Note 3: Property Taxes
Prior to the beginning of the fiscal year, Los Angeles County, which administers property tax collections for the City of Downey, establishes the assessed valuation roll on January 1 and property taxes attach as an enforceable lien on that date. After the fiscal year has started on July 1, taxes are levied prior to September 1 and are payable in two installments on November 1 (delinquent December 10) and February 1 (delinquent April 10). Assessed valuation is computed at 100% of full cash value; however, due to the 2% annual increase limit per Article XIII-A of the State Constitution, the roll does not fully reflect cash value. Property is reassessed to full cash value when it is sold or otherwise transferred. When property is sold after the normal January 1 lien date, a supplemental property tax is levied representing the difference between the tax levy based on the property value as of January 1 and the tax based on the new value.
Note 4: Cash and Investments
As of June 30, 2022, cash and investments were reported in the accompanying financial statements as follows:
GovernmentWide Statement of Net Position
Fiduciary Funds Statement of Net PositionTotal
Cash and investments 135,446,980 $ 8,056,559 $ 143,503,539 $ Cash and investments with fiscal agents24,487,146 643,250 25,130,396
Total Cash and Investments 159,934,126 $ 8,699,809 $ 168,633,935 $
Demand accounts 25,974,530 $ Petty cash 7,175 Investments 142,652,230
Total Cash and Investments168,633,935 $
Investments Authorized by the California Government Code and the City’s Investment Policy
The table below identifies the investment types that are authorized for the City by the California Government Code (or the City’s investment policy, where more restrictive). The table also identifies certain provisions of the California Government Code (or the City’s
CITY OF DOWNEY
55
NOTES TO
FINANCIAL STATEMENTS
(CONTINUED) FOR THE YEAR ENDED JUNE 30, 2022
Note 4: Cash and Investments (Continued)
investment policy, where more restrictive) that address interest rate risk, credit risk, and concentration of credit risk. This table does not address investments of debt proceeds held by bond trustees that are governed by the provisions of debt agreements of the City, rather than the general provisions of the California Government Code or the City’s investment policy.
Authorized Investment Type
Maximum Maturity
Maximum Percentage Allowed
Maximum Investment in One Issuer
United States Treasury Bills, B onds and Notes5 yearsNoneNone
United States Government Sponsored Agency Securities5 yearsNoneNone
Small Business Administration Loans5 yearsNoneNone California Local Agency Obligations5 yearsNoneNone
Certificates of Deposits (or Time Deposits)5 yearsNoneNone
Negotiable Certificates of Deposits5 years30%None Medium-Term Corporate Notes5 years30%None
Bankers' Acceptances180 days40%30% Commercial Paper270 days25%5%
Repurchase Agreements30 daysNoneNone
Municipal Bonds5 yearsNoneNone
Local Agency Investment Funds (LAIF)N/ANoneNone Money Market Mutual FundsN/ANoneNone
Investments Authorized by Debt Agreements
Investment of debt proceeds held by bond trustee are governed by provisions of the debt agreements, rather than the general provisions of the California Government Code or the City’s investment policy. Investments authorized for funds held by bond trustee include, United States Treasury Obligations, United States Government Sponsored Agency Securities, Certificates of Deposits, Commercial Paper, Local Agency Bonds, Bankers’ Acceptances, Money Market Mutual Funds, Investment Agreements and any other investments permitted by bond insurer. There were no limitations on the maximum amount that can be invested in one issuer, maximum percentage allowed or the maximum maturity of an investment, except for the maturity of Bankers’ Acceptance and Certificates of Deposits which are limited to one year and 270 days, respectively.
Disclosures Relating to Interest Rate Risk
Interest rate risk is the risk that changes in market interest rates will adversely affect the fair value of an investment. Generally, the longer the maturity of an investment, the greater the sensitivity of its fair value to changes in market interest rates. One of the ways that the City manages its exposure to interest rate risk is by purchasing a combination of shorter-term and longer-term investments and by timing cash flows from maturities so that a portion of the portfolio is maturing or coming close to maturity evenly over time as necessary to provide the cash flow and liquidity needed for operations.
CITY OF DOWNEY
56
NOTES TO FINANCIAL STATEMENTS (CONTINUED) FOR THE YEAR ENDED JUNE 30, 2022
Note 4: Cash and Investments (Continued)
Information about the sensitivity of the fair values of the City’s investments (including investments held by bond trustee) to market interest rate fluctuations is provided by the following table that shows the distribution of the City’s investments by maturity:
Investment Maturities (in Months)
12 months or less 13 - 36 Months 37 - 60 Months Total
Investments:
Local Agency Investment Fund 72,379,087 $ - $ - $ 72,379,087 $
Federal Farm Credit Bank - 7,710,020 1,846,940 9,556,960
Fedreal Home Loan Bank - 7,694,024 - 7,694,024 - - 2,769,210 2,769,210 5,791,723 8,828,403 450,210 15,070,336 - 9,965,650 - 9,965,650 86,566 - - 86,566
Federal National Mortgage Assoc. Negotiable Certificates of Deposit U.S. Treasury Notes
Money Market Mutual Funds Held by Bond Trustee
Money Market Mutual Funds25,130,397 - - 25,130,397 103,387,773 $ 34,198,097 $ 5,066,360 $ 142,652,230 $
Disclosures Relating to Credit Risk
Generally, credit risk is the risk that an issuer of an investment will not fulfill its obligation to the holder of the investment. This is measured by the assignment of a rating by a nationally recognized statistical rating organization. Presented below is the minimum rating required, at the time of purchase, by (where applicable) the California Government Code, the City’s investment policy, or debt agreements, and the actual rating, as reported by Standard and Poor’s, as of yearend for each investment type:
Total as of June 30, 2022
Minimum Legal Rating AA+ A+ Unrated Investments: United States Government Sponsored Agency Securities
FFCB 9,556,960 $ N/A 9,556,960 $ - $ - $
Negotiable Certificates of Deposit U.S. Treasury Notes
Local Agency Investment Fund
FHLB 7,694,024 N/A 7,694,024 -FNMA 2,769,210 N/A 2,769,21015,070,335 N/A - - 15,070,335 9,965,650 A - - 9,965,650 72,379,087 N/A - - 72,379,087 86,566 A - - 86,566
Money Market Mutual Funds Held by Bond Trustee
Money Market Mutual Funds 25,130,397 A - - 25,130,397 142,652,230 $ 20,020,194 $ - $ 122,632,036 $
Concentration of Credit Risk
The investment policy of the City contains no limitations on the amount that can be invested in any one issuer beyond that stipulated by the California Government Code.
CITY OF DOWNEY
57
NOTES TO
FINANCIAL STATEMENTS
(CONTINUED) FOR THE YEAR ENDED JUNE
30, 2022
Note 4: Cash and Investments (Continued)
Investments in any one issuer that represent 5% or more of total City’s investments (excluding held by trustees) are as follows:
Percent of Investment Federal Farm Credit United States Government Bank Sponsored Agency Securities
Issuer Investment Type Reported Amount
9,556,960 $
Federal Home Loan BankUnited States Government Sponsored Agency Securities
Fair Value Hierarchy
6.70% 5.39% 7,694,024
The City categorizes its fair value measurements within the fair value hierarchy established by generally accepted accounting principles. The hierarchy is based on the valuation inputs used to measure the fair value of the asset. Level 1 inputs are quoted prices in active markets for identical assets; Level 2 inputs are significant other observable inputs; Level 3 inputs are significant unobservable inputs.
The City has the following recurring fair value measurements as of June 30, 2022:
Level
Total as of June 30, 2022 12N/A
Investments: Federal Government Agency20,020,195 $ - $ 20,020,195 $ - $ US Treasury Note9,965,650 - 9,965,650Certificate of Deposit15,070,335 - 15,070,335Money Market Funds86,566 86,566 -Local Agency Investment Fund72,379,087 - - 72,379,087 Total Cash Investments 117,521,833 86,566 45,056,180 72,379,087
Investments with Fiscal Agents: Money Market Funds 25,130,397 25,130,397 -Total Investments with Fiscal Agent 25,130,397 25,130,397 - -
Total Investments 142,652,230 $ 25,216,963 $ 45,056,180 $ 72,379,087 $
Money market funds are classified in Level 1 of the fair value hierarchy and valued using prices quoted in active markets for those securities. Federal government agency investment, corporate note, and LAIF are classified in Level 2 of the fair value hierarchy and valued using institutional bond quotes or specified fair market value factors.
Custodial Credit Risk
Custodial credit risk for deposits is the risk that, in the event of the failure of a depository financial institution, a government will not be able to recover its deposits or will not be able to recover collateral securities that are in the possession of an outside party. The custodial credit risk for investments is the risk that, in the event of the failure of the counterparty (e.g., broker-dealer) to a transaction, a government will not be able to recover the value of its investment or collateral securities that are in the possession of another party. The California Government Code and the City’s investment policy do not contain legal
CITY OF DOWNEY
58
NOTES TO
FINANCIAL STATEMENTS
(CONTINUED) FOR THE YEAR ENDED JUNE 30, 2022
Note 4: Cash and Investments (Continued)
or policy requirements that would limit the exposure to custodial credit risk for deposits or investments, other than the following provision for deposits: The California Government Code requires that a financial institution secure deposits made by state or local governmental units by pledging securities in an undivided collateral pool held by a depository regulated under state law (unless so waived by the governmental unit). The market value of the pledged securities in the collateral pool must equal at least 110% of the total amount deposited by the public agencies. California law also allows financial institutions to secure City deposits by pledging first trust deed mortgage notes having a value of 150% of the secured public deposits.
At June 30, 2022, the City deposits (bank balances) were all insured by the Federal Deposit Insurance Corporation or collateralized.
Investment in State Investment Pool
The City is a voluntary participant in the Local Agency Investment Fund (LAIF) that is regulated by California Government Code Section 16429 under the oversight of the Treasurer of the State of California. The fair value of the City’s investment in this pool is reported in the accompanying financial statements at amounts based upon the City’s pro-rata share of the fair value provided by LAIF for the entire LAIF portfolio (in relation to the amortized cost of that portfolio). The balance available for withdrawal is based on the accounting records maintained by LAIF, which are recorded on an amortized cost basis.
Note 5: Interfund Receivables/Payables and Transfers
As of June 30, 2022, amounts due from/to other funds were as follows:
Due from Other Funds
Due to Other FundsGeneral Governmental Funds: CIP Grant Fund 5,796,349 $ Other Nonmajor Governmental 1,967,864 Total 7,764,213 $
The amounts loaned by the General Fund to the Other Governmental Funds were to provide short-term loans to fund operations of the various funds.
CITY OF DOWNEY
59
NOTES TO FINANCIAL STATEMENTS (CONTINUED) FOR THE YEAR ENDED JUNE 30, 2022
Note 4: Cash and Investments (Continued)
Interfund transfers at June 30, 2022, consisted of the following:
Tranfers In
Transfers out General Nonmajor Governmental Sewer and Storm DrainWater Internal Service Funds Total Governmental Funds: General - $ 3,290,102 $ - $ - $ 136,500 $ 3,426,602 $ Covid 19 4,647,659 - - 627,699 - 5,275,358 Other Nonmajor Governmental2,900,243 1,000,000 1,630 - - 3,901,873
Enterprise Fund: Water 962,998 - 575,000 - - 1,537,998 Golf 494 - - - - 494 Sewer and Storm Drain 16,519 - - - - 16,519
Internal Service Fund: Equipment 11,201 - - - - 11,201 Total 8,539,114 $ 4,290,102 $ 576,630 $ 627,699 $ 136,500 $ 14,170,045 $
The General Fund transferred $3,290,102 to Other Governmental Funds and $136,500 to the Equipment fund to provide for capital expenditures, subsidize for various project operations, and to reimburse funds negative fund balance.
The Covid-19 Grants fund transferred $4,647,659 to provide for costs incurred by the general fund related to Covid-19 grant funding and $627,699 to cover Water Well Projects.
Other Governmental Funds transferred $2,900,243 to the General Fund, $1,000,000 to Other Governmental Funds, and $1,630 to the Sewer & Storm Drain Fund for various street and related program expenditures.
The Water fund transferred $962,998 to the General fund and $575,000 to the Sewer and Storm Drain fund, to fund administrative costs or certain program, administrative and overhead expenditures.
Transfer to the General fund from the Golf, Sewer and Equipment funds of $28,214 are to cover pension obligation bond payments.
Note 6: Advances Receivable from Successor Agency
As of June 30, 2022, amounts advanced to the Successor Agency were as follows:
Advances from General Fund 5,766,705 $
Advances from Housing Authority Special Revenue Fund 1,354,576 Advances from Employee Benefits 1,271,173 8,392,454 $
The advances from the General Fund, Housing Authority Special Revenue Fund and Employee Benefits Internal Service Fund to the Successor Agency are to provide for operations of the Successor Agency. The collectability of the balance is subject to the approval of the Department of Finance. See Note 20 for additional information.
CITY OF DOWNEY
60
NOTES TO FINANCIAL STATEMENTS (CONTINUED) FOR THE YEAR ENDED JUNE 30, 2022
Note 7: Loans Receivable
The City has provided deferred-payment rehabilitation loans to qualifying low-income households in connection with the CDBG, Home Investment Partnership and Housing Authority housing rehabilitation programs. Loans receivable totaled $12,836,429 as of June 30, 2022.
Additionally, The City’s general fund entered into loan receivable agreements with two local auto dealerships. The City loaned $1,250,000, in April 2017, in order to assist the dealership to relocate to a larger location within the City. The loan is to be repaid over 12 years at a simple interest rate of 4.25%. In fiscal year 2019, the City entered into another operating covenant and loan receivable in agreement in the amount of $500,000. The outstanding balance on the general fund loans receivable as of June 30, 2022, is $1,108,967.
Note 8: Deferred Compensation Plan
The City has adopted a deferred compensation plan in accordance with Internal Revenue Code 457 for its eligible employees wherein they may execute an individual agreement with the City for amounts earned by them to be paid at a future date when certain circumstances are met. These circumstances are termination by reason of death, disability, resignation or retirement, or unforeseeable emergency.
The plan permits all city employees to defer a portion of their salaries until future years. Amounts accumulated under the plan have been invested by third party operators at the direction of the employee.
Pursuant to changes in August 1996 of IRC Section 457, the City formally established a trust in which it placed the 457 Plan assets and income. The assets, all property and rights purchased with such amounts, and all income attributable to such amounts, property, or rights are held in trust for the exclusive benefit of all participants and their beneficiaries. These assets are not the property of the City, and as such are not subject to the claims of the City’s general creditors. As a result, these 457 plan assets are not reported in the City’s annual comprehensive financial report.
Note 9: Leases
a. Leases Receivable and Deferred Inflows of Resources
The City implemented GASB Statement No. 87 in the fiscal year ended June 30, 2022. The primary objective of this statement is to enhance the relevance and consistency of information about governments' leasing activities. This statement establishes a single model for lease accounting based on the principle that leases are financings of the right to use an underlying asset. Under this Statement, a lessee is required to recognize a lease liability and an intangible right-to-use lease asset, and a lessor is required to recognize a lease receivable and a deferred inflow of resources. For additional information, refer to the following below.
The City leases land to various companies for installation of cellular towers. The term is an 8.75-year lease. The City also leases land to Discovery Park, Downey Landing and Industrial Realty Group with term ranging from 3.92 years to 38 years with an option to extend of 5 to 10 years.
An initial lease receivable was recorded in the amount of $22,158,687. As of June 30, 2022, the value of the lease receivable is $21,336,971. The value of the deferred inflow of resources as of June 30, 2022 was $21,392,084, and the City recognized lease revenue of $766,602 during the fiscal year.
CITY OF DOWNEY
61
NOTES TO FINANCIAL STATEMENTS (CONTINUED) FOR THE YEAR ENDED
JUNE 30, 2022
Note 9: Leases (Continued)
The principal and interest payments that are expected to maturity are as follows:
Fiscal Year
Principal Payments Interest Payments Total Payments
2023373,237 $ 339,292 $ 712,529 $ 2024387,928 333,703 721,631 2025368,600 327,715 696,315 2026376,262 321,686 697,948 2027384,091 315,539 699,630 2028 - 20321,985,812 1,480,475 3,466,287 2033 - 20372,134,847 1,309,799 3,444,646 2038 - 20422,492,130 1,113,190 3,605,320 2043 - 20472,897,928 884,134 3,782,062 2048 - 20523,358,230 618,249 3,976,479 2053 - 20573,879,724 310,612 4,190,336 2058 - 20611,618,611 28,224 1,646,835 20,257,400 $ 7,382,618 $ 27,640,018 $
Business-Type Activities
Principal Payments Interest Payments Total Payments 2023 138,874 $ 11,126 $ $ 150,000 2024 140,403 9,597 150,000 2025 141,948 8,052 150,000 2026 143,510 6,490 150,000 2027 145,089 4,911 150,000 2028 - 2032369,747 5,253 375,000 1,079,571 $ 45,429 $ 1,125,000 $
Fiscal Year
b. Leases Payable and Right to Use Lease Assets
The City leases vehicles owned by Enterprise Fleet Management with terms range from 2.92 years to 5 years as of the contract commencement date. An initial lease liability was recorded in the amount of $1,960,113. As of June 30, 2022, the value of the lease liability is $1,550,366. The City is required to make annual fixed payments ranging from $142 to $923. The lease has an interest rate of 0.3150% to 2.1570%.
Right-to-use leased assets include the following at June 30, 2022:
Lease TypeMajor Class of Underlying Asset
Amount of Leased Capital Assets Accumulated Amortization
Vehicle LeaseRight-to-Use Lease - Vehicles1,960,112 $ 411,888 $ Total1,960,112 411,888
CITY OF DOWNEY
Governmental Activities
62
NOTES
TO FINANCIAL STATEMENTS (CONTINUED) FOR THE YEAR ENDED JUNE 30, 2022
Note 9: Leases (Continued)
Future principal and interest requirements to maturity for each lease liability are as follows: Fiscal Year Principal Payments Interest Payments Total Payments 2023 $ 479,898 $ 9,693 $ 489,591 2024 481,604 6,845 488,449 2025 352,844 4,072 356,916 2026 161,491 1,954 163,445 2027 74,529 457 74,986
Governmental Activities
Total1,550,366 $ 23,021 $ 1,573,387 $
Note 10: Capital Assets
A summary of changes in the Governmental Activities capital assets as of June 30, 2022, is as follows:
Balances atTransfers Balances at June 30, 2021of CIP AdditionsDeletionsJune 30, 2022
Governmental Activities:
Capital assets, not being depreciated: Land and improvements31,372,512 $ - $ - $ (5,011,691) $ 26,360,821 $ Projects-in-progress29,006,846 (30,000,743) 25,033,768 - 24,039,871
Total Capital Assets, Not Being Depreciated60,379,358 (30,000,743) 25,033,768 (5,011,691) 50,400,692
Capital assets, being depreciated: Buildings76,855,760 8,926,008 - (401,000) 85,380,768 Land Improvements27,434,109 2,252 - - 27,436,361 Equipment 26,031,345 - 676,496 (3,434,062) 23,273,779
Right-to-use leased asset - vehicle- - 1,960,112 - 1,960,112 Infrastructure287,160,157 21,072,483 - - 308,232,640
Total Capital Assets, Being Depreciated417,481,371 30,000,743 2,636,608 (3,835,062) 446,283,660
Less accumulated depreciation/amortization: Buildings25,429,853 - 1,841,530 (401,000) 26,870,383
Land Improvements5,454,682 - 1,254,432 (29,035) 6,680,079 Equipment 12,921,155 - 1,240,754 (1,734,778) 12,427,131
Right-to-use leased asset - vehicle- - 411,888 - 411,888 Infrastructure165,712,614 - 5,649,011 - 171,361,625
Total Accumulated Depreciation/amortization209,518,304 - 10,397,615 (2,164,813) 217,751,106
Total Capital Assets, Being Depreciated, Net207,963,067 30,000,743 (7,761,007) (1,670,249) 228,532,554
Governmental Activities Capital Assets, Net 268,342,425 $ - $ 17,272,761 $ (6,681,940) $ 278,933,246 $
CITY OF DOWNEY
63
NOTES TO FINANCIAL STATEMENTS (CONTINUED) FOR THE YEAR ENDED JUNE 30, 2022
Note 10: Capital Assets (Continued)
Governmental Activities depreciation/amortization expense, excluding infrastructure, was charged to functions/programs of the primary government as follows:
General Government 555,013 $ Public Safety 7,243,925 Community Development 522,008 Community Services 837,005 Public Works 912,976 Internal Service Funds 326,688
Total depreciation/amortization expense governmental activities 10,397,615 $
A summary of changes in the Water and Golf Fund Business-type Activities capital assets at June 30, 2022, are as follows:
WATER FUND
Balances at Balances at June 30, 2021Transfers AdditionsDeletionsJune 30, 2022
Business-type Activities: Capital assets, not being depreciated: Land 2,459,598 $ - $ - $ - $ 2,459,598 $ Projects-in-progress4,140,613 (2,895,455) 4,047,895 - 5,293,053 Water Rights4,290,880 - - - 4,290,880
Total Capital Assets, Not Being Depreciated10,891,091 (2,895,455) 4,047,895 - 12,043,531
Capital assets, being depreciated: Buildings and improvements398,073 - - - 398,073 Furniture and Equipment2,325,537 - 127,432 (58,463) 2,394,506 Infrastructure47,744,171 2,895,455 - - 50,639,626
Total Capital Assets, Being Depreciated50,467,781 2,895,455 127,432 (58,463) 53,432,205
Less accumulated depreciation: Buildings and improvements262,043 - 7,270 - 269,313 Furniture and Equipment1,720,320 - 101,446 (56,637) 1,765,129 Infrastructure20,062,185 - 871,547 - 20,933,732
Total Accumulated Depreciation22,044,548 - 980,263 (56,637) 22,968,174
Total Capital Assets, Being Depreciated, Net28,423,233 2,895,455 (852,831) (1,826) 30,464,031
Water Fund Capital Assets, Net 39,314,324 $ - $ 3,195,064 $ (1,826) $ 42,507,562 $
CITY OF DOWNEY
64
NOTES TO FINANCIAL STATEMENTS (CONTINUED) FOR THE YEAR ENDED JUNE 30, 2022
Note 10: Capital Assets (Continued)
GOLF FUND
Balances at June 30, 2021 AdditionsDeletionsJune 30, 2022
Balances at
Capital assets, not being depreciated: Land8,294,387 $ - $ - $ 8,294,387 $
Total Capital Assets, Not Being Depreciated8,294,387 - - 8,294,387
Capital assets, being depreciated: Land improvements4,710,076 - - 4,710,076 Buildings and improvements8,217,041 - - 8,217,041 Machinery and equipment469,145 6,983 - 476,128
Total Capital Assets, Being Depreciated13,396,262 6,983 - 13,403,245
Less accumulated depreciation: Land improvements4,393,600 25,085 - 4,418,685 Buildings and improvements2,762,070 164,710 - 2,926,780 Machinery and equipment393,295 75,939 - 469,234
Total Accumulated Depreciation7,548,965 265,734 - 7,814,699
Total Capital Assets, Being Depreciated, Net5,847,297 (258,751) - 5,588,546
Golf Fund Capital Assets, Net14,141,684 $ (258,751) $ - $ 13,882,933 $
A summary of changes in the Sewer and Storm Drain Business-type Activities capital assets at June 30, 2022, are as follows:
Balances at
Balances at June 30, 2021Transfers AdditionsDeletionsJune 30, 2022
Capital assets, not being depreciated: Projects-in-progress 2,282,995 $ (140,050) $ 140,050 $ - $ 2,282,995
Total Capital Assets, Not Being Depreciated 2,282,995 (140,050) 140,050 - 2,282,995
Capital assets, being depreciated: Machinery and equipment 1,185,906 - 8,645 (108,966) 1,085,585 Infrastructure 76,922,174 140,050 - - 77,062,224
Total Capital Assets, Being Depreciated 78,108,080 140,050 8,645 (108,966) 78,147,809
Less accumulated depreciation:
Machinery and equipment 378,764 - 67,305 (67,197) 378,872 Infrastructure 50,632,681 - 1,546,307 - 52,178,988
Total Accumulated Depreciation 51,011,445 - 1,613,612 (67,197) 52,557,860
Total Capital Assets, Being Depreciated, Net 27,096,635 140,050 (1,604,967) (41,769) 25,589,949
Sewer and Storm Drain Fund Capital Assets, Net 29,379,630 $ - $ (1,464,917) $ (41,769) $ 27,872,944 $
CITY OF DOWNEY
65
SEWER AND STORM DRAIN FUND
NOTES TO FINANCIAL STATEMENTS (CONTINUED) FOR THE YEAR ENDED JUNE 30, 2022
Note 10: Capital Assets (Continued)
Capital Project Commitments
The City has active construction projects as of June 30, 2022. At year end, the City’s projects-in-progress totaled $31,615,919. The following material construction commitments existed at June 30, 2022.
Project Name
Contract Amount
Expenditures to date as
June
30,
of
2022 Remaining Commitments
Governmental Activities: Residential Streets Pavement Rehabilitation -Area23,400,000 $ 556,282 $ 2,843,718 $ Total Construction Commitments 3,400,000 $ 556,282 $ 2,843,718 $
Note 11: Long-Term Debt
Noted below is a summary of changes in long-term debt for the year ended June 30, 2022:
Balance BalanceDue Within June 30, 2021AdditionsReductionsJune 30, 2022One Year
Governmental Activities: Bonds payable 164,361,263 $ 26,660,000 $ 3,935,000 $ 187,086,263 $ 7,227,378 $ Bond premiums 4,406,431 3,805,375 403,425 7,808,381Bond discount (92,417) - (7,108) (85,309)Total Bonds 168,675,277 30,465,375 4,331,317 194,809,335 7,227,378
Direct borrowings
Financed purchases 4,662,044 - 1,979,496 2,682,548 541,748 Lease payable - 1,960,112409,746 1,550,366 479,898
Loans from Federal Government HUD Section 108 Loans 3,931,000 - 353,000 3,578,000 353,000
Total governmental activities long-term liabilities 177,268,321 $ 32,425,487 $ 7,073,559 $ 202,620,249 $ $ 8,602,024
Business-type Activities: Bonds payable 4,508,737 $ - $ - $ 4,508,737 $ 142,703 $ Loans payable 3,265,000 - 495,000 2,770,000 515,000 Golf Course 2014
Direct borrowings: Financed purchases 73,084 - 73,084 - -
Total business-type activities long-term liabilities 7,846,821 $ - $ 568,084 $ 7,278,737 $ 657,703 $
CITY OF DOWNEY
66
NOTES TO
FINANCIAL STATEMENTS
(CONTINUED) FOR THE YEAR ENDED JUNE 30, 2022
Note 11: Long-Term Debt (Continued)
Governmental Activities Bonds Payable
2005 Pension Obligation Bonds
In June 2005, the City issued $20,635,000 taxable pension obligation bonds. Bond proceeds were used to satisfy a portion of the City’s requirement to amortize the unfunded actuarial accrued liability with respect to retirement benefits accruing to members of the City. The par amount of the bonds comprised of $1,955,000 serial bonds and $18,680,000 term bonds. Principal on serial bonds mature in amounts from $90,000 to $395,000, the interest at 4.030% to 4.775% through June 1, 2015. Principal on the term bonds mature on June 1, 2021, 2025 and 2034, the interest rate at 4.885% to 5.083%. The term bonds are subject to optional redemption prior to their maturity at the option of the City, in whole or in part on any date, at the redemption price equal to the lesser of (a) 100% of the principal amount on the term bonds to be redeemed; or (b) the sum of the present value of the remaining scheduled payments of the principal and interest to be redeemed.
The future debt service requirements on these bonds are as follows:
Year Ending June 30, PrincipalInterestTotal
2023 1,050,000 $ 701,683 $ 1,751,683 $ 2024 1,160,000 649,047 1,809,047 2025 730,000 590,896 1,320,896 2026 810,000 554,301 1,364,301 2027 895,000 513,129 1,408,129 2028-2032 5,975,000 1,785,404 7,760,404 2033-2034 3,225,000 249,321 3,474,321
Total 13,845,000 $ 5,043,781 $ 18,888,781 $
The outstanding bonds contain a provision that if any event of default should occur, the sole legal remedy of any Holder or Beneficial Owner of the Bonds or the Participating Underwriter shall be an action to compel performance. No Bondholder or Beneficial Owner may institute such action, suit or proceeding to compel performance unless they shall have first delivered to the Local Agency satisfactory written evidence of their status as such, and a written notice of and request to cure such failure, and the Local Agency shall have refused to comply therewith within a reasonable time.
2017 Lease Revenue Bonds
In December 2017, the City issued $45,415,000 lease revenue bonds. Bond proceeds will be used to finance the acquisition and construction of certain public capital improvements of benefit to the City and pay the cost of issuing the bonds. Principal on the bonds mature in amounts from $1,600,000 to $3,390,000, beginning December 1, 2018 through December 1, 2036, and the interest at 2.000% to 5.000% is due semiannually on June 1 and December 1, commencing on June 1, 2018.
CITY OF DOWNEY
67
NOTES TO FINANCIAL STATEMENTS (CONTINUED) FOR THE YEAR ENDED JUNE 30, 2022
Note 11: Long-Term Debt (Continued)
The future debt service requirements on these bonds are as follows:
Year Ending June 30,Principal Interest Total
2023 1,815,000 $ 1,637,163 $ 3,452,163 $ 2024 1,905,000 1,544,163 3,449,163 2025 2,000,000 1,446,538 3,446,538 2026 2,100,000 1,344,038 3,444,038 2027 2,205,000 1,236,413 3,441,413 2028-2032 12,795,000 4,369,563 17,164,563 2032-2037 15,940,000 1,275,919 17,215,919
Total 38,760,000 $ 12,853,796 $ 51,613,796 $
The outstanding bonds contain a provision that if any event of default should occur and continues to occur, the Authority is authorized under the terms of the Property Lease to exercise any and all remedies available under law or generated under the Property Lease. There is no remedy of acceleration of the total Base Rental payments due over the term of the Property Lease. The Trustee is not empowered to sell the Site and Facilities and use the proceeds of such sale to prepay the 2017 Bonds or pay debt service on the 2017 Bonds.
2021 Pension Obligation Bonds
In February 2021, the City issued $113,585,000 pension obligation bonds. Bond proceeds will be used to refinance the City’s statutory obligation to appropriate and make payments to CalPERS for certain amounts arising as a result of retirement benefits accruing to members of the System. Principal on the bonds mature in amounts from $3,595,000 to $7,325,000, beginning June 30, 2023 through June 30, 2044, and the interest at .317% to 2.995% is due semiannually on June 1 and December 1, commencing on June 1, 2022.
The future debt service requirements on these bonds are as follows:
Governmental Activity
Year Ending June 30, PrincipalInterestTotal
2023 3,452,297 $ 2,485,554 $ 5,937,851 $ 2024 3,409,083 2,474,609 5,883,692 2025 3,898,839 2,458,008 6,356,847 2026 3,879,633 2,427,909 6,307,542 2027 3,874,831 2,390,198 6,265,029 2028-2032 19,623,836 11,016,051 30,639,887 2033-2037 25,462,492 8,827,473 34,289,965 2038-2042 32,933,666 4,851,972 37,785,638 2043-2044 12,541,586 554,227 13,095,813
Total 109,076,263 $ 37,486,001 $ 146,562,264 $
CITY OF DOWNEY
68
NOTES TO FINANCIAL STATEMENTS (CONTINUED)
FOR THE YEAR ENDED JUNE 30, 2022
Note 11: Long-Term Debt (Continued)
Business Type Activity
Year Ending June 30, PrincipalInterestTotal
2023142,703 $ 102,742 $ 245,445 $ 2024140,917 102,290 243,207 2025161,161 101,603 262,764 2026160,367 100,359 260,726 2027160,169 98,800 258,969 2028-2032811,164 455,356 1,266,520 2033-20371,052,508 364,889 1,417,397 2038-20421,361,334 200,559 1,561,893 2043-2044518,414 22,909 541,323
Total4,508,737 $ 1,549,507 $ 6,058,244 $
Year Ending June 30,Principal Interest Total
Governmental 109,076,263 $ 37,486,002 $ 146,562,265 $ Business 4,508,737 1,549,507 6,058,244
Total 113,585,000 $ 39,035,509 $ 152,620,509 $
The outstanding bonds contain a provision that if any event of default should occur and continues to occur, the City and Trustee have no liability to the Holders of Series 2021 bonds or any other party related to or arising from such rescission of redemption.
Sales Tax Revenue Bonds Measure M Series 2021A and Measure R Series 2021B
In October 2021, the City issued $15,275,000 Measure M Series 2021A bonds and $11,385,000 Measure R Series 2021 bonds. The bonds are being issued to finance the design, acquisition, and construction of certain local roadway and street improvement projects in the City, purchase a debt service reserve fund insurance policy to satisfy the reserve requirement for the 2021B Bonds and pay the costs incurred in connection with the issuance of the 2021B Bonds.
Principal on the Measure M Series A bonds mature in amounts from $470,000 to $1,790,000, beginning June 1, 2022 through June 1, 2041, and the interest at 2.25% to 4.0% is due semiannually on June 1 and December 1. Principal on the Measure R Series 2021B bonds mature in amounts from $460,000 to $815,000 beginning June 1, 2022 through June 1, 2039, and the interest at 2.125% to 4.0% is due semiannually on June 1 and December 1.
CITY OF DOWNEY
69
NOTES TO FINANCIAL STATEMENTS (CONTINUED) FOR THE YEAR ENDED JUNE 30, 2022
Note 11: Long-Term Debt (Continued)
The future debt service requirements on these bonds are as follows:
2021A Measure M Bond – Governmental Activity
Year Ending June 30,Principal Interest Total
2023 470,000 $ 555,556 $ 1,025,556 $ 2024 485,000 536,756 1,021,756 2025 505,000 517,356 1,022,356 2026 530,000 497,156 1,027,156 2027 545,000 475,956 1,020,956 2028-2032 3,090,000 2,032,981 5,122,981 2033-2037 3,765,000 1,363,581 5,128,581 2038-2042 5,220,000 552,900 5,772,900
Total 14,610,000 $ 6,532,242 $ 21,142,242 $
2021B Measure R Bond – Governmental Activity
Year Ending June 30,Principal Interest Total
2023 460,000 $ 375,231 $ 835,231 $ 2024 480,000 356,831 836,831 2025 500,000 337,631 837,631 2026 515,000 317,631 832,631 2027 540,000 297,031 837,031 2028-2032 3,030,000 1,144,356 4,174,356 2033-2037 3,655,000 517,756 4,172,756 2038-2042 1,615,000 56,713 1,671,713
Total 10,795,000 $ 3,403,180 $ 14,198,180 $
Finance Purchases
The future minimum lease obligations and the net present value of these minimum lease payments are as follows:
Year Ending June 30,PrincipalInterest Total
2023 542,645 $ $ 96,272 $ 638,917 2024 462,228 76,323 538,551 2025 478,978 59,573 538,551 2026 483,386 42,206 525,592 2027 350,708 24,661 375,369 2028 364,603 10,766 375,369
Total 2,682,548 $ 309,801 $ 2, 992,349 $
CITY OF DOWNEY
70
NOTES TO FINANCIAL STATEMENTS (CONTINUED) FOR THE YEAR ENDED JUNE 30, 2022
Note 11: Long-Term Debt (Continued)
Loans from Federal Government
HUD Section 108 Loans
In 2011, the City received a Section 108 Loan from the United States Department of Housing and Urban Development. The payment schedule as of June 30, 2022, is as follows:
Year Ending June 30, PrincipalInterestTotal
2023 81,000 $ 8,286 $ 89,286 $ 2024 81,000 6,014 87,014 2025 81,000 3,637 84,637 2026 81,000 1,219 82,219
Total324,000 $ 19,156 $ 343,156 $
In 2018, the City requested an advance in the amount of $1,000,130 pursuant to Section 108 of the Housing and Community Development Act of 1974. The City of Downey elected to deduct HUD’s $25,800 loan and $70 advance fees from the original $1,026,000 Section 108 Loan amount. The payment schedule as of June 30, 2022, is as follows:
Year Ending June 30, PrincipalInterestTotal
2023 114,000 $ 13,860 $ 127,860 $ 2024 114,000 10,916 124,916 2025 114,000 7,902 121,902 2026 114,000 4,821 118,821 2027 114,000 1,630 115,630
Total570,000 $ 39,129 $ 609,129 $
In 2019, the City received a Section 108 Loan from the United States Department of Housing and Urban Development. The payment schedule as of June 30, 2022, is as follows:
Year Ending June 30, PrincipalInterestTotal
2023 158,000 $ 82,265 $ 240,265 $ 2024 158,000 78,185 236,185 2025 158,000 74,009 232,009 2026 158,000 69,738 227,738 2027 158,000 65,316 223,316 2028-2032 790,000 255,526 1,045,526 2033-2037 790,000 125,306 915,306 2038-2039 314,000 11,338 325,338
Total2,684,000 $ 761,682 $ 3,445,682 $
CITY OF DOWNEY
71
NOTES TO FINANCIAL STATEMENTS (CONTINUED) FOR THE YEAR ENDED JUNE 30, 2022
Note 11: Long-Term Debt (Continued)
Business-type Activities
2014 Golf Course Loan Agreement
The 2014 Loan Agreement, consisting of $6,350,000, were issued by the City of Downey to prepay the 2002 Lease Agreement and Certificates of Participation (Golf Course Financing). Principal payments are due August, the interest is due February and August of every year at a rate of 3.70% maturing in August 2026.
Future debt service requirements on these certificates are as follows:
Year Ending June 30,PrincipalInterestTotal
2023515,000 $ 92,963 $ 607,963 $
2024535,000 73,538 608,538
2025550,000 53,465 603,465 2026575,000 32,653 607,653 2027595,000 11,008 606,008
Total2,770,000 $ 263,627 $ 3,033,627 $
Note 12: Compensated Absences
Compensated Absences
For the fiscal year ended June 30, 2022, compensated absences are as follows:
Balance
BalanceDue Within June 30, 2021AdditionsReductionsJune 30, 2022One Year
Compensated absences: Governmental activities16,574,417 $ 5,521,970 $ 5,489,479 $ 16,606,908 $ 5,489,479 $ Business-type activities657,332 61,654 183,686 535,300 176,945 Total compensated absences17,231,749 $ 5,583,624 $ 5,673,165 $ 17,142,208 $ 5,666,424 $
The compensated absences are predominantly associated with the General fund.
Note 13: Claims and Judgements
Claims Payable (Self-Insurance)
The City has two types of claims it has to manage and account for. The City is a member of Independent Cities Risk Management Authority (ICRMA), an Authority that provides liability insurance for several California Cities, and employs independent claims administrators to accomplish this task. The two types of claims are workers’ compensation and general liability. The self-insured retention and limits of insurance coverage (each occurrence or per employee, per year) for the respective claims are as follows:
Self-Insured Retention
Limit of Insurance Coverage
Workers' Compensation750,000 $ 5,000,000 $ General Liability2,000,000 20,000,000
CITY OF DOWNEY
72
NOTES TO FINANCIAL STATEMENTS (CONTINUED) FOR THE YEAR ENDED JUNE 30, 2022
Note 13: Claims and Judgements (Continued)
Changes in the workers’ compensation, employee health benefits, and general liability outstanding claims liability for the fiscal year ended June 30, 2022, were as follows:
General Liability
Workers' Compensation Employee Health BenefitTotal
Claims Payable, June 30, 2021 6,365,000 $ 17,623,000 $ 85,000 $ 24,073,000 $
Adjustments due to actuarial valuation (461,478) - - (461,478) Claims and Changes in Estimates - 4,199,287 - 4,199,287 Claims Payments (553,522) (2,781,287) - (3,334,809)
Claims Payable, June 30, 2022 5,350,000 19,041,000 85,000 24,476,000 Claims payable, due within one year 1,132,000 $ 3,372,000 $ - $ 4,504,000 $
The amounts payable include Incurred but Not Reported (IBNR) claims. Payments are typically paid from General Fund and Employee Benefits Internal Service Fund. The various amounts are based on information provided by the City’s claims administrators.
Note 14: City Employee Retirement Plan
a. General Information about the Pension Plans
The City of Downey contributes to the State of California Public Employees Retirement System (CalPERS), which is an agent multiple-employer public employee defined benefit pension plan. All qualified permanent and probationary employees are eligible to participate in the City’s separate Safety (police and fire) and Miscellaneous (all other) Plans administered by CalPERS, which acts as a common investment and administrative agent for its participating member employers. CalPERS provides retirement and disability benefits, annual cost-of-living adjustments, and death benefits to plan members and beneficiaries. Benefit provisions and all other requirements are established by state statute and city ordinance. Copies of PERS’ annual financial report may be obtained from their Executive Office - 400 P Street Sacramento, California 95814, or downloaded from the website at www.calpers.ca.gov.
Benefits Provided
CalPERS provides service retirement and disability benefits, annual cost of living adjustments and death benefits to plan members, who must be public employees and beneficiaries. Benefits are based on years of credited service, equal to one year of full-time employment. Members with five years of total service are eligible for non-duty disability benefits after 10 statutorily reduced benefits.
Pension related balances presented on the Statement of Net Position as of June 30, 2022 by individual plan are described in the following table: Deferred Employer Contributions
CalPERS Miscellaneous Plan
Deferred OutflowsPension Net Pension Liability
Deferred InflowsPension $ 3,688,975 - $ (5,784,004) $ (17,704,330) $
CalPERS Safety Plan 9,058,878 1,879,796 (10,312,742) (38,408,516) Total $ 12,747,853 1,879,796 $ (16,096,746) $ (56,112,846) $
CITY OF DOWNEY
73
NOTES TO
FINANCIAL STATEMENTS
(CONTINUED) FOR THE YEAR ENDED JUNE 30, 2022
Note 14: City Employee Retirement Plan (Continued)
Miscellaneous agent plans
Safety agent plans
The Plans’ provisions and benefits in effect at June 30, 2021, are summarized as follows: Miscellaneous Classic
Miscellaneous Classic - 2nd Tier PEPRA MiscellaneousSafety Classic Safety Classic2nd Tier PEPRA Safety Police PEPRA Safety Fire
Hire date
Monthly benefits, as a % of eligible compensation
Prior to January 1, 2013 January 11,2012January 1, 2013 January 1, 2013 and after Prior to January 1, 2013
October 10,2012January 1, 2013 January 1, 2013 and after January 1, 2013 and after Benefit formula2.7% @ 552.0% @ 602% @ 623% @ 503% @ 552.7% @ 57 2.7% @ 57 Benefit vesting schedule5 years service5 years service5 years service5 years service5 years service5 years service5 years service Benefit payments monthly for lifemonthly for lifemonthly for lifemonthly for lifemonthly for lifemonthly for lifemonthly for life Retirement age minimum 50 yrsminimum 50 yrsminimum 52 yrsminimum 50 yrsminimum 50 yrsminimum 52 yrsminimum 52 yrs
2.0% - 2.7%, 50 yrs - 55+ yrs, respectively
2.0% - 2.7%, 50 yrs - 55+ yrs, respectively
1.0% - 2.5%, 52 yrs - 67+ yrs, respectively 3.0%, 50 yrs55+ yrs 3.0%, 50 yrs55+ yrs
2.0% - 2.7%, 50 yrs - 57+ yrs, respectively
2.0% - 2.7%, 50 yrs - 57+ yrs, respectively
Required employee contribution rates 8.000%7.000% 6.250% 9.000% 9.000%12.000%12.000%
Required employer contribution rates 10.952%10.952%10.952%20.432%20.432%20.432%20.432%
Required unfunded liability payment $ 5,349,414 $ - $ - $ 10,820,375 $ - $ - $ -
The Miscellaneous and Safety Classic Plans are closed to new entrants.
Employees Covered
At the June 30, 2021 measurement date, the following employees were covered by the benefit terms for each Plan:
MiscellaneousSafety
Inactive employees or beneficiaries currently receiving benefits 463 323 Inactive employees entitled to but not yet receiving benefits 559 91
Active employees 241 177 1,263 591
Contribution Description
Section 20814(c) of the California Public Employees’ Retirement Law (PERL) requires that the employer contribution rates for all public employers be determined on an annual basis by the actuary and shall be effective on the July 1 following notice of a change in the rate. The total plan contributions are determined through CalPERS’ annual actuarial valuation process. The actuarially determined rate is the estimated amount necessary to finance the costs of benefits earned by employees during the year, with an additional amount to finance any unfunded accrued liability. The employer is required to contribute the difference between the actuarially determined rate and the contribution rate of employees.
b. Net Pension Liability
The City’s net pension liability for each Plan is measured as the total pension liability, less the pension plan’s fiduciary net position. The net pension liability of each of the Plans is measured as of June 30, 2021, using an annual actuarial valuation as of June 30, 2020, rolled forward to June 30, 2021, using standard update procedures. A summary of principal assumptions and methods used to determine the net pension liability is shown below.
CITY
OF DOWNEY
74
NOTES TO
FINANCIAL STATEMENTS
(CONTINUED) FOR THE YEAR ENDED JUNE 30, 2022
Note 14: City Employee Retirement Plan (Continued)
Actuarial Assumptions
The total pension liabilities in the June 30, 2021, actuarial valuations were determined using the following actuarial assumptions: Actuarial Cost Method Entry Age Normal in accordance with the requirements of GASB Statement No. 68
Actuarial Assumptions
Discount Rate 7.15%
Inflation 2.50%
Salary Increases Varies by Entry Age and Service
Investment Rate of Return 7.00% Net of Pension Plan Investment and Administrative Expenses; includes Inflation Mortality Rate Table (1) Derived using CalPERS’ Membership Data for all Funds
Post Retirement Benefit Increase Contract COLA up to 2.50% until Purchasing Power Protection Allowance Floor on Purchasing Power applies, 2.50% thereafter
(1)ThemortalitytableusedwasdevelopedbasedonCalPERS’specificdata .Formore details on this table, please refer to the 2017 experience stud y report.
Change of Assumptions -There were no changes in the discount rate.
Subsequent Events - There were no subsequent events that would materially affect the results presented in this disclosure.
Discount Rate -The discount rate used to measure the total pension liability was 7.15 percent. To determine whether the municipal bond rate should be used in the calculation of the discount rate for each plan, CalPERS stress tested plans that would most likely result in a discount rate that would be different from the actuarially assumed discount rate. The tests revealed the assets would not run out. Therefore, the current 7.15 percent discount rate is appropriate, and the use of the municipal bond rate calculation is not deemed necessary. The long-term expected discount rate of 7.15 percent is applied to all plans in the Public Employees’ Retirement Fund (PERF). The cash flows used in the testing were developed assuming that both members and employers will make their required contributions on time and as scheduled in all future years. The stress test results are presented in a detailed report called “GASB Crossover Testing Report” that can be obtained at CalPERS website under the GASB 68 section.
The long-term expected rate of return on pension plan investments was determined using a building-block method in which expected future real rates of return (expected returns, net of pension plan investment expense and inflation) are developed for each major asset class.
In determining the long-term expected rate of return, staff took into account both short-term and long-term market return expectations as well as the expected pension fund (PERF) cash flows. Taking into account historical returns of all the Public Employees Retirement Funds’ asset classes, expected compound (geometric) returns were calculated over the short-term (first 10 years) and the long-term (11-60 years) using a building-block approach.
CITY OF DOWNEY
75
NOTES TO
FINANCIAL STATEMENTS
(CONTINUED) FOR THE YEAR ENDED JUNE
30, 2022
Note 14: City Employee Retirement Plan (Continued)
Using the expected nominal returns for both short-term and long-term, the present value of benefits was calculated for each PERF fund. The expected rate of return was set by calculating the single equivalent expected return that arrived at the same present value of benefits for cash flows as the one calculated using both short-term and long-term returns. The expected rate of return was then set equal to the single equivalent rate calculated above and rounded down to the nearest one quarter of one percent.
The table below reflects long-term expected real rate of return by asset class. The rate of return was calculated using the capital market assumptions applied to determine the discount rate and asset allocation. The target allocation shown was adopted by the Board effective on July 1, 2014.
Asset Class
Current Target Allocation Real Return Years 1 - 10 (1) Real Return Years 11+ (2)
Global Equity50.00%4.80%5.98%
Global Fixed Income28.001.002.62
Inflation Sensitive0.000.771.81 Private Equity8.006.307.23 Real Estate13.003.754.93 Liquidity1.000.00-0.92
(1) An expected inflation of 2.00% used for this period.
(2) An expected inflation of 2.92% used for this period.
CITY OF DOWNEY
76
NOTES TO FINANCIAL STATEMENTS (CONTINUED) FOR THE YEAR ENDED JUNE 30, 2022
Note 14: City Employee Retirement Plan (Continued)
c. Changes in Net Pension Liability
The changes in the Net Pension Liability recognized over the measurement date for each Plan follows:
Increase (Decrease)
Miscellaneous Plans
Total Pension Liability (a)
Plan Fiduciary Net Position (b)
Net Pension Liability/(Assets) (c)=(a)-(b)
Balance at: 6/30/2020 (Valuation Date) (1)210,321,943 $ 145,546,316 $ 64,775,627 $
Changes Recognized for the Measurement Period: Service Cost 2,872,012 - 2,872,012 Interest on the Total Pension Liability 14,690,041 - 14,690,041
Difference between Expected and Actual Experience (521,832) - (521,832) Contribution from the Employer - 39,587,168 (39,587,168) Contributions from Employees - 1,233,750 (1,233,750) Net Investment Income - 35,352,353 (35,352,353) Plan to Plan Resource Movement - 3,965 (3,965)
Benefit Payments including Refunds of Employee Contributions (11,561,991) (11,561,991)Administration Expenses - (145,392) 145,392 Net Changes During 2020-21 5,478,230 64,469,853 (58,991,623)
Balance at: 6/30/2021 (Measurement Date) (1) 215,800,173 $ 210,016,169 $ 5,784,004 $
Increase (Decrease)
Safety Plans
Total Pension Liability (a)
Plan Fiduciary Net Position (b)
Net Pension Liability/(Assets) (c)=(a)-(b)
Balance at: 6/30/2020 (Valuation Date) (1) 441,988,439 $ 296,797,565 $ 145,190,874 $
Changes Recognized for the Measurement Period: Service Cost 7,124,490 - 7,124,490 Interest on the Total Pension Liability 30,838,840 - 30,838,840
Difference between Expected and Actual Experience (3,092,936) - (3,092,936) Contribution from the Employer - 94,012,641 (94,012,641) Contributions from Employees - 2,467,916 (2,467,916) Net Investment Income - 73,568,416 (73,568,416) Plan to Plan Resource Movement - (3,965) 3,965 Benefit Payments including Refunds of Employee Contributions (22,290,600) (22,290,600)Administration Expenses - (296,482) 296,482
Net Changes During 2020-21 12,579,794 147,457,926 (134,878,132)
Balance at: 6/30/2021 (Measurement Date) (1) 454,568,233 $ 444,255,491 $ 10,312,742 $
CITY OF DOWNEY
77
NOTES TO FINANCIAL STATEMENTS (CONTINUED) FOR THE YEAR ENDED JUNE 30, 2022
Note 14: City Employee Retirement Plan (Continued)
Sensitivity of the Net Pension Liability to Changes in the Discount Rate
The following presents the net pension liability of the Plan as of the measurement date, calculated using the discount rate of 7.15 percent, as well as what the net pension liability would be if it were calculated using a discount rate that is 1 percentage-point lower (6.15 percent) or 1 percentage-point higher (8.15 percent) than the current rate:
Plan's Net Pension Liability
Discount Rate - 1% (6.15%) Discount Rate (7.15%) Discount Rate + 1% (8.15%) Miscellaneous32,880,281 $ 5,784,004 $ (16,664,743) $ Safety 70,756,943 10,312,742 (39,345,553) 103,637,224 $ 16,096,746 $ (56,010,296) $
Plans
Recognition of Gains and Losses
Under GASB 68, gains and losses related to changes in total pension liability and fiduciary net position are recognized in pension expense systematically over time.
The first amortized amounts are recognized in pension expense for the year the gain or loss occurs. The remaining amounts are categorized as deferred outflows and deferred inflows of resources related to pensions and are to be recognized in future pension expense.
The amortization period differs depending on the source of the gain or loss: Difference between projected and actual earnings 5 year straight-line amortization
All other amounts
Straight-lineamortizationoverthe averageexpectedremainingservice livesofallmembersthatareprovided withbenefits(active,inactive,and retired)asofthebeginningofthe measurement period.
The expected average remaining service lifetime (EARSL) is calculated by dividing the total future service years by the total number of plan participants (active, inactive, and retired).
The EARSL for the Plan for the measurement period ending June 30, 2021 is 3.3 years for safety and 2.1 years for Miscellaneous, which was obtained by dividing the total service years of 1,943 safety and 2,078 miscellaneous (the sum of remaining service lifetimes of the active employees) by 591 safety and 1,263 miscellaneous (the total number of participants: active, inactive, and retired). Note that inactive employees and retirees have remaining service lifetimes equal to 0. Also note that total future service is based on the members’ probability of decrementing due to an event other than receiving a cash refund.
CITY OF DOWNEY
78
NOTES TO FINANCIAL STATEMENTS (CONTINUED) FOR THE YEAR ENDED JUNE 30, 2022
Note 14: City Employee Retirement Plan (Continued)
Pension Plan Fiduciary Net Position
Detailed information about each pension plan’s fiduciary net position is available in the separately issued CalPERS financial reports.
d. Changes in Net Pension Liability
For the measurement period ending June 30, 2021, the City incurred pension expense in the amount of ($604,391) and $1,774,770 for the Miscellaneous and Safety Plans, respectively, totaling $1,170,379 for all plans. The City recognized a reduction of net pension liability of $133,599,807, $39,588,358 from the Miscellaneous Plan and $94,011,449 from the Safety Plan. At June 30, 2020, the City reported deferred outflows of resources and deferred inflows of resources related to pensions from the following sources:
Miscellaneous Plans
Deferred Outflows of Resources Deferred Inflows of Resources
Pension contributions subsequent to measurement date 3,688,795 $ - $ Differences between Expected and Actual Experiences - (277,287) Net difference between projected and actual earnings on pension plan investments - (17,427,043) 3,688,795 $ (17,704,330) $
Safety Plans
Deferred Outflows of Resources
Deferred Inflows of Resources
Pension contributions subsequent to measurement date9,058,878 $ - $ Differences between Expected and Actual Experiences1,879,796 (2,155,683) Net difference between projected and actual earnings on pension plan investments- (36,252,833) 10,938,674 $ (38,408,516) $
Total Deferred Outflows and Inflows of resources14,627,469 $ (56,112,846) $
The $3,688,795 and $9,058,878 reported as deferred outflows of resources related to miscellaneous and safety plan contributions subsequent to the measurement date will be recognized as a reduction of the net pension liability in the year ended June 30, 2023. Other amounts reported as deferred outflows and deferred inflows of resources related to pensions will be recognized in future pension expense as follows:
Deferred Outflows/( Inflows) of Resources
Measurement Period
Ended June Miscellaneous Safet y Total Plans
2022(4,655,825) $ (8,639,840) $ (13,295,665) $ 2023(4,072,641) (8,929,640) (13,002,281) 2024(4,189,828) (9,017,094) (13,206,922) 2025(4,786,036) (9,942,146) (14,728,182) (17,704,330) $ (36,528,720) $ (54,233,050) $
CITY OF DOWNEY
79
NOTES TO FINANCIAL STATEMENTS (CONTINUED) FOR THE YEAR ENDED JUNE 30, 2022
Note 15: Post-Employment Benefits Other than Pensions
Plan Description
In connection with the retirement benefits for employees described in Note 13, the City provides post-retirement medical benefits to retirees. The Plan is an agent-multiple employer plan. These benefits are available to employees who retire with the City with at least 10 years of service or those who satisfy certain disability requirements. The Plan does not issue a publicly available financial report.
Funding Policy
The City’s funding policy affects the calculation of liabilities by impacting the discount rate that is used to develop the plan liability and expense. “Prefunding” is the term used when an agency consistently contributes an amount based on an actuarially determined contribution (ADC) each year. GASB 75 allows prefunded plans to use a discount rate that reflects the expected earnings on trust assets. Pay-as you go, or “PAYGO”, is the term used when an agency only contributes the required retiree benefits when due. When an agency finances retiree benefits on a pay as you go basis, GASB 75 requires the use of a discount rate equal to a 20 year high grade municipal bond rate.
The City has been and continues to prefund its OPEB liability, contributing 100% or more of the Actuarially Determined Contributions each year. Therefore, with the City’s approval, the discount rate used in this valuation is 6.15%, the City’s expectation of the long-term return on trust assets.
Employees Covered
As of the June 30, 2021 actuarial valuation, the following current and former employees were covered by the benefit terms under the OPEB Plan:
Active 424
Inactive employees or beneficiaries currently receiving benefit s 238
Inactive employees entitled to, but not yet receiving benefits 662 1,324
Contributions
The OPEB Plan and its contribution requirements are established by Memoranda of Understanding with the applicable employee bargaining units and may be amended by agreements between the City and the bargaining units. The annual contribution is based on the actuarially determined contribution. For the measurement date ended June 30, 2020, the City’s cash contributions were $911,116 in total payments, which were recognized as a reduction to the OPEB liability.
CITY OF DOWNEY
80
NOTES TO
FINANCIAL STATEMENTS
(CONTINUED) FOR THE YEAR ENDED JUNE 30, 2022
Note 15: Post-Employment Benefits Other than Pensions (Continued)
Net OPEB Liability
The City’s net OPEB liability was measured as of June 30, 2021 using an actuarial valuation as of June 30, 2021. The Liability was determined based on the following actuarial methods and assumptions:
Actuarial Cost Method Entry Age Normal Actuarial Assumptions
Discount Rate 6.15%
Inflation 2.50%
Salary Increases 3.0% per year Investment Rate of Return 6.80%
Mortality Rate (1) MacLeod Watts Scale 2022 applied generationally from 2015 Healthcare Trend Rate Adjusted in future years ranging from 5.8% - 3.9%
Notes: (1) Mortality rates used were those published by CalPERS, adjusted to back out 15 years of Scale MP 2016 to central year 2015, then projected as described above.
The long-term expected rate of return on OPEB plan investments was determined using a building-block method in which expected future real rates of return (expected returns, net of OPEB plan investment expense and inflation) are developed for each major asset class. These ranges are combined to produce the long-term expected rate of return by weighting the expected future real rates of return by the target asset allocation percentage and by adding expected inflation. The target allocation and best estimates of arithmetic real rates of return for each major asset class are summarized in the following table:
Asset Class
Target Allocation
Long-term expected real rate of return
Global Equity49.00%6.80% Global Debt Securities23.00%4.50% Inflation Assets5.00%3.60%
REITs20.00%6.20% Commodities3.00%3.50% Total 100.00%
Discount Rate
The discount rate used to measure the total OPEB liability was 6.15 percent. The projection of cash flows used to determine the discount rate assumed that City contributions will be made at rates equal to the actuarially determined contribution rates. Based on those assumptions, the OPEB plan’s fiduciary net position was projected to be available to make all projected OPEB payments for current active and inactive employees and beneficiaries. Therefore, the long-term expected rate of return on OPEB plan investments was applied to all periods of projected benefit payments to determine the total OPEB liability.
CITY OF DOWNEY
81
NOTES TO FINANCIAL STATEMENTS (CONTINUED) FOR THE YEAR ENDED JUNE 30, 2022
Note 15: Post-Employment Benefits Other than Pensions (Continued)
Changes in the OPEB Liability
The changes in the net OPEB liability are as follows:
Total OPEB Liability/(Assets)
Increase(Decrease)
Plan Fiduciary Net Position (b)
Net OPEB Liability/(Assets) (c) = (a) - (b)
Balance at June 30, 2021 (measurement date 06/30/2020) 14,357,095 $ 8,448,769 $ 5,908,326 $
Changes recognized over the measurement period:
Service Cost 383,096 - 383,096
Interest 985,640 - 985,640
Changes of assumptions 1,185,773 - 1,185,773
Contributions - employer* - 911,116 (911,116)
Net investment income - 2,322,102 (2,322,102)
Benefit Payments (911,116) (911,116) -
Administrative expense - (3,196) 3,196
Investment Experience (288,995) - (288,995)
Net Changes 1,354,398 2,318,906 (964,508)
Balance at June 30, 2022 (measurement date 06/30/2021) 15,711,493 $ 10,767,675 $ 4,943,818 $
*Includes implied subsidy of $451,642
Sensitivity of the Net OPEB Liability to Changes in the Discount Rate
The following presents the net OPEB liability of the City if it were calculated using a discount rate that is one percentage point lower or one percentage point higher than the current rate, for measurement period ended June 30, 2021:
1% Decrease (5.15%)
Current Discount Rate (6.15%) 1% Increase (7.15%)
Net OPEB Liability6,910,583 $ 4,943,818 $ 3,308,859 $
Sensitivity of the Net OPEB Liability to Changes in the Health Care Cost Trend Rates
The following presents the net OPEB liability of the City if it were calculated using health care cost trend rates that are one percentage point lower or one percentage point higher than the current rate, for measurement period ended June 30, 2021:
Current Healthcare Cost Trent Rates1% Increase (4.8% decreasing to 2.9%) (5.8% decreasing to 3.9%) (6.8% decreasing to 4.9%)
1% Decrease
Net OPEB Liability3,516,407 $ 4,943,818 $ 6,807,233 $
OPEB Plan Fiduciary Net Position
CalPERS issues a separate Annual Comprehensive Financial Report. Copies of the annual financial report may be obtained from the CalPERS Executive Office at 400 P Street, Sacramento, California, 95814.
CITY
OF DOWNEY
82
NOTES TO FINANCIAL STATEMENTS (CONTINUED) FOR THE YEAR ENDED JUNE 30, 2022
Note 15: Post-Employment Benefits Other than Pensions (Continued)
OPEB Expense and Deferred Outflows/Inflows of Resources Related to OPEB
For the fiscal year ended June 30, 2022, the City recognized OPEB expense of $322,950. As of fiscal year ended June 30, 2022, the City reported deferred outflows of resources related to OPEB from the following sources:
Deferred Outflows of Resources Deferred Inflows of Resources
OPEB contributions subsequent to measurement date*977,849 $ - $ Changes of assumptions1,031,375 535,188 Differences between expected and actual experience- 919,327 Net difference between projected and actual earnings on OPEB plan investments- 1,195,752 Total 2,009,224 $ 2,650,267 $
* Includes implied subsidy of $451,642
The $977,849 reported as deferred outflows of resources related to contributions subsequent to the June 30, 2021 measurement date will be recognized as a reduction of the net OPEB liability during the fiscal year ending June 30, 2023. Other amounts reported as deferred outflows of resources related to OPEB will be recognized as expense as follows:
Year ended June 30
Deferred Outflows/(Inflows) of Resources 2023(428,596) $ 2024(421,023) 2025(439,522) 2026(494,931) 2027(30,990) Thereafter196,170 (1,618,892) $
Note 16: Joint Ventures
The City is a participant in four joint ventures. The joint ventures are not considered part of the reporting entity, as the City does not exercise primary oversight responsibilities for their operations and does not have financial responsibility. These agencies do not depend on revenue from the City to continue in existence. Each participating agency in these joint ventures has proportionate control over management, budgets, and financial decisions.
Southeast Area Animal Control Authority
This joint venture provides animal control services to nine cities in the Southeast Los Angeles County area. The Authority is governed by a nine-member board with one representative from each member city. Each member is obligated to contribute annually.
The Authority is not currently experiencing financial stress on accumulating significant resources. The City has no equity interest in the Authority and does not receive a share of operating results. Separate audited financial statements for the Authority may be obtained at 9777 Seaaca Street, Downey, California 90241.
CITY OF DOWNEY
83
NOTES TO
FINANCIAL STATEMENTS
(CONTINUED) FOR THE YEAR ENDED JUNE 30, 2022
Note 16: Joint Ventures (Continued)
Joint Fire Dispatching Center
In this joint venture, the City operates as a cooperative program with the cities of Santa Fe Springs and Compton. The City receives all calls for fire emergency services and dispatches fire units for the four-city area. The program is financed with contributions from each city per a Joint Powers Agreement. Pro-rata expenditures and revenues are reported as part of the Fire Department. Separate audited financial statements are not prepared for the joint venture.
Gateway Authority (Gateway Region IRWM Joint Powers Authority) .
This joint venture was formed through a directive of COG (Gateway Cities Council of Governments) in 2007 and was designated by the State of California as an Integrated Regional Water Management Group. This coalition is currently comprised of 19 cities and government entities and is responsible for the regional water planning needs in the Gateway Cities Region. The Gateway Authority is governed by the member cities and agencies and financed with contributions from each city per a Joint Powers Agreement. Separate audited financial statements for the Authority may be obtained at City of Signal Hill, City Hall. The City of Signal Hill acts as lead agency.
Southeast Water Coalition.
This joint venture was formed in 1991 to protect the quantity and quality of the regional water supply. This coalition is currently comprised of 11 cities. The Southeast Water Coalition is governed by the member cities and three advisory agencies. The City of Whittier acts as lead agency.
Note 17: Mortgage Revenue Bonds
On March 13, 1985, the City of Downey issued, in conjunction with the cities of Covina, Rancho Cucamonga, and Calexico, Residential Mortgage Revenue Bonds, 1985 Series A, to provide funds in the amount of $1,937,040 to purchase loans to be secured by single-family condominium units in the City. The bonds are special obligations of the Covina, Rancho Cucamonga, Calexico, Downey Housing Finance Agency. Seattle First National Bank serves as trustee.
On May 15, 1985, the City of Downey issued, in conjunction with the cities of El Monte and San Jacinto, Single-Family Residential Mortgage Revenue Bonds, Issue of 1985, to provide funds in the amount of $1,950,000 to purchase loans to be secured by single-family condominium units in the City. The bonds are special obligations of the El Monte-Downey-San Jacinto Housing Finance Agency. Seattle First National Bank serves as trustee.
On August 8, 2001, the City of Downey issued, in conjunction with the California Statewide Communities Development Authority, Multi-Family Housing Revenue Bonds, Series S and S-T, to provide funds in the amount of $3,300,000 to purchase loans to be secured by multifamily apartment complex in the City. The bonds are limited obligations of the California Statewide Communities Development Authority payable solely from the revenues from the multifamily apartment complex. U.S. Bank Trust National serves as trustee.
CITY OF DOWNEY
84
NOTES TO
FINANCIAL STATEMENTS
(CONTINUED) FOR THE YEAR ENDED JUNE 30, 2022
Note 17: Mortgage Revenue Bonds (Continued)
The above debt issues are special obligations of the respective Housing Finance Agencies and are payable solely from payments made on mortgage loans and are secured by a pledge of such mortgage loans. Neither the faith and credit nor the taxing power of the City of Downey have been pledged to the payment of the bonds. Accordingly, these debts are not reported as liabilities in the accompanying financial statements.
Note 18: Sales Tax Abatement
The City has entered into a tax abatement agreement with a local businesses. The abatement may be granted to any business located within or promising to relocate to the City. For the Fiscal Year ended June 30, 2022, the City abated taxes totaling $223,604. Under this program, the City has the following Tax abatement agreements:
A sales tax abatement to assist a local auto dealership in relocating to a larger facility within the City in order to retain jobs within the City and generate increased sales taxes. Per the Agreement, the dealership is required to maintain no less than thirty- five full time equivalent positions. The City authorized a loan in the amount of $1,250,000, repayable over 12 years at an interest rate of 4.25 percent per year. Additionally, of any sales tax revenues exceeding $400,000 and up to $670,000, 50% of sales tax revenues shall be credited to the loan. For any sales tax revenue over $670,000, an additional 30% of the revenues shall be credited against the loan. Total tax abatements were $151,604 for the fiscal year.
A sales tax rebate with a local auto dealership in which the City authorized a loan in the amount of $500,000. The sales tax base will be 100% of the sales projections and the City will retain the first 50% of the sales tax collected. The second 50% will be shared will be shared by the City and the dealership. The City will use the portion to be credited against the $500,000 loan. Upon payment of the $500,000 loan, the City will then disburse the sales tax collected up to a maximum of $500,000. A combination of the sales tax credit for the loan of $500,000 plus the sales tax rebate will not exceed $1,000,000. Due to COVID 19 pandemic there was delay in construction and operation at the new dealership. City expects the dealership will be in operation during fiscal year 23-24, at which point abatement of sales tax will begin.
A tax abatement to assist a new RV dealership to serve as a sales tax rebate and job creation covenant. City will rebate 26% of the sales tax portion over $180,000 if the gross taxable sales at the property exceeds $18,000,000. The rebate is restricted to a maximum of $72,000 per year, and shall not exceed $504,000 over 7 year period. Tax rebated in fiscal year was $72,000. Note 19: Other
Disclosures
CITY OF DOWNEY
The following funds reported expenditures in excess of appropriations: Other Governmental Funds - Other Special Revenue Funds: Street Lighting61,759 $ CDBG357,064 Gas Tax489,620 ATV Public Access9,282 Measure S363,000 85
Expenditures in Excess of Appropriations
NOTES TO FINANCIAL STATEMENTS (CONTINUED) FOR THE YEAR ENDED JUNE 30, 2022
Note 20: Fund Balance and Net Position
a. Net investment in capital assets
The breakdown for net investment in capital assets for the year ended June 30, 2022 is as follows:
Business-Type Activities
Total GovernmentalWaterGolfSewer and StormBusiness-Type ActivitiesFundFundDrain FundActivities
Capital assets, net of accumulated depreciation 278,933,246 $ 42,507,562 $ 13,882,933 $ 27,872,944 $ 84,263,439 $
Less: Bonds, notes and finance purchase agreements (45,588,256) (3,519,745) (2,770,000) (988,992) (7,278,737) Leases payable (1,550,366) - - -Capital related, non-debt payable (700,823) (446,118) - - (446,118)
Net investment in capital assets 231,093,801 $ 38,541,699 $ 11,112,933 $ 26,883,952 $ 76,538,584 $
b. Restatements – Custodial Funds
Fiduciary activities were restated due to the following adjustments:
Beginning net position of the custodial funds on the Statement of Changes in Fiduciary Net Position has been restated by $211,771 due to donations received in FY2020-2021 not properly recorded.
Note 21: Successor Agency Trust for Assets of Former Redevelopment Agency
On December 29, 2011, the California Supreme Court upheld Assembly Bill 1X 26 (“the Bill”) that provides for the dissolution of all redevelopment agencies in the State of California. This action impacted the reporting entity of the City of Downey that previously had reported a redevelopment agency within the reporting entity of the City as a blended component unit.
The Bill provides that upon dissolution of a redevelopment agency, either the city or another unit of local government will agree to serve as the “successor agency” to hold the assets until they are distributed to other units of state and local government. The City Council elected to become the Successor Agency for the former redevelopment agency. The assets and liabilities of the former redevelopment agency were transferred to the Successor Agency to the Community Development Commission of the City of Downey on February 1, 2012, as a result of the dissolution of the former redevelopment agency.
After enactment of the law, which occurred on June 28, 2011, redevelopment agencies in the State of California cannot enter into new projects, obligations or commitments. Subject to the control of a newly established oversight board, remaining assets can only be used to pay enforceable obligations in existence at the date of dissolution (including the completion of any unfinished projects that were subject to legally enforceable contractual commitments).
In future fiscal years, successor agencies will only be allocated revenue in the amount that is necessary to pay the estimated annual installment payments on enforceable obligations of the former redevelopment agency until all enforceable obligations of the prior redevelopment agency have been paid in full and all assets have been liquidated.
CITY
OF DOWNEY
86
NOTES TO FINANCIAL STATEMENTS (CONTINUED) FOR THE YEAR ENDED JUNE 30, 2022
Note 21: Successor Agency Trust for Assets of Former Redevelopment Agency (Continued)
Management believes, in consultation with legal counsel, that the obligations of the former redevelopment agency due to the City are valid enforceable obligations payable by the successor agency trust under the requirements of the Bill. The City’s position on this issue is not a position of settled law and there is considerable legal uncertainty regarding this issue. It is reasonably possible that a legal determination may be made at a later date by an appropriate judicial authority that would resolve this issue unfavorably to the City.
The City is acting in a fiduciary capacity for the assets and liabilities. Disclosures related to these transactions are as follows:
a. Cash and investments
Cash and investments reported in the accompanying financial statements consisted of the following:
Cash and investments pooled with the City 1,672,957 $ Cash and investments with fiscal agent 643,250 2,316,207 $
b. Long-Term Debt
The following long-term debts were transferred from the Redevelopment Agency to the Successor Agency on February 1, 2012, as a result of the dissolution. A description of long-term debt outstanding (excluding defeased debt) of the Successor Agency as of June 30, 202, follows:
Balance BalanceDue Within June 30, 2021AdditionDeletionJune 30, 2022One Year
Bonds payable 4,120,000 $ - $ 430,000 $ 3,690,000 $ 450,000 $ Advances from City 8,942,185 - 549,731 8,392,454Advances from County 35,686,497 2,498,055 - 38,184,552 -
Total long-term liabilities48,748,682 $ 2,498,055 $ 979,731 $ 50,267,006 $ 450,000 $
Bonds Payable
1997 Tax Allocation Bonds Payable
In 1997 the Community Development Commission issued $9,925,000 in Tax Allocation Bonds, partially to advance refund the existing 1990 Tax Allocation bond issue, which had a balance outstanding of $4,470,000, and to repay the City for advances of $3,970,508 plus interest. The bonds have an average interest rate of 5.1%. U.S. Bank serves as trustee for payment of principal and interest. The balance outstanding at June 30, 2022, is $3,690,000.
CITY OF DOWNEY
87
NOTES TO FINANCIAL STATEMENTS (CONTINUED) FOR THE YEAR ENDED JUNE 30, 2022
Note 21: Successor Agency Trust for Assets of Former Redevelopment Agency (Continued)
The future debt service requirements on these bonds are as follows:
Year Ending June 30, PrincipalInterestTotal
2023 450,000 $ 177,581 $ 627,581 $ 2024 475,000 153,878 628,878 2025 500,000 128,894 628,894 2026 525,000 102,628 627,628 2027 550,000 75,081 625,081
2028 580,000 46,125 626,125 2029 610,000 15,631 625,631
Total3,690,000 $ 699,818 $ 4,389,818 $
The outstanding bonds contain a provision that if any event of default should occur or continue to occur, the Trustee may, with the prior written consent of the Bond Insurer, and if request by the Bond Insurer and at the written direction of the Owners of a majority in aggregate principal amount of the Bonds at the time outstanding shall, (a) upon notice in writing to the Commission, declare the principal of all of the Bonds then outstanding, and the interest accrued thereon, to be due and payable immediately, of (b) enforce any rights of the Trustee under or with respect to the Owners of the Bonds for the purpose of exercising and prosecuting on their behalf such rights and remedies as may be available to such Owners under the provisions of the Bonds, the Indenture and applicable provisions of any law.
Pledged Revenue
The City pledged, as a security for bonds issued through the Community Development Commission, a portion of tax increment revenue that it receives. Assembly Bill 1X26 provided that upon dissolution of the Redevelopment Agencies (known as the Community Development Commission), property taxes allocated to redevelopment agencies no longer are deemed tax increment but rather property tax revenues and will be allocated first to successor agencies to make payments on the indebtedness incurred by the dissolved redevelopment agency. Total principal and interest remaining on the debt is $4,389,819 with annual debt service requirements indicated above. For the current year, the total property tax revenue recognized by the Successor Agency for the payment of indebtedness incurred by the dissolved redevelopment agency was $1,636,325 and the debt obligation on the bonds was $630,131.
Advances from City
The DOF issued a Finding of Completion on May 15, 2013, in which DOF concurred that the Successor Agency has made full payments of any payments required as a result of the due diligence reviews. The Finding of Completion allows the placement of loan agreements between the former redevelopment agency and the City on the ROPS, as an enforceable obligation, provided the oversight board makes a finding that the loan was for legitimate redevelopment purposes. Loan repayments could begin in the 2015-16, fiscal year as governed by the criteria in the health and code safety section. When the repayments begin, 20% of the repayments of the loan agreement amounts are to be allocated to the Housing Successor Agency. As of June 30, 2022, the long-term advances totaled $8,392,454. As of June 30, 2022, $5,766,705 is reported in the General Fund, $1,271,173 is reported in Employee Benefit Internal Service Fund and $1,354,576 is reported in the Housing Authority Special Revenue Fund.
CITY OF DOWNEY
88
NOTES TO FINANCIAL STATEMENTS (CONTINUED) FOR THE YEAR ENDED JUNE 30, 2022
Note 21: Successor Agency Trust for Assets of Former Redevelopment Agency (Continued)
Advances from County
As part of the City’s redevelopment program, the City and County of Los Angeles have entered into a tax increment pass-through deferral agreement. This agreement specifies that the City will defer the payment of all current tax increment pass-through due to the County, until some future date, when certain conditions are met. Until that time, the County will charge 7% interest on the outstanding deferral amount. During the year, there were no pass-through agreement amounts owed to the County that were deferred. Interest of $2,498,055 was also accrued during the year on the outstanding deferral amount still owing. The amount owed the County, including accrued interest, at June 30, 2022, was $38,184,552.
CITY OF DOWNEY
89
90
THIS PAGE INTENTIONALLY LEFT BLANK


91
AGENT MULTIPLE-EMPLOYER MISCELLANEOUS PLAN
SCHEDULE OF CHANGES IN THE NET PENSION LIABILITY AND RELATED RATIOS
AS OF JUNE 30, FOR THE LAST TEN FISCAL YEARS (1)
2022 2021 2020 2019
Total Pension Liability Service Cost 2,872,012 $ 2,859,113 $ 2,845,628 $ 2,747,310 $
Interest on total pension liability 14,690,04114,297,75113,871,616 13,432,640
Differences between expected and actual experience (521,832) (82,862) 279,451 793,693
Changes in assumptions (1,002,999)
Benefit payments, including refunds of employee contributions (11,561,991)(10,747,851)(10,614,492) (10,123,596)
Net change in total pension liability 5,478,2306,326,1516,382,203 5,847,048
Total pension liability - beginning 210,321,943203,995,792197,613,589 191,766,541
Total pension liability - ending (a) 215,800,173 $ 210,321,943 $ 203,995,792 $ 197,613,589 $
Plan fiduciary net position
Contributions - employer 39,587,168 $ 5,960,428 $ 5,194,316 $ 4,644,243 $
Contributions - employee 1,233,7501,211,6651,290,943 1,259,290
Differences in projected and actual earnings -
Net investment income 35,352,3537,030,4778,947,221 10,970,946
Plan to plan resource movement 3,965 - - (320)
Administration expense (145,392)(200,597) (98,174) (204,781)
Benefit payments (11,561,991)(10,747,851)(10,614,492) (10,123,596)
Other miscellaneous income (expense) - - 320 (388,883)
Net change in plan fiduciary net position 64,469,8533,254,1224,720,134 6,156,899
Plan fiduciary net position - beginning 145,546,316142,292,194137,572,060 131,415,161
Plan fiduciary net position - ending (b) 210,016,169 $ 145,546,316 $ 142,292,194 $ 137,572,060 $
Net pension liability - ending (a)-(b) 5,784,004 $ 64,775,627 $ 61,703,598 $ 60,041,529 $
Plan fiduciary net position as a percentage of the total pension liability 97.32% 69.20% 69.75% 69.62%
Covered payroll 15,170,622 $ 14,924,957 $ 14,982,015 $ 14,116,181 $
Net pension liability as a percentage of covered payroll 38.13% 434.01% 411.85% 425.34%
Notes to Schedule:
Benefit Changes: There were no changes in benefits. The figures above do not include any liability impact that may have resulted from plan changes which occurred on or before the Measurement date. However, offers of Two Years Additional Service Credit (a.k.a. Goldern Handshakes) that occured after the June 30, 2020 valuation date are not included in the figures above, unless the liability impact is deemed to be material by the plan actuary.
Changes of Assumptions: None in 2019, 2020, or 2021. In 2018, demographic assumptions and inflation rate were changed in accordance to the CalPERS Experience Study and Review of Actuarial Assumptions December 2017. There were no changes in the discount rate. In 2017, the accounting discount rate reduced from 7.65 percent to 7.15 percent. In 2016, there were no changes. In 2015, amounts reported reflect an adjustment of the discount rate from 7.5 percent (net of administrative expense) to 7.65 percent (without a reduction for pension plan administrative expense.) In 2014, amounts reported were based on the 7.5 percent discount rate.
(1) Fiscal Year 2015 was the first year of implementation, therefore only eight years are shown.
CITY OF DOWNEY
See Notes to Required Supplementary Information. 92
2018 2017 2016 2015
2,636,289 $ 2,361,815 $ 2,372,336 $ 2,312,390 $ 13,024,83912,804,33212,400,751 12,026,911 (1,684,960)(437,509)(872,403)10,503,420 -(2,930,596)(9,484,059)(9,182,237)(8,927,251) (8,720,279) 14,995,5295,546,4012,042,837 5,619,022 176,771,012171,224,611169,181,774 163,562,752 191,766,541 $ 176,771,012 $ 171,224,611 $ 169,181,774 $
4,191,836 $ 3,645,344 $ 3,324,338 $ 2,487,187 $ 1,209,4281,158,3991,307,613 1,333,703 - -(6,742,788)13,489,599600,9359,576,038 19,329,661 (957) - 9,214(180,405)(76,817)(141,638)(9,484,059)(9,182,237)(8,927,251) (8,720,279)9,225,442(3,854,376)(1,594,474) 14,430,272 122,189,719126,044,095127,599,058 113,168,786 131,415,161 $ 122,189,719 $ 126,004,584 $ 127,599,058 $
60,351,380 $ 54,581,293 $ 45,220,027 $ 41,582,716 $ 68.53%69.12%73.59% 75.42% 13,171,100 $ 12,471,112 $ 11,295,425 $ 11,873,874 $ 458.21%437.66%400.34% 350.20%
See Notes to Required Supplementary Information. 93
AGENT MULTIPLE-EMPLOYER MISCELLANEOUS PLAN SCHEDULE OF PLAN CONTRIBUTIONS AS OF
JUNE 30, FOR THE LAST TEN FISCAL YEARS (1) 2022 2021 2020 2019
MISCELLANEOUS PLAN:
Actuarially Determined Contribution
3,688,975 $ 6,483,145 $ 5,961,098 $ 5,196,100 $ Contribution in Relation to the Actuarially Determined Contributions (3,688,975)(39,588,358)(5,961,098) (5,196,100) Contribution Deficiency (Excess) - $ (33,105,213) $$ - $
Covered payroll 16,964,041 $ 15,170,622 $ 14,924,957 $ 14,982,015 $
Contributions as a Percentage of Covered Payroll 21.75%260.95%39.94% 34.68%
(1)HistoricalinformationisrequiredonlyformeasurementforwhichGASB68isapplicable.FiscalYear2015wasthefirstyearofimplementation, therefore only eight years are shown.
Note to Schedule:
Valuation Date: June 30, 2019
Covered-employee payroll
Single and Agent Employers Entry age normal
Amortization method Level Percent of Payroll
Remaining amortization period
Assets valuation method Direct rate smoothing
Inflation 2.50% Payroll growth 2.75% Investment rate of return
Retirement age
Mortality
7.00%netofpensioninvestmentandadministrativeexpenses, including inflation.
AllotheractuarialassumptionsusedintheJune30,2019valuation werebasedontheresultsofanactuarialexperiencestudydated December2017.Includingupdatestosalaryincrease,mortalityand retirementrates.TheExperienceStudyreportmaybeaccessedon theCalPERSwebsiteatwww.calpers.ca.govunderformsand publications.
ThemortalitytableusedwasdevelopedusingCalPERS'specificdata. Thetableincludes15yearsofmortalityimprovementsusing90 percentofSocietyofActuaries'Scale2016.Formoredetailsonthis table please refer to the 2017 experience study report.
CITY OF DOWNEY
See Notes to Required Supplementary Information. 94
4,645,952 $ 4,191,472 $ 3,642,086 $ 3,324,338 $ (4,645,952)(4,191,472)(3,642,086) (3,324,338) - $ - $ - $ - $
14,116,181 $ 13,171,100 $ 12,471,112 $ 11,295,425 $ 32.91%31.82%29.20% 29.43%
2018 2017 2016 2015
See Notes to Required Supplementary Information. 95
AGENT MULTIPLE-EMPLOYER SAFETY PLANS
SCHEDULE OF
CHANGES
IN THE NET
PENSION LIABILITY AND RELATED RATIOS
AS OF JUNE 30, FOR THE LAST TEN FISCAL YEARS (1)
2022 2021 2020 2019
Total Pension Liability Service Cost 7,124,490 $ 7,169,250 $ 6,716,100 $ 6,437,149 $
Interest on total pension liability 30,838,84029,942,37028,659,471 27,362,871
Differences between expected and actual experience (3,092,936)2,675,7923,650,077 2,585,511
Changes in assumptions (1,530,502)
Benefit payments, including refunds of employee contributions (22,290,600)(20,625,915)(20,044,668) (18,865,980)
Net change in total pension liability 12,579,79419,161,49718,980,980 15,989,049
Total pension liability - beginning 441,988,439422,826,942403,845,962 387,856,913
Total pension liability - ending (a) 454,568,233 $441,988,439$422,826,942 $ 403,845,962 $
Plan fiduciary net position
Contributions - employer 94,012,641 $ 13,218,555 $ 11,639,905 $ 10,227,586 $
Contributions - employee 2,467,9162,433,9732,388,761 2,184,777
Differences in projected and actual earnings -
Net investment income 73,568,41614,351,50018,021,079 21,925,706
Plan to plan resource movement (3,965) - - (642)
Administration expense (296,482)(405,763)(196,971) (407,843)
Benefit payments (22,290,600)(20,625,915)(20,044,668) (18,865,980)
Other miscellaneous income (expense) - - 642 (774,501)
Net change in plan fiduciary net position 147,457,9268,972,35011,808,748 14,289,103
Plan fiduciary net position - beginning 296,797,565287,825,215276,016,467 261,727,364
Plan fiduciary net position - ending (b) 444,255,491 $296,797,565$287,825,215 $ 276,016,467 $
Net pension liability - ending (a)-(b) 10,312,742 $ 145,190,874 $135,001,727 $ 127,829,495 $
Plan fiduciary net position as a percentage of the total pension liability 97.73%67.15%68.07% 68.35%
Covered payroll 19,537,373 $ 19,075,819 $ 22,440,568 $ 17,853,242 $
Net pension liability as a percentage of covered payroll 52.78%761.13%601.60% 716.00%
Notes to Schedule:
Benefit Changes: There were no changes in benefits. The figures above do not include any liability impact that may have resulted from plan changes which occurred on or before the Measurement Date. However, offers of Two Years Additional Service Credit (a.k.a. Goldern Handshakes) that occured after the June 30, 2020 valuation date are not included in the figures above, unless the liability impact is deemed to be material by the plan actuary.
Changes of Assumptions: None in 2019, 2020, or 2021. In 2018, demographic assumptions and inflation rate were changed in accordance to the CalPERS Experience Study and Review of Actuarial Assumptions December 2017. There were no changes in the discount rate. In 2017, the accounting discount rate reduced from 7.65 percent to 7.15 percent. In 2016, there were no changes. In 2015, amounts reported reflect an adjustment of the discount rate from 7.5 percent (net of administrative expense) to 7.65 percent (without a reduction for pension plan administrative expense.) In 2014, amounts reported were based on the 7.5 percent discount rate.
(1) Fiscal Year 2015 was the first year of implementation, therefore only eight years are shown.
CITY OF DOWNEY
See Notes to Required Supplementary Information. 96
2018 2017 2016 2015
6,338,175 $ 5,590,668 $ 5,458,319 $ 5,427,672 $ 26,270,78525,769,92824,744,572 23,998,427 (5,710,849)160,089(3,331,302)22,209,649 -(6,140,951)(18,013,052)(17,329,717)(16,721,908) (16,257,568) 31,094,70814,190,9684,008,730 13,168,531 356,762,205342,571,237338,562,507 325,393,976 387,856,913 $ 356,762,205 $342,571,237 $ 338,562,507 $
8,809,223 $ 8,092,171 $ 6,745,873 $ 5,817,524 $ 2,003,3021,996,0001,919,372 1,883,501 - -(13,442,866)26,775,6701,189,16318,916,599 38,057,937 - - (191)(358,050)(151,578)(279,890)(18,013,052)(17,329,717)(16,721,908) (16,257,568) -
19,217,093(6,203,961)(2,863,011) 29,501,394 242,510,271248,714,232251,581,146 222,079,752 261,727,364 $ 242,510,271 $248,718,135 $ 251,581,146 $
126,129,549 $ 114,251,934 $93,853,102 $ 86,981,361 $ 67.48%67.98%72.60% 74.31% 17,580,987 $ 17,580,987 $ 17,248,670 $ 18,232,334 $ 717.42%649.86%544.12% 477.07%
See Notes to Required Supplementary Information. 97
AGENT MULTIPLE-EMPLOYER SAFETY PLAN SCHEDULE OF PLAN CONTRIBUTIONS AS OF
JUNE 30, FOR THE LAST TEN FISCAL YEARS (4)
SAFETY PLAN:
2022 2021 2020 2019
9,058,878 $ 14,194,005 $ 13,217,885 $ 11,638,120 $ Contribution in Relation to the Actuarially Determined Contributions (9,058,878)(94,011,449)(13,217,885) (11,638,120) Contribution Deficiency (Excess) - $ (79,817,444) $$ - $
Actuarially Determined Contribution
Covered payroll 24,780,834 $ 19,537,373 $ 19,075,819 $ 22,440,568 $
Contributions as a Percentage of Covered Payroll 36.56%481.19%69.29% 51.86%
(1)HistoricalinformationisrequiredonlyformeasurementforwhichGASB68isapplicable.FiscalYear2015wasthefirstyearofimplementation, therefore only eight years are shown.
Note to Schedule:
Valuation Date: June 30, 2019
Methods and assumptions used to determine contribution rates: Single and Agent EmployersEntry age normal Amortization methodLevel percentage of payroll Assets valuation methodDirect rate smoothing Inflation 2.50% Payroll growth2.75% Investment rate of return
Retirement age
Mortality
7.00%NetofPensionPlanInvestmentandAdministrativeExpenses; includes Inflation
AllotheractuarialassumptionsusedintheJune30,2019valuation werebasedontheresultsofanactuarialexperiencestudydated December2017.Includingupdatestosalaryincrease,mortalityand retirementrates.TheExperienceStudyreportmaybeaccessedonthe CalPERS website at www.calpers.ca.gov under forms and publications.
ThemortalitytableusedwasdevelopedusingCalPERS'specificdata. Thetableincludes15yearsofmortalityimprovementsusing90 percentofSocietyofActuaries'Scale2016.Formoredetailsonthis table please refer to the 2017 experience study report.
CITY
OF DOWNEY
See Notes to Required Supplementary Information. 98
10,225,876 $ 8,809,589 $ 8,092,171 $ 6,745,873 $ (10,225,876)(8,809,589)(8,092,171) (6,745,873) - $ - $ - $ - $
17,853,242 $ 17,580,987 $ 14,881,199 $ 11,125,500 $ 57.28%50.11%54.38% 60.63%
2018 2017 2016 2015
See Notes to Required Supplementary Information. 99
SCHEDULE OF CHANGES IN THE NET OPEB LIABILITY AND RELATED RATIOS AS OF JUNE 30, FOR THE LAST TEN FISCAL YEARS (1)
Total OPEB Liability
Service cost
383,096 $ 371,938 $ 359,310 $ 347,999 $ 337,046 $
Interest on the total OPEB liability 985,640 953,0191,102,7081,056,820 1,015,622
Actual and expected experience difference (288,995) -(1,107,411) - -
Changes in assumptions 1,185,773 - (887,283) - -
Benefit payments (911,116)(815,594)(814,729)(756,887) (838,553)
Net change in total OPEB liability 1,354,398 509,363(1,347,405) 647,932 514,115
Total OPEB liability - beginning 14,357,09513,847,73215,195,13714,547,205 14,033,090
Total OPEB liability - ending (a) 15,711,49314,357,09513,847,73215,195,137 14,547,205
Plan Fiduciary Net Position
Contribution - employer
911,1161,104,427 814,729 966,887 1,008,553
Net investment income 2,322,102 276,981 458,848 532,762 623,878
Benefit payments (911,116)(815,594)(814,729)(756,887) (838,553)
Administrative expense (3,196) (3,937) (1,591) (3,569) (3,167)
Other expenses - - - (8,860) -
Net change in plan fiduciary net position 2,318,906 561,877 457,257 730,333 790,711
Plan fiduciary net position - beginning 8,448,7697,886,8927,429,6356,699,302 5,908,591
Plan fiduciary net position - ending (b) 10,767,6758,448,7697,886,8927,429,635 6,699,302
Net OPEB Liability/(Assets) - ending (a) - (b) 4,943,818 $ 5,908,326 $ 5,960,840 $ 7,765,502 $ 7,847,903 $
Plan fiduciary net position as a percentage of the total OPEB liability 68.53% 58.85% 56.95% 48.89% 46.05%
Covered payroll 46,751,162 $ 46,420,079 $ 44,034,470 $ 36,149,553 $ 34,730,877 $
Net OPEB liability as a percentage of covered payroll 10.57% 12.73% 13.54% 21.48% 22.60%
(1)HistoricalinformationisrequiredonlyforthemeasurementperiodsforwhichGASB75isapplicable.FiscalYear2018wasthefirstyearofimplementation.Futureyears'informationwillbedisplayedupto 10 years as information becomes available.
Notes to Schedule: None.
Changesinassumptions: Thetrustrateofreturndecreasedfrom6.9%to6.15%netofplaninvestment expenses,reflectingupdatedlongtermratesofreturnprovidedbyCalPERSinMarch2022.The discoountratedecreasedfrom6.9%to6.15%,reflectingupdatedlongterm ratesofterundescribedabove,themunicipalbondindexrateasofthemeasurementdateandtheresultsofanalysisdescribedin GASB75paragraphs36-41.ThemortalityimprovementscalewasupdatedfromMacLeodWattsScale2018toMacLeodWattsScale2022,reflectingcontinuedupdatesinavailableinformation(seeAddendum 3). Updated the base healthcare tred scale from Getzen Model 2019_b to Getzen Model 2022_b, as published by the Society of Actuaries.
CITY OF DOWNEY
2022 2021 2020 2019 2018
See Notes Required to Supplementary Information. 100
SCHEDULE OF CONTRIBUTIONS - OPEB
AS OF JUNE 30, FOR THE LAST TEN FISCAL YEARS (1)
Actuarially Determined Contribution Contribution in Relation to the Actuarially Determined Contributions Contribution Deficiency (Excess)
Covered payroll
Contributions as a percentage of covered payroll
2022 2021 2020 2019 2018 977,849 $ 958,316 $ 1,112,086 $ 1,103,345 $ 957,045 $ (977,849) (911,116)(1,104,427) (814,699) (966,887) - $ 47,200 $ 7,659 $ 288,646 $ (9,842) $
48,236,864 $ 46,751,162 $ 46,420,079 $ 44,034,470 $ 36,149,553 $ 2.03%2.05%2.40%2.51% 2.65%
(1)HistoricalinformationisrequiredonlyforthemeasurementperiodsforwhichGASB75isapplicable.FiscalYear2018wasthefirstyearofimplementation.Futureyears'informationwillbedisplayedup to 10 years as information becomes available.
Notes to Schedule: None.
*Actuarial methods and assumptions used to set the actuarially determined contribution for Fiscal Year 2018 were from the June 30, 2015 actuarial valuation.
Methods and assumptions used to determine contributions:
Actuarial Cost Method
Amortization Valuation Method/Period
Entry Age Normal Level percent of payroll
Asset Valuation Method Market value Inflation 2.50% Payroll Growth 3.00% Investment Rate of Return Healthcare cost-trend rates Retirement Age Mortality
6.80% net of plan investment expenses and including inflation
6.5% in 2021 fluctuating down to 4% in 2076 50 to 75
2017 CalPERS Experience study; Improvement using MacLeod Watts Scale 2020.
CITY OF DOWNEY
See Notes Required to
101
Supplementary Information.
BUDGETARY COMPARISON SCHEDULE GENERAL FUND
FOR THE YEAR ENDED JUNE 30, 2022
Variance with Final Budget
Budget Amounts Actual Positive Original Final Amounts(Negative)
Budgetary Fund Balance, July 1 34,448,517 $ 34,448,517 $ 34,448,517 $ - $ Resources (Inflows):
Taxes: Property 32,234,27332,234,27332,699,106 464,833
Transient occupancy 1,700,0001,700,0001,768,645 68,645 Sales 25,015,72825,015,72828,019,366 3,003,638 Franchise and other 15,766,01015,916,01018,693,475 2,777,465
Licenses and permits
1,523,5501,523,5501,781,141 257,591 Intergovernmental 682,500891,6441,633,682 742,038
Charges for services 10,134,96010,134,96013,007,414 2,872,454
Use of money and property 2,055,2842,055,284 248,292 (1,806,992)
Fines and forfeitures 1,765,2001,765,2001,749,473 (15,727) Miscellaneous 3,313,1003,406,5243,830,620 424,096
Proceeds from sale of capital asset--13,869,713 13,869,713
Transfers In 2,511,6887,772,3478,539,114 766,767
Amounts Available for Appropriations 131,150,810136,864,037160,288,55823,424,521
Charges to Appropriations (Outflows):
General Government:
General Government Administration 969,231 969,2311,209,656 (240,425)
City Council 352,566352,566369,026 (16,460)
City Attorney 208,879208,879305,625 (96,746)
City Clerk 474,651474,651629,409 (154,758)
City Manager 1,239,9491,239,9491,803,955 (564,006)
Human Resources 1,533,0491,533,0491,397,630 135,419
Finance 6,529,8486,529,8487,196,516 (666,668)
Total General Government 11,308,17311,308,17312,911,817 (1,603,644)
Public Safety: Police
37,592,50137,592,50138,244,631 (652,130) Fire 24,099,84026,140,07225,198,395 941,677
Total Public Safety 61,692,34163,732,57363,443,026 289,547
Public Works: Public Works Administration
841,570 991,570 917,958 73,612 Engineering 1,674,2801,674,280 1,099,106575,174 Maintenance 4,602,0024,602,002 5,555,516(953,514) Utilities 2,649,9962,649,996 2,742,652(92,656)
Total Public Works 9,767,8489,917,84810,315,232 (397,384)
Community Development: Building and Safety 1,211,3741,211,3741,220,902 (9,528) Code Enforcement 1,168,7141,168,7141,142,252 26,462 Planning 1,279,1961,279,1961,203,738 75,458
Total Community Development 3,659,2843,659,2843,566,892 92,392
Community Services: Recreation Department8,135,3958,560,8577,778,787 782,070 Total Community Services 8,135,3958,560,8577,778,787 782,070
Capital Outlay 220,398220,398362,690 (142,292)
Debt service: Principal retirement 950,000 950,000 950,000Interest and fiscal charges 749,307 749,3074,071,380 (3,322,073)
Total Debt Service 1,699,3071,699,3075,021,380 (3,322,073)
Total Charges to Appropriations 96,482,74699,098,440103,399,824 (4,301,384)
Other Financing Uses: Transfers out 1,061,5002,943,3363,426,602 483,266
Total Financing Uses 1,061,5002,943,3363,426,602 483,266
Budgetary Fund Balance, June 30 33,606,564 $ 34,822,261 $ 53,462,132 $ 19,606,403 $
CITY OF DOWNEY
See Notes to Required Supplementary Information. 102
BUDGETARY COMPARISON SCHEDULE
HOUSING AUTHORITY
YEAR ENDED JUNE 30, 2022
Variance with Final Budget
Budget Amounts ActualPositive OriginalFinalAmounts(Negative)
Budgetary Fund Balance, July 1 3,490,908 $3,490,908$3,490,908 $ - $ Resources (Inflows): Use of money and property 10,00010,00015,434 5,434 Miscellaneous 50,00050,000218,644168,644 Amounts Available for Appropriations3,550,9083,550,9083,724,986 174,078
Charges to Appropriations (Outflow): Community development Economic Dev & Housing215,800215,80055,570160,230 Total Charges to Appropriations 215,800215,80055,570160,230
Budgetary Fund Balance, June 30 3,335,108 $3,335,108$3,669,416$334,308 $
CITY OF DOWNEY
See
103
Notes to Required Supplementary Information.
BUDGETARY COMPARISON SCHEDULE
CIP GRANT FUND
YEAR ENDED JUNE 30, 2022
Variance with Final Budget
ActualPositive OriginalFinalAmounts(Negative)
Budget Amounts
Budgetary Fund Deficit, July 1 (3,167,278) $ (3,167,278) $ (3,167,278) $$ Resources (Inflows): Intergovernmental 47,928,43940,252,7336,982,732(33,270,001)
Amounts Available for Appropriations44,761,16137,085,4553,815,454(33,270,001) Charges to Appropriations (Outflow): Capital outlay 47,928,43939,513,7428,106,40331,407,339
Total Charges to Appropriations 47,928,43939,513,7428,106,40331,407,339
Budgetary Fund Deficit, June 30 (3,167,278) $ (2,428,287) $ (4,290,949) $ (1,862,662) $
CITY OF DOWNEY
See
104
Notes to Required Supplementary Information.
BUDGETARY COMPARISON SCHEDULE COVID-19
GRANTS
YEAR ENDED JUNE 30, 2022
Variance with Final Budget
Budget Amounts ActualPositive OriginalFinalAmounts(Negative)
Budgetary Fund Balance, July 1 16,427 $ 16,427 $ 16,427 $$ Resources (Inflows): Intergovernmental -4,647,6596,734,6822,087,023
Amounts Available for Appropriation 16,4274,664,0866,751,1092,087,023
Charges to Appropriation (Outflow):
General government - -43,777(43,777) Public safety 10,00010,000256,919(246,919) Community development - -700,092(700,092) Parks and recreation - -292,492(292,492) Public works - -218,908(218,908)
Transfers out -13,272,6595,275,358 7,997,301
Total Charges to Appropriations 10,00013,282,6596,787,5466,495,113
Budgetary Fund Deficit, June 30 6,427 $ (8,618,573) $ (36,437) $ 8,582,136 $
CITY OF DOWNEY
See
to
Information. 105
Notes
Required Supplementary
NOTE TO REQUIRED SUPPLEMENTARY INFORMATION FOR THE YEAR ENDED JUNE 30, 2022
Note 1: Budgetary Data
General Budget Policies
The City is required by its charter to adopt an annual budget on or before June 30th for the ensuing fiscal year. From the effective date of the budget, the proposed expenditures become appropriations to the various City departments. This “appropriated budget” covers substantially all City expenditures, with the exception of debt service on bonds, which expenditures constitute legally authorized “non-appropriated budget.” There are no significant non-budgeted activities. The City Council passes various amendments to the budget during the year.
The City prepares its budgets on the basis of actual expenditures and, accordingly, the budget amounts included in the accompanying financial statements are presented on a basis substantially consistent with generally accepted accounting principles. The level of budgetary control is the department level, classified in accordance with Note 1D, within the fund. However, the City Manager is authorized to transfer amounts between divisions within a department without seeking City Council approval.
Expenditures in Excess of Appropriations
The following departments/funds reported expenditures in excess of appropriations:
Major Fund: General Fund
General Government Administration (240,425) $ City Council (16,460) City Attorney (96,746) City Clerk (154,758) City Manager (564,006) Finance (666,668) Police (652,130) Maintenance (953,514) Utilities (92,656) Building and Safety (9,528) (3,446,891) $
The City did not adopt a budget for their Asset Forfeiture special revenue fund.
CITY OF DOWNEY
106
OTHER GOVERNMENTAL FUNDS
The combining statements for Other Governmental Funds represent a consolidation of the information for specific funds contained in the Supplementary Financial Statements. These statements summarize the financial information contained in Other Special Revenue Funds, another Capital Projects Fund, Internal Service Funds and Agency Funds.
107
OTHER SPECIAL REVENUE FUNDS
Special Revenue Funds account for taxes and other revenues set aside in accordance with law or administrative regulations for a specified purpose.
Waste Reduction Fund is used to account for funds collected pursuant to AB 939 and used to pay for recycling and other waste reduction programs.
Street Lighting Fund is used to account for the property taxes and assessments levied on real property located within the City’s Street Lighting District. The revenues in this fund are used to pay for the electric and other costs associated with the streetlights, traffic signals and street trees.
HOME Fund is used to account for the operations of the HOME Investment Partnership Program. Major sources of revenues are repayments received on rehab loans.
Hazardous Material Fund is used to account for all supporting operations related to the hazardous material program administered by the City’s Fire Department.
CATV Public Access Fund is used to account for revenues received from the City’s cable TV franchise company pursuant to the franchise agreements.
Air Quality Fund is used to account for all charges related to air quality, such as carpooling, etc.
Grants Fund is used to account for revenues received from various grants for park and other non-street capital improvements.
CDBG Fund is required by federal regulations to account for the use of grant funds received from the federal government. Other revenues in this fund are reimbursements of loans to beneficiaries of a particular housing program or the sale of real property in the furtherance of block grant programs. All such other revenues are “program income” and are considered to be federal revenues.
Asset Forfeiture Fund is used to account for all revenues and expenditures related to the federal asset forfeiture program.
Transit Prop C Fund accounts for restricted transit revenues the City receives pursuant to a County ballot measure, Proposition C. Funds are used for eligible street improvement projects.
Transit Prop A Fund accounts for special revenues the City receives pursuant to a County ballot measure. The City uses funds to support senior citizen and disabled bus operation run by the City, along with the Downey Link Fixed Route Service.
Transit Measure R Fund accounts for ballot Measure R funds approved by Los Angeles County. Funds are used to relieve traffic congestion by providing for mass transit systems, roadway repairs, traffic signal synchronization and pedestrian walkways and paths.
Gas Tax Fund is required by state law to account for gas taxes allocated by the State. The State levies various taxes on gasoline and other motor fuels, which are allocated among the State, cities and counties by formula.
LSTA Grant Fund is used to account for revenues received from library grants.
Measure S 2017 LRB Fund is used to account for special revenues from half cent sales tax for infrastructure improvements and enhanced public safety services.
SB1 Transportation Fund This revenue is known as the road repair and accountability act of 2017 and is a motor vehicle fuel tax enacted to address basic road maintenance, rehabilitation, and critical safety needs on state highway and local streets and road systems. Taxes and fees received by the City will be deposited into a newly created Road Maintenance and Rehabilitation Account (RMRA) Fund.
108
OTHER SPECIAL REVENUE FUNDS (Continued)
Measure S Sales Tax Fund is used to account for special revenues from a half cent sales tax for infrastructure improvements and enhanced public safety services. Of the revenues received, half go to the General fund for Public Safety expenditures. The remaining half goes to the Measure S Sales Tax fund for debt service and capital improvements.
Transit Measure M Fund This revenue is derived from a County voter approved sales tax to meet the transportation needs of the County of Los Angeles. The expenditures for this fund must be related to the transportation projects and programs, such as roadway repairs, traffic signal synchronization and pedestrian walkways and paths, Measure M increases to 1% once Measure R expires in 2039.
Asset Forfeiture - State Fund is used to account for all revenues and expenditures related to the state asset forfeiture program.
Measure W -Sewer & Storm Drain Fund This revenue is derived from a County voter approved parcel tax to provide funding for projects to improve sewer and storm drain filtration.
Art in Public Places Fund is used to account for revenues and expenditures for the original artworks that are accessible to the public throughout the City.
Measure M Bond 2021A is used to track the issuances of new bonds to be used to finance street projects funded by Measure M and Measure R sales tax revenues.
Measure R Bond 2021A is used to track the issuances of new bonds to be used to finance street projects funded by Measure M and Measure R sales tax revenues.
CAPITAL PROJECTS FUND
City Capital Project Fund is used to account for City projects funded by various sources.
109
COMBINING BALANCE SHEET NONMAJOR GOVERNMENTAL FUNDS
JUNE 30, 2022
Assets:
Special Revenue Funds
Waste Reduction Street Lighting HOME Hazardous Material
Pooled cash and investments 21,795 $ 416,149 $ 929,937 $ 13,051 $ Receivables: Accounts 43,408 66,265 -Taxes
Notes and loans - - 4,899,577Due from other governments - - 21,061 515 Inventories - - -Restricted assets: Cash and investments with fiscal agents - - - -
Total Assets 65,203 $ 482,414 $ 5,850,575 $ 13,566 $
Liabilities, Deferred Inflows of Resources, and Fund Balances (Deficit): Liabilities: Accounts payable 13,522 $ 281,200 $ 5,618 $ - $ Accrued liabilities 51,653 3,541 1,322 13,566 Deposits payable - - 6,030Due to other governments--5,365Due to other funds - - - -
Total Liabilities 65,175 284,741 18,335 13,566
Deferred Inflows of Resources: Unavailable revenues - - 4,899,577 -
Total Deferred Inflows of Resources--4,899,577-
Fund Balances: Restricted for: Public safety 28 - -Parks and recreation - - -Public works - 197,673 -Capital projects - - -Low and moderate income housing - - 932,663Assigned to: Capital projects - - -Unassigned
Total Fund Balances (Deficit)28197,673932,663-
Total Liabilities, Deferred Inflows of Resources, and Fund Balances (Deficit) 65,203 $ 482,414 $ 5,850,575 $ 13,566 $
CITY OF DOWNEY
110
COMBINING BALANCE SHEET NONMAJOR GOVERNMENTAL FUNDS
JUNE 30, 2022
Assets: Pooled cash and investments Receivables: Accounts Taxes Notes and loans Due from other governments Inventories Restricted assets: Cash and investments with fiscal agents
Total Assets
Liabilities, Deferred Inflows of Resources, and Fund Balances (Deficit): Liabilities: Accounts payable Accrued liabilities Deposits payable Due to other governments Due to other funds
Total Liabilities Deferred Inflows of Resources: Unavailable revenues
Total Deferred Inflows of Resources
Fund Balances: Restricted for: Public safety Parks and recreation Public works Capital projects Low and moderate income housing Assigned to: Capital projects Unassigned
Total Fund Balances (Deficit)
Total Liabilities, Deferred Inflows of Resources, and Fund Balances (Deficit)
Special Revenue Funds
CATV Public Access Air Quality Grants CDBG
1,031,660 $ 381,984 $ 89,100 $ 143,350 $ - - 101,857---416,925 35,849 36,647 28,730 323,398 - - 10,102---949,900
1,067,509 $ 418,631 $ 229,789 $ 1,833,573 $ - $ - $ 92,692 $ 484,287 $ - 12,774 71,574 52,516 - - 177,831- 12,774 342,097 536,803 ---416,925 ---416,925
1,067,509 405,857 ----879,845 --(112,308)1,067,509 405,857 (112,308) 879,845 1,067,509 $ 418,631 $ 229,789 $ 1,833,573 $
CITY OF DOWNEY
(CONTINUED)
111
COMBINING BALANCE SHEET
NONMAJOR GOVERNMENTAL FUNDS
JUNE 30, 2022
Assets: Pooled cash and investments Receivables: Accounts Taxes Notes and loans Due from other governments Inventories Restricted assets: Cash and investments with fiscal agents
Total Assets
Liabilities, Deferred Inflows of Resources, and Fund Balances (Deficit): Liabilities: Accounts payable Accrued liabilities Deposits payable Due to other governments Due to other funds
Total Liabilities
Deferred Inflows of Resources: Unavailable revenues
Total Deferred Inflows of Resources
Fund Balances: Restricted for: Public safety Parks and recreation Public works Capital projects Low and moderate income housing Assigned to: Capital projects Unassigned
Total Fund Balances (Deficit)
Total Liabilities, Deferred Inflows of Resources, and Fund Balances (Deficit)
Asset Forfeiture
Special Revenue Funds
Transit Prop C Transit Prop A Transit Measure R
21,896 $ 1,856,993 $ 3,364,328 $ 1,628,001 $ - 59,058 34,242-21,000-21,896 $ 1,937,051 $ 3,398,570 $ 1,628,001 $ - $ 114,729 $ 273,566 $ 87,946 $ 21,849 6,851 86,202 37,892 21,849 121,580 359,768 125,838 -21,000--21,000-47 - -- - 3,038,802- 1,794,471 -1,502,163 47 1,794,471 3,038,8021,502,163 21,896 $ 1,937,051 $ 3,398,570 $ 1,628,001 $
CITY OF DOWNEY
112
COMBINING BALANCE SHEET
NONMAJOR GOVERNMENTAL FUNDS
JUNE 30, 2022
Assets: Pooled cash and investments Receivables: Accounts Taxes Notes and loans Due from other governments Inventories Restricted assets: Cash and investments with fiscal agents
Total Assets
Liabilities, Deferred Inflows of Resources, and Fund Balances (Deficit): Liabilities: Accounts payable Accrued liabilities Deposits payable Due to other governments Due to other funds
Total Liabilities Deferred Inflows of Resources: Unavailable revenues
Total Deferred Inflows of Resources
Fund Balances: Restricted for: Public safety Parks and recreation Public works Capital projects Low and moderate income housing Assigned to: Capital projects Unassigned
Total Fund Balances (Deficit)
Total Liabilities, Deferred Inflows of Resources, and Fund Balances (Deficit)
Special Revenue Funds
Gas Tax LSTA Grant
Measure S 2017 LRB SB1 Transportation
- $ 379 $ - $ 1,679,384 $ 13,395 - -210,831 - - 396,552 --24224,226 $ 379 $ 24 $ 2,075,936 $ - $ - $ 2,249 $ 36,227 $ 21,473 - - 2,684 1,009,837 - 502,1021,031,310 - 504,351 38,911 - 379 -- - - 2,037,025 (807,084) - (504,327)(807,084) 379 (504,327) 2,037,025 224,226 $ 379 $ 24 $ 2,075,936 $
CITY OF DOWNEY
(CONTINUED)
113
COMBINING BALANCE SHEET
NONMAJOR GOVERNMENTAL FUNDS
JUNE 30, 2022
Assets: Pooled cash and investments Receivables: Accounts Taxes Notes and loans Due from other governments Inventories Restricted assets: Cash and investments with fiscal agents
Total Assets
Liabilities, Deferred Inflows of Resources, and Fund Balances (Deficit): Liabilities: Accounts payable Accrued liabilities Deposits payable Due to other governments Due to other funds
Total Liabilities Deferred Inflows of Resources: Unavailable revenues
Total Deferred Inflows of Resources
Fund Balances: Restricted for: Public safety Parks and recreation Public works Capital projects Low and moderate income housing Assigned to: Capital projects Unassigned
Total Fund Balances (Deficit)
Total Liabilities, Deferred Inflows of Resources, and Fund Balances (Deficit)
Special Revenue Funds
Measure WSewer & Storm Drain
2,978,620 $ 2,397,410 $ - $ 2,073,493 $ 1,019,158 - -3,997,778 $ 2,397,410 $ - $ 2,073,493 $ - $ 25,802 $ - $ 123,707 $ 140,211 49,108 -140,211 74,910 - 123,707 3,857,567 - --2,322,500 -- - - 1,949,786 3,857,5672,322,500 - 1,949,786 3,997,778 $ 2,397,410 $ - $ 2,073,493 $
CITY OF DOWNEY
Measure S (Sales Tax) Transit Measure M Asset ForfeitureState 114
COMBINING BALANCE SHEET
NONMAJOR GOVERNMENTAL FUNDS
JUNE 30, 2022
(CONTINUED)
Art In Public Places
Special Revenue Funds
Assets: Pooled cash and investments Receivables: Accounts Taxes Notes and loans Due from other governments Inventories Restricted assets: Cash and investments with fiscal agents
Total Assets
Liabilities, Deferred Inflows of Resources, and Fund Balances (Deficit): Liabilities: Accounts payable Accrued liabilities Deposits payable Due to other governments Due to other funds
Total Liabilities
Deferred Inflows of Resources: Unavailable revenues
Total Deferred Inflows of Resources
Fund Balances: Restricted for: Public safety Parks and recreation Public works Capital projects Low and moderate income housing Assigned to: Capital projects Unassigned
Total Fund Balances (Deficit)
Total Liabilities, Deferred Inflows of Resources, and Fund Balances (Deficit)
Capital Projects Funds
Measure M Bond 2021A Measure R Bond 2021B City Capital Projects
316,937 $ - $ 90,324 $ 4,367,151 $ - - - 519,319 -14,476,093 8,802,757316,937 $ 14,476,093 $ 8,893,081 $ 4,886,470 $ - $ 347,147 $ 1,283,399 $ 331,905 $ - 5,810 9,393 2,339 - 278,094 -- 631,051 1,292,792 334,244 316,937 - --13,845,042 7,600,289- - - 4,552,226 316,93713,845,042 7,600,289 4,552,226 316,937 $ 14,476,093 $ 8,893,081 $ 4,886,470 $
CITY OF DOWNEY
115
COMBINING BALANCE SHEET
NONMAJOR GOVERNMENTAL FUNDS
JUNE 30, 2022
Assets: Pooled cash and investments Receivables: Accounts Taxes Notes and loans Due from other governments Inventories Restricted assets: Cash and investments with fiscal agents
Total Assets
Liabilities, Deferred Inflows of Resources, and Fund Balances (Deficit): Liabilities: Accounts payable Accrued liabilities Deposits payable Due to other governments Due to other funds
Total Liabilities
Deferred Inflows of Resources: Unavailable revenues
Total Deferred Inflows of Resources
Fund Balances: Restricted for: Public safety Parks and recreation Public works Capital projects
Low and moderate income housing Assigned to: Capital projects Unassigned
Total Fund Balances (Deficit)
Total Liabilities, Deferred Inflows of Resources, and Fund Balances (Deficit)
Total Nonmajor Governmental Funds
23,801,942 $ 318,225 1,626,541 5,316,502 986,519 10,102 24,228,774 56,288,605 $ 3,503,996 $ 590,758 6,030 5,365 1,967,864 6,074,013 5,337,502 5,337,502 3,857,642 317,316 9,069,366 26,691,751 1,812,508 4,552,226 (1,423,719) 44,877,090 56,288,605 $
CITY OF DOWNEY
116
THIS PAGE INTENTIONALLY LEFT BLANK
117
COMBINING
STATEMENT OF REVENUES, EXPENDITURES AND CHANGES IN FUND BALANCES NONMAJOR GOVERNMENTAL FUNDS
YEAR ENDED JUNE 30, 2022
Special Revenue Funds
Waste Reduction Street Lighting HOME Hazardous Material
Revenues:
Taxes - $ 302,110 $ - $ - $ Intergovernmental 200,979 -350,806Charges for services 432,262 1,638,967 - 178,658 Use of money and property - (7,457) -Fines and forfeituresDeveloper participationMiscellaneous - 12,348 - -
Total Revenues633,2411,945,968350,806 178,658
Expenditures:
Current:
General governmentPublic safety 161,927 Community development - -100,048Community servicesPublic works 531,434 2,107,607 -Capital outlay -
Debt service: Principal retirementInterest and fiscal charges -
Total Expenditures 531,434 2,107,607 100,048 161,927
Excess (Deficiency) of Revenues Over (Under) Expenditures 101,807 (161,639)250,758 16,731
Other Financing Sources (Uses):
Transfers in 346,395 - - 125,195 Transfers out (14,775) (2,059)(626) (11,223) Other debts issuedLeases -
Total Other Financing Sources (Uses) 331,620 (2,059)(626) 113,972
Net Change in Fund Balances 433,427 (163,698)250,132 130,703
Fund Balances (Deficit), Beginning of Year (433,399) 361,371682,531 (130,703)
Fund Balances (Deficit), End of Year28 $ 197,673 $ 932,663 $ - $
CITY OF DOWNEY
118
COMBINING STATEMENT OF REVENUES, EXPENDITURES AND CHANGES IN FUND BALANCES NONMAJOR GOVERNMENTAL FUNDS
YEAR ENDED JUNE 30, 2022
Special Revenue Funds
Revenues: Taxes
Intergovernmental Charges for services Use of money and property Fines and forfeitures Developer participation Miscellaneous Total Revenues
Expenditures:
Current: General government Public safety Community development Community services Public works Capital outlay Debt service: Principal retirement Interest and fiscal charges
Total Expenditures
Excess (Deficiency) of Revenues Over (Under) Expenditures
Other Financing Sources (Uses): Transfers in Transfers out Other debts issued Leases
Total Other Financing Sources (Uses)
Net Change in Fund Balances
Fund Balances (Deficit), Beginning of Year
Fund Balances (Deficit), End of Year
142,184 $ - $ - $ - $ - 143,999 525,568 1,105,089 - - 56,723- (5,179) --- - 185,549142,184 138,820 767,840 1,105,089 9,282 - -- - 288,143- - 1,235,245 876,270- 119,023 -- - 399,297353,000 114,500 9,282 119,023 1,922,685 1,343,770 132,902 19,797(1,154,845) (238,681) - - 1,421,401- (7,298) (28,182) (69,916)- (7,298)1,393,219 (69,916) 132,902 12,499 238,374 (308,597) 934,607 393,358 (350,682) 1,188,442 1,067,509 $ 405,857 $ (112,308) $ 879,845 $
CITY OF DOWNEY
(CONTINUED)
CATV Public Access Air Quality Grants CDBG 119
COMBINING STATEMENT OF REVENUES, EXPENDITURES AND CHANGES IN FUND BALANCES NONMAJOR GOVERNMENTAL FUNDS
YEAR ENDED JUNE 30, 2022
Revenues: Taxes Intergovernmental Charges for services Use of money and property Fines and forfeitures Developer participation Miscellaneous Total Revenues
Expenditures: Current: General government Public safety Community development Community services Public works Capital outlay Debt service: Principal retirement Interest and fiscal charges
Total Expenditures
Excess (Deficiency) of Revenues Over (Under) Expenditures
Other Financing Sources (Uses): Transfers in Transfers out Other debts issued Leases
Total Other Financing Sources (Uses)
Net Change in Fund Balances
Fund Balances (Deficit), Beginning of Year Fund Balances (Deficit), End of Year
Special Revenue Funds
Transit Prop A Transit Measure R Asset Forfeiture Transit Prop C
- $ 2,378,075 $ 2,866,950 $ - $ 14,877 - -47 (25,618) (40,131) (20,750)1,783,269 - 59,063 34,40314,924 2,411,520 2,861,222 1,762,519110,930 - -- - 1,189,322- 66,651 222,150 167,019 - 1,665,638 930,541 348,005 - - 288,776 590,000 - - 82,342 277,215 110,930 1,732,289 2,713,131 1,382,239 (96,006) 679,231 148,091 380,280 118,233 20,787 1,186,240 25,885 (22,242)(1,001,901) (24,915) (13,588)95,991 (981,114)1,161,325 12,297 (15) (301,883)1,309,416 392,577 62 2,096,354 1,729,386 1,109,586 47 $ 1,794,471 $ 3,038,802 $ 1,502,163 $
CITY OF DOWNEY
120
COMBINING STATEMENT OF REVENUES, EXPENDITURES AND CHANGES IN FUND BALANCES NONMAJOR GOVERNMENTAL FUNDS
YEAR ENDED JUNE 30, 2022
Revenues: Taxes
Intergovernmental Charges for services Use of money and property Fines and forfeitures Developer participation Miscellaneous Total Revenues
Expenditures:
Current: General government Public safety Community development Community services Public works Capital outlay Debt service: Principal retirement Interest and fiscal charges
Total Expenditures
Excess (Deficiency) of Revenues Over (Under) Expenditures
Other Financing Sources (Uses): Transfers in Transfers out Other debts issued Leases
Total Other Financing Sources (Uses)
Net Change in Fund Balances
Fund Balances (Deficit), Beginning of Year
Fund Balances (Deficit), End of Year
Special Revenue Funds
Gas Tax LSTA Grant
Measure S 2017 LRB SB1 Transportation
- $ - $ - $ 2,262,756 $ 2,617,769--- (6) 1,741 (23,355)-2,617,769 (6) 1,741 2,239,401 - - 2,500-28,514 - - 26,113 111,762 - 282,879 2,229,559140,276 - 285,379 2,255,672 2,477,493 (6) (283,638) (16,271)(2,697,640) - --(2,697,640) - -(220,147) (6) (283,638) (16,271) (586,937) 385 (220,689) 2,053,296 (807,084) $ 379 $ (504,327) $ 2,037,025 $
CITY OF DOWNEY
(CONTINUED)
121
COMBINING STATEMENT OF REVENUES, EXPENDITURES AND CHANGES IN FUND BALANCES NONMAJOR GOVERNMENTAL FUNDS
YEAR ENDED JUNE 30, 2022
Revenues: Taxes
Intergovernmental Charges for services Use of money and property Fines and forfeitures Developer participation Miscellaneous Total Revenues
Expenditures:
Current: General government Public safety Community development Community services Public works Capital outlay Debt service: Principal retirement Interest and fiscal charges
Total Expenditures
Excess (Deficiency) of Revenues Over (Under) Expenditures
Other Financing Sources (Uses): Transfers in Transfers out Other debts issued Leases
Total Other Financing Sources (Uses)
Net Change in Fund Balances
Fund Balances (Deficit), Beginning of Year
Fund Balances (Deficit), End of Year
Special Revenue Funds
Measure S (Sales Tax) Transit Measure M
Asset ForfeitureState
Measure WSewer & Storm Drain
6,210,274 $ 2,017,974 $ - $ 2,851,777 $ --166,540606,384 (37,339) (31,939) 453 (23,190)-6,172,935 1,986,035 166,993 3,434,971
2,847 - -937,159 - 173,622-- 51,052 - 108,391 76,564 772,656 - 442,390 2,383,638 665,000 -1,718,579 405,292 -5,118,787 1,894,000 173,622 550,781 1,054,148 92,035 (6,629) 2,884,190- (7,508) -853,429 - -853,429 (7,508) -1,907,577 84,527 (6,629) 2,884,190 1,949,990 2,237,973 6,629 (934,404) 3,857,567 $ 2,322,500 $ - $ 1,949,786 $
CITY OF DOWNEY
122
COMBINING STATEMENT OF REVENUES, EXPENDITURES AND CHANGES IN FUND BALANCES NONMAJOR GOVERNMENTAL FUNDS
YEAR ENDED JUNE 30, 2022
Revenues: Taxes
Intergovernmental Charges for services Use of money and property Fines and forfeitures Developer participation Miscellaneous Total Revenues
Expenditures:
Current: General government Public safety Community development Community services Public works Capital outlay Debt service: Principal retirement Interest and fiscal charges
Total Expenditures
Excess (Deficiency) of Revenues Over (Under) Expenditures
Other Financing Sources (Uses): Transfers in Transfers out Other debts issued Leases
Total Other Financing Sources (Uses)
Net Change in Fund Balances
Fund Balances (Deficit), Beginning of Year
Fund Balances (Deficit), End of Year
Special Revenue Funds
Art In Public Places
City Capital Projects Measure M Bond 2021A Measure R Bond 2021B
Capital Projects Funds - $ - $ - $ - $3,778 - 538 378 (3,386) 1,975,717101,798 - -101,798 538 378 1,976,109 - 263,316 190,749-46,034 179,432 255,350 9,717 -3,404,3834,727,730 2,872,48746,0343,847,1315,173,829 2,882,204 55,764(3,846,593)(5,173,451) (906,095) 1,045,966-17,691,63512,773,740-17,691,63512,773,740 1,045,966
55,76413,845,0427,600,289 139,871 261,173 - - 4,412,355 316,937 $ 13,845,042 $ 7,600,289 $ 4,552,226 $
CITY OF DOWNEY
(CONTINUED)
123
COMBINING STATEMENT OF REVENUES, EXPENDITURES AND CHANGES IN FUND BALANCES NONMAJOR GOVERNMENTAL FUNDS
YEAR ENDED JUNE 30, 2022
Total Nonmajor Governmental Funds
Revenues: Taxes
Intergovernmental Charges for services Use of money and property Fines and forfeitures
Developer participation Miscellaneous Total Revenues
Expenditures:
Current: General government Public safety Community development Community services Public works Capital outlay Debt service: Principal retirement Interest and fiscal charges
Total Expenditures
Excess (Deficiency) of Revenues Over (Under) Expenditures
Other Financing Sources (Uses): Transfers in Transfers out Other debts issued Leases
Total Other Financing Sources (Uses)
Net Change in Fund Balances
Fund Balances (Deficit), Beginning of Year
Fund Balances (Deficit), End of Year
19,032,100 $ 5,125,627 2,916,772 (215,193) 1,975,717 1,783,269 393,161 31,011,453 468,694 1,671,781 2,211,563 1,189,322 3,918,487 18,263,891 4,280,414 2,597,928 34,602,080 (3,590,627) 4,290,102 (3,901,873) 30,465,375 853,429 31,707,033 28,116,406 16,760,684 44,877,090 $
CITY OF DOWNEY
124
BUDGETARY COMPARISON SCHEDULE WASTE REDUCTION
YEAR ENDED JUNE 30, 2022
Variance with Final Budget
Budget Amounts ActualPositive OriginalFinalAmounts(Negative)
Budgetary Fund Deficit, July 1(433,399) $ (433,399) $ (433,399) $ - $ Resources (Inflows): Intergovernmental 60,00060,000200,979140,979 Charges for services 420,000420,000432,26212,262 Transfers in -346,395346,395-
Amounts Available for Appropriations 46,601392,996546,237153,241
Charges to Appropriations (Outflow): Public works 518,108547,608531,43416,174 Transfers out --14,775(14,775) Total Charges to Appropriations 518,108547,608546,209 1,399
Budgetary Fund Balance, June 30 (471,507) $ (154,612) $ 28 $ 154,640 $
OF DOWNEY
CITY
125
BUDGETARY COMPARISON SCHEDULE STREET LIGHTING
YEAR ENDED JUNE 30, 2022
Variance with Final Budget
Budget Amounts ActualPositive OriginalFinalAmounts(Negative)
Budgetary Fund Balance, July 1 361,371 $ 361,371 $ 361,371 $ - $ Resources (Inflows): Taxes 558,000558,000302,110(255,890) Charges for services 1,379,5001,379,5001,638,967259,467 Use of money and property 2,500 2,500(7,457)(9,957) Miscellaneous 1,0001,00012,34811,348 Amounts Available for Appropriations 2,302,3712,302,3712,307,339 4,968
Charges to Appropriations (Outflow): Public works 2,047,9072,047,9072,107,607(59,700) Transfers out --2,059(2,059)
Total Charges to Appropriations 2,047,9072,047,9072,109,666(61,759)
Budgetary Fund Balance, June 30 254,464 $ 254,464 $ 197,673 $ (56,791) $
CITY OF DOWNEY
126
BUDGETARY COMPARISON SCHEDULE HOME
YEAR ENDED JUNE 30, 2022
Variance with Final Budget
Budget Amounts ActualPositive OriginalFinalAmounts(Negative)
Budgetary Fund Balance, July 1 682,531 $ 682,531 $ 682,531 $ - $ Resources (Inflows): Intergovernmental 1,182,0001,182,000350,806(831,194)
Amounts Available for Appropriations 1,864,5311,864,5311,033,337 (831,194)
Charges to Appropriations (Outflow):
Community development
Economic Dev & Housing 843,904843,904100,048743,856 Transfers out --626(626)
Total Charges to Appropriations 843,904843,904100,674743,230
Budgetary Fund Balance, June 30 1,020,627 $ 1,020,627 $ 932,663 $ (87,964) $
DOWNEY
CITY OF
127
BUDGETARY COMPARISON SCHEDULE HAZARDOUS MATERIAL
YEAR ENDED JUNE 30, 2022
Variance with Final Budget
Budget Amounts ActualPositive OriginalFinalAmounts(Negative)
Budgetary Fund Deficit, July 1(130,703) $ (130,703) $ (130,703) $ - $ Resources (Inflows): Charges for services 160,000160,000178,65818,658 Transfers in --125,195125,195
Amounts Available for Appropriations 29,29729,297173,150143,853
Charges to Appropriations (Outflow): Public safety 186,847186,847161,92724,920 Transfers out --11,223(11,223)
Total Charges to Appropriations 186,847186,847173,15013,697
Budgetary Fund Balance, June 30 (157,550) $ (157,550) $ - $ 157,550 $
OF DOWNEY
CITY
128
BUDGETARY COMPARISON SCHEDULE
CATV PUBLIC ACCESS
YEAR ENDED JUNE 30, 2022
Variance with Final Budget
Amounts ActualPositive OriginalFinalAmounts(Negative)
Budget
Budgetary Fund Balance, July 1 934,607 $ 934,607 $ 934,607 $ - $ Resources (Inflows): Taxes 100,000100,000142,18442,184 Amounts Available for Appropriations 1,034,6071,034,6071,076,791 42,184 Charges to Appropriations (Outflow): General government --9,282(9,282) Total Charges to Appropriations - -9,282 (9,282)
Budgetary Fund Balance, June 30 1,034,607 $ 1,034,607 $ 1,067,509 $32,902 $
DOWNEY
CITY OF
129
BUDGETARY COMPARISON SCHEDULE AIR QUALITY
YEAR ENDED JUNE 30, 2022
Variance with Final Budget
Budget Amounts ActualPositive OriginalFinalAmounts(Negative)
Budgetary Fund Balance, July 1 393,358 $ 393,358 $ 393,358 $ - $
Resources (Inflows): Intergovernmental 140,000140,000143,999 3,999 Use of money and property 2,500 2,500(5,179)(7,679) Amounts Available for Appropriations 535,858535,858532,178 (3,680)
Charges to Appropriations (Outflow): Public works 129,511129,511119,02310,488 Capital outlay 180,000180,000-180,000 Transfers out --7,298(7,298)
Total Charges to Appropriations 309,511309,511126,321183,190
Budgetary Fund Balance, June 30 226,347 $ 226,347 $ 405,857 $ 179,510 $
CITY OF DOWNEY
130
BUDGETARY COMPARISON SCHEDULE GRANTS
YEAR ENDED JUNE 30, 2022
Variance with Final Budget
Budget Amounts ActualPositive OriginalFinalAmounts(Negative)
Budgetary Fund Deficit, July 1(350,682) $ (350,682) $ (350,682) $ - $ Resources (Inflows): Intergovernmental 300,000920,374525,568(394,806) Charges for services 145,200145,20056,723(88,477) Miscellaneous 113,751113,751185,54971,798 Transfers in 800,0001,414,4751,421,4016,926
Amounts Available for Appropriations 1,008,2692,243,1181,838,559 (404,559)
Charges to Appropriations (Outflow): Public safety --288,143(288,143) Community development 1,343,1841,343,1841,235,245107,939 Capital outlay 161,500781,874399,297382,577 Transfers out --28,182(28,182)
Total Charges to Appropriations 1,504,6842,125,0581,950,867174,191
Budgetary Fund Deficit, June 30 (496,415) $ 118,060 $ (112,308) $ (230,368) $
OF DOWNEY
CITY
131
BUDGETARY COMPARISON SCHEDULE
CDBG
YEAR ENDED JUNE 30, 2022
Variance with Final Budget
Budget Amounts ActualPositive OriginalFinalAmounts(Negative)
Budgetary Fund Balance, July 1 1,188,442 $ 1,188,442 $ 1,188,442 $$ Resources (Inflows): Intergovernmental 604,000604,0001,105,089501,089 Amounts Available for Appropriations 1,792,4421,792,4422,293,531 501,089
Charges to Appropriations (Outflow): Community development 590,121590,121876,270(286,149) Debt service: Principal retirement 353,000353,000353,000Interest and fiscal charges 113,501113,501114,500 (999) Transfers out --69,916(69,916)
Total Charges to Appropriations 1,056,6221,056,6221,413,686(357,064)
Budgetary Fund Balance, June 30 735,820 $ 735,820 $ 879,845 $ 144,025 $
CITY OF DOWNEY
132
BUDGETARY COMPARISON SCHEDULE ASSET FORFEITURE
YEAR ENDED JUNE 30, 2022
Variance with Final Budget
Budget Amounts ActualPositive OriginalFinalAmounts(Negative)
Budgetary Fund Balance, July 1 62 $ 62 $ 62 $ - $ Resources (Inflows): Intergovernmental 50,00050,00014,877(35,123) Use of money and property 500 500 47 (453) Transfers in --118,233118,233
Amounts Available for Appropriations 50,56250,562133,21982,657
Charges to Appropriation (Outflow): Public safety 255,503255,503110,930144,573 Transfers out --22,242(22,242)
Total Charges to Appropriations 255,503255,503133,172122,331
Budgetary Fund Balance, June 30 (204,941) $ (204,941) $ 47 $ 204,988 $
DOWNEY
CITY OF
133
BUDGETARY COMPARISON SCHEDULE
TRANSIT PROP C
YEAR ENDED JUNE 30, 2022
Variance with Final Budget
ActualPositive OriginalFinalAmounts(Negative)
Budget Amounts
Budgetary Fund Balance, July 1 2,096,354 $ 2,096,354 $ 2,096,354 $$ Resources (Inflows): Taxes 1,901,7011,901,7012,378,075476,374 Use of money and property 5,000 5,000(25,618)(30,618) Miscellaneous --59,06359,063
Amounts Available for Appropriations 4,003,0554,003,0554,528,661 525,606
Charges to Appropriation (Outflow): Public works 345,928335,92866,651269,277 Capital outlay 2,681,7062,691,7061,665,6381,026,068 Transfers out 1,000,0001,000,0001,001,901(1,901)
Total Charges to Appropriations 4,027,6344,027,6342,734,1901,293,444
Budgetary Fund Balance, June 30 (24,579) $ (24,579) $ 1,794,471 $ 1,819,050 $
DOWNEY
CITY OF
134
BUDGETARY COMPARISON SCHEDULE
TRANSIT PROP A
YEAR ENDED JUNE 30, 2022
Variance with Final Budget
Budget Amounts ActualPositive OriginalFinalAmounts(Negative)
Budgetary Fund Balance, July 1 1,729,386 $ 1,729,386 $ 1,729,386 $$
Resources (Inflows):
Taxes 2,100,0002,100,0002,866,950766,950
Use of money and property 3,000 3,000(40,131)(43,131) Miscellaneous 9,5009,50034,40324,903 Transfers in 1,000,0001,000,0001,186,240186,240
Amounts Available for Appropriations 4,841,8864,841,8865,776,848 934,962
Charges to Appropriation (Outflow):
Parks and recreation 1,476,6041,476,6041,189,322287,282 Public works 339,305339,305222,150117,155
Capital outlay 1,394,7401,394,740930,541464,199
Debt service: Principal retirement 277,770277,770288,776(11,006) Interest and fiscal charges 97,39997,39982,34215,057
Transfers out --24,915(24,915)
Total Charges to Appropriations 3,585,8183,585,8182,738,046847,772
Budgetary Fund Balance, June 30 1,256,068 $ 1,256,068 $ 3,038,802 $ 1,782,734 $
OF DOWNEY
CITY
135
BUDGETARY COMPARISON SCHEDULE
TRANSIT MEASURE R
YEAR ENDED JUNE 30, 2022
Variance with Final Budget
Budget Amounts ActualPositive OriginalFinalAmounts(Negative)
Budgetary Fund Balance, July 1 1,109,586 $ 1,109,586 $ 1,109,586 $$ Resources (Inflows):
Use of money and property 10,00010,000(20,750)(30,750) Developer participation 1,426,2761,426,2761,783,269356,993 Transfers in --25,88525,885
Amounts Available for Appropriations 2,545,8622,545,8622,897,990 352,128
Charges to Appropriation (Outflow): Public works 482,716482,716167,019315,697 Capital outlay 2,874,8002,874,800348,0052,526,795
Debt service: Principal retirement --590,000(590,000) Interest and fiscal charges - -277,215(277,215)
Total Charges to Appropriations 3,357,5163,357,5161,395,8271,961,689
Budgetary Fund Balance, June 30 (811,654) $ (811,654) $ 1,502,163 $ 2,313,817 $
OF DOWNEY
CITY
136
BUDGETARY COMPARISON SCHEDULE GAS TAX
YEAR ENDED JUNE 30, 2022
Variance with Final Budget
Budget Amounts ActualPositive OriginalFinalAmounts(Negative)
Budgetary Fund Deficit, July 1(586,937) $ (586,937) $ (586,937) $ - $
Resources (Inflows): Intergovernmental 3,011,8693,011,8692,617,769(394,100) Use of money and property 100 100 - (100) Amounts Available for Appropriations 2,425,0322,425,0322,030,832 (394,200)
Charges to Appropriation (Outflow): Public works 17,20317,20328,514(11,311) Capital outlay 104,775104,775111,762(6,987) Transfers out 2,226,3182,226,3182,697,640(471,322)
Total Charges to Appropriations 2,348,2962,348,2962,837,916(489,620)
Budgetary Fund Deficit, June 30 76,736 $ 76,736 $ (807,084) $ (883,820) $
DOWNEY
CITY OF
137
BUDGETARY COMPARISON SCHEDULE LSTA GRANT
YEAR ENDED JUNE 30, 2022
Variance with Final Budget
Budget Amounts ActualPositive
OriginalFinalAmounts(Negative)
Budgetary Fund Balance, July 1 385 $ 385 $ 385 $ - $ Resources (Inflows): Use of money and property 5 5 (6) (11) Amounts Available for Appropriations 390 390 379 (11)
Budgetary Fund Balance, June 30 390 $ 390 $ 379 $ (11) $
CITY OF DOWNEY
138
BUDGETARY COMPARISON SCHEDULE MEASURE S 2017 LRB
YEAR ENDED JUNE 30, 2022
Variance with Final Budget
Budget Amounts ActualPositive OriginalFinalAmounts(Negative)
Budgetary Fund Deficit, July 1(220,689) $ (220,689) $ (220,689) $ - $ Resources (Inflows): Use of money and property 25,000 25,000 1,741(23,259) Amounts Available for Appropriations (195,689)(195,689)(218,948) (23,259)
Charges to Appropriation (Outflow): General government --2,500(2,500) Capital outlay 4,862,1184,862,118282,8794,579,239 Total Charges to Appropriations 4,862,1184,862,118285,3794,576,739
Budgetary Fund Deficit, June 30 (5,057,807) $ (5,057,807) $ (504,327) $ 4,553,480 $
DOWNEY
CITY OF
139
BUDGETARY COMPARISON SCHEDULE
SB1 TRANSPORTATION
YEAR ENDED JUNE 30, 2022
Variance with Final Budget
Budget Amounts ActualPositive OriginalFinalAmounts(Negative)
Budgetary Fund Balance, July 1 2,053,296 $ 2,053,296 $ 2,053,296 $$ Resources (Inflows): Taxes 2,232,2382,232,2382,262,75630,518 Use of money and property--(23,355)(23,355) Amounts Available for Appropriations 4,285,5344,285,5344,292,697 7,163
Charges to Appropriation (Outflow): Public works --26,113(26,113) Capital outlay 4,176,0004,176,0002,229,5591,946,441
Total Charges to Appropriations 4,176,0004,176,0002,255,6721,920,328
Budgetary Fund Balance, June 30 109,534 $ 109,534 $ 2,037,025 $ 1,927,491 $
DOWNEY
CITY OF
140
BUDGETARY COMPARISON SCHEDULE MEASURE S (SALES TAX)
YEAR ENDED JUNE 30, 2022
Variance with Final Budget
Budget Amounts ActualPositive OriginalFinalAmounts(Negative)
Budgetary Fund Balance, July 1 1,949,990 $ 1,949,990 $ 1,949,990 $$ Resources (Inflows): Taxes 5,396,0005,396,0006,210,274814,274 Use of money and property 25,00025,000(37,339)(62,339)
Amounts Available for Appropriations 7,370,9907,370,9908,976,354 1,605,364 Charges to Appropriation (Outflow):
General government --2,847(2,847) Public safety 456,515456,515937,159(480,644) Capital outlay 843,485843,48576,564766,921 Debt service: Principal retirement 1,730,0001,730,0002,383,638(653,638) Interest and fiscal charges 1,725,7871,725,7871,718,579 7,208 Total Charges to Appropriations 4,755,7874,755,7875,118,787(363,000)
Budgetary Fund Balance, June 30 2,615,203 $ 2,615,203 $ 3,857,567 $ 1,242,364 $
CITY OF DOWNEY
141
BUDGETARY COMPARISON SCHEDULE
TRANSIT MEASURE M
YEAR ENDED JUNE 30, 2022
Variance with Final Budget
Budget Amounts ActualPositive OriginalFinalAmounts(Negative)
Budgetary Fund Balance, July 1 2,237,973 $ 2,237,973 $ 2,237,973 $$ Resources (Inflows):
Taxes 1,616,4461,616,4462,017,974401,528
Use of money and property 10,00010,000(31,939)(41,939)
Amounts Available for Appropriations 3,864,4193,864,4194,224,008 359,589
Charges to Appropriation (Outflow): Public works --51,052(51,052) Capital outlay 3,587,9593,587,959772,6562,815,303
Debt service:
Principal retirement --665,000(665,000) Interest and fiscal charges--405,292(405,292) Transfers out --7,508(7,508)
Total Charges to Appropriations 3,587,9593,587,9591,901,5081,686,451
Budgetary Fund Balance, June 30 276,460 $ 276,460 $ 2,322,500 $ 2,046,040 $
CITY OF DOWNEY
142
BUDGETARY COMPARISON SCHEDULE MEASURE W - SEWER & STORM DRAIN
YEAR ENDED JUNE 30, 2022
Variance with Final Budget
Budget Amounts ActualPositive OriginalFinalAmounts(Negative)
Budgetary Fund Deficit, July 1(934,404) $ (934,404) $ (934,404) $ - $ Resources (Inflows): Taxes - -2,851,7772,851,777
Charges for services --606,384606,384 Use of money and property 25,00025,000(23,190)(48,190) Amounts Available for Appropriations (909,404)(909,404)2,500,567 3,409,971
Charges to Appropriation (Outflow): Public works 243,458243,458108,391135,067 Capital outlay 2,270,0002,270,000442,3901,827,610
Total Charges to Appropriations 2,513,4582,513,458550,7811,962,677
Budgetary Fund Balance, June 30 (3,422,862) $ (3,422,862) $ 1,949,786 $ 5,372,648 $
CITY OF DOWNEY
143
BUDGETARY COMPARISON SCHEDULE
ART IN PUBLIC PLACES
YEAR ENDED JUNE 30, 2022
Variance with Final Budget
Budget Amounts ActualPositive OriginalFinalAmounts(Negative)
Budgetary Fund Balance, July 1 261,173 $ 261,173 $ 261,173 $ - $ Resources (Inflows): Miscellaneous --101,798101,798 Amounts Available for Appropriations 261,173261,173362,971101,798 Charges to Appropriation (Outflow): Public works --46,034(46,034) Capital outlay 335,000335,000-335,000 Total Charges to Appropriations 335,000335,00046,034288,966
Budgetary Fund Balance, June 30 (73,827) $ (73,827) $ 316,937 $ 390,764 $
CITY OF DOWNEY
144
BUDGETARY COMPARISON SCHEDULE MEASURE M BOND 2021A
YEAR ENDED JUNE 30, 2022
Variance with Final Budget
Budget Amounts ActualPositive OriginalFinalAmounts(Negative)
Budgetary Fund Balance, July 1 - $ - $ - $ - $
Resources (Inflows):
Use of money and property - - 538 538 Other debts issued -17,691,63817,691,635(3) Amounts Available for Appropriation -17,691,63817,692,173 535
Charges to Appropriation (Outflow): General government --263,316(263,316) Public works -9,985,000179,4329,805,568 Capital outlay -5,250,0003,404,3831,845,617
Total Charges to Appropriations - 15,235,0003,847,13111,387,869
Budgetary Fund Balance, June 30 - $ 2,456,638 $ 13,845,042 $ 11,388,404 $
DOWNEY
CITY OF
145
BUDGETARY COMPARISON SCHEDULE MEASURE R BOND 2021B
YEAR ENDED JUNE 30, 2022
Variance with Final Budget
Budget Amounts ActualPositive OriginalFinalAmounts(Negative)
Budgetary Fund Balance, July 1 - $ - $ - $ - $ Resources (Inflows):
Use of money and property - - 378 378 Other debts issued -12,773,73712,773,7403 Amounts Available for Appropriation -12,773,73712,774,118 381
Charges to Appropriation (Outflow): General government --190,749(190,749) Public works -4,800,000255,3504,544,650 Capital outlay -7,800,0004,727,7303,072,270
Total Charges to Appropriations -12,600,0005,173,8297,426,171
Budgetary Fund Balance, June 30 - $ 173,737 $ 7,600,289 $ 7,426,552 $
DOWNEY
CITY OF
146
BUDGETARY COMPARISON SCHEDULE CITY CAPITAL PROJECTS
YEAR ENDED JUNE 30, 2022
Variance with Final Budget
Budget Amounts ActualPositive OriginalFinalAmounts(Negative)
Budgetary Fund Balance, July 1 4,412,355 $4,412,355 $ 4,412,355 $ - $
Resources (Inflows):
Charges for services --3,7783,778 Use of money and property - -(3,386)(3,386) Fines and forfeitures 1,720,0001,720,0001,975,717255,717 Transfers in 125,0001,783,4661,045,966(737,500)
Amounts Available for Appropriations 6,257,3557,915,8217,434,430 (481,391)
Charges to Appropriation (Outflow): Public works --9,717(9,717) Capital outlay 5,223,7926,144,7582,872,4873,272,271 Transfers out -737,500-737,500
Total Charges to Appropriations 5,223,7926,882,2582,882,2044,000,054
Budgetary Fund Balance, June 30 1,033,563 $ 1,033,563 $ 4,552,226 $ 3,518,663 $
OF DOWNEY
CITY
147
THIS PAGE INTENTIONALLY LEFT BLANK
148
INTERNAL SERVICE FUNDS
Internal Service Funds are used to account for the financing of goods or services provided by one City department to other City departments on a cost reimbursement basis. The Internal Service Funds used by the City are as follows:
Employee Benefits Fund is used to charge various departments for leave time, medical benefits, retirement benefits and other employee fringe benefits on a cost reimbursement basis.
Equipment Fund is used to charge various departments of the City for the use of fleet, office and communications equipment on a cost reimbursement basis.
149
COMBINING STATEMENT OF NET POSITION INTERNAL SERVICE FUNDS
JUNE 30, 2022
Governmental Activities - Internal Service Funds
Employee Benefits Equipment
Totals
Assets and Deferred Outflows of Resources: Assets: Current: Cash and investments 26,357,540 $ 1,465,410 $ 27,822,950 $ Receivables: Accounts -6,425 6,425 Prepaid costs 70,131 - 70,131 Due from other governments -8,272 8,272 Inventories -87,546 87,546 Advances to Successor Agency 1,271,173 - 1,271,173
Total Current Assets 27,698,8441,567,65329,266,497
Noncurrent:
Capital assets - net of accumulated depreciation/amortization -4,207,838 4,207,838
Total Noncurrent Assets-4,207,8384,207,838
Total Assets 27,698,8445,775,49133,474,335
Deferred Outflows of Resources:
Deferred pension related items -41,313 41,313
Total Deferred Outflows of Resources - 41,313 41,313
Total Assets and Deferred Outflows of Resources27,698,844 $ 5,816,804 $ 33,515,648 $
Liabilities, Deferred Inflows of Resources, and Net Position: Liabilities:
Current:
Accounts payable 13,281 $ 175,522 $ 188,803 $ Accrued liabilities 130 65,549 65,679
Accrued compensated absences 1,478,047 33,905 1,511,952
Accrued claims payable 3,372,000 - 3,372,000 Bonds, notes, loans and leases -507,444 507,444
Total Current Liabilities 4,863,458782,4205,645,878
Noncurrent:
Accrued compensated absences 11,048,766 68,663 11,117,429
Accrued claims payable 4,003,418 - 4,003,418 Bonds, notes, loans and leases -1,757,283 1,757,283 Net pension liability -64,775 64,775
Total Noncurrent Liabilities 15,052,1841,890,72116,942,905
Total Liabilities 19,915,6422,673,14122,588,783
Deferred Inflows of Resources:
Deferred pension related items -198,272 198,272
Total Deferred Inflows of Resources -198,272198,272
Net Position:
Net investment in capital assets -2,572,470 2,572,470 Unrestricted 7,783,202372,921 8,156,123
Total Net Position 7,783,2022,945,39110,728,593
Total Liabilities, Deferred Inflows of Resources, and Net Position 27,698,844 $ 5,816,804 $ 33,515,648 $
CITY OF DOWNEY
150
COMBINING STATEMENT OF REVENUES, EXPENSES AND CHANGES IN FUND NET POSITION INTERNAL SERVICE FUNDS
YEAR ENDED JUNE 30, 2022
Governmental Activities - Internal Service Funds
Employee Benefits Equipment
Totals
Operating Revenues:
Interdepartmental charges 3,030,533 $ 2,586,728 $ 5,617,261 $ Miscellaneous 400,000 - 400,000
Total Operating Revenues 3,430,5332,586,7286,017,261
Operating Expenses: Maintenance and operations -2,010,786 2,010,786 General and administrative -82,730 82,730 Employee benefits 3,430,533 - 3,430,533 Depreciation/amortization expense -326,688 326,688
Total Operating Expenses 3,430,5332,420,2045,850,737
Operating Income (Loss) -166,524166,524
Nonoperating Revenues (Expenses):
Interest expense -(52,530) (52,530) Gain (loss) on disposal of capital assets -171,183 171,183
Total Nonoperating Revenues (Expenses) -118,653118,653
Income (Loss) Before Transfers -285,177285,177
Transfers in -136,500 136,500 Transfers out -(11,201)(11,201)
Changes in Net Position -410,476 410,476
Net Position:
Beginning of Year 7,783,2022,534,915 10,318,117 End of Fiscal Year 7,783,202 $ 2,945,391 $ 10,728,593 $
CITY OF DOWNEY
151
COMBINING STATEMENT OF CASH FLOWS INTERNAL SERVICE FUNDS
YEAR ENDED JUNE 30, 2022
Totals
Cash Flows from Operating Activities: Cash received from customers and users 3,030,533 $ 2,590,517 $ 5,621,050 $ Cash paid to suppliers for goods and services (12,664)(2,089,562) (2,102,226) Cash paid to employees for services (3,072,465)(221,427) (3,293,892)
Net Cash Provided (Used) by Operating Activities (54,596)279,528 224,932
Cash Flows from Non-Capital Financing Activities: Repayment of Advance to other funds 104,749 - 104,749
Net Cash Provided (Used) by Non-Capital Financing Activities104,749125,299230,048
Cash Flows from Capital and Related Financing Activities:
Acquisition and construction of capital assets -(311,288) (311,288) Principal paid on capital debt -(94,796) (94,796) Interest paid on capital debt -(52,530) (52,530) Proceeds from sales of capital assets -196,547 196,547
Net Cash Provided (Used) by Capital and Related Financing Activities-(262,067)(262,067)
Net Increase (Decrease) in Cash and Cash Equivalents 50,153142,760192,913
Cash and Cash Equivalents at Beginning of Year 26,307,3871,322,650 27,630,037 Cash and Cash Equivalents at End of Year26,357,540 $ 1,465,410 $ 27,822,950 $
Reconciliation of Operating Income to Net Cash
Provided (Used) by Operating Activities:
Operating income (loss) - $ 166,524 $ 166,524 $ Adjustments to Reconcile Operating Income (loss) Net Cash Provided (used) by Operating Activities: Depreciation/ amortization -326,688326,688 (Increase) decrease in accounts receivable -3,789 3,789 (Increase) decrease in due from other governments -27,498 27,498 (Increase) decrease in inventories -(24,122) (24,122) (Increase) decrease in prepaid expense (12,664) - (12,664) (Increase) decrease in deferred pension related outflows -728,413 728,413 Increase (decrease) in accounts payable (41,932) 578 (41,354) Increase (decrease) in accrued liabilities -4,759 4,759 Increase (decrease) in compensated absences -7,434 7,434 Increase (decrease) in net pension liability -(1,159,485) (1,159,485) Increase (decrease) in deferred pension related inflows -197,452 197,452
Total Adjustments (54,596)113,004 58,408
Net Cash Provided (Used) by Operating Activities (54,596) $ 279,528 $ 224,932 $
Non-Cash Investing, Capital, and Financing Activities: Gain on disposal of capital assets -90,875 $ 90,875 $
CITY OF DOWNEY
152
Governmental Activities - Internal Service Funds Employee Benefits Equipment
CUSTODIAL FUNDS
Cemetery District Fund is used to account for the financial operations of an independent governmental entity which the City provides accounting services to.
1913 Act Bond Fund is used to account for the revenues associated with the City’s 1913 Act projects.
Elm Vista Fund is used to account for funds provided by private property owners to construct certain public right-of-way improvements in their neighborhood.
Columbia Memorial Space Learning Center Foundation Fund is used to account for the construction and implementation of educational programs for the Columbia Memorial Space Learning Center.
Southeast Area Animal Control Authority (SEAACA) Fund is used to account for the financial operations of an independent governmental entity which the City provides accounting services to.
Southeast Water Coalition Fund is a joint powers authority established to protect the Central Groundwater Basin.
153
CITY OF DOWNEY, CALIFORNIA
COMBINING STATEMENT OF FIDUCIARY NET POSITION ALL CUSTODIAL FUNDS JUNE
30, 2022
Assets: Cash and investments 498,598 $ 120,098 $ 1,765 $ 256,495 $
Receivables: Accounts --3,256Taxes 3,750--Accrued interest receivable 976 - -Due from other governments 3,770 - -Advances to other funds -
Capital Assets - not being depreciated 29,967 - -Capital Assets - net of accumulated depreciation 295,482 - - -
Total Assets 832,543 120,098 5,021 256,495
Liabilities: Accounts payable 4,667 - - 11,001 Accrued liabilitiesUnearned revenuesDeposits payableDue to other governments - - 5,000Due to City: Due in more than one year 22,629 - -Total Liabilities 27,296 - 5,000 11,001
Net Position:
Restricted for organizations and other governments 805,247 120,098 21 245,494 Total Net Position 805,247 $ 120,098 $ 21 $ 245,494 $
Cemetery District 1913 Act Bond Elm Vista
154
Columbia Memorial Space Learning Center Foundation
CITY OF DOWNEY, CALIFORNIA
COMBINING STATEMENT OF FIDUCIARY NET POSITION ALL CUSTODIAL FUNDS JUNE
30, 2022
Assets: Cash and investments
Receivables: Accounts Taxes
Accrued interest receivable Due from other governments Advances to other funds
Capital Assets - not being depreciated Capital Assets - net of accumulated depreciation
Total Assets
Liabilities: Accounts payable
Accrued liabilities
Unearned revenues Deposits payable Due to other governments Long-term liabilities: Due in more than one year
Total Liabilities
Net Position:
Restricted for organizations and other governments
Total Net Position
SEAACA Southeast Water Coalition
Totals
5,504,093 $ 2,553 $ 6,383,602 $ 45,319- 48,575 3,750 976
14,231 - 18,001 2,800 - 2,800 80,523 - 110,490 2,804,497 - 3,099,979 8,451,463 2,5539,668,173 510,933 - 526,601 600,686 - 600,686 66,917 - 66,917 31,967 - 31,967 835 - 5,835 22,629 1,211,338 -1,254,635
7,240,125 2,553 8,413,538 7,240,125 $ 2,553 $ 8,413,538 $
155
CITY OF DOWNEY, CALIFORNIA
COMBINING STATEMENT OF CHANGES IN FIDUCIARY NET POSITION ALL CUSTODIAL FUNDS
FOR THE YEAR ENDED JUNE 30, 2022
Additions:
Investment earnings: Interest 3,718 $ - $ - $ - $ Taxes 99,575 - -Intergovernmental - - - 32,300 Miscellaneous 20,694 - - 163,677
Total Additions 123,987 - -195,977
Deductions:
Benefits
Administrative expenses 68,107 - - 122,957 Contractual services - - - 47,468 Capital outlayDepreciation expense 9,887 - -Total Deductions 77,994 - -170,425
Net Increase (Decrease) in Fiduciary Net Position 45,993 - - 25,552
Net Position - Beginning 759,254 120,098 21 8,171
Restatement of Net Position 211,771 Net Position - Beginning, as Restated 759,254 120,098 21 219,942 Net Position - End of the Year 805,247 $ 120,098 $ 21 $ 245,494 $
Cemetery District 1913 Act Bond Elm Vista
156
Columbia Memorial Space Learning Center Foundation
CITY OF DOWNEY, CALIFORNIA
COMBINING STATEMENT OF CHANGES IN FIDUCIARY NET POSITION ALL CUSTODIAL FUNDS FOR THE YEAR ENDED JUNE 30, 2022
Additions: Investment earnings: Interest Taxes
Intergovernmental Miscellaneous Total Additions
Deductions: Benefits
Administrative expenses Contractual services Capital outlay Depreciation expense Total Deductions
Net Increase (Decrease) in Fiduciary Net Position
Net Position - Beginning
Restatement of Net Position Net Position - Beginning, as Restated Net Position - End of the Year
Totals
(65,750) $ (35) $ (62,067) $ 99,575 6,299,352 -6,331,652 212,686 - 397,057 6,446,288 (35)6,766,217
14,159 - 14,159 4,671,483 - 4,862,547 107,854 -155,322 134,334 -134,334 203,310 -213,197 5,131,140 -5,379,559 1,315,148 (35) 1,386,658 5,924,977 2,588 6,815,109 211,771 5,924,977 2,588 7,026,880 7,240,125 $ 2,553 $ 8,413,538 $
157
SEAACA Southeast Water Coalition
158
THIS PAGE INTENTIONALLY LEFT BLANK
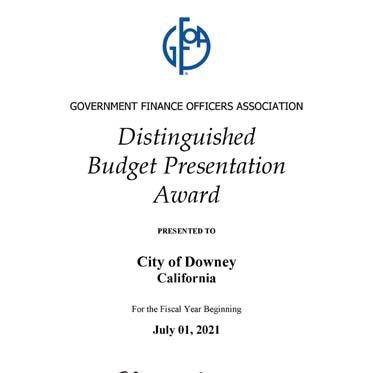

159
THIS PAGE INTENTIONALLY LEFT BLANK
160
DESCRIPTION OF STATISTICAL SECTION CONTENTS
June 30, 2022
This part of the City of Downey’s annual comprehensive financial report presents detailed information as a context for understanding what the information in the financial statements, note disclosures, and required supplementary information say about the government’s overall financial health.
Contents: Pages
Financial Trends - These schedules contain trend information to help the reader understand how the City’s financial performance and well-being have changed over time ........................................ ...... 162-170
Revenue Capacity - These schedules contain information to help the reader assess the City’s most significant local revenue source, the property tax ................................. 173-179
Debt Capacity - These schedules present information to help the reader assess the affordability of the City’s current levels of outstanding debt and the City’s ability to issue additional debt in the future ......................................................... 180-186 stat
Demographic and Economic Information - These schedules offer demographic and economic indicators to help the reader understand the environment within which the City’s financial activities take place ............. 187-189
Operating Information - These schedules contain service and infrastructure data to help the reader understand how the information in the City’s financial report relates to the services the City provides and the activities it performs ............................ 190-195
161
CITY OF DOWNEY
NET POSTION BY COMPONENT (amounts expressed in thousands)
2012-132013-142014-152015-162016-17
Governmental Activities:
Net investment in capital assets 189,490 $ 193,071 $ 206,576 $ 211,020 $ 212,244 $ Restricted 29,33226,20323,59230,00930,653 Unreserved 31,96548,162(98,403)(103,853)(109,605)
Total governmental activities 250,787267,436131,765137,176133,292
Business-type Activities:
Net investment in capital assets 34,11641,71934,74435,57735,265 Restricted 4,2241,478 469 469 469 Unrestricted 3,6025,9411,0846,03211,124
Total business-type activities 41,94249,13836,29742,07846,858
Primary Government:
Last Ten Fiscal Years (modified accrual basis of accounting) Source: Finance Department, City of Downey
Net investment in capital assets 223,606234,790241,320246,597247,509 Restricted 33,55627,68124,06130,47831,122 Unassigned 35,56754,103(97,319)(97,821)(98,481)
Total primary government 292,729 $ 316,574 $ 168,062 $ 179,254 $ 180,150 $
Note: Transit was transferred to governmental activities during fiscal year 2014-15. Transit revenues are grouped under operating grants and contributions.
162
CITY
OF
DOWNEY
NET POSITION BY COMPONENT (amounts expressed in thousands)
2017-182018-192019-202020-212021-22
Governmental Activities:
Net investment in capital assets 151,973 $ 191,436 $ 246,763 $ 216,976 $ 231,094 $ Restricted 82,06678,43744,50236,14363,539 Unreserved (173,874)(184,334)(208,799)(170,512)(170,064)
Total governmental activities 60,16585,53982,46682,607 124,569
Business-type Activities:
Net investment in capital assets 64,40173,28777,28674,98976,539 Restricted 36,00635,06434,00734,13033,854 Unrestricted (23,706)(25,220)(26,669)(16,020)(14,293)
Total business-type activities 76,70183,13184,62493,09996,100
Primary Government:
Last Ten Fiscal Years (modified accrual basis of accounting) Source: Finance Department, City of Downey
Net investment in capital assets 216,374264,723324,049291,965307,633 Restricted 118,072113,50178,50970,27397,393 Unassigned (197,580)(209,554)(235,468)(186,532)(184,357)
Total primary government 136,866 $ 168,670 $ 167,090 $ 175,706 $ 220,669 $
Note: Transit was transferred to governmental activities during fiscal year 2014-15. Transit revenues are grouped under operating grants and contributions.
163
CITY OF DOWNEY
CHANGES IN NET POSITION
- EXPENSES AND PROGRAM
(amounts expressed in thousands)
Last Ten Fiscal Years (modified accrual basis of accounting)
REVENUES
2012-132013-142014-152015-162016-17
Expenses
Governmental Activities: General government 7,242 $ 12,856 $ 12,419 $ 14,884 $ 14,735 $ Public safety 46,41452,12754,19658,39765,666 Public works 7,34910,20913,59815,47915,486 Community services 8,9595,8216,7037,9759,404 Community development 5,8215,1154,8937,2575,870 Transit 3,9923,317 - - -
Unallocated infrastructure depreciation 5,717 - - -Interest on long term debt 461,0521,6171,6621,704
Total expenses for governmental activities 85,54090,49793,426105,654112,865
Business-type Activities: Water 10,11712,10212,35510,58011,376 Golf 2,7723,0543,1882,6672,794
Total expenses for business-type activities 12,88915,15615,54313,24714,170
Total expenses for primary government 98,429 $ 105,653 $ 108,969 $ 118,901 $ 127,035 $
Program Revenues
Governmental Activities: Charges for services: General government 104 $ 5,109 $ 5,530 $ 6,436 $ 7,700 $ Public safety 5,9964,5503,9805,1364,650 Public works 3,1112,0452,9505,5454,332 Community services 2,4522,7662,9773,2333,561 Community development 1,3011,0801,3071,5501,408
Operating grants and contributions 8,4689,98112,69015,10813,548 Capital grants and contributions 4,279 9811,5032,2811,805 Total revenues for governmental activities 25,71126,51230,93739,28937,004
Business-type Activities: Charges for services: Water 15,19418,10417,39916,12016,874 Golf 2,6392,7652,7632,7982,800 Total revenues for business-type activities 17,83320,86920,16218,91819,674 Total revenues for primary government 43,544 $ 47,381 $ 51,099 $ 58,207 $ 56,678 $
Net (Expenses)/Revenues:
Governmental activities (59,829) $ (63,985) $ (62,489) $ (66,365) $ (75,861) $ Business-type activities 4,9445,7134,6195,6715,504 Total net position for primary government (54,885) $ (58,272) $ (57,870) $ (60,694) $ (70,357) $
Note: Transit was transferred to governmental activities during fiscal year 2014-15. Transit revenues are grouped under operating grants and contributions.
Source: Finance Department,
of
164
City
Downey
CITY OF DOWNEY
CHANGES IN NET POSITION - EXPENSES AND PROGRAM REVENUES (amounts expressed in thousands)
Last Ten Fiscal Years (modified accrual basis of accounting)
2017-182018-192019-202020-212021-22
Expenses
Governmental Activities: General government
10,530 $ 13,340 $ 15,763 $ 19,271 $ 13,930 $ Public safety 70,55274,43482,96083,13964,532 Public works 15,07513,28914,32015,17615,338 Community services 10,15213,17111,0509,2819,978 Community development 7,6266,8566,1876,6366,156 Interest on long term debt 2,5883,2982,7733,2096,650
Total expenses for governmental activities 116,523124,388133,053 136,712116,584
Business-type Activities: Water 15,88114,15714,78910,82515,778 Golf 2,8992,8532,9793,1193,081 Sewer and Storm Drain 4,1023,6573,8121,9332,268
Total expenses for business-type activities22,88220,66721,58015,87721,127
Total expenses for primary government 139,405 $ 145,055 $ 154,633 $ 152,589 $ 137,711 $
Program Revenues
Governmental Activities: Charges for services: General government 7,674 $ 8,477 $ 8,226 $ 8,206 $ 9,190 $ Public safety 5,2445,1025,1285,2955,759 Public works 1,1573,5663,3053,4674,461 Community services 2,1662,1371,119 7232,177 Community development 1,2321,0251,0041,1491,735
Operating grants and contributions 9,85311,67813,15122,36619,997 Capital grants and contributions 2,1958,2812,3011,2881,007 Total revenues for governmental activities 29,52140,26634,23442,49444,326
Business-type Activities: Charges for services: Water 18,02617,71118,13218,87518,197 Golf 2,9472,8532,6874,2484,508 Sewer and Storm Drain 1,5071,4711,4771,4971,521 Operating grants and contributions 388 - - - -
Total revenues for business-type activities22,86822,03522,29624,62024,226 Total revenues for primary government 52,389 $ 62,301 $ 56,530 $ 67,114 $ 68,552 $
Net (Expenses)/Revenues:
Governmental activities (87,001) $ (84,122) $ (98,819) $ (94,218) $ (72,258) $ Business-type activities (13)1,368 7168,7433,099
Total net position for primary government (87,014) $ (82,754) $ (98,103) $ (85,475) $ (69,159) $
Note: Transit was transferred to governmental activities during fiscal year 2014-15. Transit revenues are grouped under operating grants and contributions.
Source:
165
Finance Department, City of Downey
CHANGES
CITY OF DOWNEY
IN NET POSITION
-
GENERAL
(amounts expressed in thousands)
REVENUES
Last Ten Fiscal Years (modified accrual basis of accounting)
2012-132013-142014-152015-162016-17
General Revenues and Other Changes in Net
Position:
Governmental Activities: Property taxes, levied for general purposes 21,116 $ 21,842 $ 23,152 $ 24,709 $ 25,378 $ Transient occupancy taxes 1,2191,3151,3171,6291,701 Sales and use taxes 11,92511,39517,06220,03924,606 Property tax in lieu of sales and use taxes 3,7324,3854,2313,3492,106 Franchise taxes 2,3032,2822,2572,6252,433 Utility taxes 7,1707,5627,5957,2297,065 Other taxes 1,4261,6331,6611,9031,898 Earning on investments 2675,1893,3433,7381,089 Gain/(loss) on sales of capital assets - - - 45(112) Miscellaneous 2,78216,3217,2014,7594,806 Transfer-in 1,6291,3111,7771,3591,051
Total governmental activities 53,56973,23569,59671,38472,021
Business-type Activities:
Sales taxes 4,3104,685 - -Earning on investments 164 489 458 519 300 Gain/(loss) on sales of capital assets 2 - - 39 (1) Miscellaneous 135 6482,291 970 27 Transfer-in (1,629)(1,311)(1,777)(1,359)(1,050)
Total business-type activities 2,9824,511 972 169(724) Total primary government 56,551 $ 77,746 $ 70,568 $ 71,553 $ 71,297 $
Changes in Net Position
Governmental activities 53,569 $ 9,250 $ 69,596 $ 71,384 $ (14,980) $ Business-type activities 2,98210,224 972 169(737) Total net position for primary government 56,551 $ 19,474 $ 70,568 $ 71,553 $ (15,717) $
Note: Transit was transferred to governmental activities during fiscal year 2014-15. Transit revenues are grouped under operating grants and contributions.
Finance Department, City of Downey
Source:
166
CHANGES
CITY OF DOWNEY
IN NET POSITION - GENERAL REVENUES (amounts expressed in thousands)
Last Ten Fiscal Years (modified accrual basis of accounting)
2017-182018-192019-202020-212021-22
General Revenues and Other Changes in Net Position:
Governmental Activities: Property taxes, levied for general purposes 26,976 $ 28,817 $ 30,184 $ 32,209 $ 32,699 $ Transient occupancy taxes1,7051,5371,3481,2981,769 Sales and use taxes 26,99331,67330,05532,77737,791
Property tax in lieu of sales and use taxes 9,15410,3849,93711,19212,421
Franchise taxes 2,6702,7782,8542,9813,284
Utility taxes 6,7356,4116,3036,61710,394 Other taxes 2,1282,5162,4042,0122,101 Earning on investments 1,6824,1733,4811,416 48
Gain/(loss) on sales of capital assets -1,3454,712 919,029 Miscellaneous 5,6394,3964,2634,7084,334 Transfer-in 148 153 205 898 351 Extraordinary gain 14,263 - -Total governmental activities83,830108,44695,74696,199114,221
Business-type Activities:
Earning on investments 5001,076 779 138 (149) Gain/(loss) on sales of capital assets - 14 - 16 6 Miscellaneous 176 249 202 477 397 Transfer-in (147)(153)(205)(898)(351) Total business-type activities 5291,186 776 (267) (97) Total primary government 84,359 $ 109,632 $ 96,522 $ 95,932 $ 114,124 $
Changes in Net Position
Governmental activities (3,171) $ 24,324 $ (3,073) $ 1,981 $ 41,963 $ Business-type activities 5162,5541,4928,4763,002 Total net position for primary government (2,655) $ 26,878 $ (1,581) $ 10,457 $ 44,965 $
Note: Transit was transferred to governmental activities during fiscal year 2014-15. Transit revenues are grouped under operating grants and contributions.
Finance Department, City of Downey
167
Source:
CITY OF DOWNEY
FUND BALANCES OF GOVERNMENTAL FUNDS (amounts expressed in thousands)
Last Ten Fiscal Years
(modified accrual basis of accounting)
2012-132013-142014-152015-16 2016-17
General Fund: Nonspendable
7,118 $ 7,146 $ 7,592 $ 7,609 $ 7,413 $ Restricted4,7934,877--Assigned -15,68917,57820,003 20,003 Unassigned 6,4387,40111,92210,662 7,894
Total general fund 18,349 $ 35,113 $ 37,092 $ 38,274 $ 35,310 $
All Other Governmental Funds: Nonspendable 6,845 $ - $ 3,279 $ 11 $ 11 $ Restricted 5,0869,6836,23713,935 14,480 Assigned 6,6716,2985,0922,073 3,295 Unassigned (142)(525)760(2,189) (3,686)
Total all other governmental funds 18,460 $ 15,456 $ 15,368 $ 13,830 $ 14,100 $
Notes:
1. GASB Statement #54 was implemented in 2011; prior years have no comparable data.
2. Transit was transferred to governmental activities during fiscal year 2014-15. Transit revenues are grouped under operating grants and contribution
168
Source: Finance Department, City of Downey
FUND
CITY OF DOWNEY
BALANCES OF GOVERNMENTAL FUNDS (amounts expressed in thousands)
2017-182018-192019-202020-21 2021-22
General Fund: Nonspendable
8,308 $ 8,503 $ 8,240 $ 8,093 $ 6,882 $ Unassigned25,55329,73225,89626,355 46,580
Total general fund 33,861 $ 38,235 $ 34,136 $ 34,448 $ 53,462 $
All Other Governmental Funds: Restricted 65,680 $ 62,336 $ 26,797 $ 18,513 $ 45,418 $ Assigned3,4903,3624,3924,412 4,552 Unassigned (1,774)(1,565)(4,527)(5,824) (5,751)
Total all other governmental funds 67,396 $ 64,133 $ 26,662 $ 17,101 $ 44,219 $
Notes:
1. GASB Statement #54 was implemented in 2011; prior years have no comparable data.
Last Ten Fiscal Years (modified accrual basis of accounting) Source: Finance Department, City of Downey
2. Transit was transferred to governmental activities during fiscal year 2014-15. Transit revenues are grouped under operating grants and contribution
169
CITY OF DOWNEY
(amounts expressed in thousands)
Last Ten Fiscal Years (modified accrual basis of accounting)
Revenues:
2012-132013-142014-152015-16 2016-17
Taxes 50,163 $ 52,054 $ 57,363 $ 61,521 $ 65,130 $ License and permits 1,171 1,390 1,726 2,173 1,999 Fines and forfeitures 1,362 1,435 1,512 1,856 2,851 Investment and rental 750 4,785 1,784 2,046 1,497
Intergovernmental revenue 8,469 9,84614,94517,304 15,333 Charges for services 11,20912,37912,28014,094 14,213 Other revenue 3,90116,401 5,883 6,119 6,183 Total revenues 77,02598,290 95,493105,113 107,206
Expenditures: Current: General government6,53312,66010,78912,091 11,387 Public safety 43,91744,83746,68351,103 56,712 Public works 5,53510,04012,98314,431 14,707 Community services 8,012 4,990 5,862 6,413 8,540 Community development 5,816 4,013 4,412 6,097 5,430 Capital outlay 5,381 6,59313,26416,794 13,272
Debt service: Principal 250 250 645 460 611 Interest and fiscal charges 51 38 975 1,630 1,652 Total expenditures 75,49583,42195,613109,019 112,311
Excess of revenues over (under) expenditures1,53014,869(120)(3,906) (5,105)
Other Financing Sources (Uses):
Transfers in 4,219 3,926 9,118 9,210 5,820 Transfers out (4,735)(5,709)(8,341)(7,823) (4,770) Sale of property 248 - - -Issuance of debt - 600 - 668 705 Sale of capital assets - - 350 2,163 700 Total other financing sources (uses) (268)(1,183)1,127 4,218 2,455 Special Item: Pension contribution due to bond issuance Extraordinary Gain 530 - - -Net change in fund balances 1,79213,686 1,007 312 (2,650) Fund balances - July 1 35,01736,88352,74751,793 52,060 Fund balances - June 30 36,80950,56953,75452,10549,410
Debt service as a percentage of noncapital expenditures0.42%0.37%1.97%2.22%2.30% Note:
Transitwastransferredtogovernmentalactivitiesduringfiscalyear2014-15.Transitrevenuesaregroupedunderoperatinggrantsand contributions.
Source:
170
CHANGES IN FUND BALANCES OF GOVERNMENTAL FUNDS
Finance Department, City of Downey
Revenues:
Taxes
CITY OF DOWNEY
CHANGES IN FUND BALANCES OF GOVERNMENTAL FUNDS (amounts expressed in thousands)
Last Ten Fiscal Years (modified accrual basis of accounting)
2017-182018-192019-202020-21 2021-22
76,104 $ 84,299 $ 82,993 $ 89,097 $ 100,213$
License and permits 1,8371,4861,5361,681 1,781 Fines and forfeitures 3,0513,4563,5863,469 3,725 Investment and rental 1,9184,7693,7261,416 48 Intergovernmental revenue 12,16713,32513,61523,742 20,477
Charges for services 13,26213,53512,10412,093 15,924 Other revenue 6,95412,5795,8196,305 6,226 Total revenues 115,293133,449123,379137,803 148,394
Expenditures:
Current: General government
10,78611,64913,66110,822 13,424 Public safety 58,69462,54365,12970,062 65,372 Public works 13,83511,78113,56513,812 14,453 Community services 9,26311,95010,2958,178 9,261 Community development 7,2366,9295,9698,586 6,534 Capital outlay 8,30936,17658,25429,345 26,733
Debt service: Principal6812,8442,8223,346 5,230 Interest and fiscal charges 2,6963,5132,9583,447 6,669 Total expenditures 111,500147,385172,653147,598 147,676
Excess of revenues over (under) expenditures3,793(13,936)(49,274)(9,795) 718
Other Financing Sources (Uses):
Transfers in 5,55211,12611,45518,73412,829 Transfers out (6,216)(5,148)(11,250)(17,336) (12,604) Proceeds from long-term debt 51,9493,000 - -Capital Leases -3,433 192 356 854 Issuance of debt 744 - -108,446 30,465 Sale of capital assets -2,5145,404 - 13,870 Total other financing sources (uses) 52,02814,9255,801110,200 45,414
Special Item: Pension contribution due to bond issuance ---(107,814)-
Net change in fund balances 55,821 989(43,473)(7,409) 46,132
Fund balances - July 1 45,436101,378102,36758,958 51,549
Fund balances - June 30 101,257 $ 102,367 $ 58,894 $ 51,549 $ 97,681$
Debt service as a percentage of noncapital expenditures3.26%5.76%4.56%4.26%10.05%
Note: Transit was transferred to governmental activities during fiscal year 2014-15. Transit revenues are grouped under operating grants and contributions.
Source: Finance Department,
171
City of Downey
172
THIS PAGE INTENTIONALLY LEFT BLANK
CITY OF DOWNEY ASSESSED VALUATION (amounts expressed in thousands)
Last Ten Fiscal Years
Net TotalPercent Fiscal PublicLessNet Total LessNet TotalUnsecuredIncrease YearSecuredUtilitiesExemptionsSecuredUnsecuredExemptionsUnsecuredand Secured(Decrease)
2012-139,054,262560525,1648,529,658440,018148,762291,2568,820,9142.01% 2013-149,558,959560722,2978,837,222415,315154,317260,9989,098,2203.14% 2014-159,898,550560694,7599,204,351438,298117,035321,2639,525,6144.70%
2015-1610,318,316560715,1859,603,691546,557151,877394,6809,998,3714.96% 2016-1710,914,243 560 724,987 10,189,816507,620 112,353 395,26710,585,0835.87% 2017-1811,461,902 1,011 716,615 10,746,298379,305 45 379,26011,125,5585.11%
2018-1912,239,4221,011786,92611,453,507428,769117,407311,36211,764,8695.75% 2019-2012,981,6321,011870,87712,111,766441,30829,325411,98312,523,7496.45% 2020-2113,593,7181,011880,31212,714,417453,91132,007421,90413,136,3214.89% 2021-2213,984,1921,620870,49713,115,315396,8941,643395,25113,510,5662.85%
Note: Homeowner Exemptions are not included in Total Exemptions.
173
Source: HdL Coren Cone, Los Angeles County Assessor 2019/20 Combined Tax Rolls
CITY OF DOWNEY
ASSESSED VALUE OF TAXABLE PROPERTY (amounts expressed in thousands)
Last Ten Fiscal Years
2012-132013-142014-152015-162016-17
Residential 6,813,822 $ 7,042,493 $ 7,393,326 $ 7,803,812 $ 8,284,859 $ Commercial 1,102,8101,131,2941,144,9381,191,1371,277,960 Industrial 365,085396,484378,085312,043321,456
Government owned 620 Institutional 55,96362,57865,96166,17670,995 Miscellaneous 13 132,4581,0121,027
Recreational 25,64325,78025,86026,51631,953 Unknown 4873,384 499 509 517
Vacant Land 46,38644,15459,70367,13261,299
SBE Nonunitary 560 560 560 560 560
Possessory Int. 118,890130,482132,961 -138,570 Unsecured 291,256260,999321,263394,680395,266 Exempt - - -(83,552)(82,326)
TOTALS 8,820,915 $ 9,098,221 $ 9,525,614 $ 9,863,577 $ 10,585,082 $
Total Direct Rate 0.1815%0.1387%0.1399%0.1393%0.1396%
Note: Exempt values are not included in Total.
Source: HdL Coren Cone, L.A. County Assessor 2010/11 - 2019/20 Combined Tax
174
Rolls
CITY OF DOWNEY
ASSESSED VALUE
OF TAXABLE
PROPERTY
(amounts expressed in thousands)
Last Ten Fiscal Years
2017-182018-192019-202020-212021-22
Residential 8,709,975 $ 9,232,913 $ 9,738,633 $ 10,218,058 $ 10,585,620 $ Commercial 1,400,1091,447,9811,617,9091,690,3141,681,952 Industrial 334,314396,068394,148426,171450,432 Government owned 632 1,025 1,178 1,202 1,078 Institutional 76,903 96,087 72,370 86,243 90,881 Miscellaneous 3,549 3,619 3,692 3,765 3,804 Recreational 32,592 98,867 99,407101,478 96,659
Unknown 527 0 0 0 0
Vacant Land 46,663 39,308 42,486 41,149 53,494 SBE Nonunitary 1,011 1,011 1,011 1,011 1,620
Possessory Int. 140,024136,628140,933145,026149,775 Unsecured 379,260311,363411,983421,904395,251 Exempt (82,336)(82,245)(82,245)(81,846)(81,558)
TOTALS 11,125,559 $ 11,764,870 $ 12,523,750 $ 13,136,321 $ 13,510,566 $
Total Direct Rate 0.1396%0.1401%0.1411%0.1419%0.1414%
Note: Exempt values are not included in Total.
Source: HdL Coren Cone, L.A. County Assessor 2010/11 - 2019/20 Combined Tax Rolls
175
Basic Levy 1
City of Downey Tax District 1
CITY OF DOWNEY
DIRECT AND OVERLAPPING PROPERTY TAX RATES
(Rate per $100 of Taxable Value)
Last Ten Fiscal Years
2012-132013-142014-152015-162016-17
0.139700.139700.139700.139700.13970
Cerritos Community College District 0.026200.026200.026200.02620 0.02620
Childrens Institutional Tuition Fund 0.002910.002910.002910.002910.00291
County Sanitation District No. 2 Operating 0.013940.013940.013940.013940.01394
County School Service Fund-Downey 0.007430.007430.007430.007430.00743
County School Service 0.001460.001460.001460.001460.00146
Development Ctr For Handicapped Minors 0.000520.000520.000520.000520.00052
Downey Cemetery District 0.000890.000890.000890.000890.00089
Downey Unified School District 0.215400.215400.215400.215400.21540
Educational Augmentation Fund Impound 0.163100.163100.163100.163100.16310
Educational Revenue Augmentation 0.073400.073400.073400.073400.07340
Great L.A. County Vector Control Dist 0.000390.000390.000390.000390.00039
L. A. County Accum Cap Outlay 0.000120.000120.000120.000120.00012
L. A. County Fire 0.007680.007680.007680.007680.00768
L. A. County Flood Ctrl Drain Imp Dist Maint 0.001830.001830.001830.001830.00183
L. A. County Flood Ctrl Maintenance 0.010350.010350.010350.010350.01035
L. A. County General 0.334500.334500.334500.334500.33450
Water Replenishment District of Southern Calif 0.000180.000180.000180.000180.00018
Total Basic Levy Rate 1.000001.000001.000001.000001.00000
Cerritos Community College Dist 0.025940.025020.048090.048290.04698
Compton Community College Dist 0.015310.009630.009870.009260.00920
County Detention Facilities 1987 Debt0.000000.000000.000000.000000.00000
Downey Unified School District 0.071320.066030.065490.114660.11473
LA Community College District 0.048750.044540.040170.035750.03596
LA County Flood Control 0.000000.000000.000000.000000.00000
Little Lake City School District0.069420.085370.079640.065220.07527
Los Angeles Unified School District 0.175610.146440.146880.129710.13110
Metropolitan Water District 0.003500.003500.003500.003500.00350
Montebello Unified School District 0.096300.094570.087500.087150.14705
Norwalk-La Mirada Unified 0.069970.072380.070630.141140.13400
Rio Hondo Community College Dist 0.028120.028920.028210.027120.02808
Whittier Union High School Dist 0.045560.044730.052700.050630.06035
Total Voter Approved Rate 0.649800.621130.632680.712440.78621
TOTAL DIRECT & OVERLAPPING2 TAX RATE 1.649801.621131.632681.712441.78621
Rate producing Revenue for City and Redevelopment Agency (RDA)
City General Fund Direct Rate 3 0.0139730.0139730.0139730.0139730.013973
Total Direct Rate5 0.181540.138740.139020.139290.13960
Notes:
3. City's share of 1% Levy is based on the City's share of the general fund tax rate area with the largest net taxable value within the city. ERAF general fund tax shifts may not be included in tax ratio figures.
4. Redevelopment Rate is based on the largest RDA tax rate area (RA) and includes only rate(s) from indebtedness adopted prior to 1989 per California State statute. RDA direct and overlapping rate are applied only to the incremental property values. The approved of ABX1 26 eliminated Redevelopment fromtheStateofCaliforniaforthefiscalyear2012/13andyearsthereafter
5. Because basic and debt and rates vary by tax rate area individual rates cannot be summed. The Total Direct Rate is the weighted average of all individual direct rates applied by the government preparing the statisticalsectioninformation
Source: HdL Coren Cone, L. A. County Assessor 2010/11 - 2019/20 Tax Rate
1.In1978,CaliforniavoterspassedProposition13whichsetthepropertytaxrateata1%fixedamount.This1%issharedbyalltaxingagenciesforwhich thesubjectpropertyresideswithin.Inadditiontothe1%fxiedamount,propertyownersarechargedtaxasapercentageofassessedpropertyvaluesforthe payment of any voter approved bonds. 2.OverlappingratesarethoseoflocalandcountygovernmentsthatapplytopropertyownerswithintheCity.Notalloverlappingratesapplytoallcity property owners.
176
Table
Basic Levy 1
City of Downey Tax District 1
CITY OF DOWNEY
DIRECT AND OVERLAPPING PROPERTY TAX RATES (Rate per $100 of Taxable Value)
Last Ten Fiscal Years
2017-182018-192019-202020-212021-22
0.139700.139700.139700.139700.13970
Cerritos Community College District 0.026200.026200.026200.02620 0.02620
Childrens Institutional Tuition Fund 0.002910.002910.002910.002910.00291
County Sanitation District No. 2 Operating 0.013940.013940.01394 0.013940.01394
County School Service Fund-Downey 0.007430.007430.007430.007430.00743
County School Service 0.001460.001460.001460.001460.00146
Development Ctr For Handicapped Minors 0.000520.000520.000520.000520.00052
Downey Cemetery District 0.000890.000890.000890.000890.00089
Downey Unified School District 0.215400.215400.215400.215400.21540
Educational Augmentation Fund Impound 0.163100.163100.163100.163100.16310
Educational Revenue Augmentation 0.073400.073400.073400.073400.07340
Great L.A. County Vector Control Dist 0.000390.000390.000390.000390.00039
L. A. County Accum Cap Outlay 0.000120.000120.000120.000120.00012
L. A. County Fire 0.007680.007680.007680.007680.00768
L. A. County Flood Ctrl Drain Imp Dist Maint 0.001830.001830.001830.001830.00183
L. A. County Flood Ctrl Maintenance 0.010350.010350.010350.01035 0.01035
L. A. County General 0.334500.334500.334500.334500.33450
Water Replenishment District of Southern Calif 0.000180.000180.000180.000180.00018
Total Basic Levy Rate 1.000001.000001.000001.000001.00000
Cerritos Community College Dist 0.043700.044460.444900.043480.04251
Compton Community College Dist 0.009540.023350.023230.008990.00906
County Detention Facilities 1987 Debt 0.000000.000000.000000.000000.00000
Downey Unified School District 0.105380.101130.097080.087710.09504
LA Community College District 0.045990.046210.027170.040160.04376
LA County Flood Control 0.000000.000000.000000.000000.00000
Little Lake City School District 0.078760.076110.065320.066060.06200
Los Angeles Unified School District 0.122190.123230.125520.139930.11323
Metropolitan Water District 0.003500.003500.003500.003500.00350
Montebello Unified School District 0.135140.139210.093060.097060.09031
Norwalk-La Mirada Unified 0.138180.134250.140190.122200.14250
Rio Hondo Community College Dist 0.027480.025540.025710.013610.01526
Whittier Union High School Dist 0.057810.058220.055020.054330.05395
Total Voter Approved Rate 0.767680.775211.100700.677030.67112
1.In1978,CaliforniavoterspassedProposition13whichsetthepropertytaxrateata1%fixedamount.This1%issharedbyalltaxingagenciesforwhich thesubjectpropertyresideswithin.Inadditiontothe1%fxiedamount,propertyownersarechargedtaxasapercentageofassessedpropertyvaluesforthe payment of any voter approved bonds.
3.City'sshareof1%LevyisbasedontheCity'sshareofthegeneralfundtaxrateareawiththelargestnettaxablevaluewithinthecity.ERAFgeneralfund tax shifts may not be included in tax ratio figures. 4.RedevelopmentRateisbasedonthelargestRDAtaxratearea(RA)andincludesonlyrate(s)fromindebtedness adoptedpriorto1989perCaliforniaState statute.RDAdirectandoverlappingrateareappliedonlytotheincrementalpropertyvalues.TheapprovedofABX126eliminatedRedevelopmentfromthe State of California for the fiscal year 2012/13 and years thereafter.
5.Becausebasicanddebtandratesvarybytaxrateareaindividualratescannotbesummed.TheTotalDirectRateistheweightedaverageofallindividual direct rates applied by the government preparing the statistical section information.
Source: HdL Coren Cone, L. A. County Assessor 2010/11 - 2019/20 Tax Rate Table
City and Redevelopment
Rate
Notes: 2.OverlappingratesarethoseoflocalandcountygovernmentsthatapplytopropertyownerswithintheCity.Notalloverlappingratesapplytoallcity property owners.
TOTAL DIRECT & OVERLAPPING2 TAX RATE 1.767681.775221.700291.667021.67113 Rate producing Revenue for
Agency (RDA) City General Fund Direct
3 0.0139730.139730.139730.139730.13973 Total Direct Rate5 0.139590.140130.141120.141850.14142
177
CITY OF DOWNEY
PRINCIPAL PROPERTY TAX PAYERS
(amounts expressed in thousands)
Taxable% of Total CityTaxable% of Total City AssessedTaxable AssessedTaxable Taxpayer ValueAssessed ValueValueAssessed Value
US VI Downey LLC 177,258 $ 1.31%$-
Gary L. Ball Trust 119,168 0.88%102,695 1.16%
Downey Landing LLC 103,852 0.77% 68,542 0.78%
PRC Multi-Family LLC 92,005 0.68% 31,651 0.36%
Reyes Coca-Cola Bottling LLC 90,024 0.67% 92,550 1.05%
Macerich Stonewood LLC 64,118 0.47% 54,531 0.62%
Kaiser Foundation Health Plan, Inc. 56,597 0.42% 98,205 1.11%
Lone Oak-Downey, LLC 54,262 0.40% - 0.00%
Fremont Rancho Limited 50,482 0.37% 43,504 0.49%
Hall Stewart and Gray Road LLC 49,405 0.37% - 0.00%
Top Ten Total 857,171 6.34%491,678 5.57%
Note: The amounts shown above include assessed value data for both the City and the Redevelopment Agency.
Current Year and Nine Years Prior 2021-22 2012-13 Source: HdL Coren Cone 178
CITY OF DOWNEY
PROPERTY TAX LEVIES AND COLLECTIONS (amounts expressed in thousands)
Last Ten Fiscal Years
Total Collections to Date
Fiscal YearTaxes LeviedCurrent TaxPercent ofCollectionsTaxPercent of Ended for theCollected Levyin Subsequent CollectedTotal Tax June 30Fiscal YearAmountCollectedFiscal YearAmountCollections
2012-13 12,40712,407100.00% - 12,407100.00%
2013-14 12,71012,31396.88% 38 12,35197.18%
2014-15 13,30713,14298.76% 16513,307100.00%
2015-16 13,58713,16496.89% 2613,19097.08%
2016-17 14,41614,24198.79% 2614,26798.97%
2017-18 15,16515,14099.84% 315,14399.85%
2018-19 16,05015,30195.33% 415,30595.36%
2019-20 17,09916,25295.05% 1716,26995.15%
2020-21 18,00917,26695.87% -17,26695.87% 2021-22 18,46517,79896.39% 1417,81296.46%
Source: L.A. County Auditor Controller's Office 2019-20
179
Governmental Activities
CITY OF DOWNEY
RATIOS OF OUTSTANDING DEBT BY TYPE (amounts expressed in thousands)
Last Ten Fiscal Years
Business-type Activities
Certificates
TotalFinance
TotalTotalPercentageDebt Fiscal of GovernmentalPurchase Business-typePrimaryof PersonalPer YearBondsParticipationOtherActivitiesAgreement*OtherActivitiesGovernmentIncomeCapita
2012-1319,260 -13,35332,6137,149-7,14939,7621577.1%354 2013-1418,933 -13,89332,8266,783-6,78339,6091530.8%351 2014-1518,545 -13,94932,4945,875-5,87538,3692349.6%537
2015-1618,092 -16,16534,2575,480-5,48039,7372719.7%625 2016-1717,569 -16,63034,1995,070-5,07039,2691495.8%344 2017-1867,580 -17,47085,0504,6452814,92689,9763404.6%790 2018-1964,691 -9,32174,0124,2002134,41378,4252840.1%687
2019-2062,368 -9,16871,5363,7401443,88475,4202594.2%660 2020-21168,675 -8,593177,2683,2654,5817,846185,1145990.5%1,631 2021-22194,809 -7,811202,6202,7704,5097,279209,8996165.0%1,864
* Finance purchase agreement was issued to prepay the 2002 Certificates of Participation
Source:
180
Finance Department, City of Downey
CITY OF DOWNEY
RATIO OF GENERAL BONDED DEBT TO ASSESSED VALUE AND NET BONDED DEBT PER CAPITA (amounts expressed in thousands)
Last Ten Fiscal Years
Debt Ratio of Net AssessedGrossServiceNetBonded DebtNet Bonded Calendar ValueBondedMoniesBondedto AssessedDebt Per YearPopulation(in thousands)DebtAvailableDebtValueCapita
2012-13112,7618,82132,613 -32,613369.7%28.9%
2013-14113,3639,09832,826 -32,826360.8%29.0%
2014-15113,4179,52632,494 -32,494341.1%28.7%
2015-16114,1819,99834,257 -34,257342.6%30.0%
2016-17113,83210,58534,199 -34,199323.1%30.0%
2017-18114,14611,12685,050 -85,050764.5%74.5%
2018-19114,21211,76574,012 -74,012629.1%64.8%
2019-20113,52912,52471,536 -71,536571.2%63.0%
2020-21111,42513,136177,268 -177,2681349.5%159.1%
2021-22112,58413,511202,620 -202,6201499.7%180.0%
* Gross Bonded Debt Restated for prior years due to exclusion of Business Type Activities
Source: Finance Department, City of Downey
181
182
THIS PAGE INTENTIONALLY LEFT BLANK
City Assessed Valuation
13,510,566,910 $
Incremental Valuation (846,242,237)
Total Assessed Valuation 12,664,324,673 $
Debt to Assessed Valuation Ratios:
Direct Debt 1.60% Overlapping Debt 2.73% Total Debt 4.33%
Gross Bonded Percent Net Debt BalanceApplicable to Bonded 6/30/2022City of Downey Debt
Metropolitan Water District* 9,835,780 $ 0.818 80,408 $
Little Lake City SD DS 00SR D-1QSCBS 4,440,000 3.486 154,765
Little Lake City SD DS 2011 Refunding Bond 999,901 3.486 34,854
Little Lake City SD DS 2012 Series A 7,370,000 3.486 256,896
Little Lake City SD DS 2014 Ref Bonds Series A 4,140,000 3.486 144,308
Little Lake City SD DS 2014 Ref Bonds Series B 2,470,000 3.486 86,097
Little Lake City SD DS 2012 Series B 11,260,000 3.486 392,490
Whittier UN High DS 2008 Series 2014B 4,995,682 0.589 29,417
Whittier UN High DS 2008 Series 2015C 6,190,000 0.589 36,450
Whittier UN High DS 2015 Ref Bonds 20,080,000 0.589 118,241
Whittier UN High DS 2016 Ref Bonds 111,533,679 0.589 656,766
Cerritos CCD DS 2004 Series 2012D 30,896,885 24.033 7,425,363
Cerritos CCD DS 2012 Series 2014A 73,900,000 24.033 17,760,183
Cerritos CCD DS 2014 Refunding Bonds Series A 72,380,000 24.033 17,394,885
Cerritos CCD DS 2014 Refunding Bonds Series B 5,255,000 24.033 1,262,920
Cerritos CCD DS 2012 Series 2018B 52,770,000 24.033 12,682,068
Cerritos CCD DS 2012 Series 2019C 93,325,000 24.033 22,428,539
Cerritos CCD DS 2020 Ref Bonds 51,350,000 24.033 12,340,804
Cerritos CCD DS 2012 Series 2021D 75,000,000 24.033 18,024,543
Compton CCD DS 2002 Series 2012C 5,382,720 0.654 41,774
Compton CCD DS 2012 Ref Bonds 2,095,000 0.654 13,711
Compton CCD DS 2002 Series 2013D 149,624 0.654 979
Compton CCD DS 2014 Ref 5,770,000 0.654 37,763
Compton CCD DS 2015 Ref Bonds 5,300,000 0.654 34,687
Compton CCD DS 2014 Series A 16,035,000 0.654 104,946
Compton CCD DS 2002 Series 2018E 10,145,677 0.654 66,401
Compton CCD DS 2020 Ref Bonds Series A 79,945,000 0.654 523,223
LA CCD DS 2003 Taxable Series 2004B 2,115,000 0.002 50
LA CCD DS 2001 Taxable Series 2004A 31,555,000 0.002 743
LA CCD DS 2008, 2009 Taxable Series B 75,000,000 0.002 1,767
LA CCD DS 2008, 2010 Taxable Series D 125,000,000 0.002 2,945
LA CCD Debt 2008, 2010 Tax Ser E (BABS) 900,000,000 0.002 21,203
LA CCD DS 2013 13,000,000 0.002 306
LA CCD DS 2013 Ref Bonds 8,380,000 0.002 197
LA CCD DS 2008 Series G 30,765,000 0.002 725
LA CCD DS 2015 Ref Series A 144,260,000 0.002 3,399
LA CCD DS 2015 Ref Series B 14,965,000 0.002 353
LA CCD DS 2015 Ref Series C 178,565,000 0.002 4,207
LA CCD DS 2008 Series I 184,220,000 0.002 4,340
LA CCD DS 2008 Series J 173,020,000 0.002 4,076
LA CCD DS 2016 Ref Bonds 239,880,000 0.002 5,651
LA CCD DS 2020 Ref Bonds 1,750,350,000 0.002 41,237
LA CCD DS 2016 Series C 275,440,000 0.002 6,489
Rio Hondo CCD DS Ref 2004 2019 Series B 113,112,824 0.377 426,512
Downey Unified DS Refunding 1999 Series A 1,730,256 91.665 1,586,036
Downey USD DS 2007 Refunding Bonds 9,335,000 91.665 8,556,910
Downey USD DS 2014 Series A 34,935,000 91.665 32,023,101
Downey USD DS 2015 Ref Bonds 2,940,000 91.665 2,694,945
Downey USD DS 2016 Ref Bonds 4,565,000 91.665 4,184,499
Downey USD DS 2014 Series B 116,900,000 91.665 107,156,162
Downey USD DS 2014 Series C 9,997,984 91.665 9,164,633
Downey USD DS 2021 Ref Bonds 73,270,000 91.665 67,162,806
Montebello USD DS 1998 Series 1998 1,352,514 0.121 1,635
Montebello USD DS 1998 Series 1999 1,659,946 0.121 2,007
Montebello USD DS 1998 Series 2001 2,156,550 0.121 2,607
Montebello USD DS 1998 Series 2004 4,509,982 0.121 5,452
Montebello USD DS 1998 Series 2002 3,683,332 0.121 4,453
Montebello USD DS Ref 2004 Series 2013A 13,815,000 0.121 16,701
Montbello USD DS Ref Bond Series 2015 25,065,000 0.121 30,302
Montbello USD DS Ref Bonds 2016 Series A 12,200,000 0.121 14,749
Montbello USD DS 2016 Series A 91,520,000 0.121 110,641 Total
1.
Direct Debt
Total Direct and Overlapping Debt
$ Notes:
Overlapping Debt 345,375,321 Total
202,620,249
547,995,570
This report reflects debt which is being repaid through voter-approved property tax indebtedness. It excludes mortgage revenue, tax allocation bonds, interim financing obligations, non-bonded capital lease obligations, and certificates of participation, unless provided by the city.
Overlapping governments are those
with the
of the
of overlapping debt applicable
by using
values.
were estimated by determining the portion of another governmental unit's taxable assessed value
the
and
by
unit's
value.
fund
portion
responsible for debt
outside the
Source: HdL Coren Cone, Los Angeles County Assessor and Auditor Combined 2019/20 Lien Date Tax Rolls 183
2.
that coincide, at least in part,
geographic boundaries
city. The percentage
is estimated
taxable assessed
Applicable percentages
that is within
city's boundaries
dividing it
each
total taxable assessed
*This
is a
of a larger agency, and is
in areas
city. CITY OF DOWNEY SCHEDULE OF DIRECT AND OVERLAPPING DEBT June 30, 2022
Assessed Valuation
Charter Debt Limited
CITY OF DOWNEY
SCHEDULE OF LEGAL DEBT MARGIN (amounts expressed in thousands)
Last Ten Fiscal Years
2012-132013-142014-152015-162016-17
8,646,847 $ 8,820,915 $ 9,525,614 $ 9,998,371 $ 10,585,083 $
1,297,027 1,323,1371,428,8421,499,7561,587,762 (15% of Assessed Valuation)
Legal Debt Margin 1,297,027 $ 1,323,137 $ 1,428,842 $ 1,499,756 $ 1,587,762 $
Total Debt applicable to the limit as a percentage of debt limit 0% 0% 0% 0% 0%
Note: The Government Code of the State of California provides for a legal debt limit of 15% of gross assessed valuation.
Source: L. A. County Assessor 2010/11 - 2019/20 Combined Tax Rolls
184
Assessed Valuation
Charter Debt Limited
CITY OF DOWNEY
SCHEDULE OF LEGAL DEBT MARGIN (amounts expressed in thousands)
Last Ten Fiscal Years
2017-182018-192019-202020-212021-22
11,125,558 $ 11,764,870 $ 12,523,750 $ 13,136,321 $ 13,510,567 $
1,668,834 1,764,7311,878,5631,970,4482,026,585 (15% of Assessed Valuation)
Legal Debt Margin 1,668,834 $ 1,764,731 $ 1,878,563 $ 1,970,448 $ 2,026,585 $
Total Debt applicable to the limit as a percentage of debt limit 0% 0% 0% 0% 0%
Note: The Government Code of the State of California provides for a legal debt limit of 15% of gross assessed valuation.
Source: L. A. County Assessor 2010/11 - 2019/20 Combined Tax Rolls
185
CITY OF DOWNEY
GOLF COURSE REVENUE COVERAGE (amounts expressed in thousands)
Last Ten Fiscal Years
Net DirectAvailable
FiscalGrossOperatingfor Debt YearRevenueExpensesServicePrincipalInterestTotalCoverage
Debt Service Requirement
2012-132,6392,4142253503496990.32
2013-143,3252,6966293653357000.90
2014-153,0192,966534751326070.09
2015-163,2492,4537963952106051.32
2016-173,1282,5935354101956050.88
2017-183,2232,7334904251806050.81
2018-193,2132,7035104451636090.84
2019-202,7762,832(56)460147607(0.09)
2020-214,3132,9911,3224751306052.19 2021-224,6942,9781,7164951126072.83
Note: Direct operating expenses does not include inter-fund transfers and debt services.
Source: Finance Department, City of Downey
186
CITY OF DOWNEY DEMOGRAPHIC AND ECONOMIC STATISTICS
Last Ten Calendar Years
Personal Per Capita Calendar Income PersonalUnemployment YearPopulation (in thousands) Income Rate
2012 112,761 2,587,414 22,946 8.2%
2013 113,363 2,544,773 22,448 7.6%
2014 113,417 2,589,877 22,835 6.3%
2015 114,181 2,625,354 22,992 6.0%
2016 113,832 2,642,801 23,216 4.6%
2017 114,146 2,761,333 24,191 3.5%
2018 114,212 2,907,308 25,455 4.5%
2019 113,529 3,090,130 27,218 4.1%
2020 111,425 3,233,140 29,016 12.6%
2021 112,584 3,404,669 30,241 8.9%
187
Source: HdL Coren Cone
188
THIS PAGE INTENTIONALLY LEFT BLANK
CITY OF DOWNEY PRINCIPAL EMPLOYERS
Current Year and Nine Years Prior 2021-22 2012-13
Percent of Percent of Number ofTotalNumber ofTotal Employer EmployeesEmploymentEmployeesEmployment
Kaiser Permanente 5,40014.24%4,5008.50%
Stonewood Shopping Center 1,8004.75%2,1004.00%
Rancho Los Amigos Medical Center 1,6004.22%1,4102.70%
PIH Health (formally Downey Regional Medical Center)1,5003.95%9551.80%
Office of Education, County of Los Angeles 1,4253.76%9001.70%
Downey Unified School District 1,3543.57%1,8513.50%
Coca-Cola Bottling Company 8002.11%9201.70% . County of Los Angeles, Internal Service Department 7121.88% -City of Downey 7031.85% -.
Lakewood Health Center 4001.05%3250.60%
Source: City of Downey, Finance Department and Community Development Department and Downey Chamber of Commerce 189
CITY OF DOWNEY
FULL-TIME AND PART-TIME CITY EMPLOYEES BY FUNCTION
Last Ten Fiscal Years
Function
2012-132013-142014-152015-16 2016-17
General Government 33313236 38 Police 166167161166166 Fire 8694198289 94 Community Services 3373794693477373 Public Works 83747681 79 Community Development 30212121 21
Total 735766857870771
Notes:
1.Fire department was authorized to hire 12 paramedic operators upon receipt of Federal grant.
2.IncreasetoFireDeptduringFY14&FY15isduetohavingAmbulanceOperatorshiredasemployeesratherthan using an Ambulance Contract Service
3.Theparttimeemployeeshourswerereducedtokeepthembelowtherequirementsforofferinginsurancebenefits. Staffing had to increase to cover the reduction in current staff hours.
Source: Finance Department, City of Downey
190
CITY OF DOWNEY
FULL-TIME AND PART-TIME CITY EMPLOYEES BY FUNCTION
Last Ten Fiscal Years
Function 2017-182018-192019-202020-21 2021-22
General Government 39414040 38 Police 181189195188 185 Fire 115105125120113 Community Services 441402369249275 Public Works 79818383 72 Community Development 23232220 20
Total 878841834700703
Notes:
1. Fire department was authorized to hire 12 paramedic operators upon receipt of Federal grant.
2.IncreasetoFireDeptduringFY14&FY15isduetohavingAmbulanceOperatorshiredinasemployeesratherthan using an Ambulance Contract Service
3.Theparttimeemployeeshourswerereducedtokeepthembelowtherequirementsforofferinginsurancebenefits. Staffing had to increase to cover the reduction in current staff hours.
Source: Finance Department, City of Downey
191
CITY OF DOWNEY
OPERATING INDICATORS
Last Ten Fiscal Years
2012-132013-142014-152015-16 2016-17
Police:
Number of arrests 3,3763,3683,9423,9473,498
Number of collision reports issued 1,1351,1701,1991,280 1,112
Number of traffic citations issued 32,03135,64316,00814,696 14,111
Number of reported crimes & incidents 9,7598,1989,3319,729 8,576
Fire:
Number of emergency incidents 6,9796,9967,3468,0817,915
Number of fire & other incidents 1,2681,3631,3391,635 1,689
Number of special service & other incidents171312410374 449
Number of traffic accidents 8128531,0261,121 1,073
Parks and Recreation:
Number of general park attendance954,6961,404,3611,652,4692,004,3111,620,000
Number of participants in theatre 47,94342,21945,86951,762 45,500
Number of library attendance 356,586363,640360,211371,625 326,941
Public works:
Engineering (CIP related improvement)
Street striping (lineal feet) 5,79839,75039,21855,39293,640
Asphalt replacement (tons) 5,20121,48419,99830,728 39,730
Trees planted (each) n/an/a437105 118 Trees removed (each) 151220100332 89
Maintenance
Pavement markings (square feet) 35,03857,22938,48524,98548,070 Street stripping (linear feet) 260,46329,7518,7212,084 803,231
Asphalt repair (tons) 403375403422 450 Graffiti removed (square feet) 633,950645,000676,623752,655 581,479 Trees trimmed (each) 5,8208,1693,6778,034 8,889 Trees planted (each) 1232048195 473 Trees removed (each) 618228205185 145
Vehicles serviced - preventative maintenance (each) 1,3324551,6041,494 550 Vehicles serviced - repairs (each) 849660656547 646
Water:
Number of customers 23,48622,96123,03923,34123,314 Annual supply (acre feet) 17,21517,27915,76813,911 14,352 Maximum daily capacity 45,00045,00045,00045,000 45,000 (thousands of gallons)
Sanitary Sewer: Sewer main cleaned (no. of miles) 57453570 78 Vector coating applied to sewer manholes1,6501,3501,65025 1,650
Golf course: Golf rounds played 66,27660,15252,82858,57665,658
Source: Finance Department, City of Downey
192
CITY OF DOWNEY
OPERATING INDICATORS
Last Ten Fiscal Years
2017-182018-192019-202020-21 2021-22
Police:
Number of arrests 3,4714,5163,0162,464 2,535
Number of collision reports issued 1,0231,0551,075 831 957
Number of traffic citations issued 14,08516,01713,00413,175 12,048
Number of reported crimes & incidents 12,8399,7367,5557,625 8,834
Fire:
Number of emergency incidents 8,1148,0549,0278,314 8,916
Number of fire & other incidents 1,4241,3351,2601,161 1,748
Number of special service & other incidents 416 377 464 395 345
Number of traffic accidents 9071,004 632 475 581
Parks and Recreation:
Number of general park attendance 1,954,2971,950,0002,250,0001,764,865 2,592,959
Number of participants in theatre 107,130110,000115,000 0 97,092
Number of library attendance 320,311181,821 011,629 150,030
Public works:
Engineering (CIP related improvement)
Street striping (lineal feet) 40,20519,805887,5094,360 69,101
Asphalt replacement (tons) 23,15011,95728,56618,923 73,658
Trees planted (each) 106 16 214 138 35
Trees removed (each) 46 0 19 26 156
Maintenance
Pavement markings (square feet) 41,64012,3867,1542,639 2,933
Street stripping (linear feet) 792 0 896 0 0
Asphalt repair (tons) 417 274 355 311 256
Graffiti removed (square feet) 568,449378,070408,418444,339 390,236
Trees trimmed (each) 8,2208,8738,6467,183 6,990
Trees planted (each) 129 5442,034 117 81
Trees removed (each) 124 239 212 122 205
Vehicles serviced - preventative maintenance (each) 1,0311,113 921 827 836 Vehicles serviced - repairs (each) 532 537 379 267 272
Water:
Number of customers 23,33623,48223,55523,010 23,044 Annual supply (acre feet) 14,79614,29813,80214,289 14,456 Maximum daily capacity 40,00040,00040,00040,000 40,000 (thousands of gallons)
Sanitary Sewer:
Sewer main cleaned (no. of miles) 77 91 85 86 100 Vector coating applied to sewer manholes 1,6501,6501,6501,750 1,800
Golf course: Golf rounds played 63,57463,50062,00085,02786,645
193
Source: Finance Department, City of Downey
CITY OF DOWNEY
CAPITAL ASSET STATISTICS BY FUNCTION
Last Ten Fiscal Years
Function 2012-132013-142014-15 2015-16 2016-17
Public Safety
Number of Police stations 11 1 1 1
Number of Fire stations 44 4 4 4
Highways and streets
Miles of streets 210210210210 210 Traffic signals 116116116116 116 No. of street lights 5,4305,4305,4305,430 5430
Water
Number of active water wells20202020 20 Number of reservoirs 11 1 1 1 Miles of lines & mains 276276276276 276
Sewer
Miles of sanitary sewer 187187193193 193 Sewer lift station 22 2 2 2
Culture and Recreation
Number of parks 12121212 12
Number of community centers 11111
Number of golf course1-18-hole1-18-hole1-18-hole1-18-hole1-18-hole
Source: Finance Department, City of Downey
194
CITY OF DOWNEY
CAPITAL ASSET STATISTICS BY FUNCTION
Last Ten Fiscal Years
Function 2017-182018-192019-202020-21 2021-22
Public Safety
Number of Police stations 1 1 1 1 1 Number of Fire stations 4 4 4 4 4
Highways and streets
Miles of streets 210210210210 215 Traffic signals 116116116118 118 No. of street lights 5430543054365440 5440
Water
Number of active water wells20202020 20 Number of reservoirs 1 1 1 1 1 Miles of lines & mains 276276276276 276
Sewer Miles of sanitary sewer 193193193193 193 Sewer lift station 1 1 1 1 1
Culture and Recreation
Number of parks 12121212 13
Number of community centers 11111
Number of golf course1-18-hole1-18-hole1-18-hole1-18-hole1-18-hole
Source: Finance Department, City of Downey
195
196
THIS PAGE INTENTIONALLY LEFT BLANK
197


11111 Brookshire Avenue Downey, CA 90241 562.869.7331 www.downeyca.org 198
