BTCSETTLES.... FORNOW

MARKETSIGNALS

BitcoinLeadstheMarketLower:Fresh Lowsand$2.5BillionLiquidationWave
MACROUPDATE

ACautiousUSEconomy:CreditGrowth, SofterJobs,andShiftingMarketSignals


BitcoinLeadstheMarketLower:Fresh Lowsand$2.5BillionLiquidationWave
ACautiousUSEconomy:CreditGrowth, SofterJobs,andShiftingMarketSignals
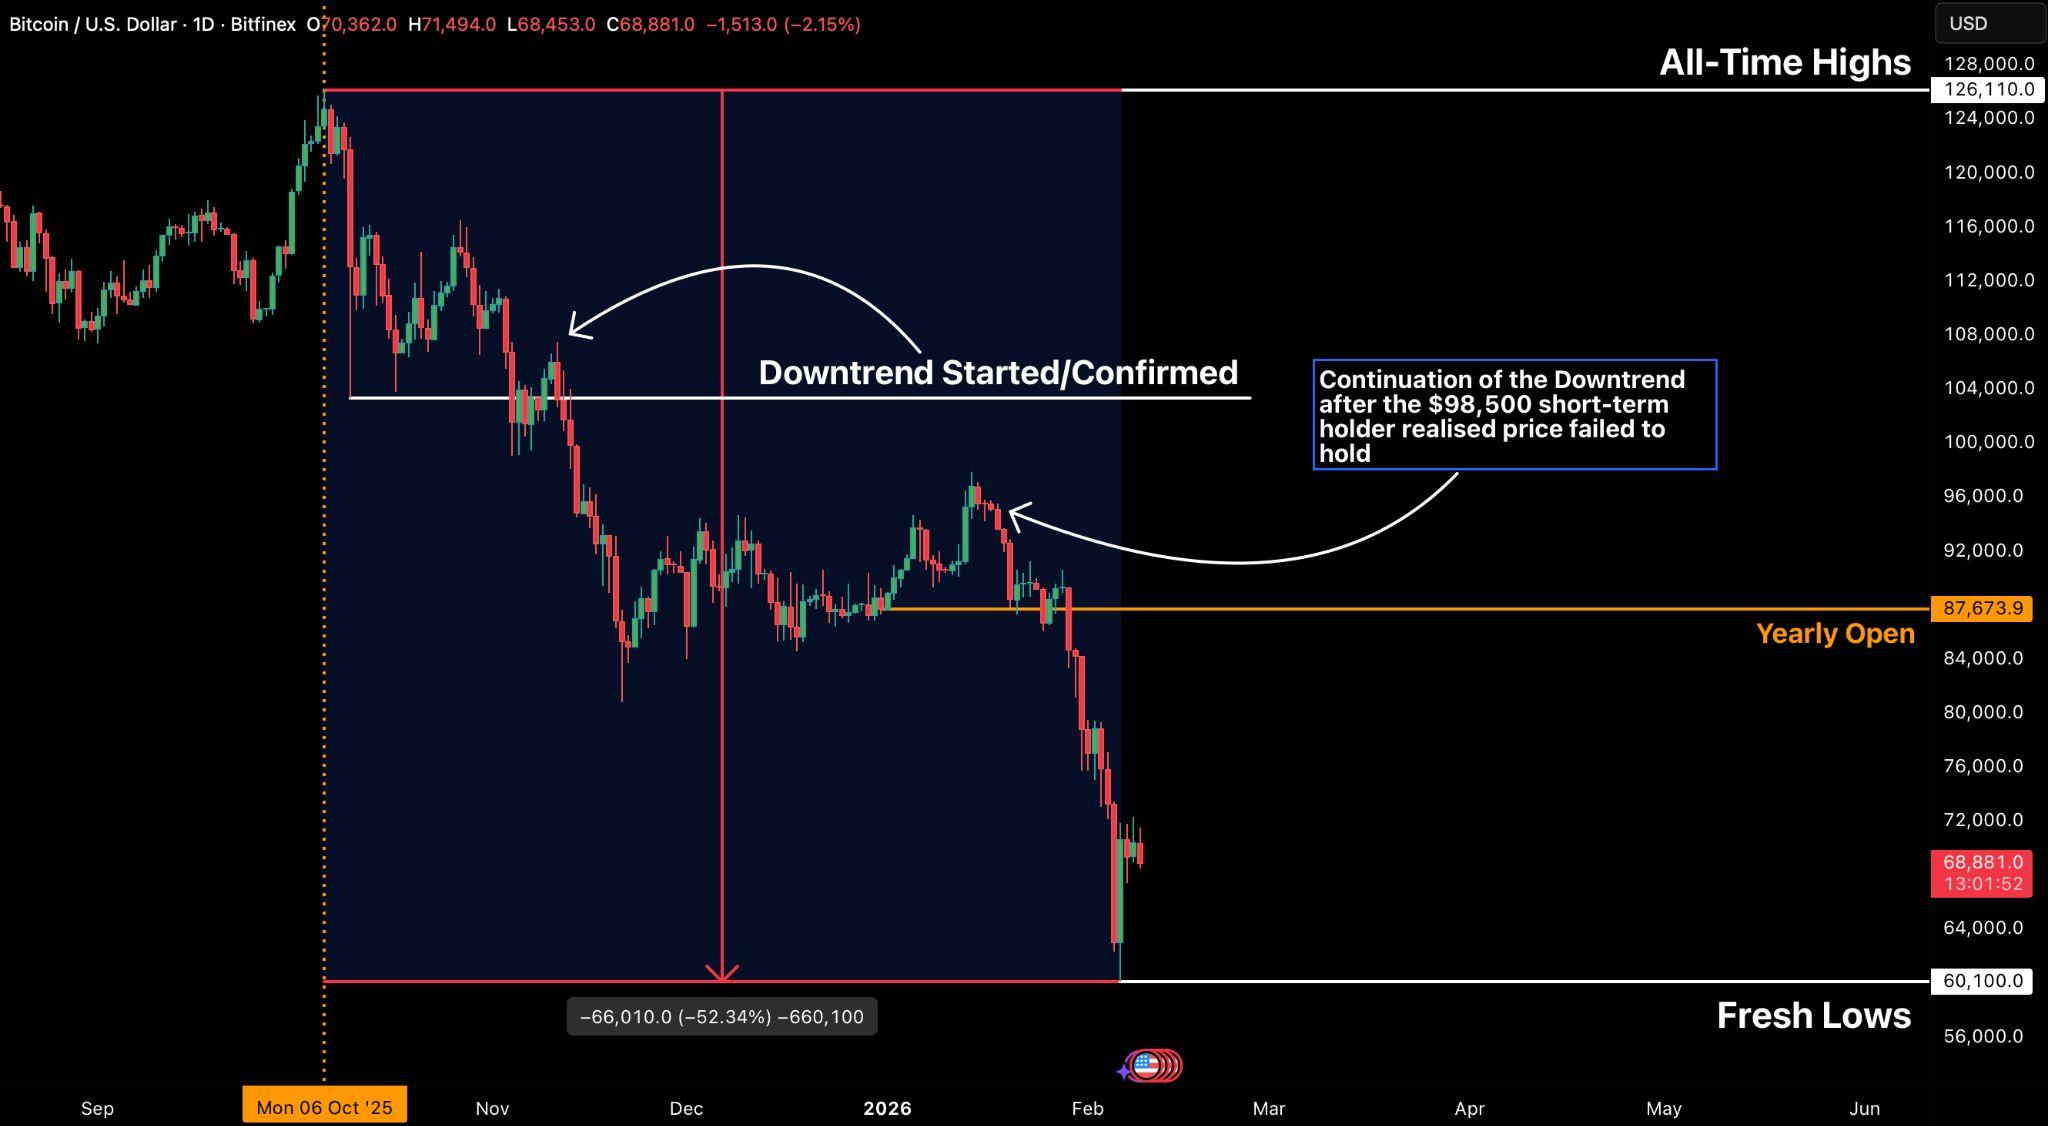
Bitcoinʼsslidetothe$60,000 handlemarksthedeepestdrawdownofthecurrent cycle,withlossesnowexceeding52percentfromtheOctober2025all-timehigh and January registering its weakest performance since 2022. The market has decisively lost multiple structural supports, including the short-term holder cost basis,theyearlyopen,andtheTrueMarketMean,confirmingaregimeshiftfrom distributionintoasustaineddowntrend.Unlikepriorliquidation-drivensell-offs,the latest leg lower was characterised by persistent, price-agnostic spot selling, culminating in the largest single-day market cap decline in Bitcoinʼs history and brieflypushingpriceto$60,100beforeasharpreflexivebounce.
On-chain stress indicators underline the severity of the move but also hint at emerging exhaustion. Realised losses have surged above $1.2 billion per day, levels historically associated with late-stage corrective phases rather than trend initiation.Atthesametime,leveragehasbeenmateriallyflushed,withglobalopen interest down nearly 50 percent from the peak, reducing systemic fragility. While seasonality has failed and near-term momentum remains bearish, the confluence of capitulation signals suggests Bitcoin is entering a stabilisation phase. The $60,000$74,000zonenowdefinesthekeybattleground,withthemarketlikelyto consolidate here as it digests losses and resets positioning, ahead of clearer signals on whether this range becomes a base for recovery or a pause before furtherdownside.
RecentUSdatasuggeststheeconomyisstabilisingunevenlyratherthanentering a renewed expansion. Household confidence has edged modestly higher, but sentiment remains fragile and uneven, with gains largely concentrated among householdswithequityexposure.Atthesametime, consumercreditgrowthhas accelerated well beyond expectations, indicating that spending is increasingly supported by borrowing rather than improving income prospects. This points to short-term resilience built on financial accommodation, not a durable improvementinhouseholdfundamentals.
Labour market data reinforces this cautious picture. Layoffs have risen sharply, job openings have fallen to multi-year lows, and hiring momentum has slowed materially, even as the unemployment rate remains historically low. Market-sensitive indicators have responded quickly, with short-term Treasury yieldsdecliningasexpectationsforpolicyeasinglaterintheyearincrease.While artificial intelligence features prominently in corporate layoff narratives, current evidencesuggestsrestructuringandsofterdemand—ratherthanautomation— remaintheprimarydriversofjoblosses.
Bondmarketsignalsalignwiththisshift.TheUSTreasuryyieldcurvehasmoved backintopositiveterritoryafteraprolongedinversion,reflectingeasingpressure on short-term rates rather than stronger growth expectations. Investors appear increasinglyfocusedonslowinglabourmomentumandfuturepolicyrelief,while householdsandfirmscontinuetorespondtopresentconstraints.Thisdivergence is also evident in the housing market, where activity remains subdued despite easing mortgage rates, as buyers remain cautious amid high prices and income uncertainty. Rising listings suggest a gradual rebalancing rather than a rapid recovery.
Against both this macro backdrop, and the recent market dislocation in digital assets, the Peopleʼs Bank of China has reaffirmed its restrictive stance by extending bans to real-world asset tokenisation and yuan-linked stablecoins. Meanwhile, South Koreaʼs financial regulator is stepping up cryptocurrency oversight with targeted investigations and tougher enforcement to curb market manipulation, address operational risks at exchanges, and strengthen customer protection.
Overall, the combined data points to an economy adjusting late in the cycle, where financial markets are pricing future easing, households remain cautious, and digital asset growth is increasingly shaped by balance-sheet strength and regulatoryalignmentratherthanbroad-basedriskappetite.

1.MarketSignals
BitcoinDropsto$60,000AftertheWorst JanuarySince2022
2.GeneralMacroUpdate
● USHouseholdsCautiouslyConfidentAs BorrowingRises
● USLabourMarketSoftensAsLayoffs RiseAndAINarrativesGrow
● TreasuryCurveSignalsShiftAsUS HousingMarketAdjusts
3.NewsFromTheCryptosphere
● ChinaTightensCryptoControls,Extends BantoRWATokenizationand Yuan-LinkedStablecoins
● SouthKoreaSignalsTighterCrypto OversightAfterMarketIntegrity Concerns


Bitcoin dropped more than 52 percent from its October 2025 all-time high, marking the largest drawdown of the current cycle. Ever since October 10, which saw the largest liquidation event in crypto history, the market has remainedlockedinacleardowntrend.
Trend confirmation was established on 14 January when a retest at the Short-Term Holder realised price near $97,500 failed to reclaim this key on-chainthresholdandsubsequentlyrolledover.Thatrejectionwasfollowed byabreakdownbelowthe2025yearlyopen,leavingBitcointoenterwhatis shapinguptopotentiallybethesecond-worstFebruaryonrecord.
Fromanon-chainperspective,thedamageisdeeper.BTChasnowdecisivelylost critical structural support levels, most notably the True Market Mean, which currentlysitsatapproximately$78,500,withbothdailyandweeklyclosesbelow this level. Metrics that previously acted as demand anchors during the consolidation phase have now flipped into overhead resistance, reinforcing the bearishmarketstructure.
Takentogether,thefailuretoreclaimtheshort-termholdercostbasis,thelossof theyearlyopen,andthebreakdownbelowtheTrueMarketMeanconfirmthatthe markethastransitionedawayfromdistributiondrivingthepricelower,andintoa sustaineddowntrendingregime.Anymeaningfulrecoveryattemptwillfirstneed toovercomethesereclaimedresistancezonesbeforeabroaderstructural reversalcanbeconsidered.
On5February,BTCdeclinedby14.04percentonBitfinex,andcloseto15percent on some other trading venues. This is the largest daily decline since November 2022 in percentage terms and the largest decline in terms of market cap reduction in the assetʼs history. The insight that sets this event apart is the fact that it wasnʼt a deleveraging event similar to 10/10, but was structural selling via spotinstruments,inapriceagnosticmannerthatoccurredovermorethanweek, butwhichacceleratedon5February.
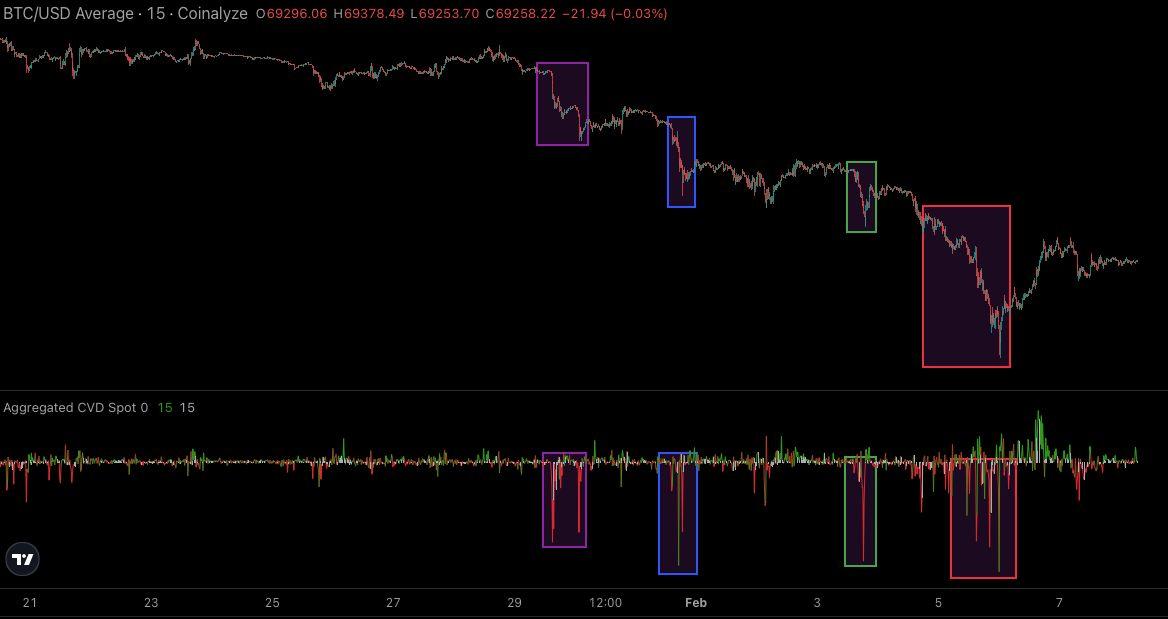
Figure2BTC/USD15mChartFromJan31sttoFeb5thOverlaidWithThe AggregatedCumulativeVolumeDeltaForUSD/USDTPairs.Source: Coinalyze)
The spot cumulative volume delta metric highlights how the period between 31 Januaryand5Februarysaw constantaggressive(market)sellingpressure,with over $67 billion worth of BTC being distributed especially during US sessions. While there is speculation about different single entity actors that caused the pricetodrop, whatisrelevantisthatthiswaslikelyanexaggeratedlow,created onthebackofapossibleone-offeventthattookustotherangelowof$60,100. The fact that there was an almost immediate rebound, adds credibility to this theory,withthepricemovingup 19.4percent.
To assess the risk of further near-term downside risk, capitulation dynamics provide an additional lens through which to analyse where the market may go from here.
TheRealizedLossmetricdirectlycapturesinvestorstressbymeasuringthedollar valueofcoinsspentatalossoveragivenperiod,makingitparticularlyeffective foridentifyingphasesofpanic-drivenselling.

Inthecurrentdrawdown,the7-daysimplemovingaverageofrealisedlosseshas climbedabove$1.26billionperday,signallingasharpriseinfearandfrustration followingthebreakdownbelowtheTrueMarketMean.Thisreflectsinvestors increasinglychoosingtoexitpositionsatalossratherthanendurefurther uncertainty.
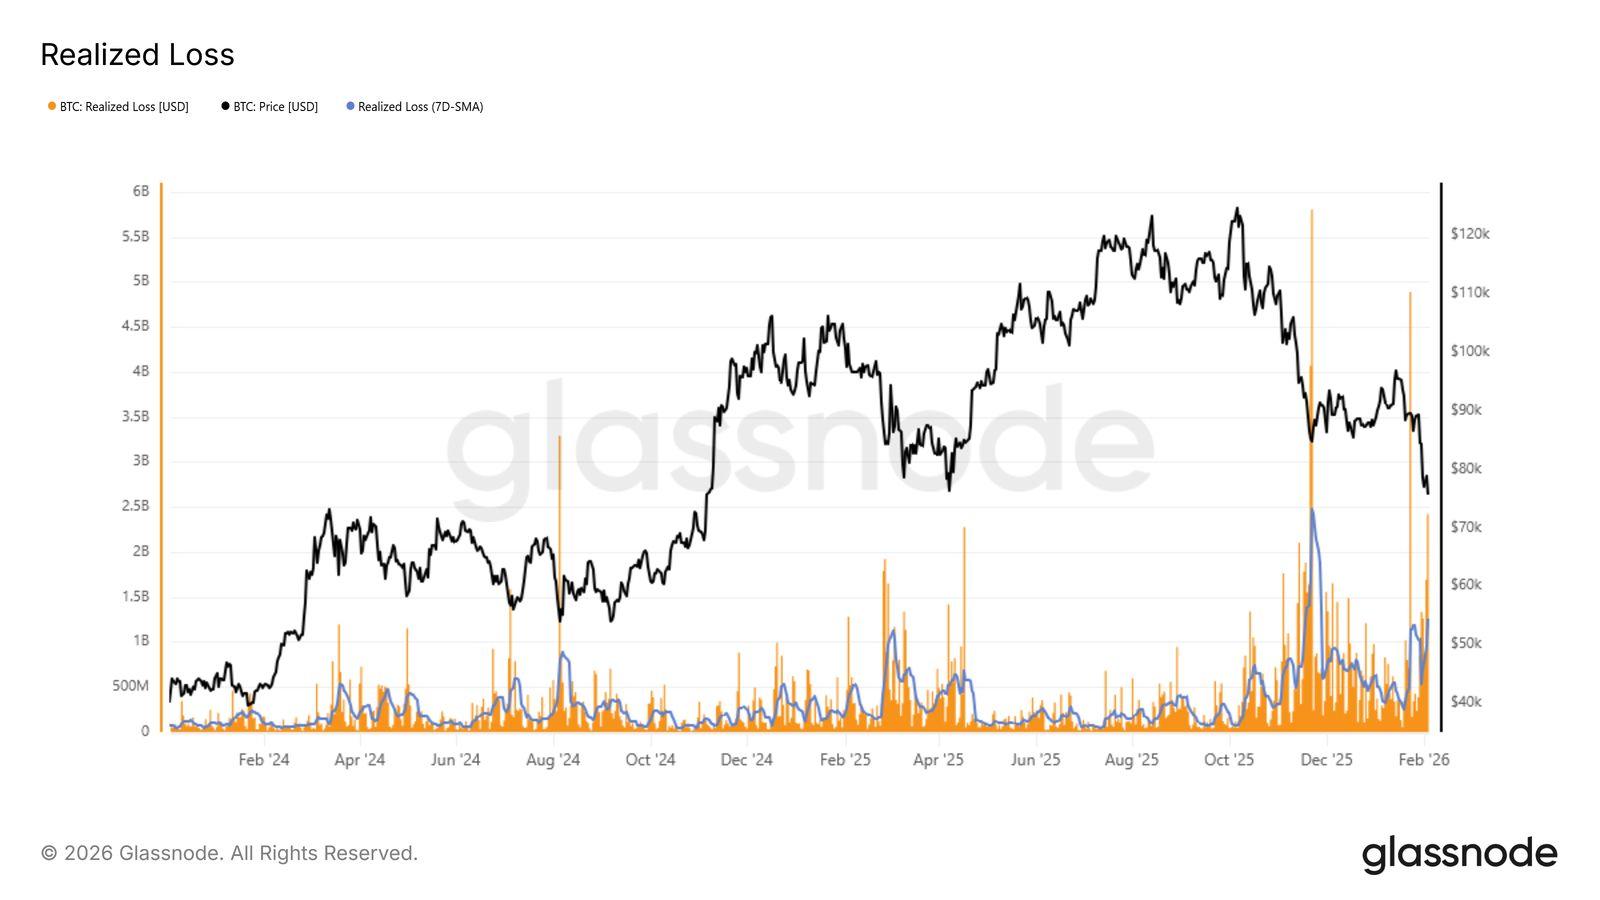
Figure3BitcoinRealisedLossBasedOnOnchainCostBasis.Source: Glassnode)
Historically,suchspikesinrealisedlossestendtooccurlateincorrectivephases. They often coincide with periods of seller exhaustion, where marginal sell pressure begins to diminish as weaker hands are flushed out. A clear analogue occurred during the rebound from the $72,000 region earlier last week, when daily realised losses briefly exceeded $2.4 billion, nearly double the prevailing 7-day average at the time. That extreme marked a short-term inflection point, afterwhichforcedsellingsubsidedandpriceactionstabilised.
While elevated realised losses do not guarantee an immediate reversal, their persistence at these levels suggests the market may be approaching a zone where downside momentum becomes increasingly constrained, setting the conditionsforconsolidationorareflexivebounce.
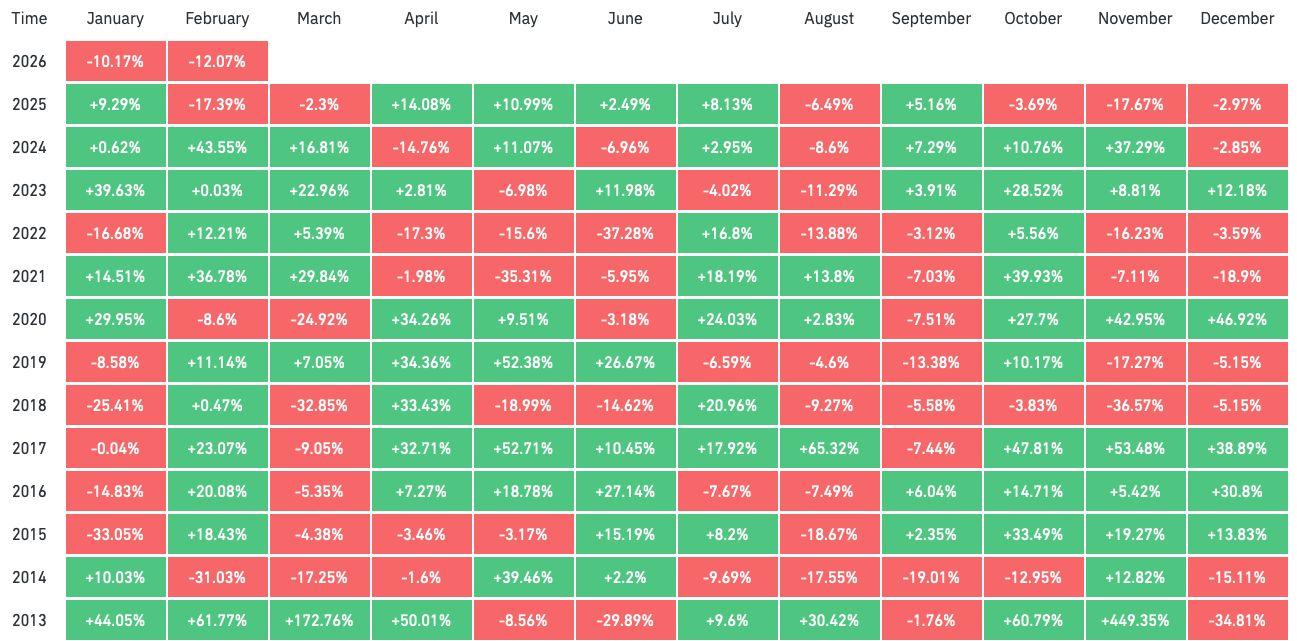
SofarthereturninFebruaryisnegative12.07percent,makingitsofartheworst February since 2014. Historically, January and February are both bullish months forBTCprovidinganaveragereturnof2.8percentand11.3percentrespectively with median returns also being positive. However, with BTC not following seasonality patterns and losing key on-chain support levels, this downtrend has furtheremphasisedtheregimechangetowardsadowntrend.
Leverage, expectations, and positioning from the late-2025 rally are still being unwound,butwithoutthekindofstructuraldamagethattypicallymarksacycle top.BTCglobalopeninteresthasgonefromadailytotalof$94.2billionatthe ATHto$45.8billioncurrently,downalmost50percent,intandemwiththeprice decline.
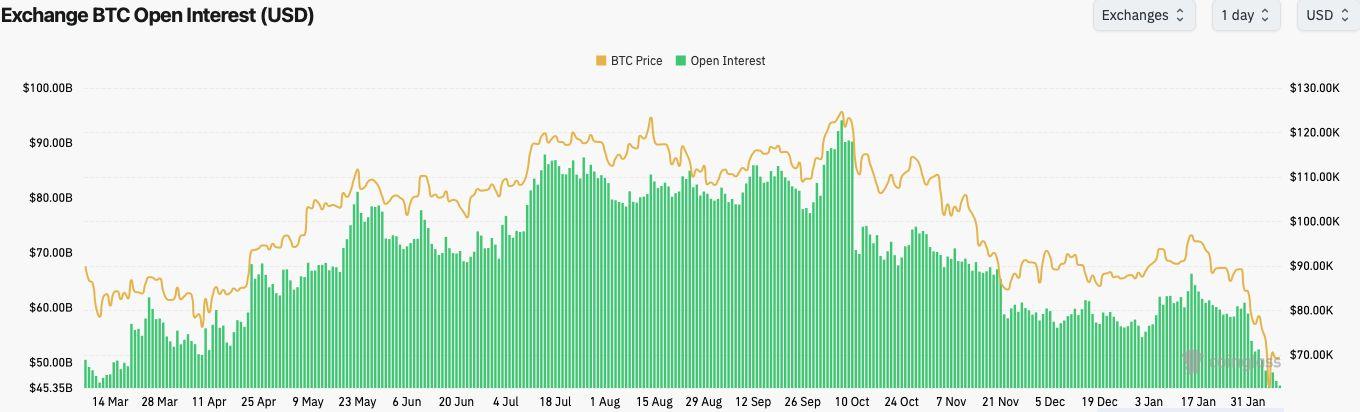

Historically,whenpriceandopeninterestdeclineinsyncwitheachother,both haveatendencytostabiliseatnewlevels.WeexpectBTCtostabilisewithinthe current $60,00074,000 range, however whether that range tends to be accumulative or redistributive for a continuation of the downtrend will be determinedbyon-chainandorderflowmetricsoverthefollowingweeks.
ThenextkeypivotsforBTCmovementsshouldbeattheTrueMarketMeannear $78,500andtheOverallRealisedPrice,whichisat$55,100currently.
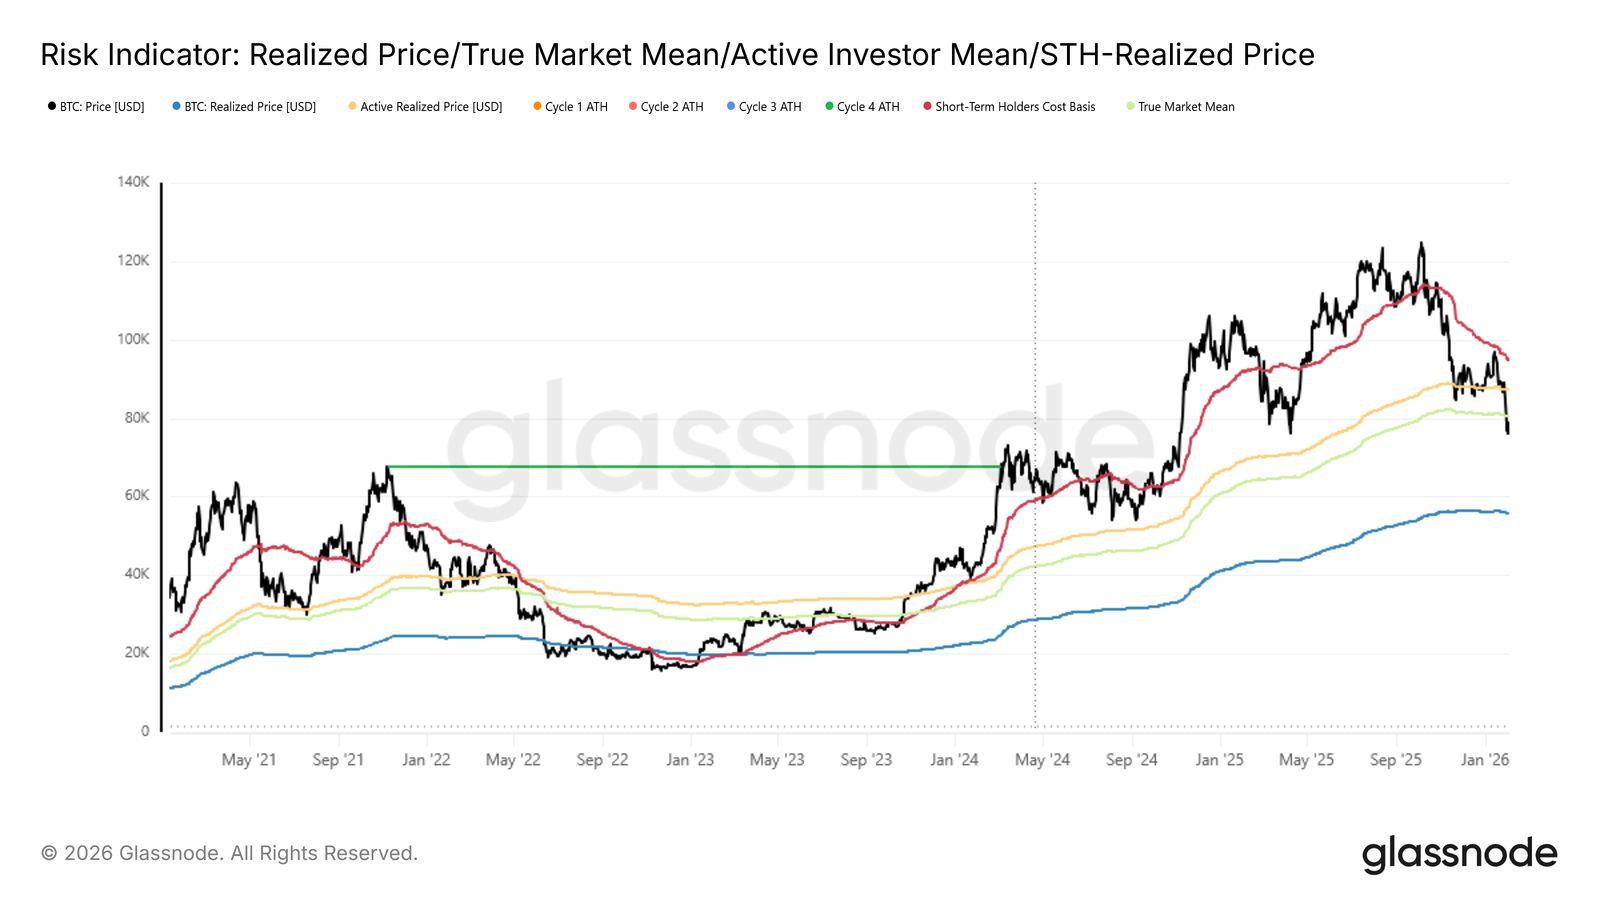
Figure6BitcoinKeyOn-chainMetricsRelevantToPrice.Source:Glassnode)


Recent US data shows that household confidence remains fragile, even as borrowing activityaccelerates.Sentimentandcreditfiguressuggestthatconsumersarecopingwith high prices and economic uncertainty by leaning more on credit, rather than feeling genuinelyoptimisticaboutfutureconditions.
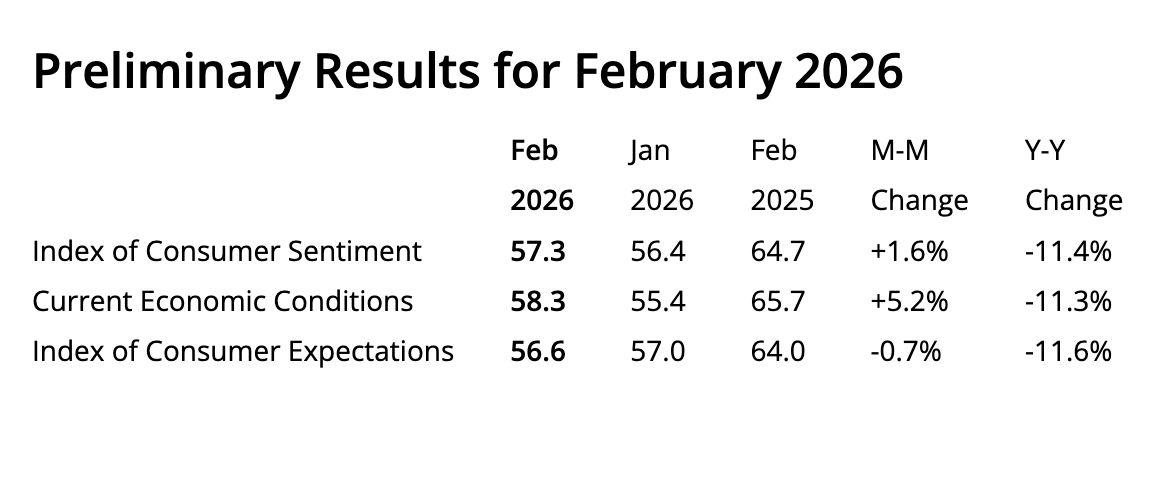
7PreliminaryResultsforConsumerSentimentforFebruary2026Universityof Michigan)
In the latest consumer sentiment survey released by the University of Michigan, overall confidence edged slightly higher to 57.3 over the two weeks ending February 2, but the change was marginal. Sentiment currently stands approximately 20 per cent below its January 2025 level. Importantly, most of the improvement came from households with significant equity exposure, while confidence among consumers without stock market investments remained weak. This suggests that recent stability in equity markets has providedlimitedandunevensupportforoverallsentiment.
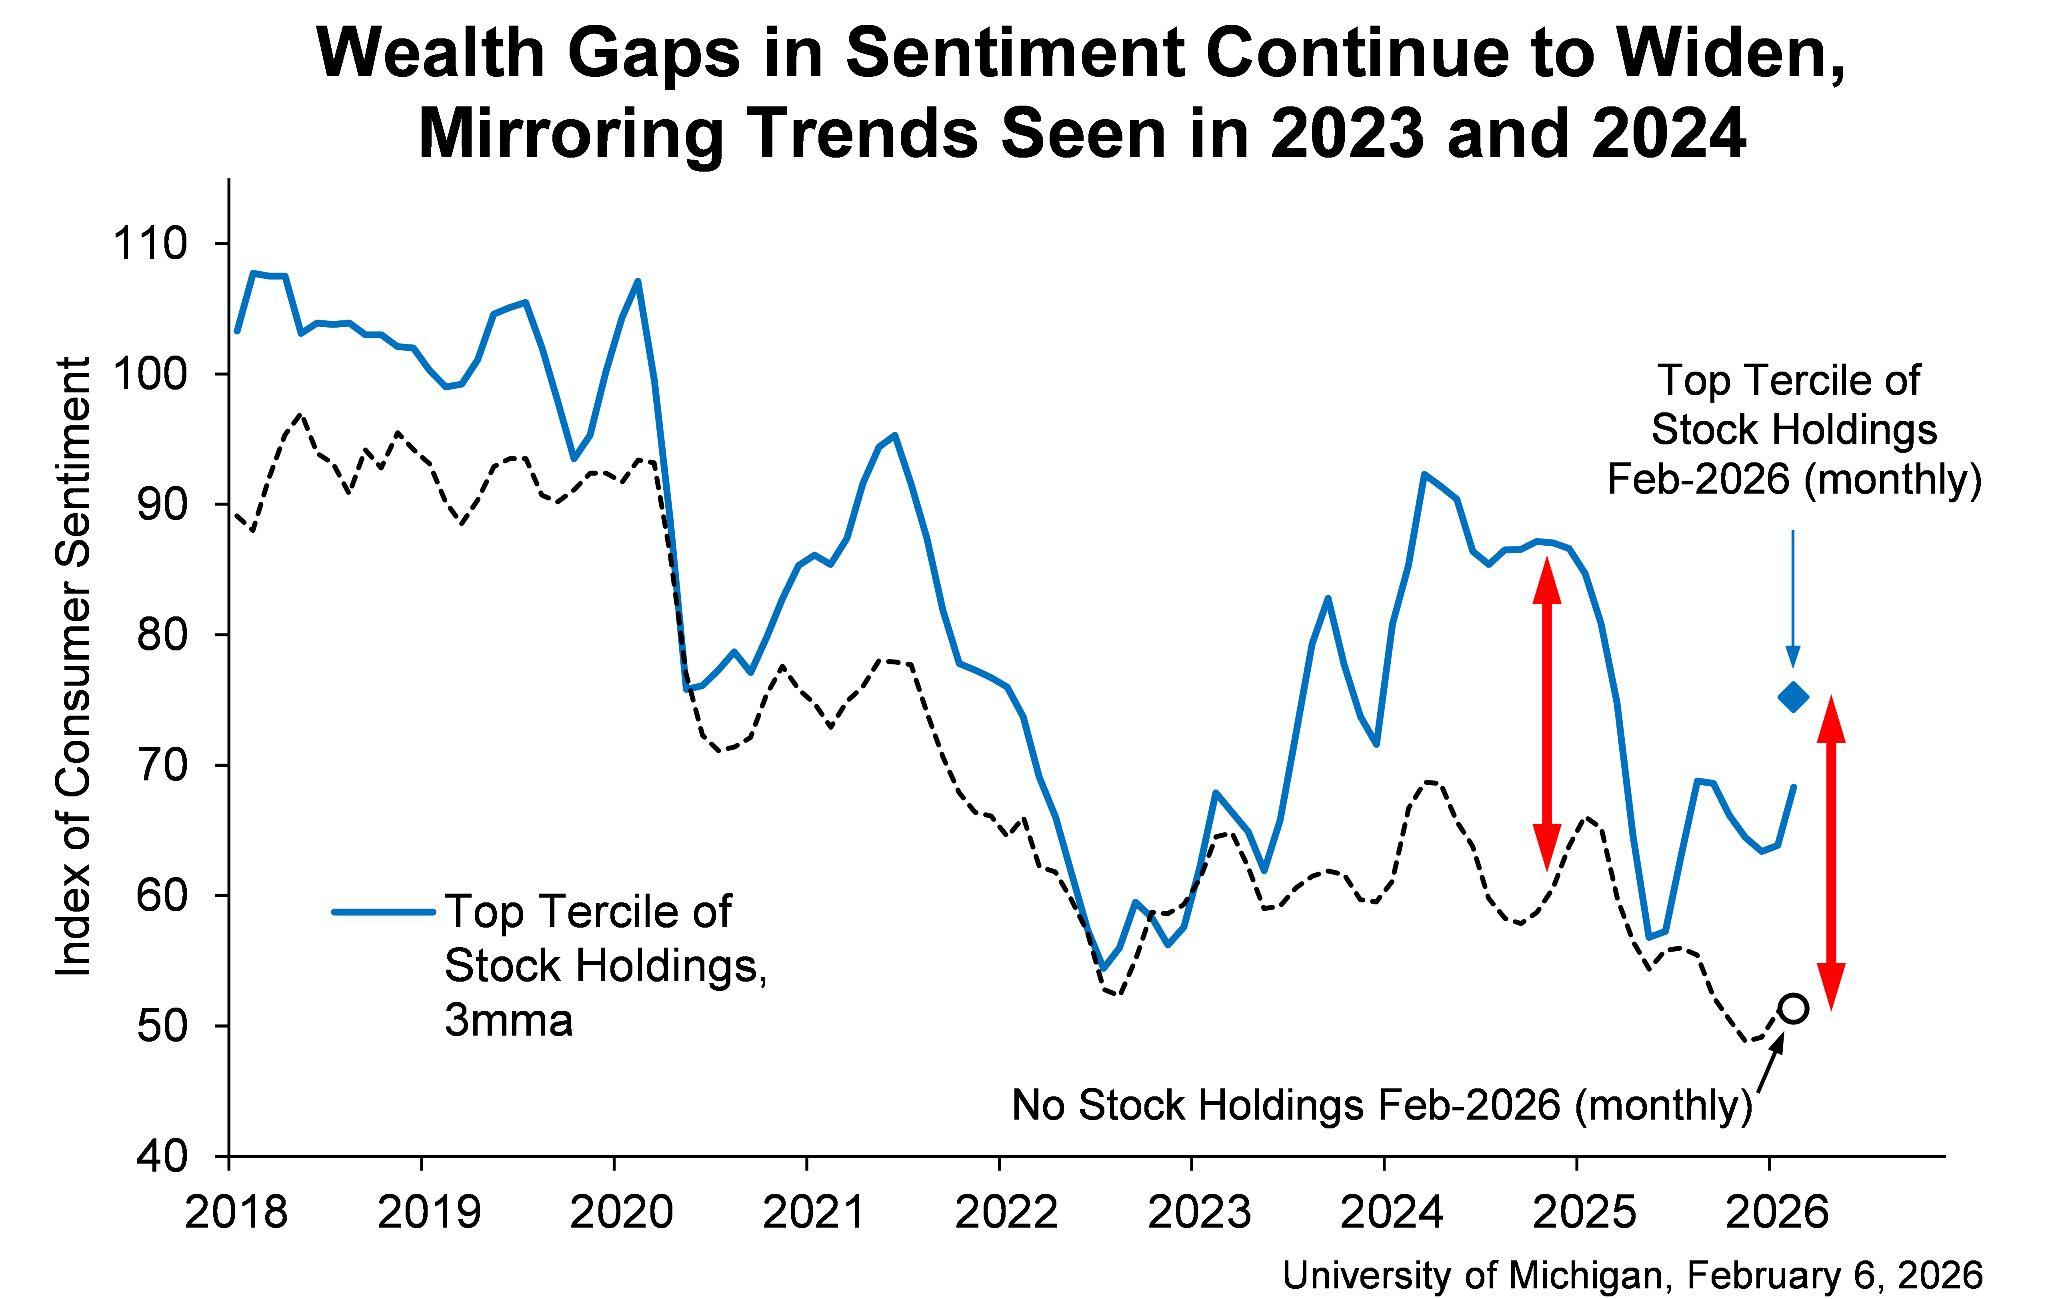
Figure8WealthGapsinSentimentContinueto Widen,MirroringTrendsin2023and2024Source: UniversityofMichigan)
Looking beyond the headline figure, households reported small improvements in their personal financial assessments and in their willingness to purchase durable goods, such as cars and appliances. However,thesegainswereoffsetby morepessimisticviewsonlong-term business conditions. Many consumers remain concerned about reduced purchasing power due to high prices and the ongoing risk of joblosses.
Inflation expectations sent mixed signals. Short-term expectations for inflation over the nextyearhasfallento3.5percent,downfrom4percentinthepreviousmonth,marking thelowestlevelsinceJanuary2025.Atthesametime,longer-terminflationexpectations rose for a second month to 3.4 percent. In simple terms, this means consumers see somenear-termreliefinpricesbutremainconcernedthatinflationcouldremainelevated overtime,whichcomplicatesthecentralbank'spolicyoutlook.
Alongside this subdued sentiment, US consumer credit data highlights a clear rise in household borrowing. Consumer credit increased by $24 billion in December 2025, far above market expectations of a $9 billion increase, bringing total outstanding credit to $5.11trillion.Revolvingcredit,whichmainlyreflectscreditcardborrowing,roseby$13.9 billion,whilenon-revolvingcredit,suchasauto,education,andpersonalloans,increased by$10.2billion.Onanannualisedbasis,totalconsumercreditgrewby5.7percent,with revolvingcreditexpandingmuchfasterat12.6percent.
Together, these developments point to an economy in which household spending is being sustained by financial accommodation rather than improving fundamentals. The acceleration in borrowing reflects an attempt to smooth consumption in the face of elevated prices and uncertain income prospects, not a renewed sense of confidence. While credit availability can delay the impact of weaker purchasing power, it does not signal underlying strength in household balance sheets. As a result, the recent improvement in sentiment appears more consistent with short-term stabilisation, rather thanadurablerecoveryinconsumerconditions.
LastweekʼslabourdatapointstoacoolingUSjobsmarket,evenasthebroader economy continues to grow. At the same time, artificial intelligence is increasingly cited in layoff decisions, although evidence suggests its direct impactonemploymentremainslimited.
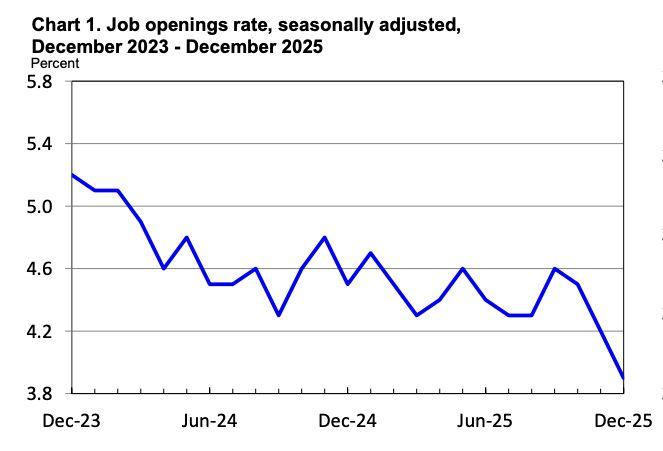
In the January employment data, job losses accelerated at the start of the year. Employersannounced108,435jobcutsinJanuary,thehighestfigureforthatmonth since 2009, according to Challenger, Gray & Christmas. At the same time, figures fromtheUSBureauofLaborStatisticsʼJobOpeningsandLaborTurnoverSummary showedjobopeningsfellinDecembertotheirlowestlevelinmorethanfiveyears, while new claims for unemployment insurance rose by 19,000 towards the end of January. These indicators suggest labour demand is weakening more than policymakerspreviouslyexpected.
Additional data reinforced this picture. Payroll processor ADP reported that privateemployersaddedjust22,000jobsinJanuary,wellbelowtheconsensus forecast of 45,000. Although the unemployment rate remains low by historical standards at 4.4 percent, hiring momentum has slowed in recent months. This mattersbecauseasofterlabourmarketcanreducewagegrowthandconsumer spending,whicharekeydriversofeconomicactivity.Despitethesesignals,the Federal Reserve recently kept interest rates unchanged, citing steady growth andnoimmediateneedtoadjustpolicy.
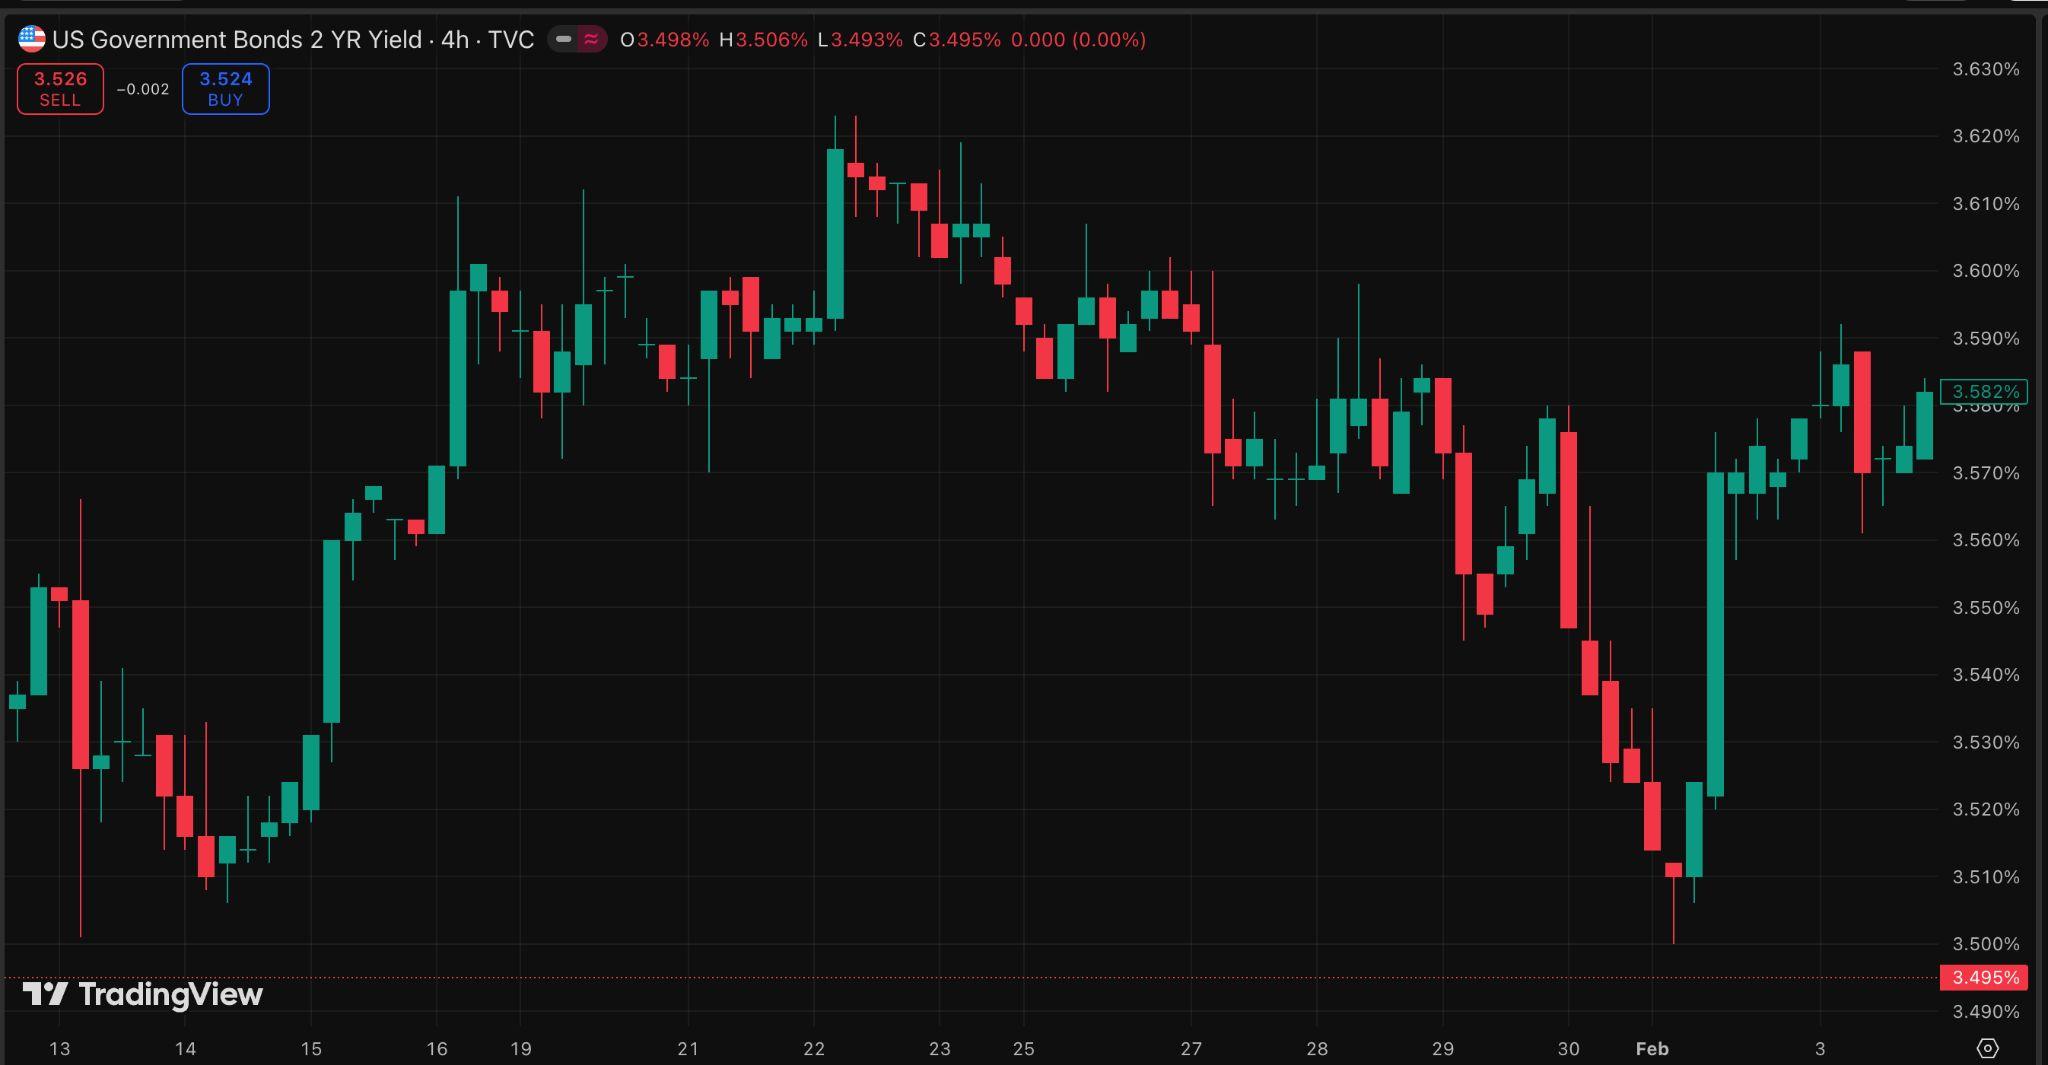
Financial markets reacted quickly to the weaker labour data. Short-term US Treasuryyields,whicharesensitivetoexpectationsaboutinterestrates,declined as investors increased bets on rate cuts later this year. This reflects a common marketdynamic:whenemploymentweakens,investorsoftenexpectcentralbanks toeasepolicytosupportgrowth.
While artificial intelligence features prominently in corporate messaging around workforce reductions, current evidence suggests it is acting more as a narrative frameworkthanasaprimarydriverofemploymentlosses. Productivitydatadoes not yet show gains consistent with large-scale labour displacement, and employment trends remain broadly aligned with pre-AI cycles. In practice, references to AI often provide a forward-looking justification for cost-cutting decisionsthataremoredirectlylinkedtosofterdemand,restructuring,andearlier overexpansion.
That said, expectations about future technology appear to be influencing decisions today. A December survey by Harvard Business Review found that 60 percent of organisations had already reduced staff in anticipation of AIʼs longer-termimpact,ratherthanitscurrentcapabilities.Inpractice,mostrecentjob cuts were concentrated in sectors such as transportation and technology, driven bycorporaterestructuringandcostcontrolratherthanautomation.
Overall, the latest data suggests the US labour market is gradually losing momentum,evenasgrowthremainsresilient.Whileartificialintelligencefeatures prominently in corporate narratives, current evidence indicates that economic conditions and strategic restructuring, not AI-driven job replacement, are the primaryforcesbehindrecentlayoffs.
Financial markets are sending mixed but important signals about the US economic outlook. Bond markets are pointing to changing policy expectations, influenced by a housing sector that is moving through a slow and uneven adjustment.Current pricing suggests that growth risks are easing,but demand acrossinterest-sensitivesectorsremainscautious.
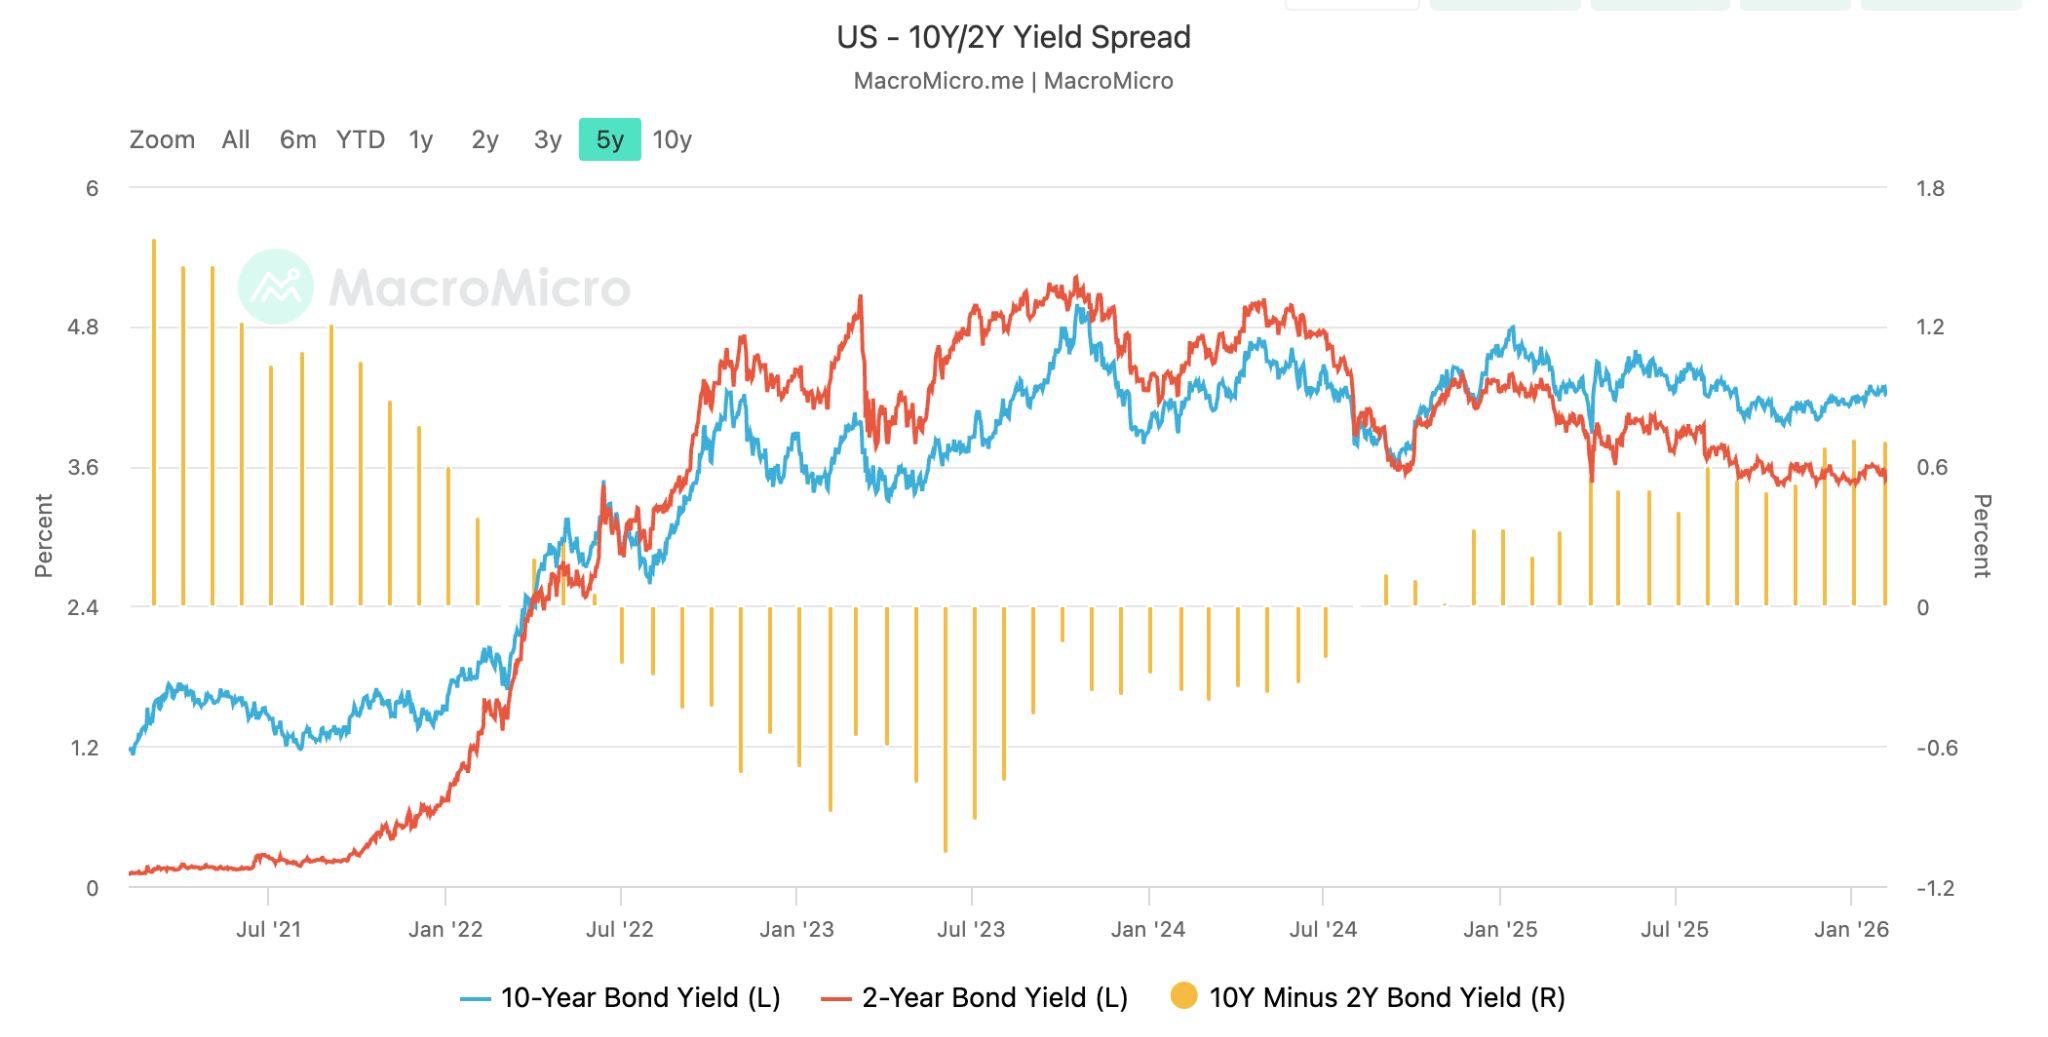
In the bond market, the US Treasury yield curve has turned positive after a long period of inversion. The spread between two-year and ten-year Treasury yields is now the widest since January 2022. In simple terms, a yield curve compares short-term and long-term interest rates. When short-term rates are higher than long-term rates, the curve is “invertedˮ, which investors often see as a warning of slower growth ahead. The recent steepening shows the opposite: pressure on short-termyieldsiseasingasmarketsexpectlessrestrictivemonetarypolicy,while long-termyieldsremainsupportedbysteadygrowthandinflationexpectations.
WhilethisisaclearreversalfromtheinversionseenduringtheFederalReserveʼs aggressivetighteningcyclein2022and2023,itshouldnotbereadasasignalof accelerating economic momentum. Two-year yields tend to reflect expectations fornear-termpolicydecisions,whileten-yearyieldscapturelonger-termviewson growthandinflation.
The widening gap suggests that investors see a reduced likelihood of further rateincreasesaslabourmarketconditionssoften,ratherthananimprovementin underlyingdemand.Whileequitymarketsremainfocusedontechnologyshares and artificial intelligence-related investment themes, the Treasury curve suggests that fixed-income markets are reassessing the broader outlook with greater emphasis on slowing labour momentum and policy risk rather than renewedgrowth.
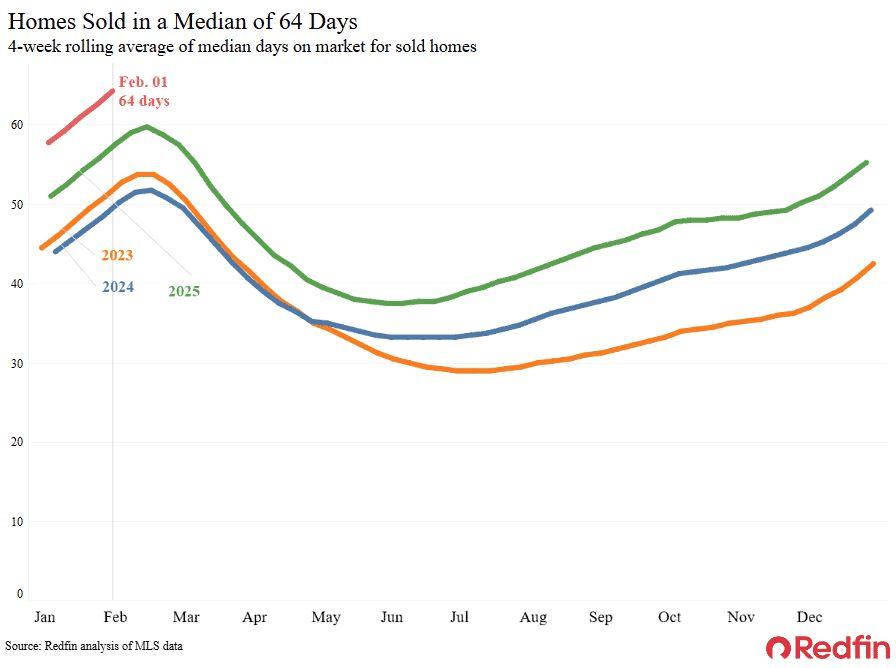
Atthesametime,theUShousingmarketisadjustingtohigherborrowingcosts and economic uncertainty. New data from Redfin shows that homes sold in January spent an average of 64 days on the market, the longest period in six years.Pendinghomesalesfell3.3percentyearonyear,continuingatrendseen in recent months. Slower activity reflects caution among buyers, who remain sensitivetohighpricesandjobmarketuncertainty.
Affordability pressures have eased gradually, but from historically high levels. The average mortgage rate has declined to around 6.1 percent, close to a three-year low,yetstillwellabovepandemic-eranorms.Themedianhomesalepricereached $379,950, up 1.2 percent from a year earlier, while the median monthly mortgage payment fell to $2,559, down nearly five percent year on year. Wage growth of roughly four percent has helped offset some affordability challenges, but buyers remainselectiveanddeliberateintheirpurchasingdecisions.
Supply conditions are also shifting. New home listings increased 1.1 percent year on year, marking the third consecutive weekly rise following two months of declines. More sellers appear to be accepting that ultra-low mortgage rates are unlikely to return in the near term, contributing to rising inventory levels and greater negotiating leverage for buyers. Redfin agents expect this gradual rebalancingtosupportamorestablehousingmarketin2026,ratherthanarapid reboundinactivity.
It is important to distinguish between the forward-looking nature of financial marketsandthemoregradualadjustmentofhouseholdsandfirms.Bondmarkets are pricing future policy easing based on expectations of softer employment conditions, but households continue to respond to present realities of income uncertainty and elevated living costs. The housing market reflects this lag, with buyers remaining cautious despite easing financial conditions. Together, these signals point to an economy that is stabilising unevenly, where expectations are improvingfasterthanunderlyingbehaviour.


Chinaʼs financial authorities have reaffirmed that all crypto-related activity remains illegal on the mainland, while expanding enforcement to cover real-worldassettokenizationandyuan-linkedoffshorestablecoins.
In a joint notice on February 6, the Peopleʼs Bank of China and several state regulators said speculative activity involving virtual currencies and tokenized assetshasdisruptedfinancialorder.Regulatorsreiteratedthatcryptocurrencies and stablecoins do not have legal status as currency, and cannot circulate as money.
The notice explicitly bans the issuance of renminbi-pegged stablecoins without regulatoryapproval,includingthoseissuedoffshorebydomesticentitiesortheir controlled foreign affiliates. Authorities also clarified that real-world asset tokenization, which uses cryptography and distributed ledger technology to tokenize ownership or income rights, is prohibited unless conducted on approvedfinancialinfrastructure.
Thedirectiveextendsoversighttooverseasstructures,applying“samebusiness, same risk, same rulesˮ supervision to tokenisation activities linked to domestic assetsorrights,regardlessofwheretheyareissued.

South Koreaʼs financial regulator is tightening its grip on the cryptocurrency sector, signalling stricter oversight and tougher penalties aimed at protecting marketintegrityandcustomers.
TheFinancialSupervisoryServiceannouncedtoday,February9,thatitsannual policy agenda will prioritise supervision of high-risk behaviour in the crypto market, alongside stronger enforcement against financial institutions that suffer IT-relatedfailures.TheupdatewasreportedbyYonhapNewsAgency.
Under the new framework, the regulator plans targeted investigations into practices that disrupt fair trading. These include price manipulation by large holders, artificial price increases in tokens with restricted deposits or withdrawals, rapid price distortions driven by automated trading systems, and thespreadofmisleadinginformationthroughsocialmediachannels.
ThemovefollowsarecentoperationalfailureatBithumb,whereaninternalerror led to the unintended distribution of a large volume of bitcoin during a promotional event. While the exchange reported that nearly all funds were recovered, the incident underscored operational and governance risks within centralisedtradingplatforms.
South Koreaʼs stance reinforces a broader global shift towards stricter market conduct and operational standards for crypto platforms. For the industry, this increases compliance pressure but also supports long-term credibility by reducingmanipulationrisksandstrengtheningcustomerprotection.