THE LATEST ON REGIONAL COST TRENDS
COST INDEX Q3 2025
KURT’S KEY UPDATES
In Q3 2025, U.S. construction saw modest overall growth, but activity was driven heavily by advanced manufacturing and data centers, which surged amid AI demand and CHIPS Act incentives. Major multibillion-dollar campuses underscored the sector’s momentum, even as traditional commercial and residential construction remained soft. Supply chains stayed mostly stable, though tariffs on metals and long lead-times for electrical and HVAC equipment re-introduced mild volatility. Contractors increasingly turned to early procurement and domestic sourcing to offset risks, signaling a cautious but strategically adaptive construction environment heading into late 2025.
Kurt Jaeger
Executive Vice President, Preconstruction jaegerk@claycorp.com 314.595.6373
ENR CONSTRUCTION COST INDEX
Annual Construction Increase of 3.14%
The Clayco Cost Index Q3 2025 provides an overview of regional construction cost trends, highlighting a moderate annual increase of 3.14%. The report includes detailed insights on material and construction producer price indexes, delivery lead times, and cityspecific cost comparisons across various regions. We would like to extend our sincere thanks to our vendors and trade partners for their invaluable contributions in providing the data and insights that helped shape the Clayco Cost Index Q3 2025.
Private Construction Spending
In July 2025, construction spending decreased 0.1% from June and fell 2.8% yearover-year. For the first seven months, spending declined by 2.2% compared to the same period in 2024.
PRODUCER
The material indexes are a quarterly compilation from our suppliers, trade partners, self-perform entities and nationally published commodity indexes. The material cost consist of the following: Concrete, Aggregates, Carbon Steel Pipe, Stainless Steel Pipe, Rebar, Wide Flange Steel, 5/8” Drywall, Copper, Hot Milled Sheet Steel, Lumber, Crude Oil and Hot Liquid Asphalt.
MIDWEST
NORTHEAST
WEST
SOUTHEAST
National City Cost Index, reference RSMeans 2025 Third Quarter. Shown are six of the main markets in each of the four regions. These are weighted averages, leveraging material and labor across all scopes of work. This chart compares city to city cost based on a national average of 1.
NATIONAL AVERAGE = 1.0 National City Cost Index, reference RSMeans 2025 Third Quarter. Shown are six of the main markets in each of the four regions. These are weighted averages, leveraging material and labor across all scopes of work. This chart compares city to city cost based on a national average of 1.
Northeast
Southeast
These numbers constitute both union & non-union composite rates, as well as year over year changes for the following trades: Concrete Mason, Carpenter, Electrician, Iron Worker, Laborer and Plumber. Midwest
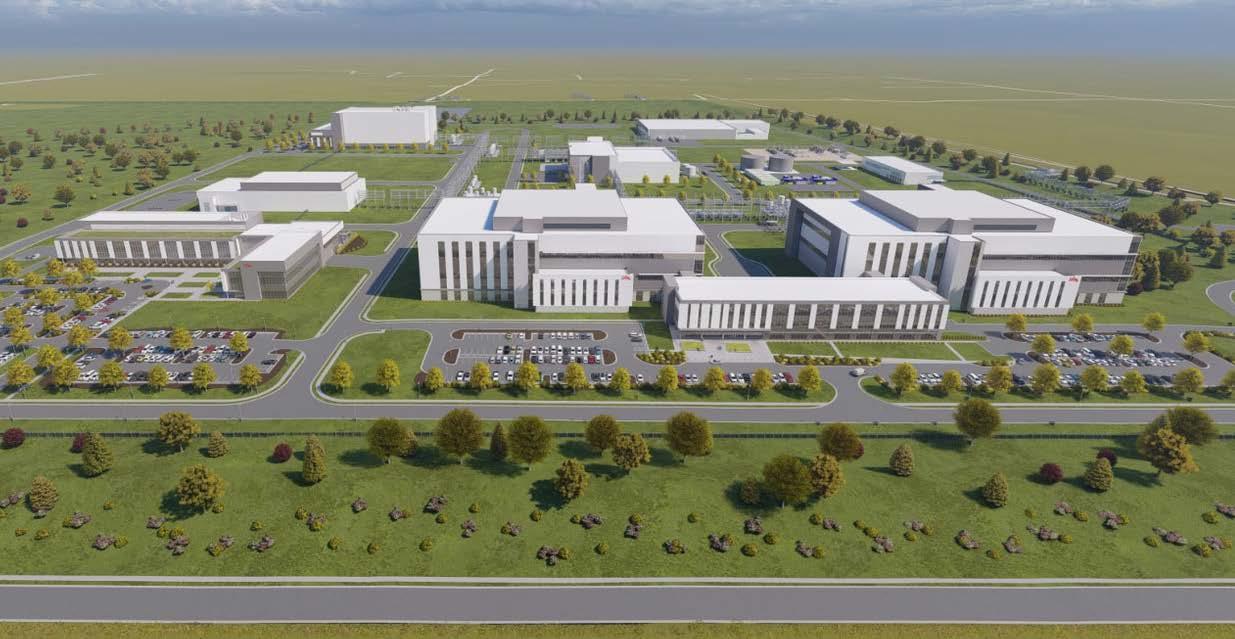
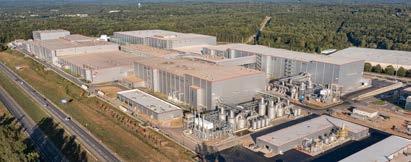
Eli Lilly Lebanon Plant 1 (API) Program Lebanon, IN
Part of the LEAP Lebanon Innovation and Research District in Boone County, Indiana, the API Peptide Headblock is one of the first buildings projected to be completed on the 600-acre greenfield campus. Helping to expand advanced manufacturing capability for API across three platforms, these facilities incorporate highly automated equipment and processes utilizing state-of-the-art design.
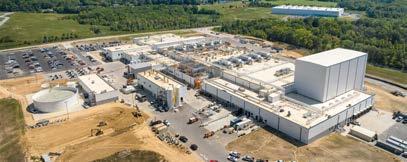
Related Digital Cheyenne Data Center Campus Cheyenne, WY
The campus is being developed on 115 acres, with the first 36-acre parcel hosting a 184,000 SF facility delivering 88 MW of critical IT capacity. Long-term plans call for expansion up to 302 MW of IT load across multiple phases.