THE LATEST ON REGIONAL COST TRENDS
COST INDEX Q2 2025
The second quarter of 2025 was characterized by continued variability in material costs and availability, even as overall supply chain reliability improved across most product categories. Electrical and mechanical equipment remain persistent bottlenecks, with demand from missioncritical data center projects sustaining pressure on lead times and limiting system availability. At the same time, ongoing discussions around tariff adjustments are adding uncertainty, with the potential to further influence pricing and elevate procurement risks for imported goods and specialized components.
KURT’S KEY UPDATES
Kurt Jaeger
Executive Vice President, Preconstruction
jaegerk@claycorp.com 314.595.6373
ENR CONSTRUCTION COST INDEX
Annual Construction Increase of 2.02%
The Clayco Cost Index Q2 2025 provides an overview of regional construction cost trends, highlighting a moderate annual increase of 2.02%. The report includes detailed insights on material and construction producer price indexes, delivery lead times, and cityspecific cost comparisons across various regions. We would like to extend our sincere thanks to our vendors and trade partners for their invaluable contributions in providing the data and insights that helped shape the Clayco Cost Index Q2 2025.
Private Construction Spending
In June 2025, construction spending decreased 0.4% from May and fell 2.9% yearover-year. For the first six months, spending declined by 2.2% compared to the same period in 2024.
PRODUCER PRICE
The material indexes are a quarterly compilation from our suppliers, trade partners, self-perform entities and nationally published commodity indexes. The material cost consist of the following: Concrete, Aggregates, Carbon Steel Pipe, Stainless Steel Pipe, Rebar, Wide Flange Steel, 5/8” Drywall, Copper, Hot Milled Sheet Steel, Lumber, Crude Oil and Hot Liquid Asphalt.
MIDWEST
NORTHEAST
WEST
SOUTHEAST
National City Cost Index, reference RSMeans 2025 Second Quarter. Shown are six of the main markets in each of the four regions. These are weighted averages, leveraging material and labor across all scopes of work. This chart compares city to city cost based on a national average of 1.
NATIONAL AVERAGE = 1.0 National City Cost Index, reference RSMeans 2025 Second Quarter. Shown are six of the main markets in each of the four regions. These are weighted averages, leveraging material and labor across all scopes of work. This chart compares city to city cost based on a national average of 1.
Northeast
Southeast
These numbers constitute both union & non-union composite rates, as well as year over year changes for the following trades: Concrete Mason, Carpenter, Electrician, Iron Worker, Laborer and Plumber. Midwest
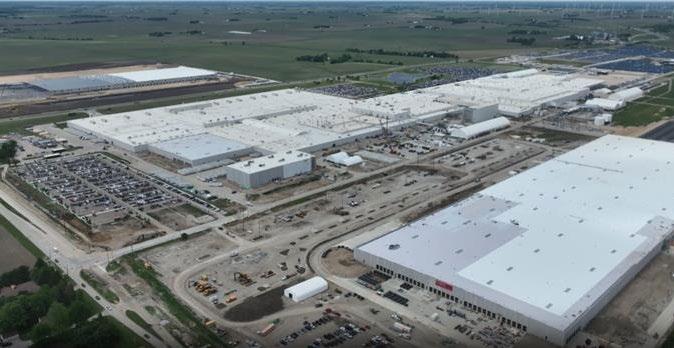
Rivian R2 Plant Expansion Normal, IL
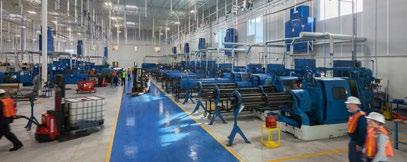
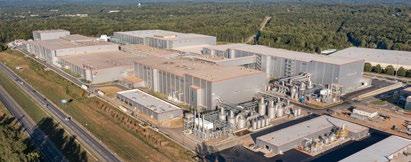
The Rivian NN2 Project is a major expansion of the company’s Normal, Illinois campus, combining new construction, facility growth, and renovations to support production of the R2 vehicle and future models. The plan includes a 1.1 million-square-foot facility for Body Shop, General Assembly, and End-of-Line operations, along with reconfigured battery and drive unit areas and new buildings for Battery Pack Assembly and PTED painting.
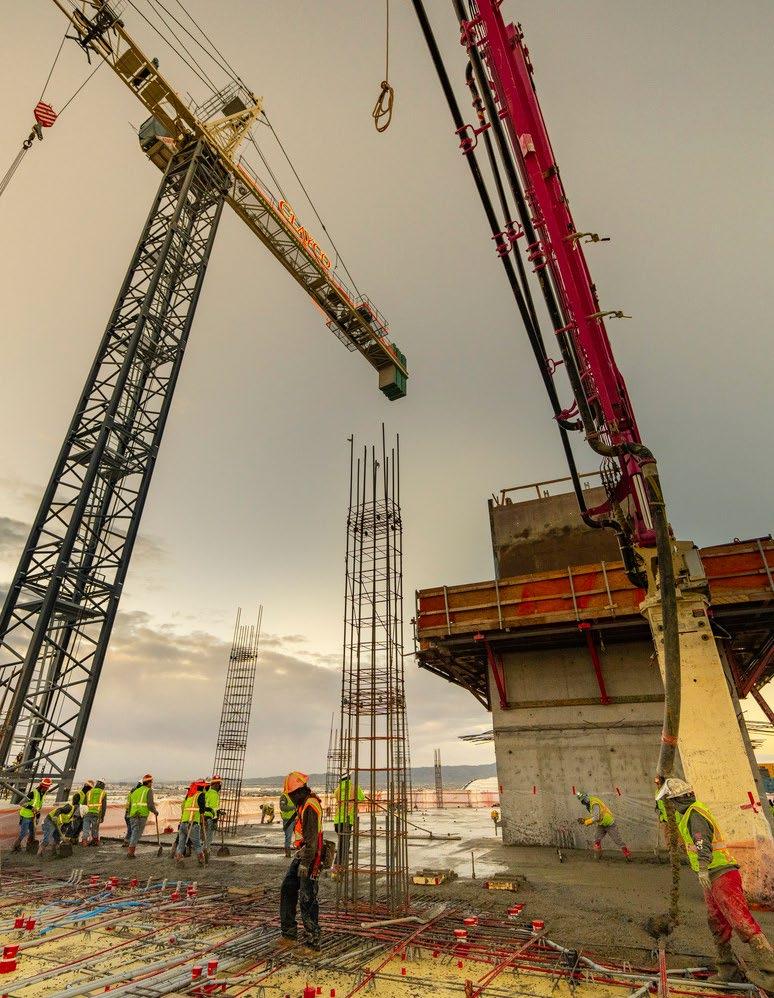
Kali Hotel Inglewood, CA
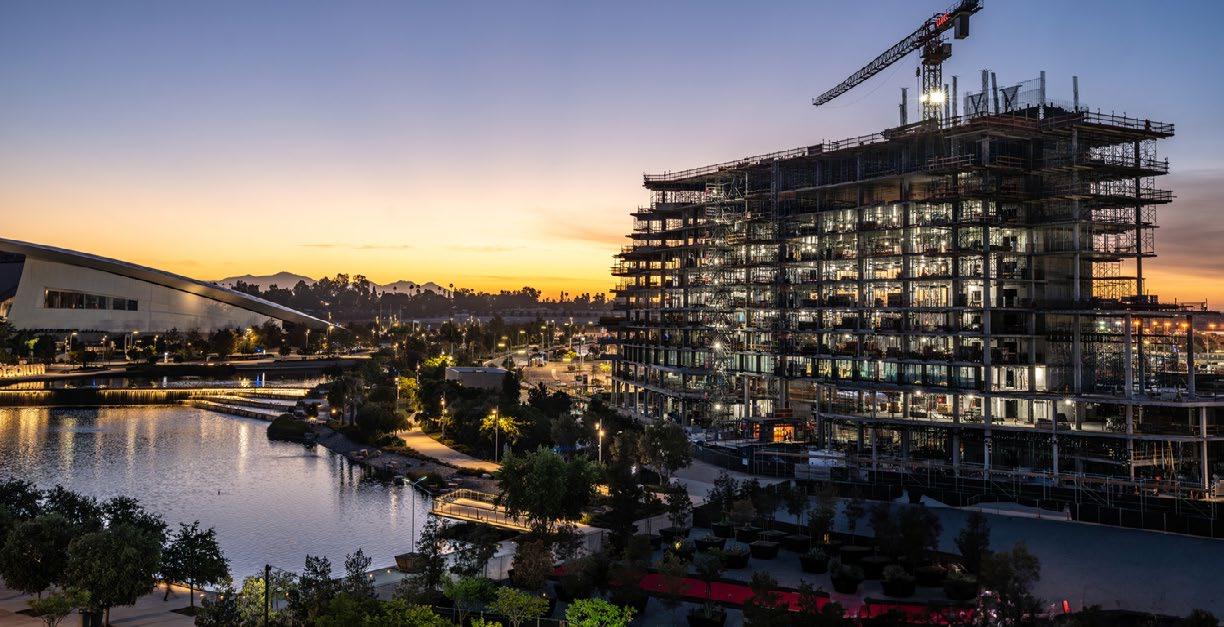
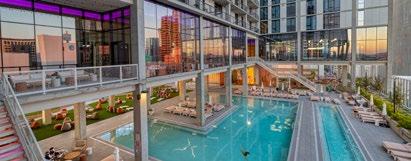
The Kali Hotel will be a 485,700-square-foot luxury destination in Hollywood Park, overlooking Lake Park with views of SoFi Stadium and nearby venues. Built by Clayco and designed by LJC, the hotel combines Los Angeles’ cultural heritage with modern design, creating a striking silhouette of cascading suites and an open base that serves as a gateway to the district. Guests will enjoy luxury amenities such as a spa, pool deck, rooftop lounge, and a six-story parking garage, all within walking distance of major attractions.
