THE LATEST ON REGIONAL COST TRENDS
COST INDEX Q1 2025
KURT’S KEY UPDATES
The first quarter of 2025 remained marked by fluctuations in both material costs and availability. Fortunately, the overall reliability of the supply chain has been improving for most products and materials. However, electrical and mechanical items remain an exception, as previously noted. Sustained demand driven by mission-critical data center projects is expected to prolong extended lead times and limited availability for these systems. Additionally, ongoing uncertainty surrounding potential tariff adjustments has contributed to pricing instability and increased procurement risk, particularly for imported materials and specialized components.
Kurt Jaeger
Executive Vice President, Preconstruction jaegerk@claycorp.com 314.595.6373
ENR CONSTRUCTION COST INDEX
Annual Construction Increase of 1.93%
The Clayco Cost Index Q1 2025 provides an overview of regional construction cost trends, highlighting a moderate annual increase of 1.93%. The report includes detailed insights on material and construction producer price indexes, delivery lead times, and cityspecific cost comparisons across various regions. We would like to extend our sincere thanks to our vendors and trade partners for their invaluable contributions in providing the data and insights that helped shape the Clayco Cost Index Q1 2025.
Private Construction Spending
In March 2025, construction spending decreased 0.5% from February but rose 2.8% year-over-year. For the first three months, spending increased by 2.9% compared to the same period in 2024.
The material indexes are a quarterly compilation from our suppliers, trade partners, self-perform entities and nationally published commodity indexes. The material cost consist of the following: Concrete, Aggregates, Carbon Steel Pipe, Stainless Steel Pipe, Rebar, Wide Flange Steel, 5/8” Drywall, Copper, Hot Milled Sheet Steel, Lumber, Crude Oil and Hot Liquid Asphalt.
MIDWEST
NORTHEAST
WEST
SOUTHEAST
National City Cost Index, reference RSMeans 2025 First Quarter. Shown are six of the main markets in each of the four regions. These are weighted averages, leveraging material and labor across all scopes of work. This chart compares city to city cost based on a national average of 1.
NATIONAL AVERAGE = 1.0 National City Cost Index, reference RSMeans 2025 First Quarter. Shown are six of the main markets in each of the four regions. These are weighted averages, leveraging material and labor across all scopes of work. This chart compares city to city cost based on a national average of 1.
Northeast
Southeast
West
These numbers constitute both union & non-union composite rates, as well as year over year changes for the following trades: Concrete Mason, Carpenter, Electrician, Iron Worker, Laborer and Plumber. Midwest
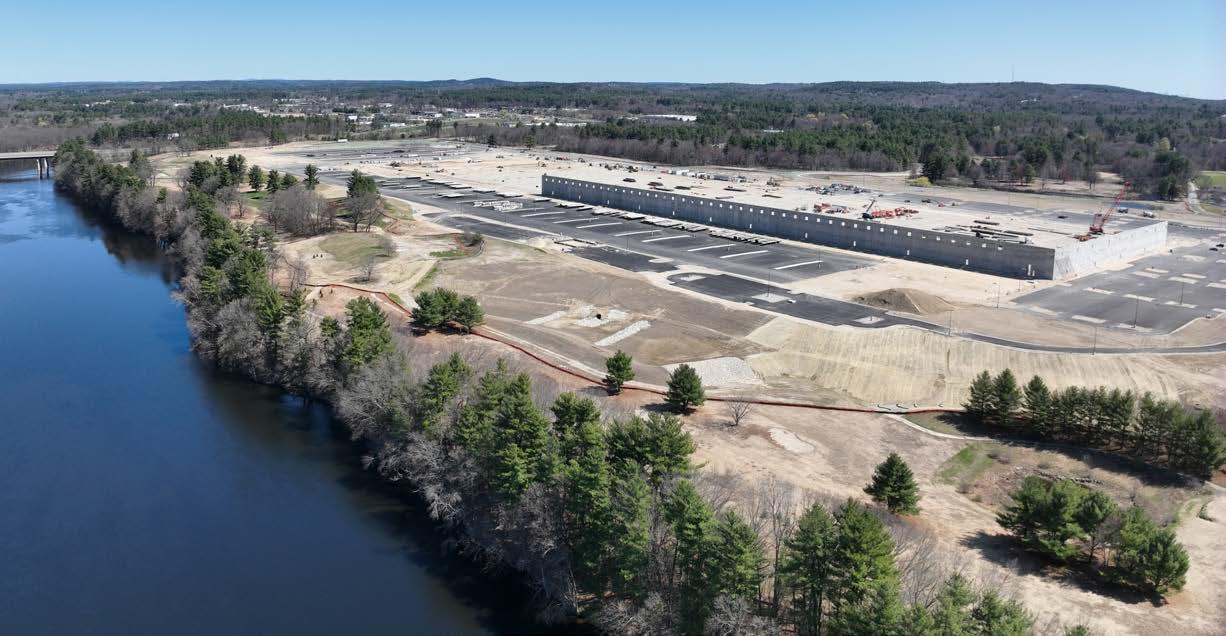
Target Distribution Center Hudson, NH
This project encompasses the development of a state-of-the-art regional distribution center for Target, located on a 400-acre site in Hudson, New Hampshire. The facility will span approximately 1.4 million square feet and serve as a critical logistics hub supporting the retail giant’s Northeast operations.
Shorehaven Tempe, AZ
Shorehaven at Tempe Town Lake will aim to breathe new life into the Phoenix Valley. This project will be 1.3 million square feet and will include three towers, 724 units, three levels of subterranean parking and podium amenities and retail. Green space and lush gardens will combine with the desert landscape surrounded by residential towers, unparalleled views, and a robust lifestyle amenities.
