www.ag.tools info@ag.tools April 2023
and Honeydews 2022 U.S
Cantaloups
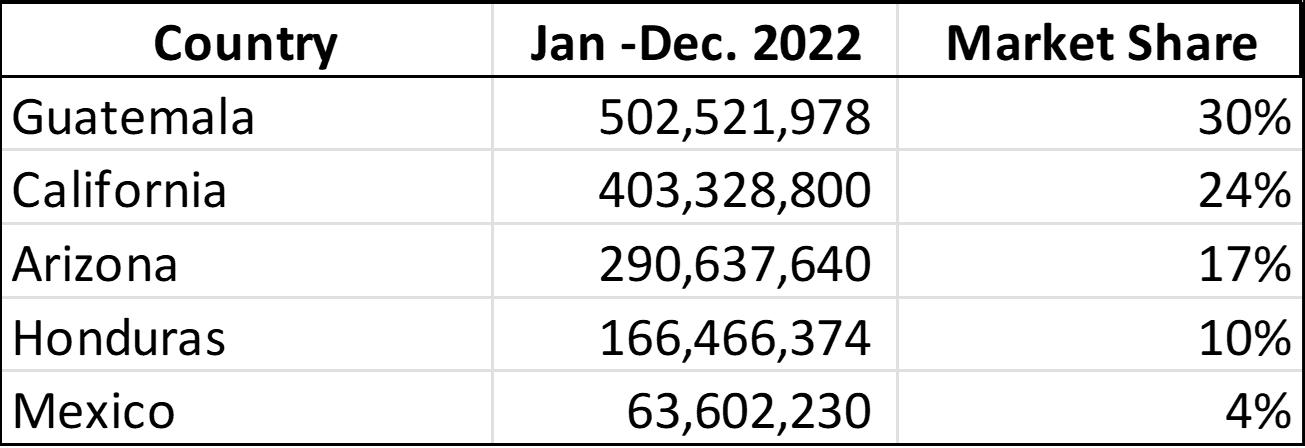
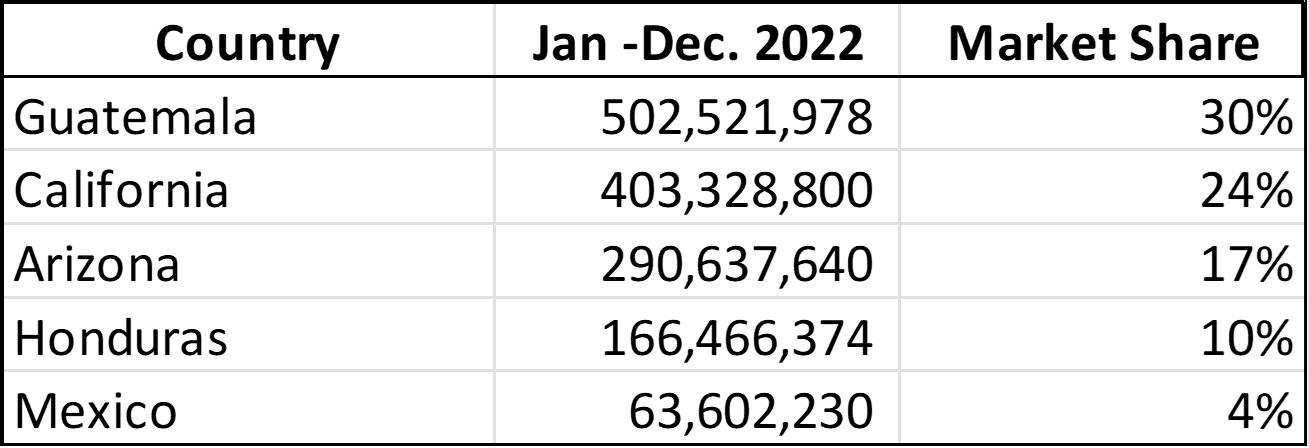
volume for Melons by Region and Market Share


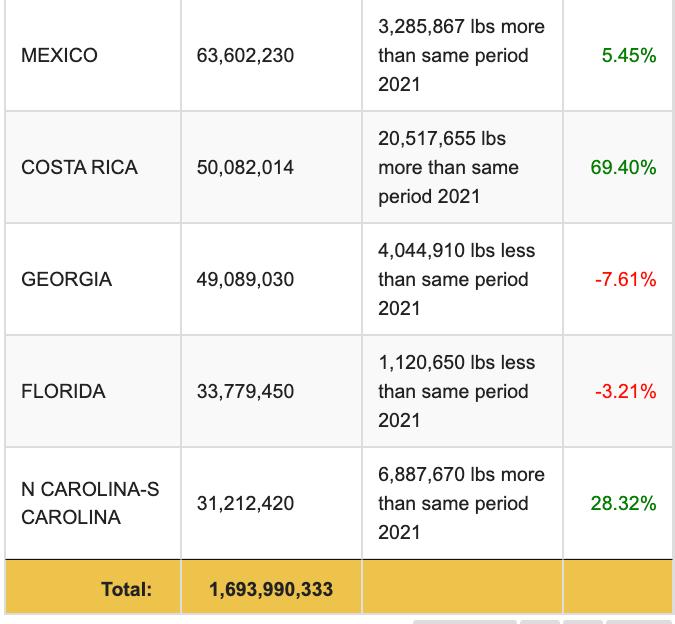
Total U.S. cantaloupe volume for 2022 was 1.7B lbs. resulting in a 9% YoY volume increase. Since 2016 volume has gradually declined YoY resulting in a 34% decline in volume between 2016 and 2023. Volume in 2016 was 2.5B lbs. Guatemala has been the #1 supplier of cantaloupes to the U.S. with a 20% YoY volume increase and a 30% market share. California is #2 in market share at 28%. The two regions supply more than 50% of the U.S. volume.
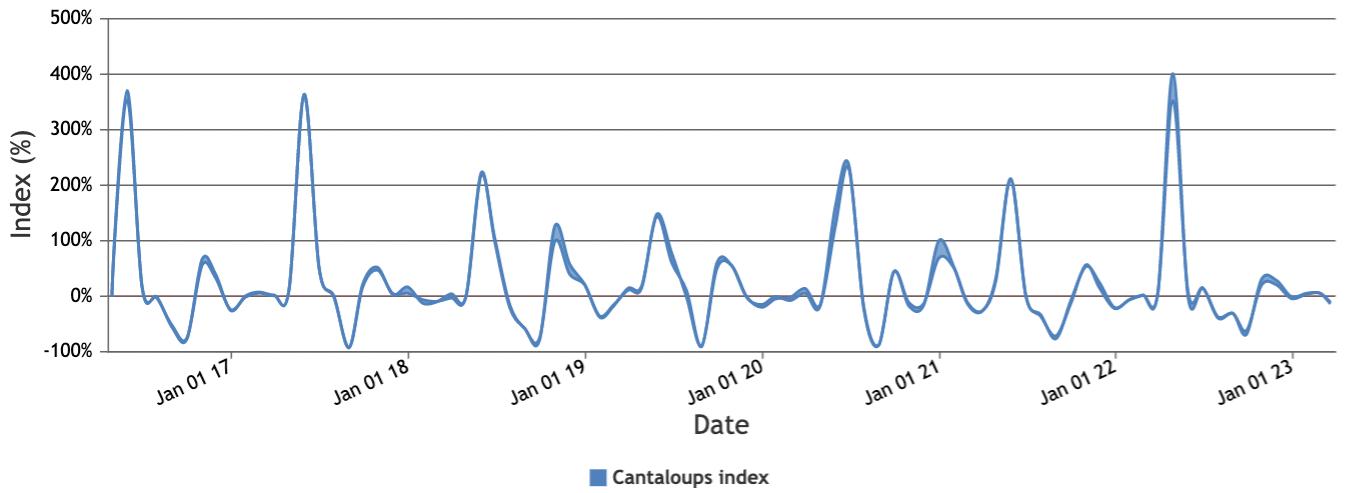
In 2022 the top five supplying regions all showed YoY volume growth. The seven-year rate of FOB change shows the price change as a percentage with three points surpassing 300%, once in 2017 and 2018 followed by slight fluctuations and another spike at the end of December 2022 hitting 400%.
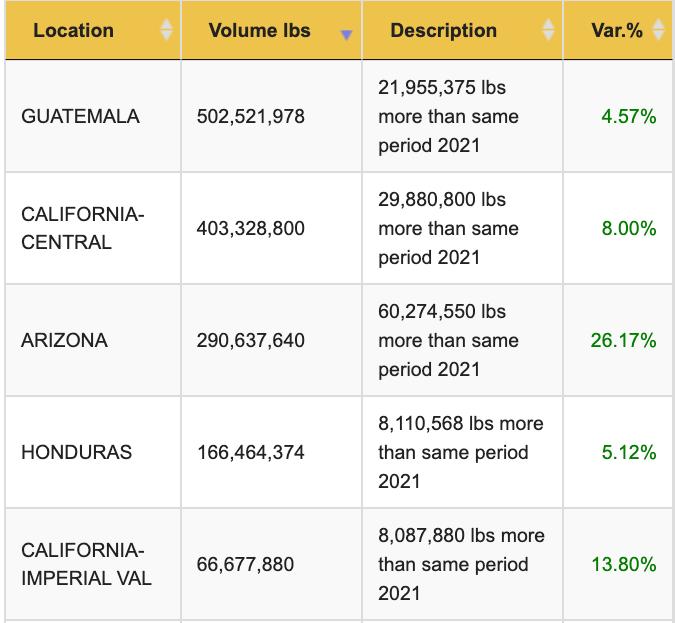


Five-year volume trends per supplying regions – Guatemala continues to perform strongly bouncing back from a 12% decrease in volume between 2020 and 2021 to a 20% gain in volume in 2022. The other supplying regions have had single-digit increases with the exception of California with a YoY increase of 10%
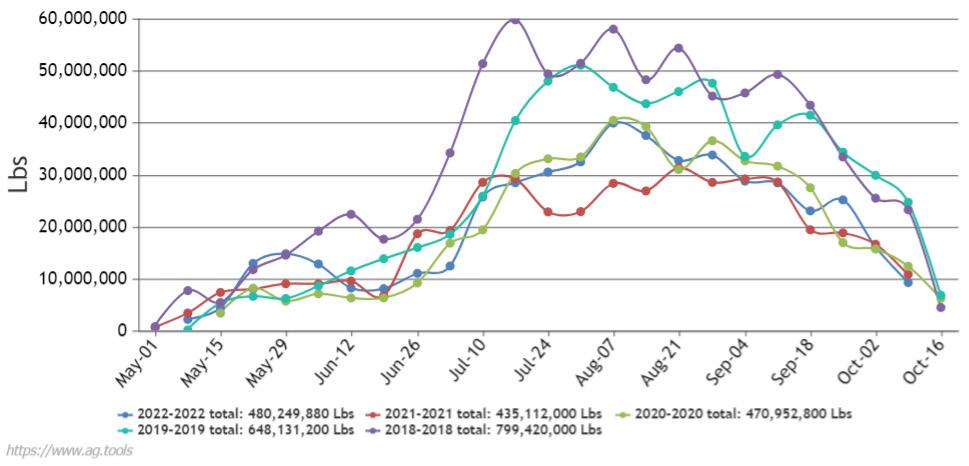
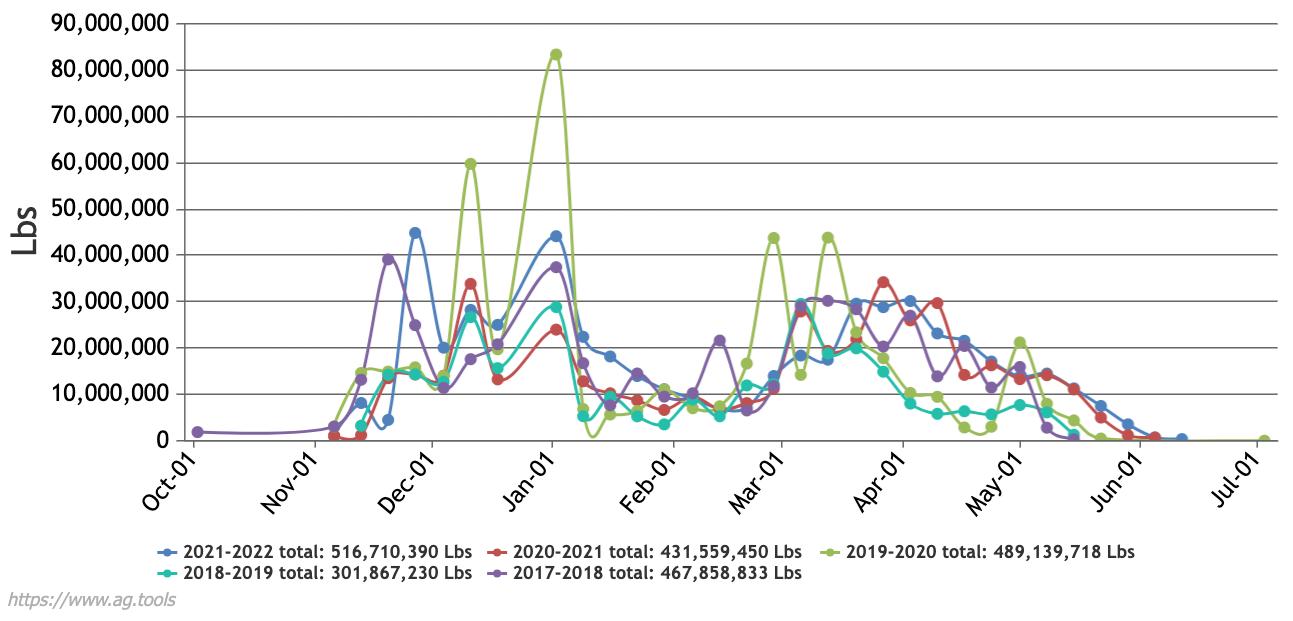
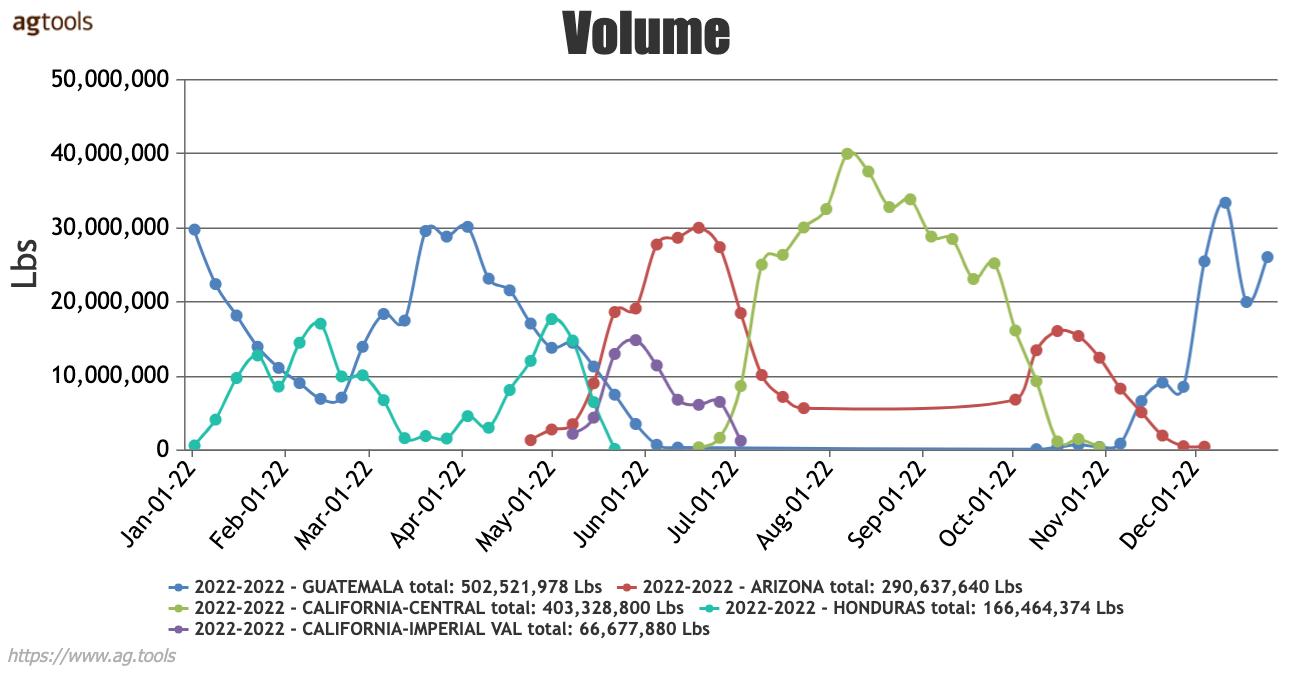

5-YEAR VOLUME PATTERN BY REGION - CANTALOUPS
Volume Pattern by Region
Honduras
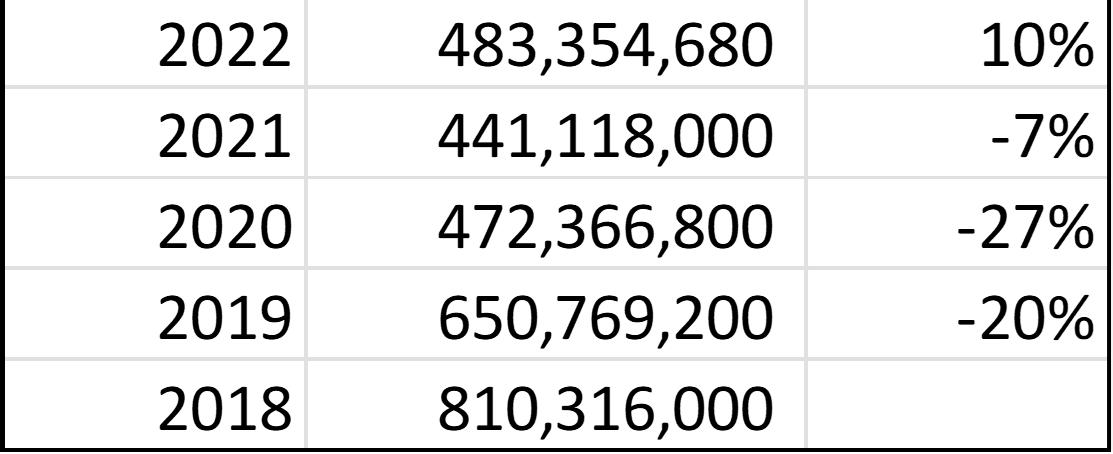
Year Volume Variance
Mexico

Year Volume Variance


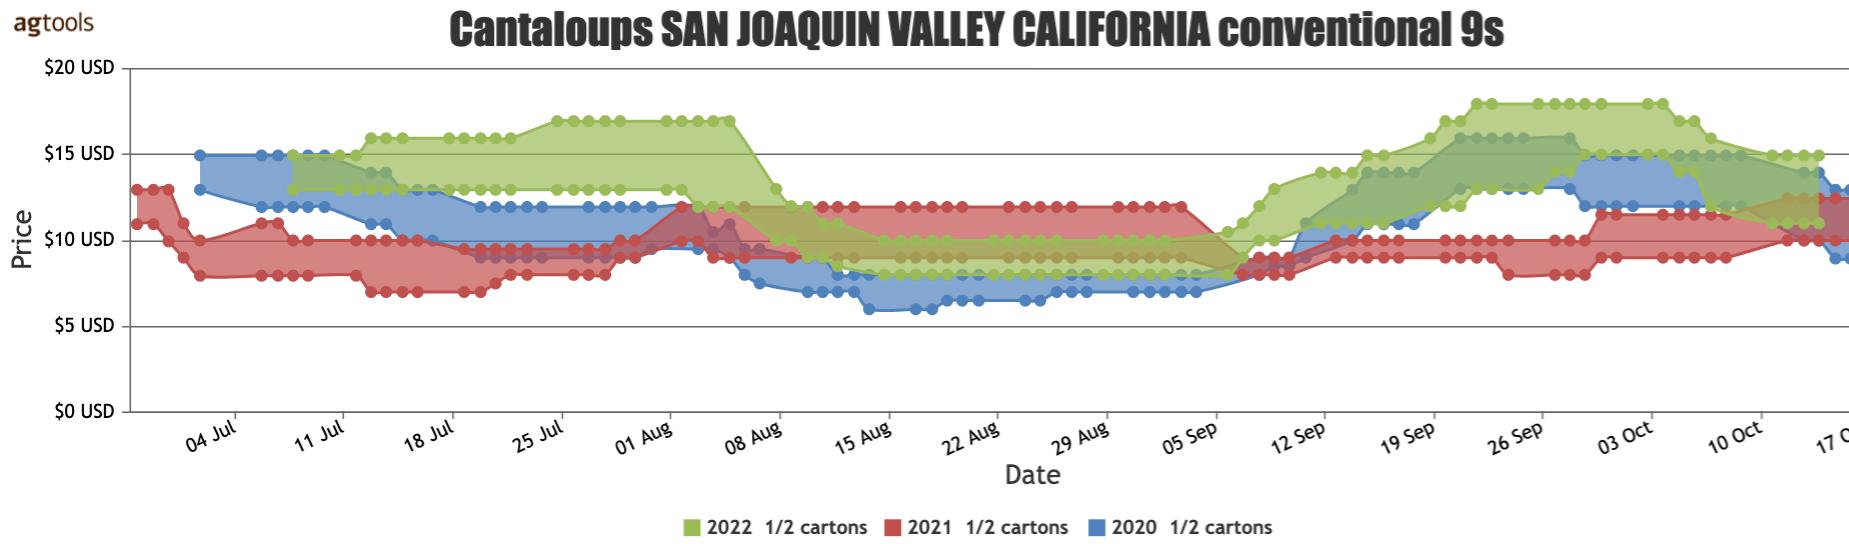
Comparing FOB shipping from two locations, San Joaquin Valley, California, Imperial and Palo Verde Valleys, California and Central and Western Arizona for conventional ½ ctns. Size 9s.

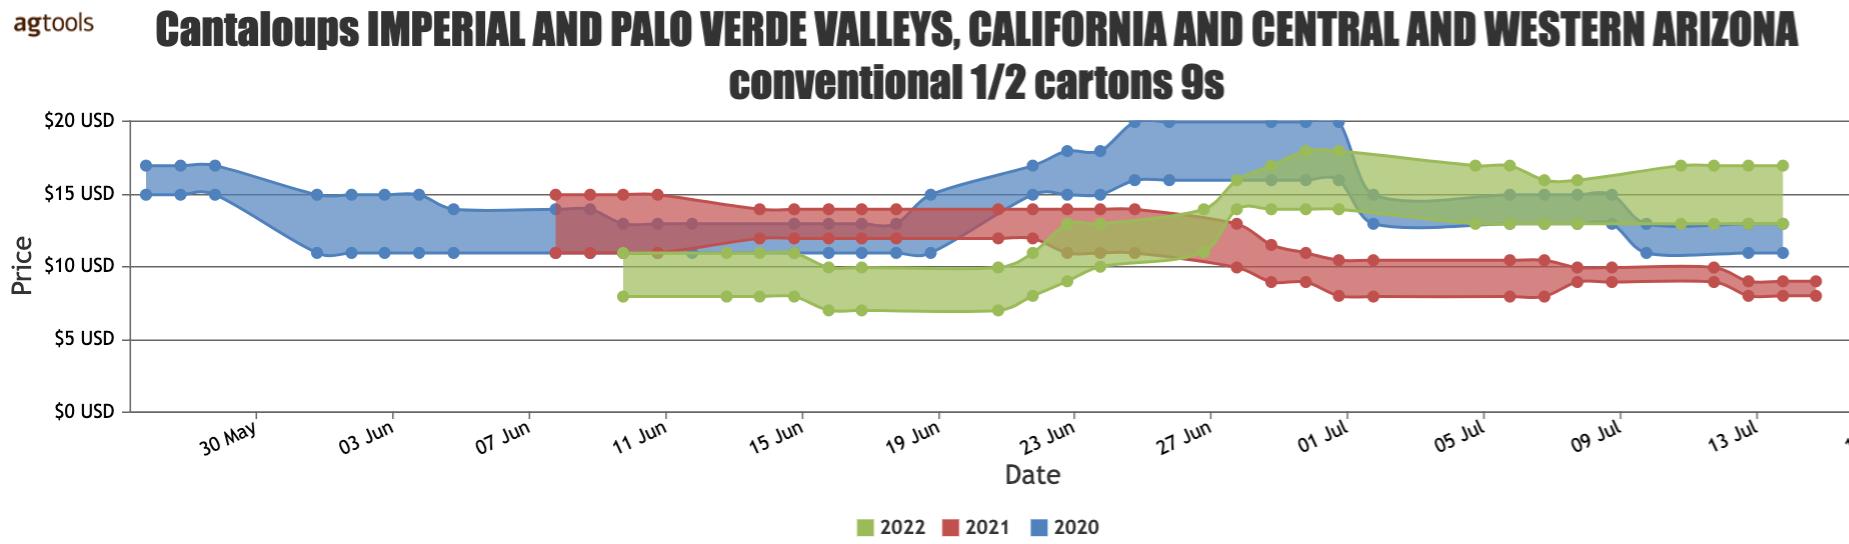
Pricing for cantaloupes from the San Joaquin Valley region show a higher price than the prior two timeframes beginning the second week of June with another elevated price the second week of September. Cantaloupes from the Imperial and Palo Valleys in California and Arizona regions started later than the prior two-year timeframes. The product entered the market the second week of June compared to the end of May in 2020. FOB prices for all three years converge in August through the beginning of September.
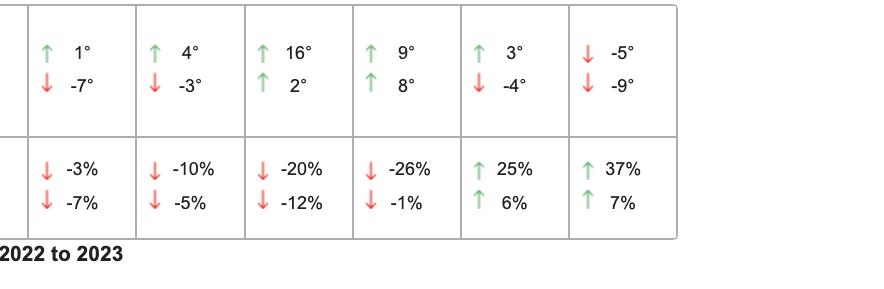
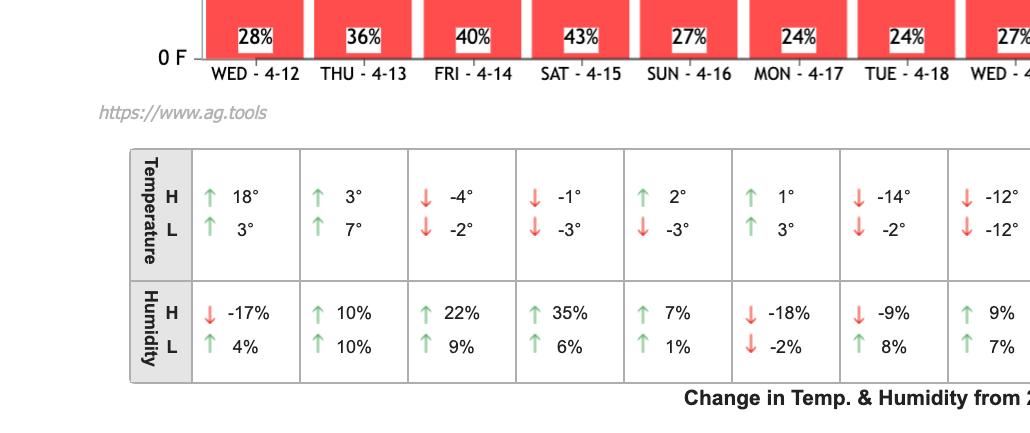
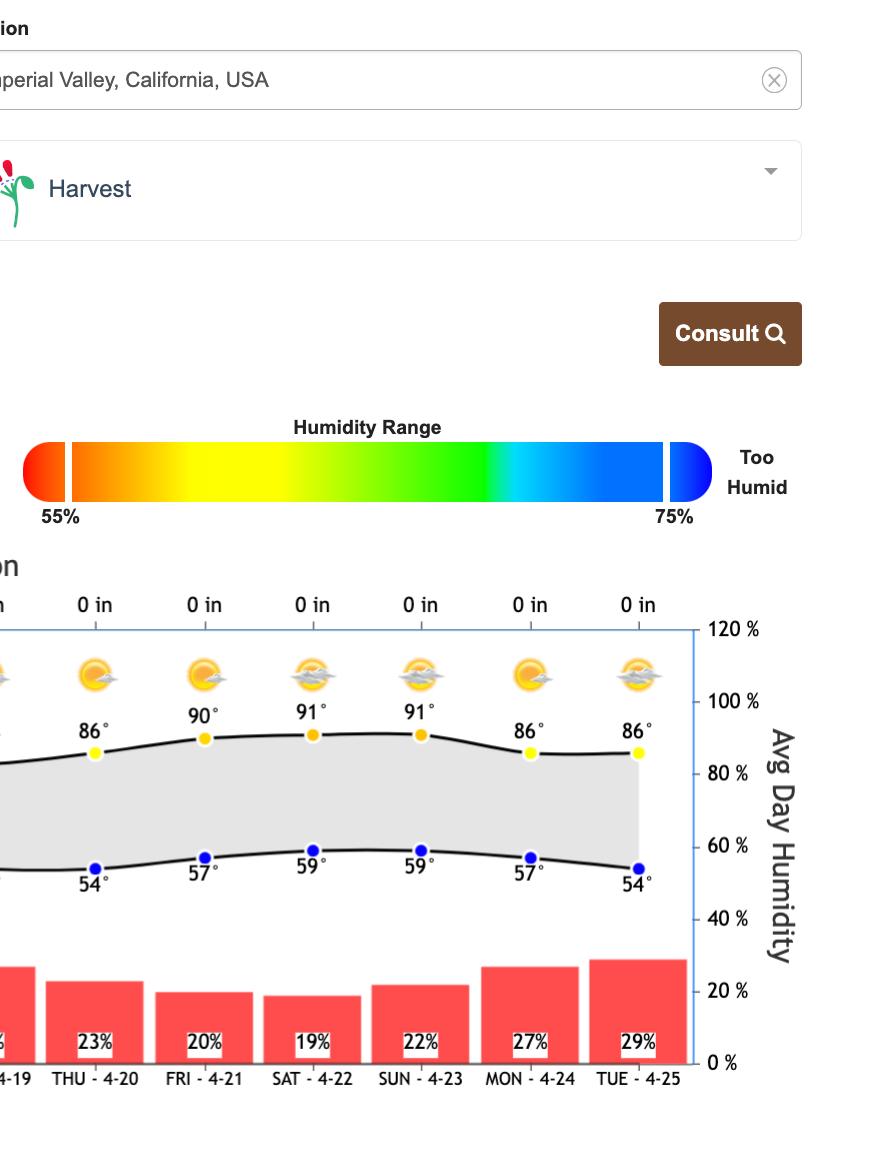
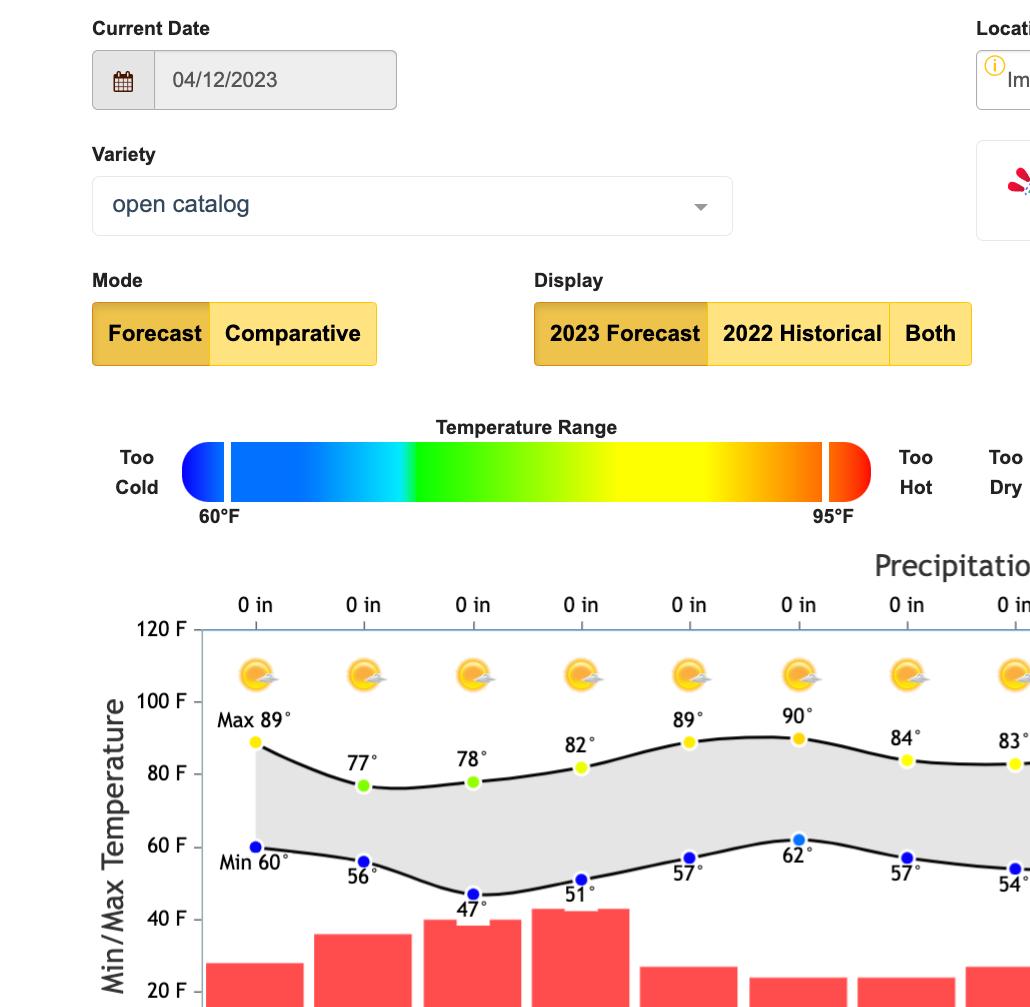
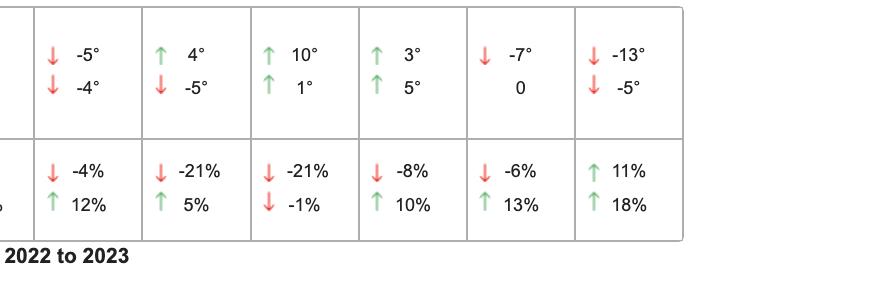
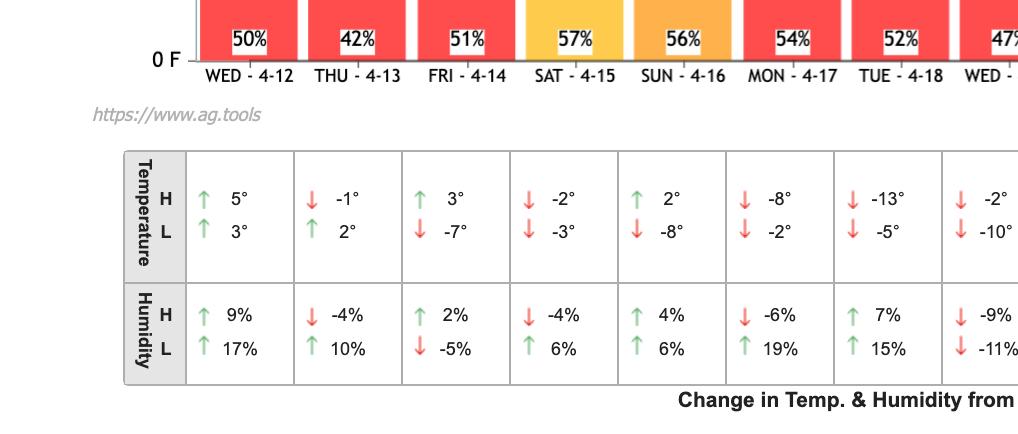
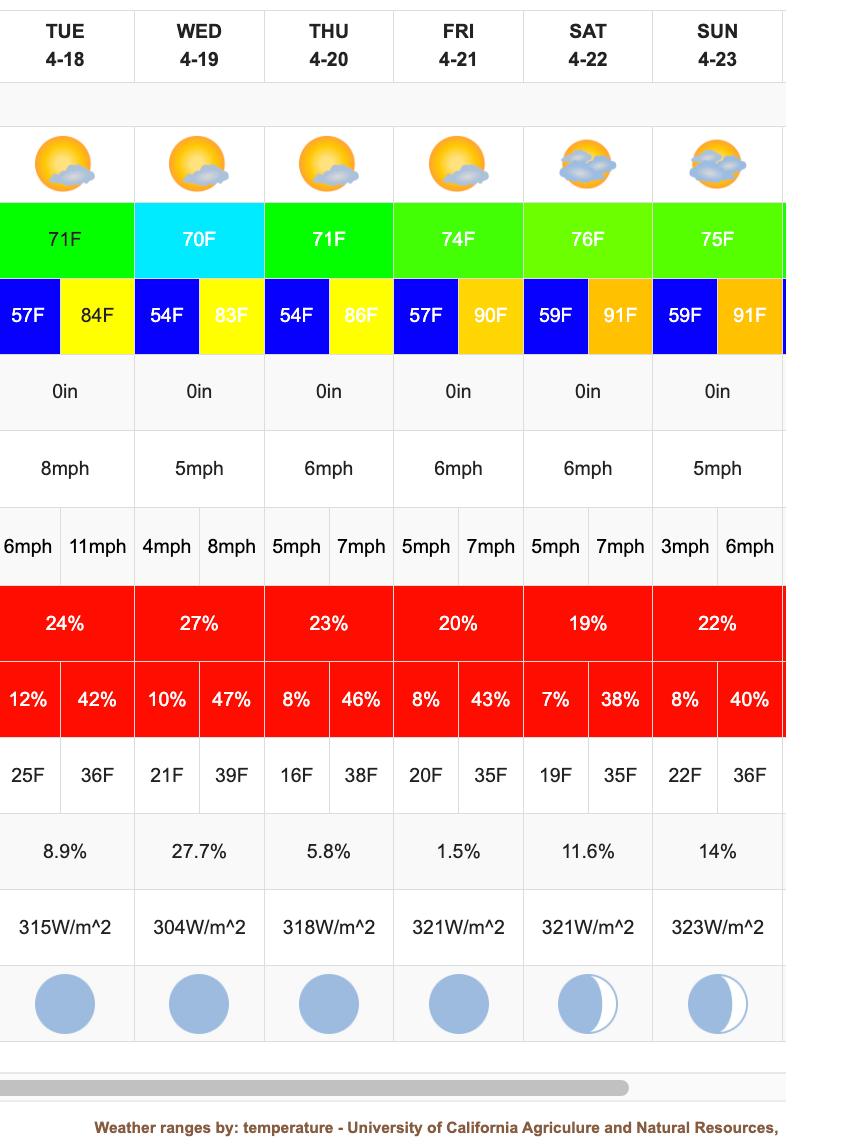
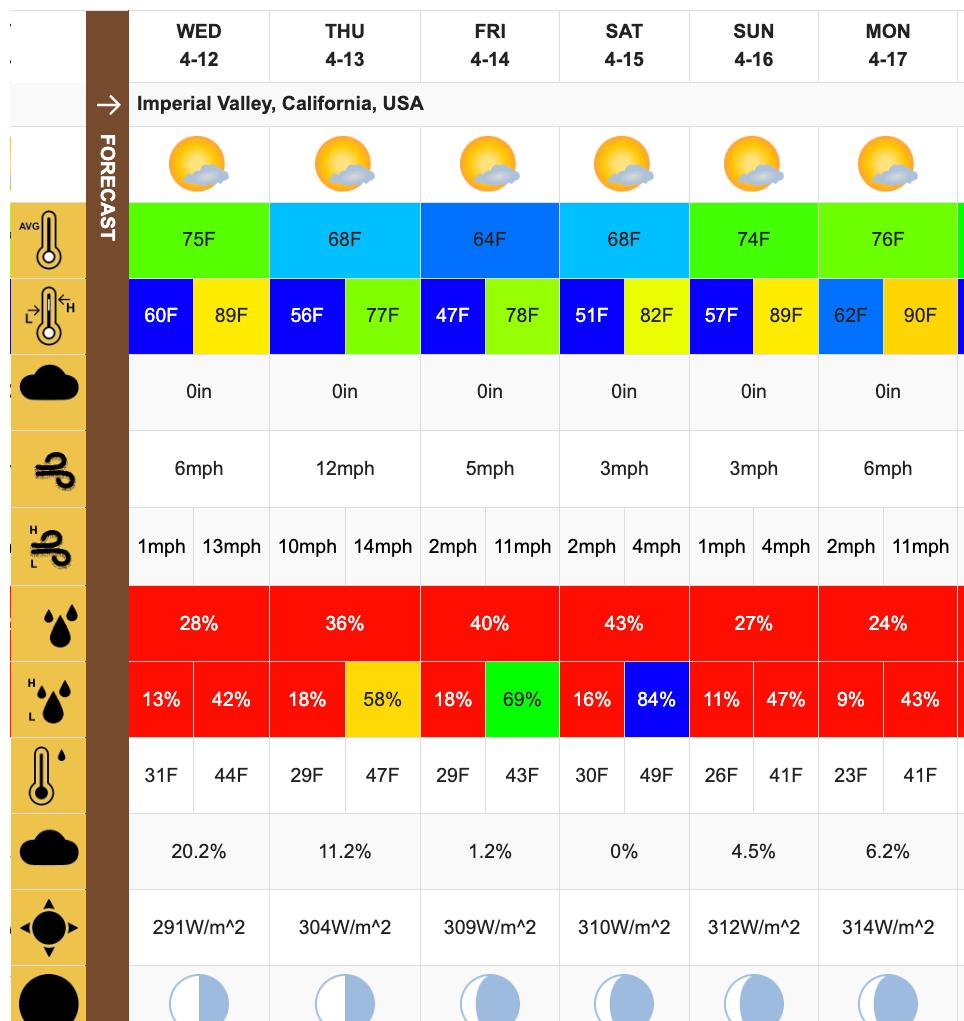
Weather Forecast - Imperial Valley, California April 12 - 16
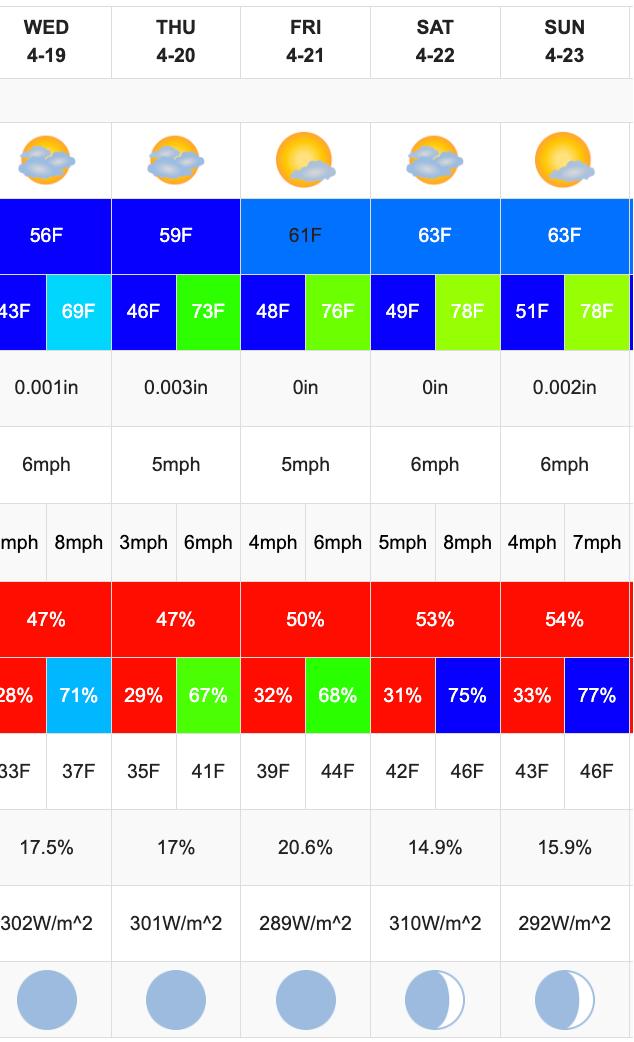
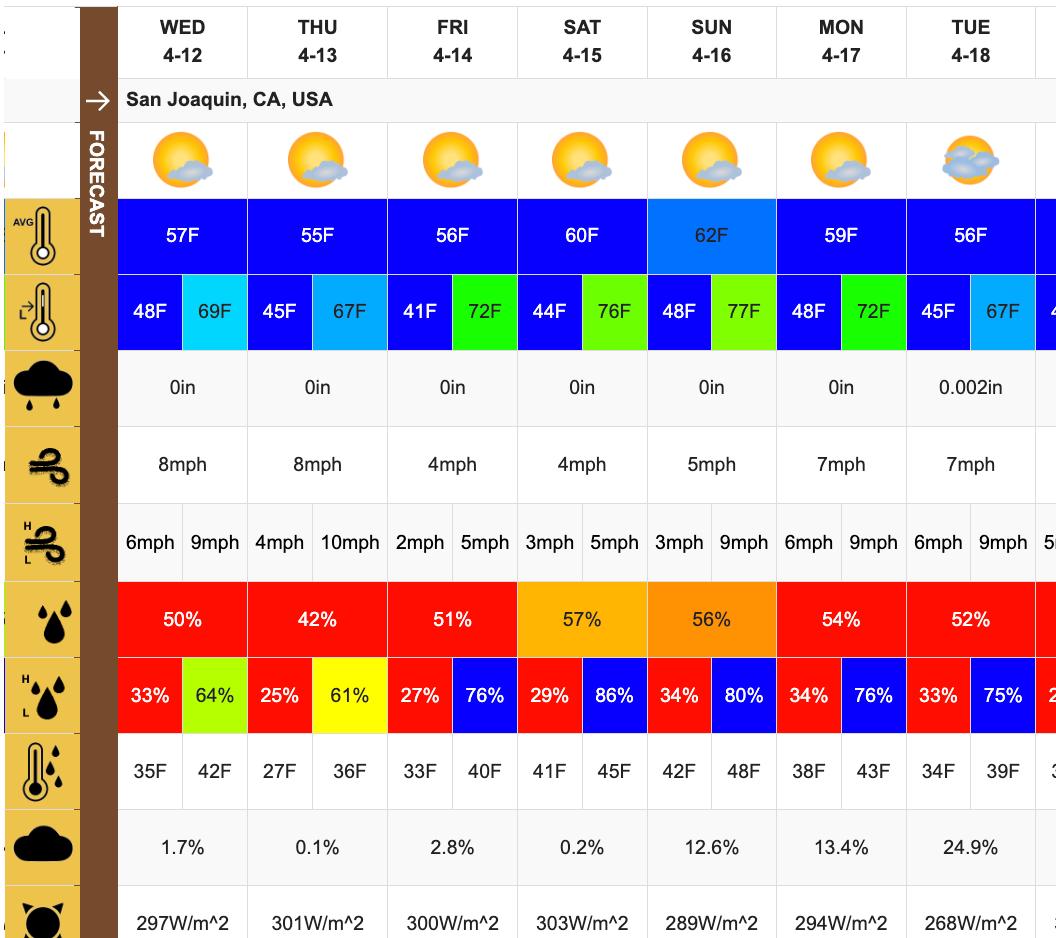
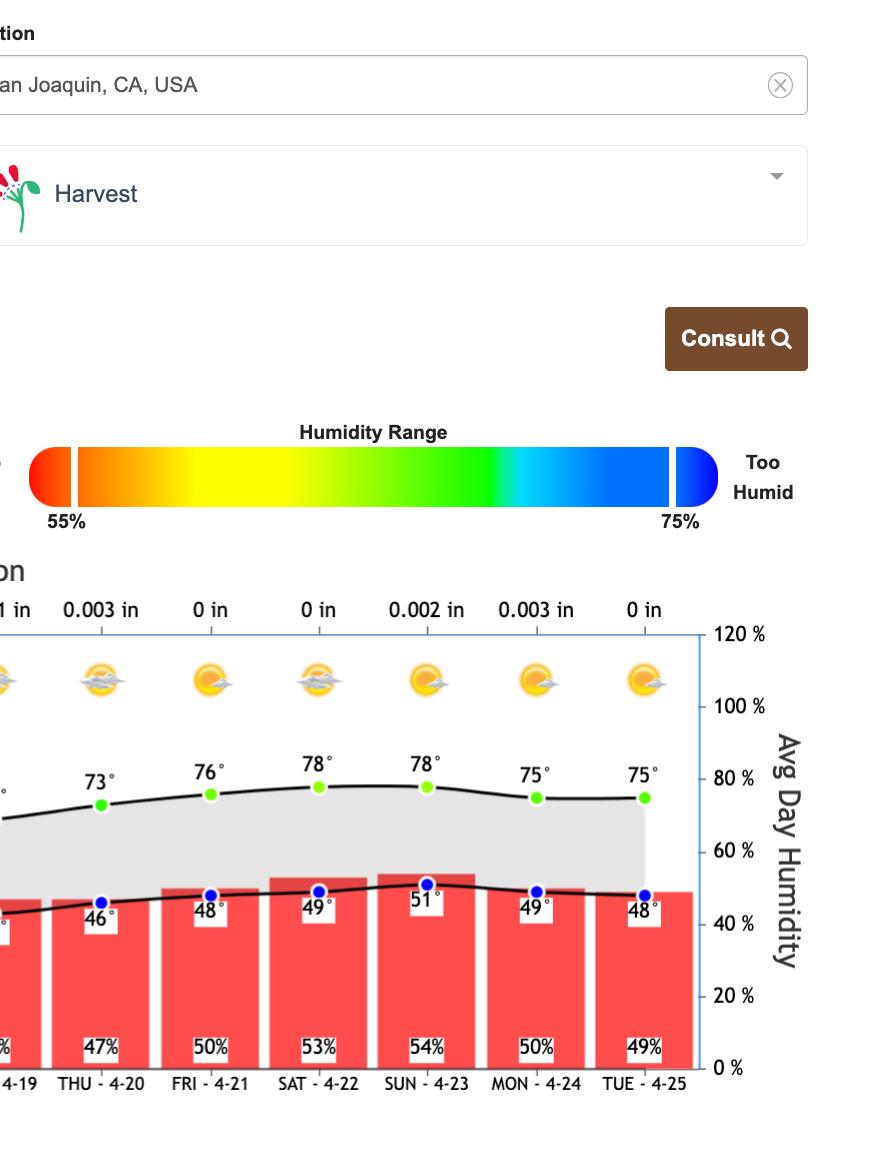
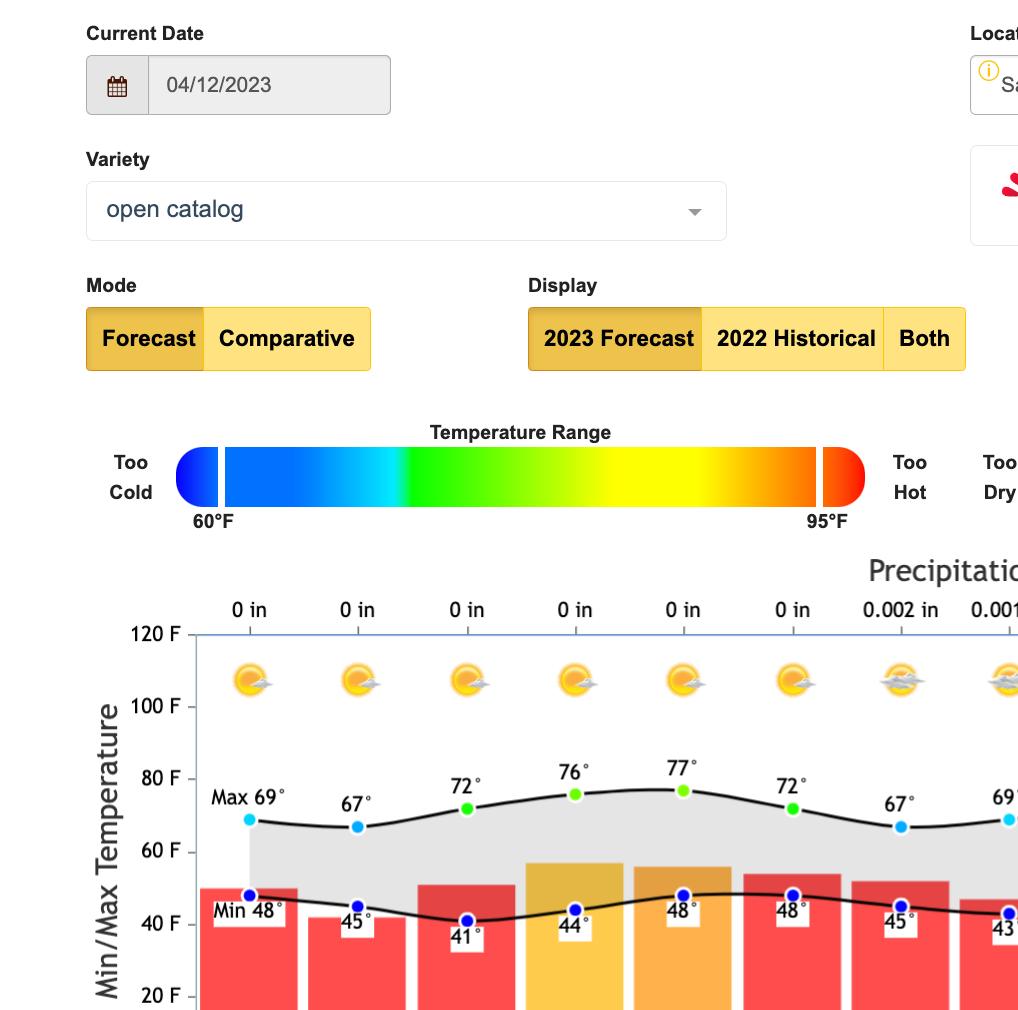
Comparative weather graph shows 2021 – 2023 weather patterns. The weather for all three years shows the temperature falling below the ideal range.
Honeydews 2022 Volume
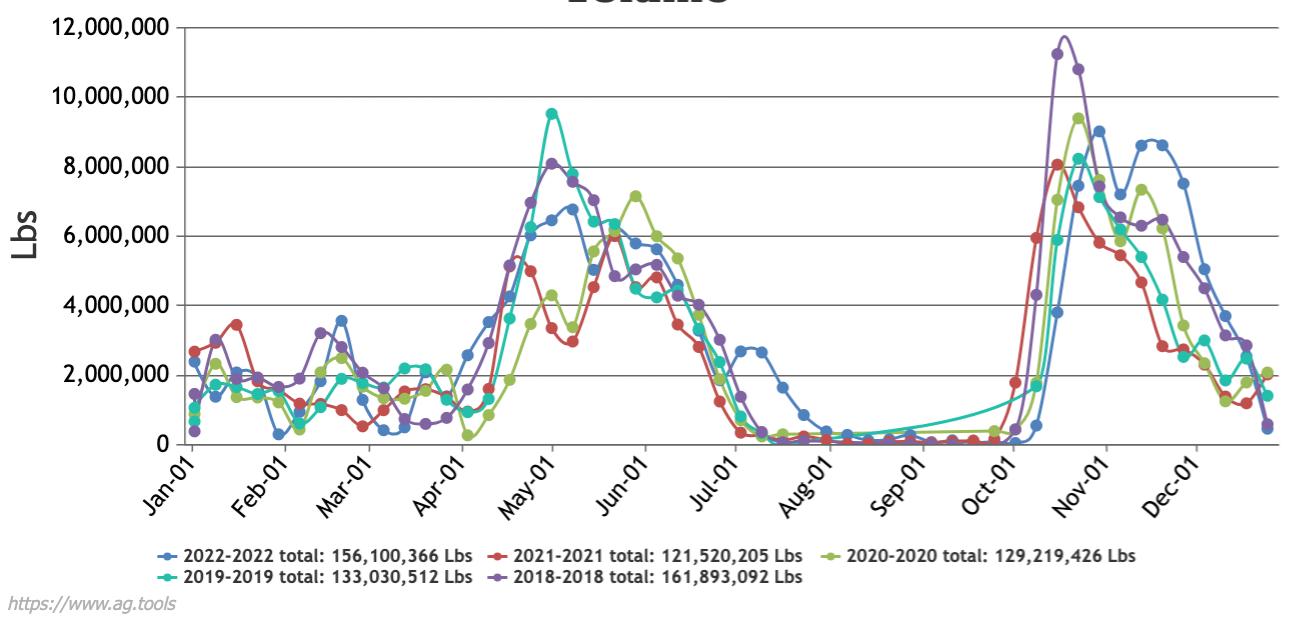
Total 2022 U.S. Honeydew Volume

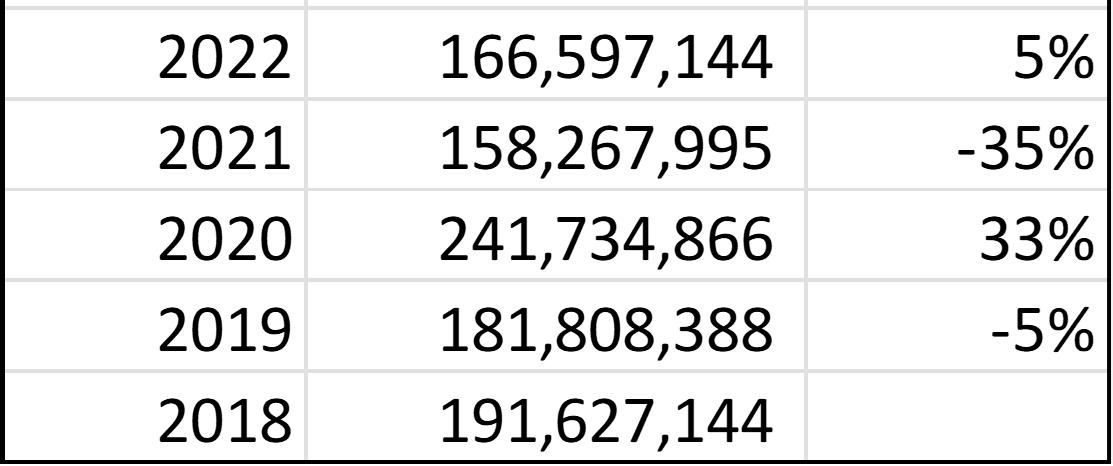
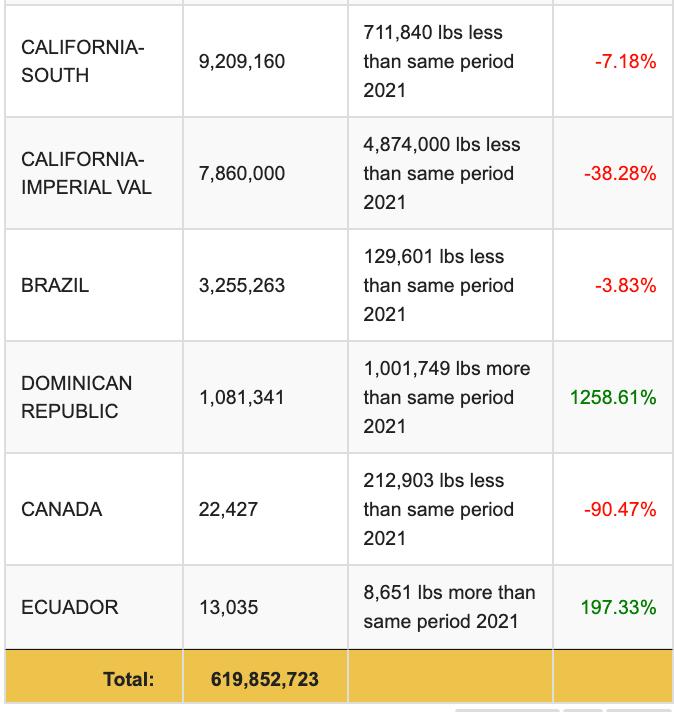
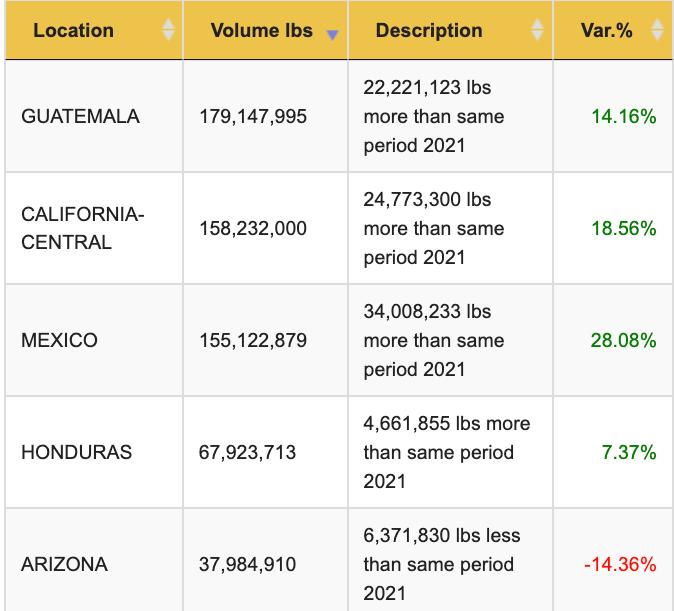
U.S. honeydew volume had a YoY volume increase of 13% for a total of 619M lbs. with Guatemala as the main supplier with a 29% market share.
All top four supplying regions show a YoY volume increase.
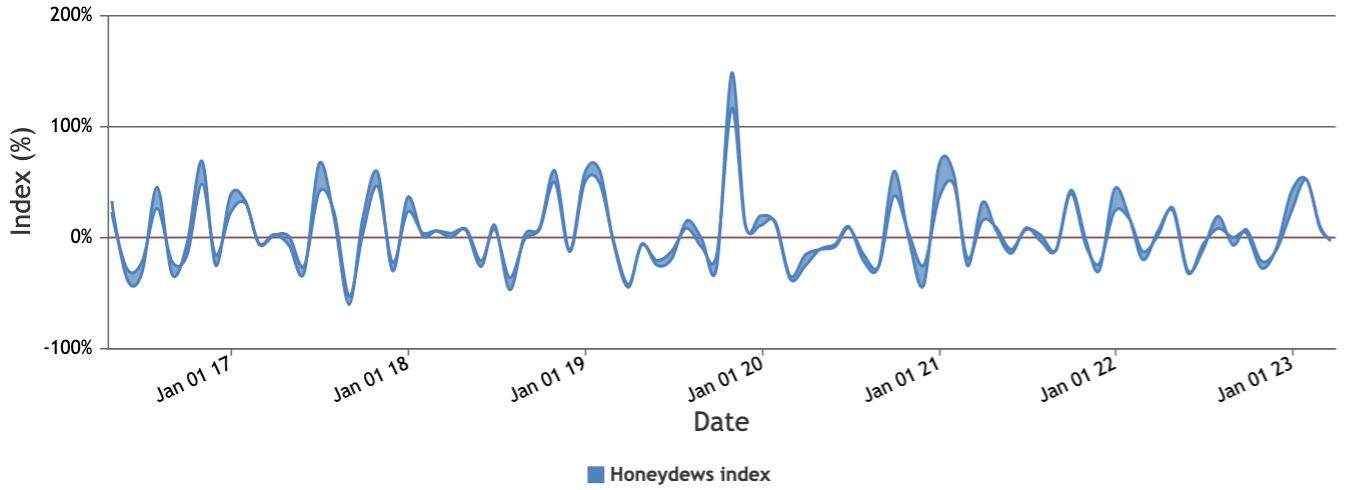
The seven-year FOB rate of change shown as a percentage shows stable pricing with slight fluctuations between 2017 and 2023 with a price spike surpassing 100% in 2020.
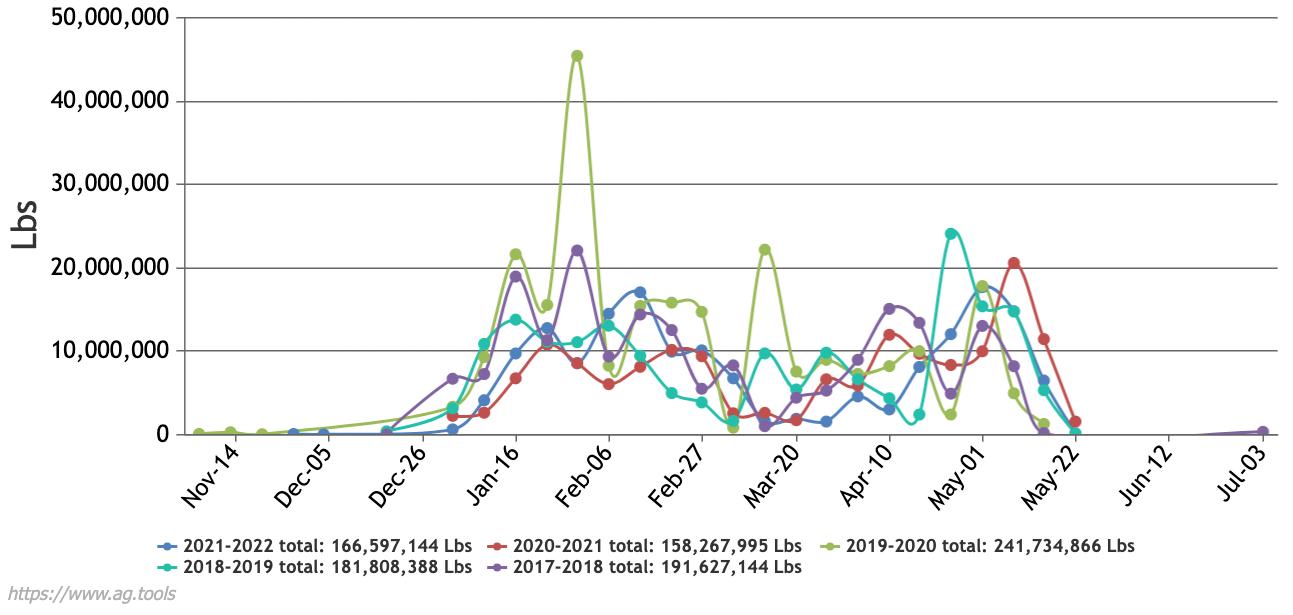
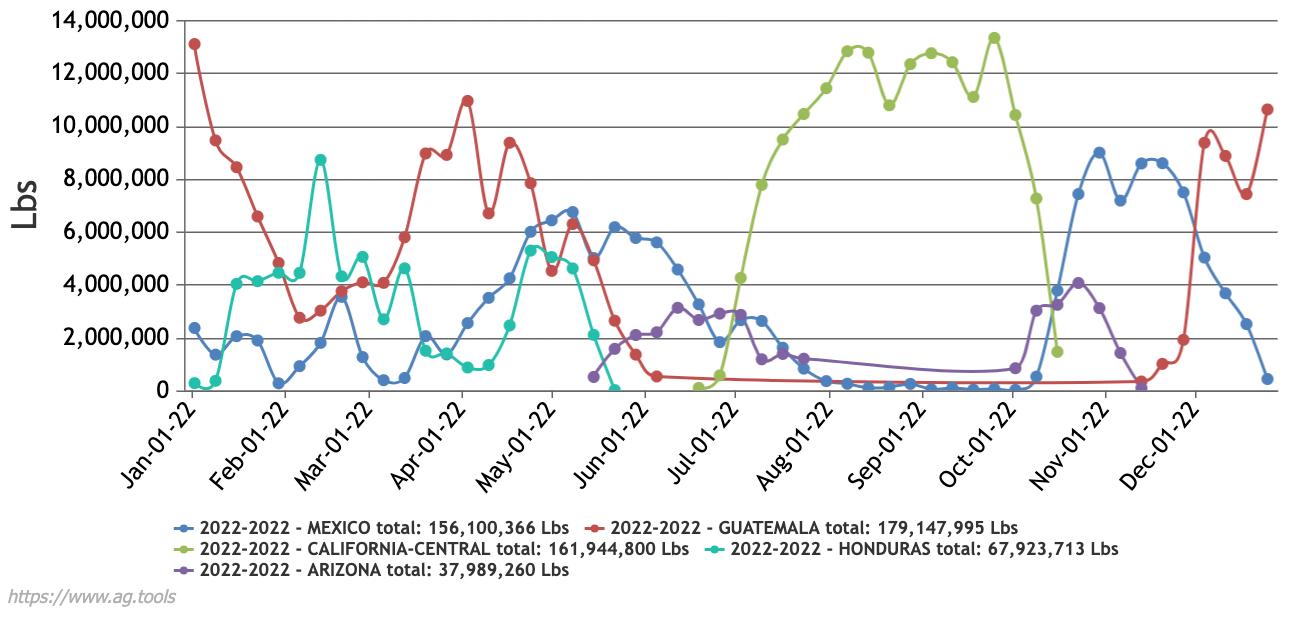
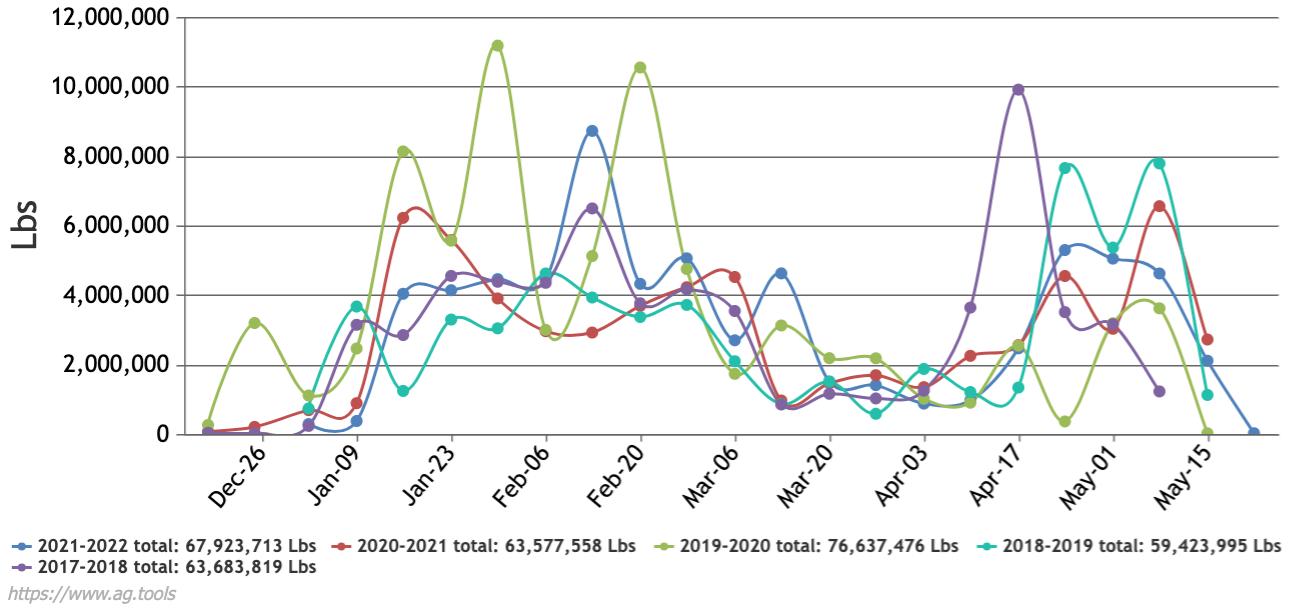
Guatemala’s volume started the year with a volume of 13.1M lbs. significantly higher than the other two countries Honduras and Mexico entering the market at the same time. Honduras reached 67.9M lbs by the end of February. Between February and May, there are a number of transitions between Guatemala, Mexico, and Honduras.
By the beginning of July, Central California arrived in the market peaking in volume through the beginning of October, when the volume from Mexico starts to uptick at the time California is winding down. The honeydew volume ends with volume from Guatemala and Mexico.
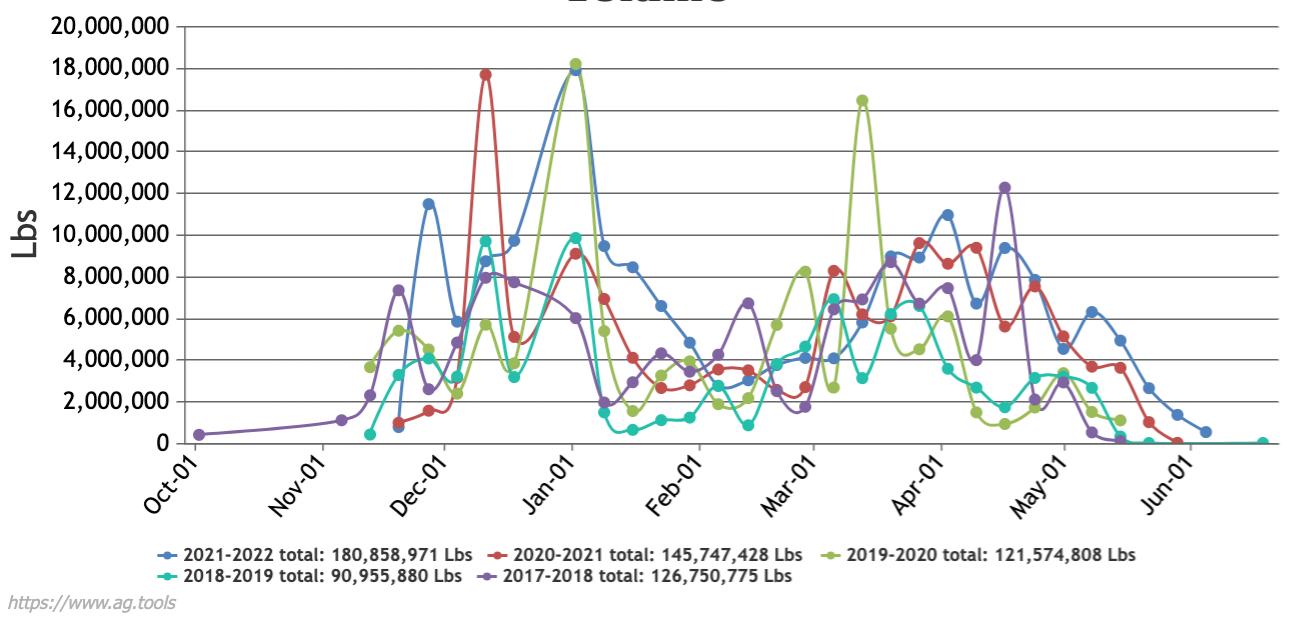
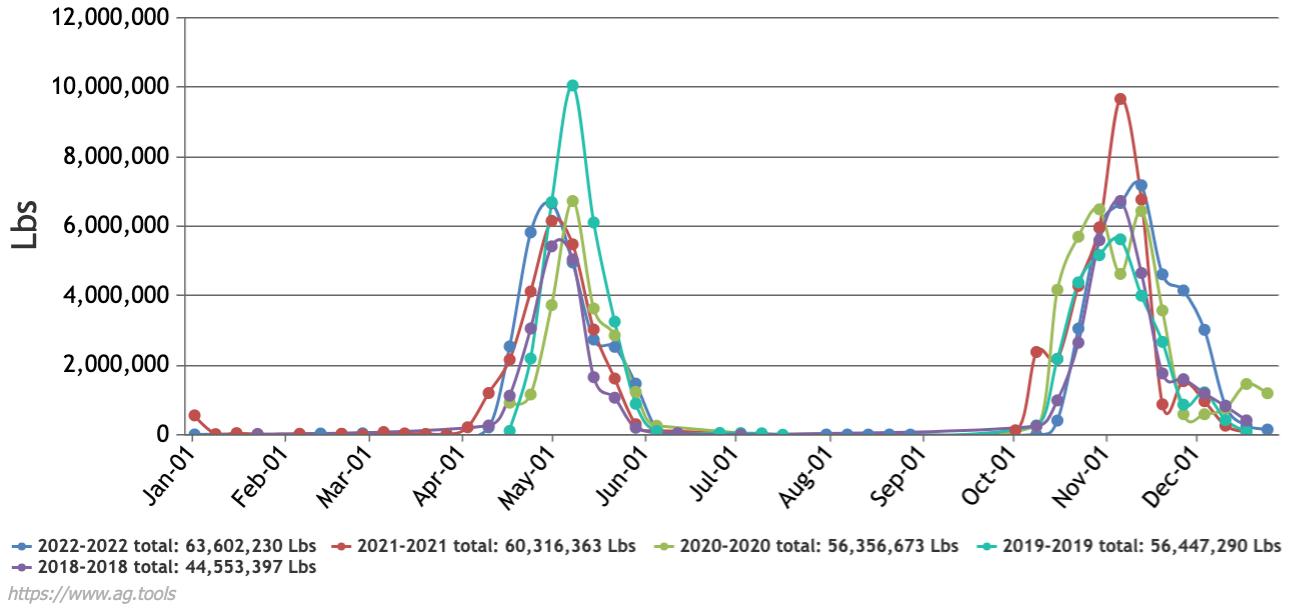
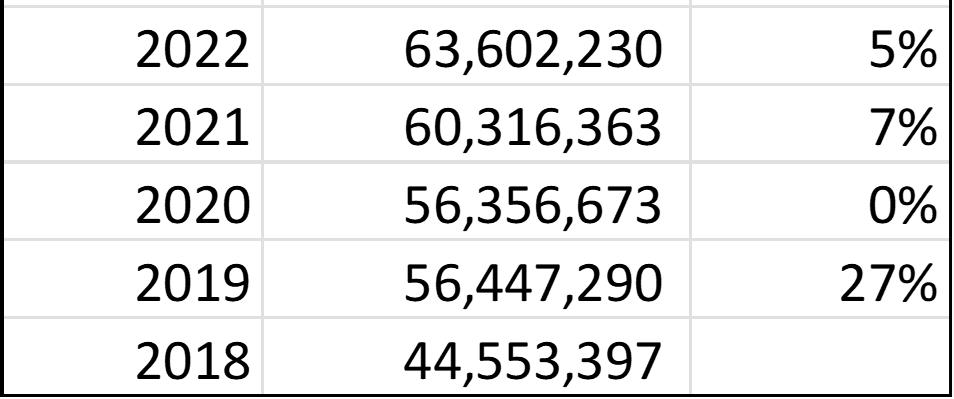
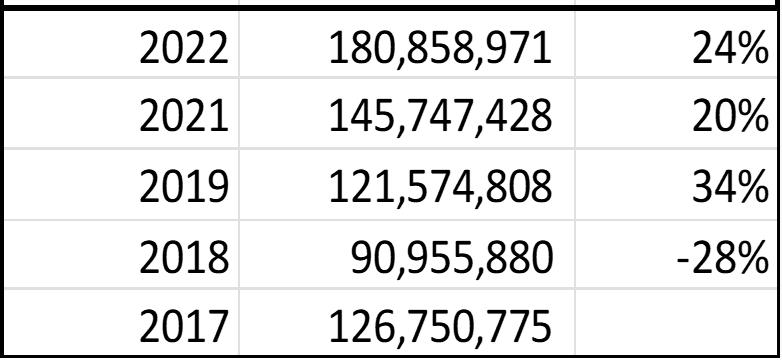
– As the #1 honeydew supplier to the U.S. market, Guatemala has shown three years of double digit YoY volume increases since 2019 with volume peaks in October, January, and March.
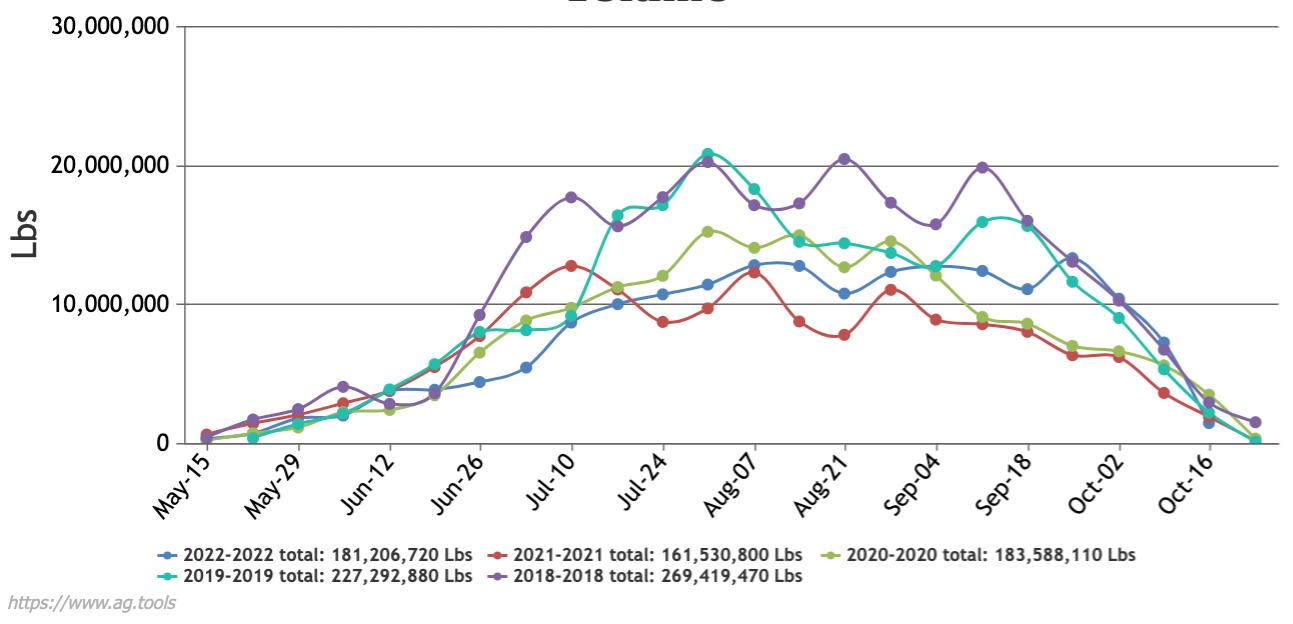
Since 2019, California has had three consecutive years of YoY double-digit volume decreases, with a YoY 12% increase in 2022. California volume is predominant between mid-July and mid-September.
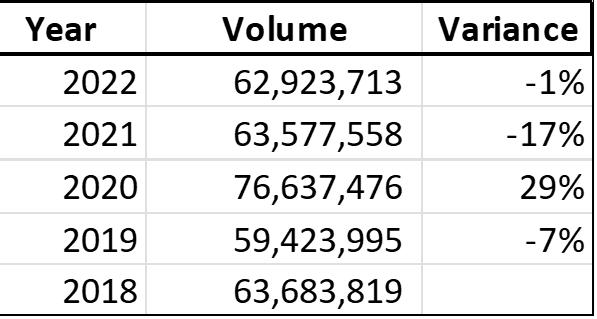
Honduras
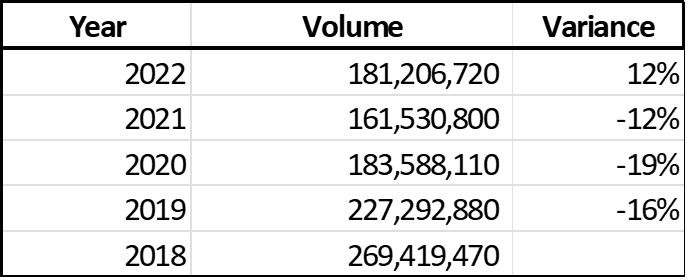
Since 2018 volume has fluctuated from a YoY double-digit increase between 2019 and 2020 then receding to a 17% decrease. 2022 had a slight YoY 1% decrease. Volume from Honduras shows two peaks. The end of January and February in 2019 and in mid-April 2018.
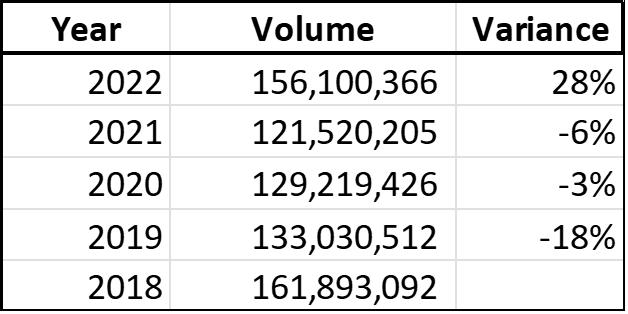
Mexico
After three consecutive years of volume decreases, 2022 had a YoY volume increase of 28%. Mexico ranks #3 in honeydew volume contribution. Volume peaks in May and June and again in October.

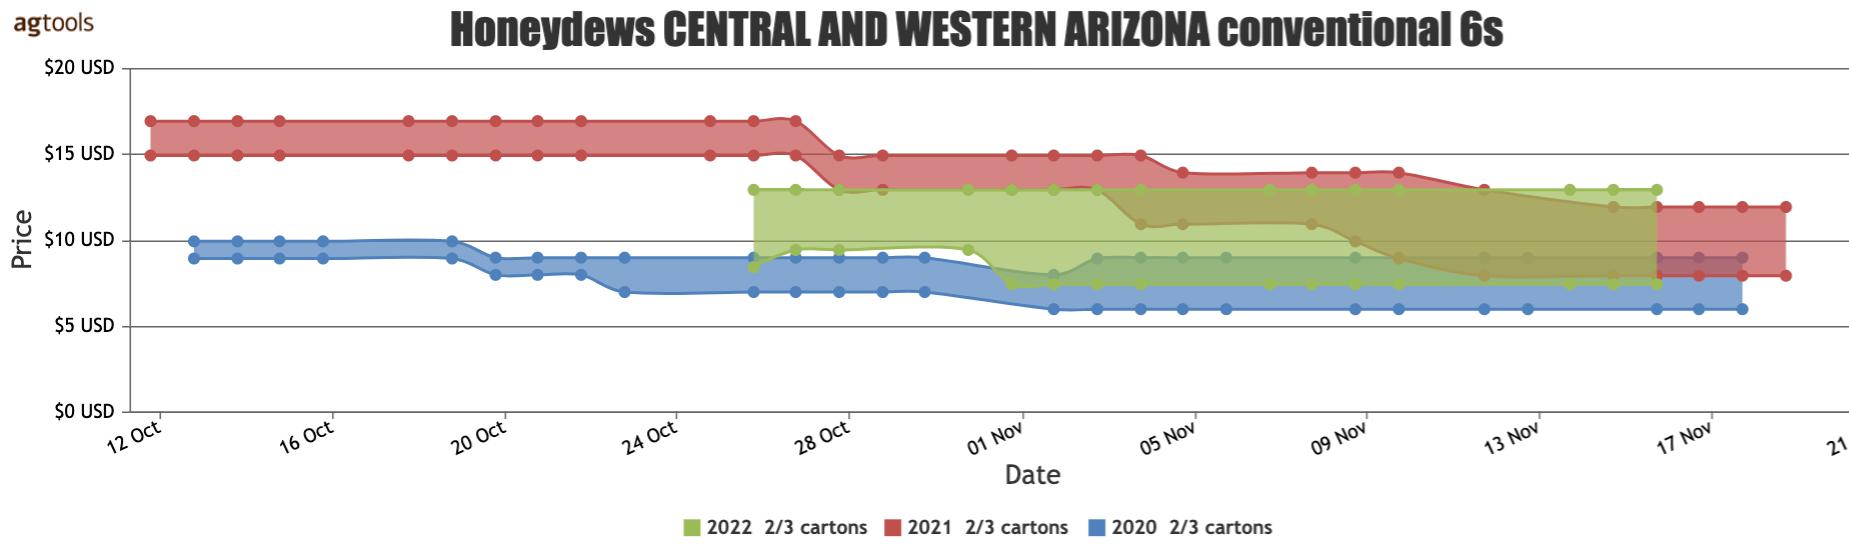
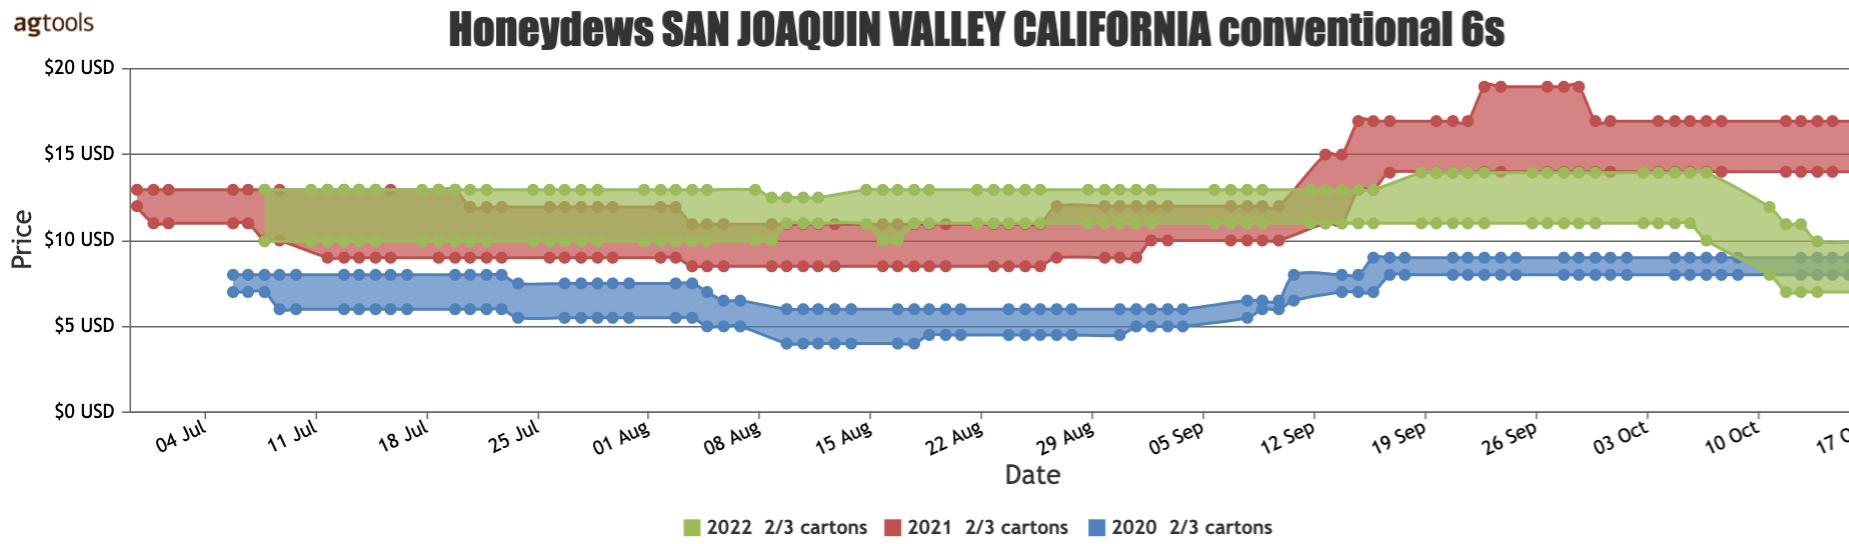
Comparing FOB shipping prices over three years, for size 6s between two locations for two different timeframes – San Joaquin Valley, California, July - October and from central and western Arizona, October – November.

2022 pricing from the San Joaquin Valley trended with the prior year 2021. Pricing from Central and Western Arizona for 2022 shows a late start in late October compared to the two prior timeframes beginning in early October. Supply also finished earlier in mid-November.
Comparative weather graph for 2021 – 2023 shows temperature staying Within the ideal minimum and maximum range for growing Honeydews in this region. 2022 and 2023 shows the temperature beginning to dip below the minimum range.