ACTA FACULTATIS XYLOLOGIAE ZVOLEN
VEDECKÝ ČASOPIS SCIENTIFIC JOURNAL
Vedecký časopis Acta Facultatis Xylologiae Zvolen uverejňuje pôvodné recenzované vedecké práce z oblastí: štruktúra a vlastnosti dreva, procesy spracovania, obrábania, sušenia, modifikácie a ochrany dreva, termickej stability, horenia a protipožiarnej ochrany lignocelulózových materiálov, konštrukcie a dizajnu nábytku, drevených stavebných konštrukcií, ekonomiky a manažmentu drevospracujúceho priemyslu. Poskytuje priestor aj na prezentáciu názorov formou správ a recenzií kníh domácich a zahraničných autorov.
Scientific journal Acta Facultatis Xylologiae Zvolen publishes peer-reviewed scientific papers covering the fields of wood: structure and properties, wood processing, machining and drying, wood modification and preservation, thermal stability, burning and fire protection of lignocellulosic materials, furniture design and construction, wooden constructions, economics and management in wood processing industry. The journal is a platform for presenting reports and reviews of books of domestic and foreign authors.
VEDECKÝ ČASOPIS DREVÁRSKEJ FAKULTY, TECHNICKEJ UNIVERZITY
VO ZVOLENE 67 1/2025
SCIENTIFIC JOURNAL OF THE FACULTY OF WOOD SCIENCES AND TECHNOLOGY, TECHNICAL UNIVERSITY IN ZVOLEN 67 1/2025
Redakcia (Publisher and Editor’s Office): Technická univerzity vo Zvolene (Technical university in Zvolen); TUZVO Drevárska fakulta (Faculty of Wood Sciences and Technology)
T. G. Masaryka 2117/24, SK-960 01 Zvolen, Slovakia
Redakčná rada (Editorial Board): Predseda (Chairman): prof. Ing. Ján Sedliačik, PhD, TUZVO (SK)
Vedecký redaktor (Editor-in-Chief): prof. Ing. Ladislav Dzurenda, PhD, TUZVO (SK)
Členovia (Members): prof. RNDr. František Kačík, DrSc. TUZVO (SK) prof. RNDr. Danica Kačíková, MSc. PhD., TUZVO (SK) prof. Ing. Ivan Klement, CSc. TUZVO (SK) prof. Ing. Jozef Kúdela, CSc. TUZVO (SK) prof. Ing. Mariana Sedliačiková, PhD. TUZVO (SK) prof. Ing. Jozef Štefko. CSc. TUZVO (SK) doc. Ing. Hubert Paluš, PhD. TUZVO (SK)
Jazykový editor (Proofreader): Mgr. Žaneta Balážová, PhD. Technický redaktor (Production Editor): Ing. Michal Dudiak, PhD.
Medzinárodný poradný zbor (International Advisory Editorial Board):
Antov Petar Yordanov (Univ of Forestry, BG), Bekhta Pavlo (Ukrainian Nat Forestry Univ, UA), Deliiski Nencho (Univ of Forestry, BG), Hua Lee Seng (UiTM Cawangan Pahang, MY), Jelačić Denis (Univ Zagreb, HR), Kasal Bohumil (Tech Univ Carolo Wilhelmina Braunschweig, DE), Lubis Muhammad Adly Rahandi (Kyungpook Nat Univ, ID), Marchal Remy (Arts & Metiers ParisTech, FR), Németh Róbert (Univ Sopron, HU), Niemz Peter (Bern Univ Appl Sci, Architecture Wood & Civil Engn, CH), Orlowski Kazimierz A.(Gdansk Univ Technol, PL), Pohleven Franc (Univ Ljubljana, SI), Rogoziński Tomasz (Poznań Univ of Life Sci, PL), Teischinger Alfréd (Univ Nat Res & Life Sci, BOKU, AT), Smardzewski Jerzy (Poznań Univ of Life Sci, PL), Vlosky Richard P. (Louisiana State Univ, USA), Wimmer Rupert (Univ Nat Res & Life Sci, AT).
Vydala (Published by): Technická univerzita vo Zvolene, T. G. Masaryka 2117/24, 960 01 Zvolen, IČO 00397440, 2025
Náklad (Circulation) 80 výtlačkov, Rozsah (Pages) 164 strán, 13,64 AH, 13,91 VH
Tlač (Printed by): Vydavateľstvo Technickej univerzity vo Zvolene
Vydanie I – jún 2025
Periodikum s periodicitou dvakrát ročne
Evidenčné číslo: 3860/09
Acta Facultatis Xylologiae Zvolen je registrovaný v databázach (Indexed in): Web of Science, SCOPUS, ProQuest, AGRICOLA, Scientific Electronic Library (Russian Federation), China National Knowledge Infrastructure (CNKI)
Za vedeckú úroveň tejto publikácie zodpovedajú autori a recenzenti. Rukopis neprešiel jazykovou úpravou.
Všetky práva vyhradené. Nijaká časť textu ani ilustrácie nemôžu byť použité na ďalšie šírenie akoukoľvek formou bez predchádzajúceho súhlasu autorov alebo vydavateľa.
© Copyright by Technical university in Zvolen, Slovak Republic. ISSN (print) 1336–3824, ISSN (online): 2730-1176
01. VIDHOLDOVÁ ZUZANA – HÝROŠOVÁ TATIANA: COMPARATIVE COLOUR ANALYSIS OF THERMALLY MODIFIED SELECTED TEMPERATE HARDWOODS AND TROPICAL WOOD SPECIES USING PRINCIPAL COMPONENT ANALYSIS . 5
02. IVAN KLEMENT – TATIANA VILKOVSKÁ – PETER VILKOVSKÝ: DIMENSIONAL STABILITY OF BEECH BLANKS IN THE CONTACT DRYING PROCESS 13
03. PAVLO LYUTYY – PAVLO BEKHTA – JÁN SEDLIAČIK: MODELING AND ANALYSIS OF TEMPERATURE DISTRIBUTION ACROSS THE CROSS-SECTION OF FLAT-PRESSED WOOD–POLYMER COMPOSITES DURING COOLING STAGE 23
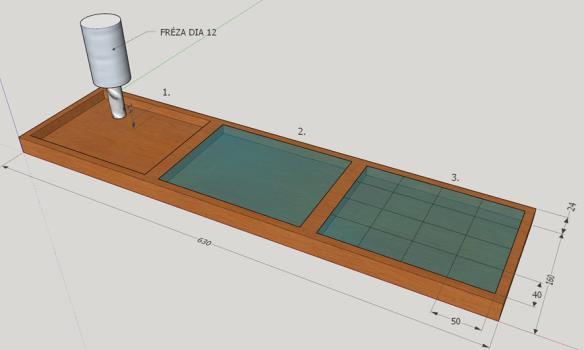
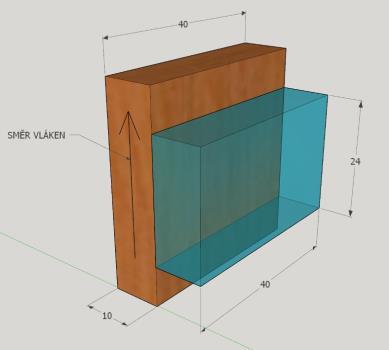
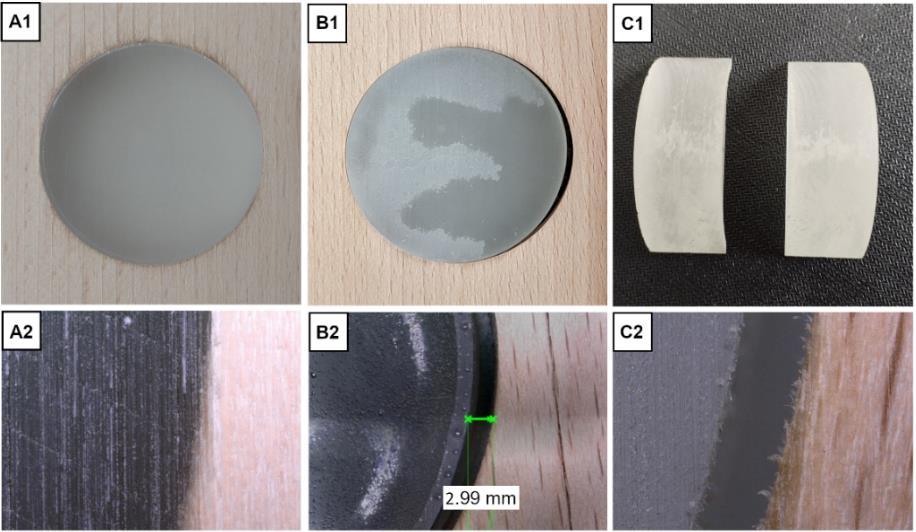
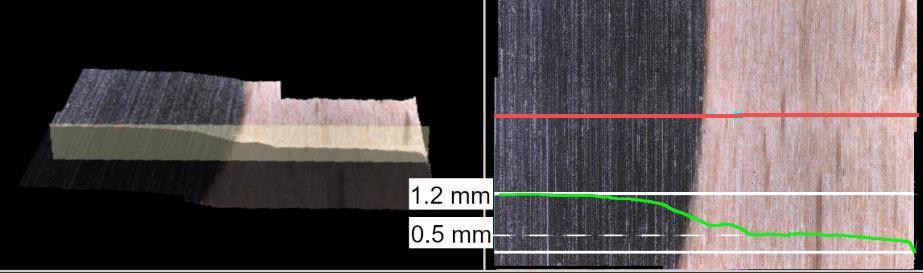
04. VERONIKA ŠUGÁROVÁ – LUKÁŠ ADAMČÍK – RICHARD KMINIAK: THE INFLUENCE OF TECHNICAL AND TECHNOLOGICAL PARAMETERS OF CNC MILLING ON THE SURFACE QUALITY OF BEECH PLYWOOD .......................................... 35
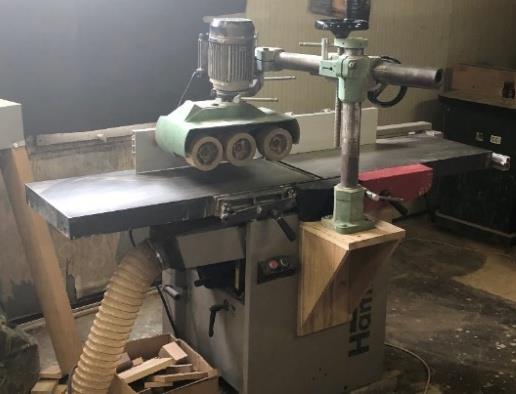
05. PAVLIN VITCHEV – ENGINDJAN HALIM: INFLUENCE OF THE CUTTING MODE ON THE NOISE EMISSION LEVEL DURING LONGITUDINAL-PLANNER MILLING OF LINDEN AND BEECH WOOD ............................................................................................................ 49
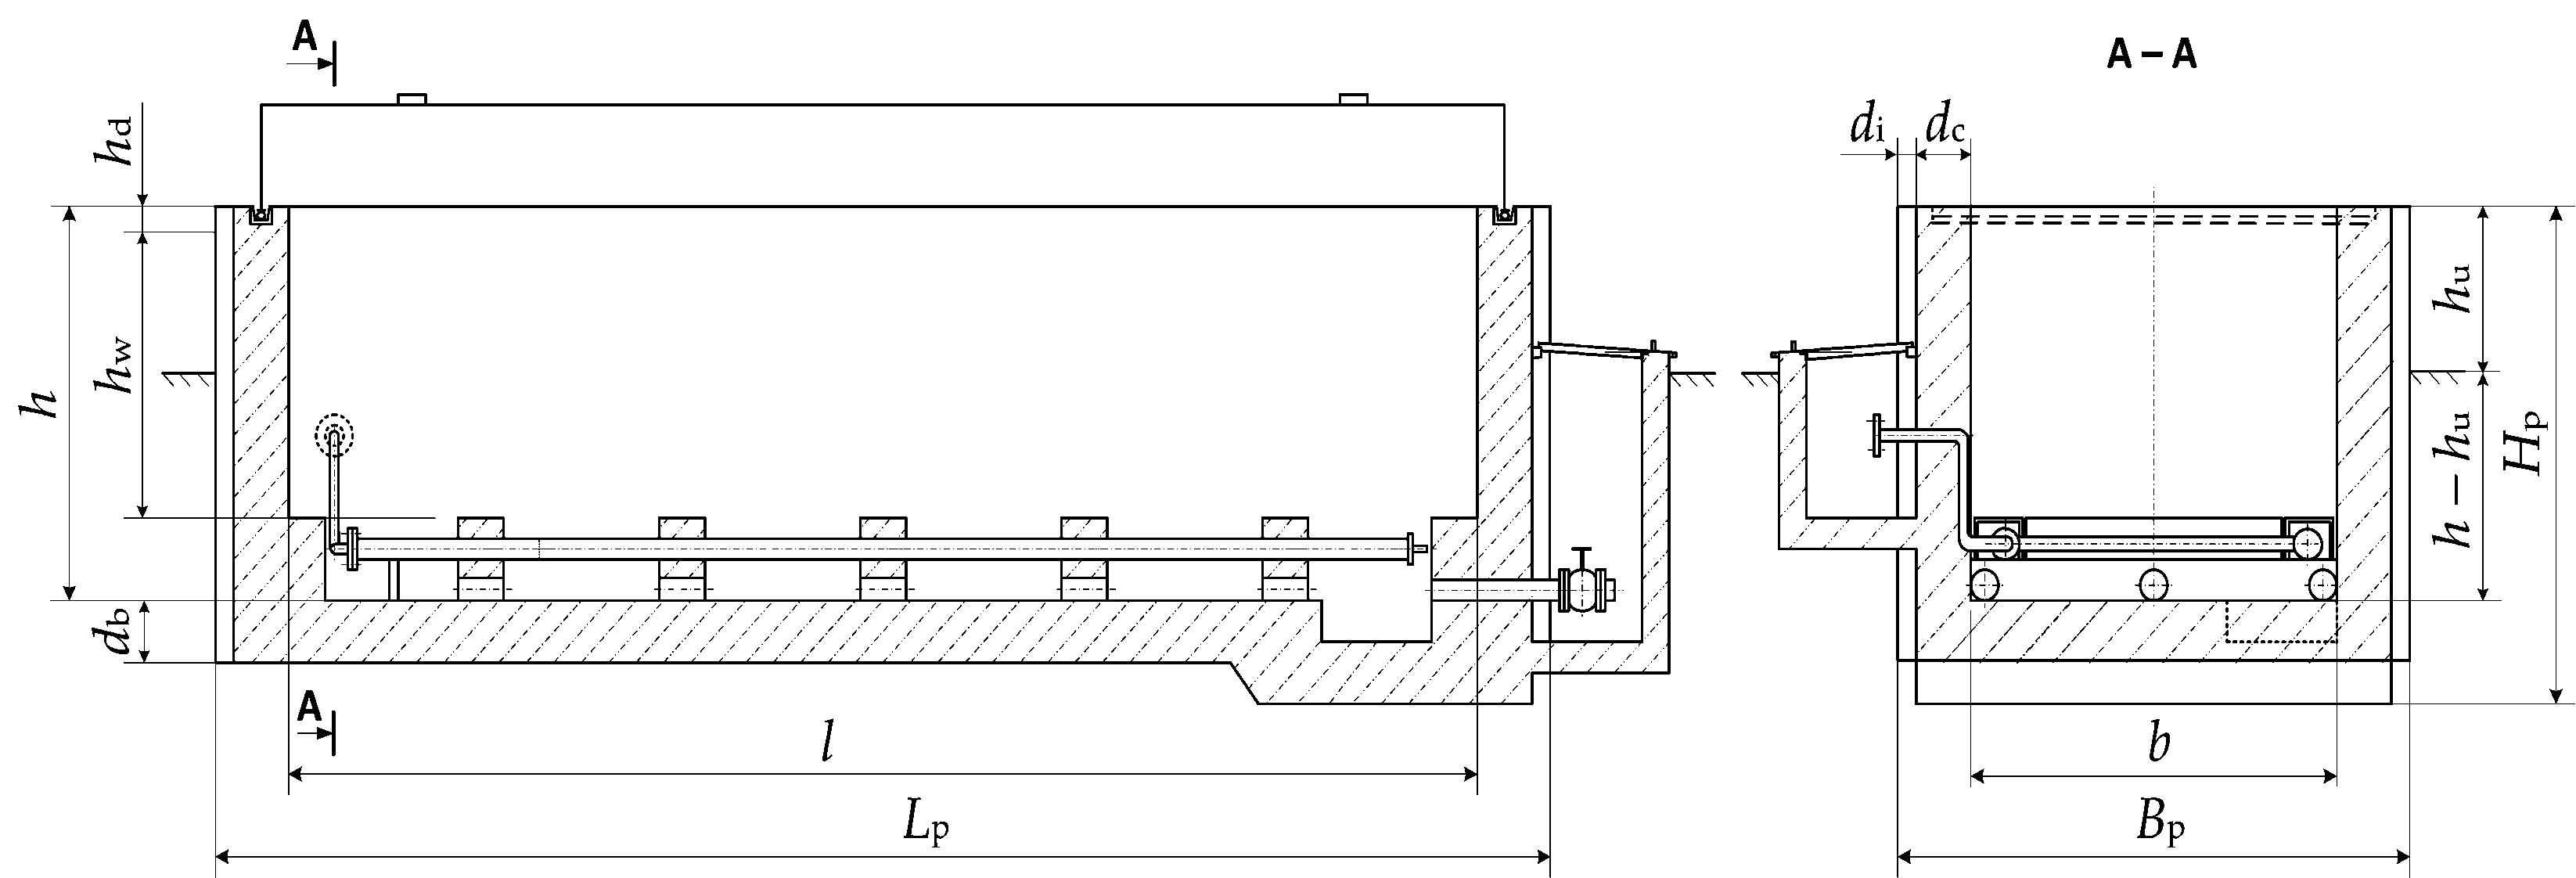
06 LADISLAV DZURENDA – NENCHO DELIISKI –DIMITAR ANGELSKI – PAVLIN VITCHEV – KRASIMIRA ATANASOVA: HEAT BALANCES OF CONCRETE PITS WHEN STEAMING OR BOILING UNFROZEN LOGS 61
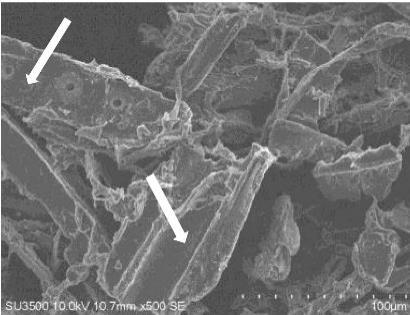
07. VLADIMIR YERMOLIN – MIKHAIL BAYANDIN – SERGEY ELISEEV – SERGEI KAZITSIN – NIKOLAY SMERTIN – LILIT KAZARYAN – TATYANA STREKALEVA: PRODUCTION OF BINDER-FREE BOARDS FROM BIODEGRADED ABIES SIBIRICA WOOD 75
08. BARBORA SLOVÁČKOVÁ – RADEK KOVAŘÍK: DEFORMATION OF WOOD – RESIN PHASE BOUNDARY BY MOISTURE CONTENT CHANGES IN WOOD ...................................................................................
09 MARTIN ŠTOSEL – ALEŠ HÁZ – RICHARD NADÁNYI: BIOMASS FROM THE WOOD PROCESSING INDUSTRY AS A SOURCE OF PHENOLIC COMPOUNDS FOR VARIOUS CHEMICAL APPLICATIONS
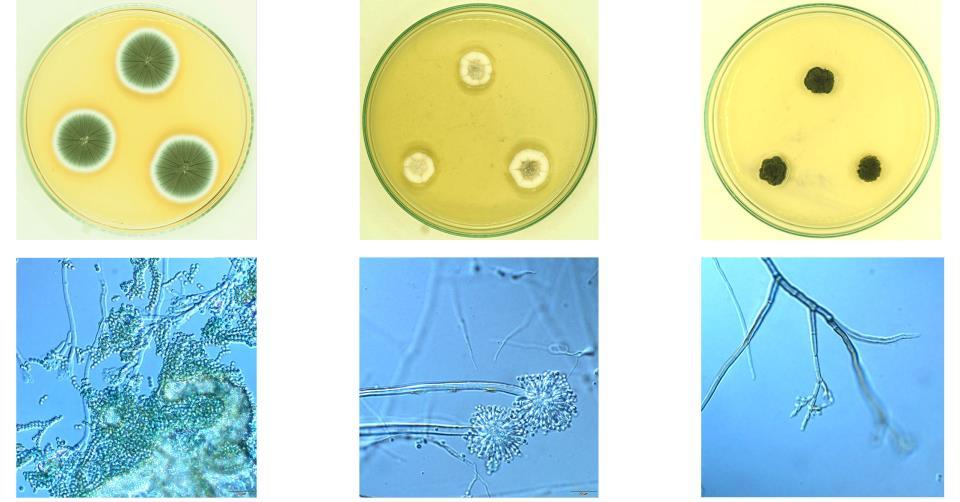
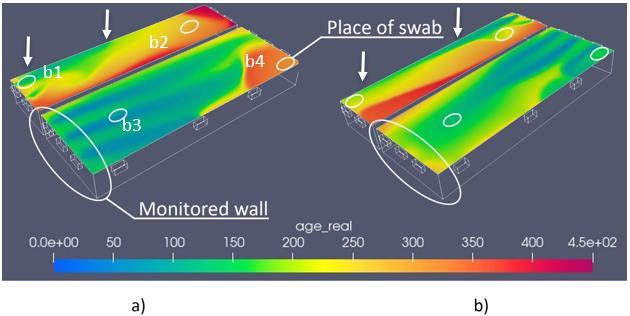
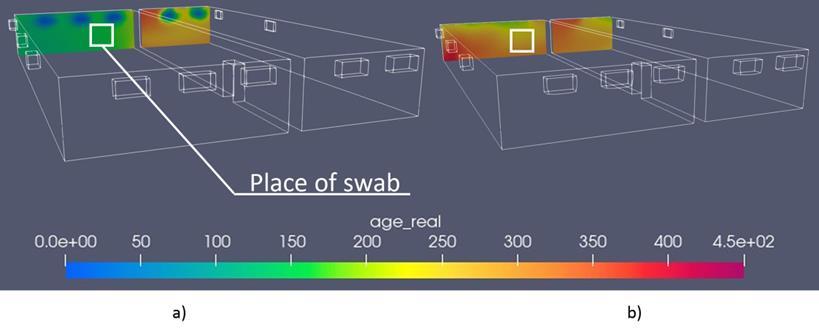
10. SLÁVKA POBUCKÁ – PAVEL KUČÍREK – KAREL ŠUHAJDA –JAN HOLEŠOVSKÝ: FOUNDATION OF TIMBER STRUCTURES –CRAWL SPACE HEAT AND MOISTURE ANALYSIS WITH AIR AGE SIMULATION AND OCCURRENCE OF MICROMYCETES 109
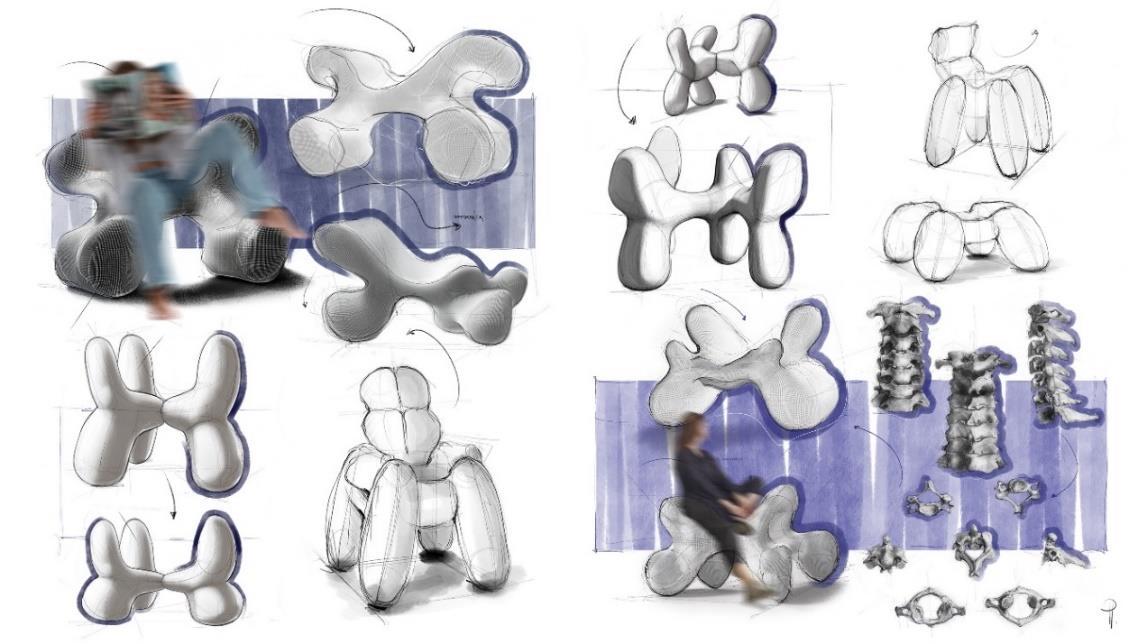
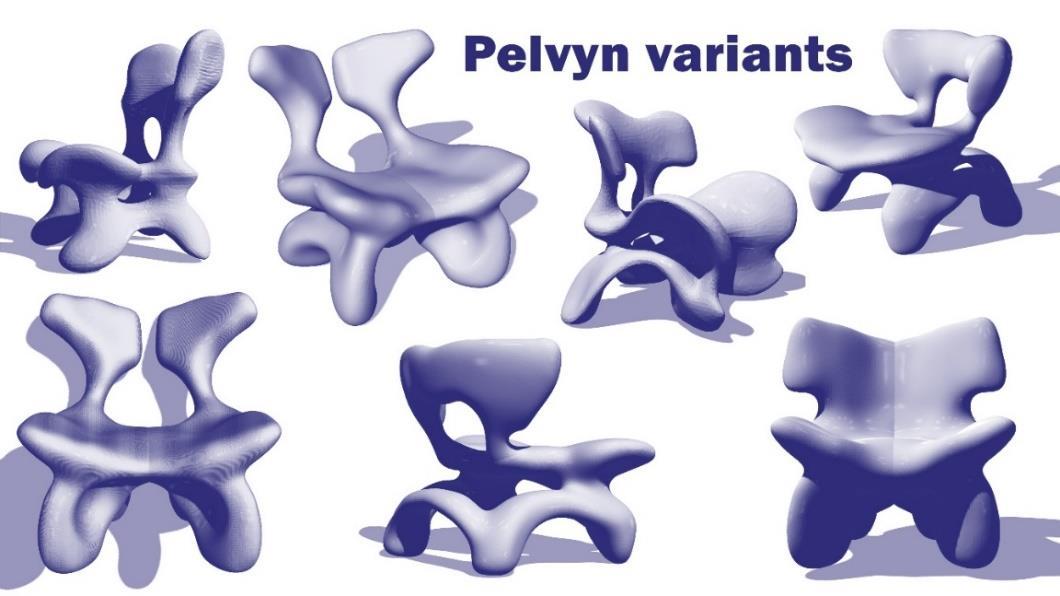
11. PATRÍCIA PANČÍKOVÁ – ZUZANA TONČÍKOVÁ: TYPOLOGICAL – ERGONOMIC EXPERIMENT ........................................
12
ANDREA JANÁKOVÁ SUJOVÁ – ĽUBICA SIMANOVÁ: MANAGING THE CORONAVIRUS CRISIS BY SLOVAK WOODWORKING AND FURNITURE ENTERPRISES IN THE CONTEXT OF AGILE APPROACH – CASE STUDIES
13. ERIKA LOUČANOVÁ – MARTINA NOSÁĽOVÁ: USING ARTIFICIAL INTELLIGENCE IN THE DEVELOPMENT OF MARKETING COMMUNICATION TOOLS FOR A SPECIFIC FURNITURE PRODUCT ..............................................................................
ACTA FACULTATIS XYLOLOGIAE ZVOLEN, 67(1): 5 12, 2025
Zvolen, Technická univerzita vo Zvolene
DOI: 10.17423/afx.2025.67.1.01
COMPARATIVE COLOUR ANALYSIS OF THERMALLY MODIFIED SELECTED TEMPERATE HARDWOODS AND TROPICAL WOOD SPECIES USING PRINCIPAL COMPONENT ANALYSIS
Vidholdová Zuzana – Hýrošová Tatiana
ABSTRACT
Thermal modification is an eco-friendly and cost-effective method for enhancing the optical properties of wood by darkening its colour throughout the cross-section due to chemical changes. In this study, the colour coordinates (L* , a *, b*) of thermally modified temperate hardwoods native to Central Europe were statistically compared to those of selected tropical species. The tested species ‒ European ash, European beech, paper birch, black locust, European hornbeam, and pedunculate oak ‒ were treated at 200°C for 3 hours. The analysis revealed that thermal modification effectively altered their colour, in some cases achieving a visual resemblance to tropical woods. Pedunculate oak and black locust closely resembled wengé, while European beech approximated the appearance of ipé. Other hardwoods only partially matched tropical tones. These findings confirm the potential of thermally modified local hardwoods to substitute tropical species in interior and furniture applications, supporting more sustainable and regionally focused utilization for biological stains
Keywords: colour; hardwood; PCA analysis; thermal modification; tropical wood.
INTRODUCTION
Woodcolouris afundamental physical-optical propertyclassified among macroscopic features that enable the visual differentiation of wood from various tree species. The colour arises from the presence of chromophores ‒ specific functional groups such as carbonyl (>C=O), conjugated double bonds (-CH=CH-CH=CH-, -CH=CH-), and aromatic rings ‒embedded in the chemical constituents of wood, primarily lignin and low-molecular-weight extractives (e.g., pigments, tannins, resins). These chromophores selectively absorb specific wavelengths of the visible spectrum of natural daylight, thereby generating the characteristic surface colour perceived by the human visual system. In addition to interspecific variability, wood colour may also vary within a single tree as a result of heartwood formation, ageing, or environmental and processing factors. (Hon and Minemura, 2000; Babiak et al., 2004; Gandelová et al., 2009; Dzurenda, 2023).
The visual appearance of wood, particularly its texture and colour, plays a crucial role in determining its suitability for interior design and furniture manufacturing (Tolvaj et al., 2013; Slabejová et al., 2016; Dzurenda, 2022). In recent years, there has been increasing interest in modifying the colour of temperate hardwoods to achieve the dark tones typically associated with tropical species. This shift is driven not only by aesthetic considerations but
also by the growing demand for environmentally responsible alternatives to tropical timber, whose harvesting often raises ecological and ethical concerns.
The color of hardwoods varies by species and is determined by the chemical composition of the wood, including cellulose, hemicelluloses, lignin, and extractive substances. While cellulose constitutes the majority of the wood cell wall and is inherently white, its colour is often masked by the hues of extractive substances, which, despite their low weight percentage, can dominate the wood's appearance. Hardwood colors range widely from light to dark shades, with longitudinal surfaces typically used for evaluation, as they are most visible on wooden objects. In contrast, cross-sections are often darker.
Temperatehardwoods without heartwood(e.g.,birch,hornbeam, maple, ash,lime,and aspen) tend to be light or light brown. Denser hardwoods (e.g., oak, pear, alder, walnut, and cherry) and conifer heartwood often exhibit darker colouring due to denser fibre layers, tannins, and other extractive substances. Tropical woods, with higher extractive content, display more intense natural colour, ranging from light yellows and pinks to deep reds, purples, and blacks, as seen in ebony (Hon and Minemura, 2000). Some tropical species, such as bloodwood (Haematoxylum campechianum L.), are so rich in natural dyes that they are used as sources of pigments for textiles and wood. The reddish-brown heartwood of logwood yields a dark red solution, which is utilised for biological stains such as hematoxylin and haematein (Ortiz-Hidalgo and Pina-Oviedo, 2019).
A quantitative assessment of wood colour is commonly conducted using the CIELAB color space (CIE 1976), the most widely adopted system in the wood industry (Katuščák and Kučera, 2000). This system classifies temperate and tropical wood species into the positive octant, with lightness (L*) values ranging from 20 to 90, redness (+a*) from 0 to 20, and yellowness (+b*) from 10 to 30 (Janin, 2001; Babiak et al., 2004). Compared to temperate species, tropical woods occupy a significantly broader section of the color space (da Silva et al., 2017; Meints et al., 2017; Vidholdová and Reinprecht, 2017).
Thermal modification is a well-established technique used to improve certain physical and aesthetic properties of wood. Conducted at elevated temperatures (typically between 160°C and 220°C) in an oxygen-deprived environment, thermal treatment leads to the degradation of hemicelluloses and the formation of chromophoric compounds, resulting in a darker and more homogeneous colour throughout the cross-section. These transformations also enhance dimensional stability and biological durability, making thermally modified wood an attractive material for indoor applications. This treatment modifies the chemical structure of hemicelluloses, cellulose, and lignin, reducing the wood’s hydrophilicity and alteringits properties (Hill 2007; Reinprecht and Vidholdová,2011; Vidholdová et al.,2019; Hill et al , 2021; Sandberg et al., 2021). Numerous studies have explored the effects of thermal treatment on the mechanical, chemical, and optical properties of wood. However, thereislimitedquantitativeresearchcomparingthecolour coordinatesofthermallymodified temperatespecieswith thoseofnaturallydarktropical woods.Such acomparison is essential for evaluating the potential of modified local hardwoods to serve as visual substitutes in high-end applications.
In this study, we investigate the colour changes induced by thermal modification in six temperate hardwood species native to Central Europe. Colour coordinates (L* , a *, b*) were measured before and after treatment at 200°C for three hours. To assess the visual similarity between modified temperate woods and tropical references, Principal Component Analysis (PCA) was applied to the colour data. The aim of this work is to statistically evaluate the effectiveness of thermal treatment in mimicking the colour tones of selected tropical tree species and to contribute to the broader goal of sustainable, locally sourced material substitution in the wood industry.
MATERIALS AND METHODS
Wood Material
The hardwoods used in this study – European ash (Fraxinus excelsior L.), European beech (Fagus sylvatica L.), paper birch (Betula papyrifera Marsh), black locust (Robinia pseudoacacia L.), European hornbeam (Carpinus betulus L.), and pedunculate oak (Quercus robur L. – sourced from round timber felled and processed in Slovakia.Wood samples with dimensions of150×15 × 300mm werepreparedbylongitudinal andtransversesawingfrom the central part of the lumber.
The tropical wood species selected for comparison included ipé (Handroanthus serratifolius), iroko (Milicia excelsa), makoré (Tieghemella heckelii), sapelli (Entandrophragma cylindricum), and wengé (Millettia laurentii). These samples were obtained as naturally dried and conditioned boards, maintained at a temperature of 22 ± 2.5 °C and relative humidity of 65% in a climate chamber for 3 weeks. The boards were purchased from the trading company JAF Holz Ltd., Slovakia.
Heat Treatment Procedure
The heat treatment of native hardwoods was conducted under atmospheric pressure at a temperature of 200 ± 2.5 °C for 3 hours using a laboratory heating oven (Memmert UFB 500, Germany). The treatment was carried out at the Department of Wood Technology, Faculty of Wood Sciences and Technology, Technical University in Zvolen. The process commenced by placing the absolute dry samples in the oven at room temperature, followed by agradual temperatureincreaseover45minutesuntil thedesiredtemperaturewas reached. The samples were maintained at this temperature for 3 hours and subsequently cooled in a desiccator under dry conditions.
Colour Measurements
Colour coordinates were measured using a Colour Reader CR-10 (Konica Minolta, Japan), which operates with a CIE 10° standard observer, CIE standard illuminant D65, and an 8 mm diameter sensor head. Prior to measurement, the samples were conditioned at a temperature of 20°C and an air relative humidity of 60%.The colour of wood was evaluated in the CIELAB colour space, specifically using the coordinates L* (lightness), a* (red-green axis), and b* (yellow-blue axis).
Principal Component Analysis
A multidimensional statistical approach was employed to evaluate the data using Principal Component Analysis (PCA) In this analysis, average values were used for each condition in the time-temperature domain for the colour variables. PCA served to assess the overall structure of the data, identifying relationships and correlations between variables, as well as their relative importance. The method facilitates the detection of statistical outliers and clustering of observations. It consists in reducing the original variables to a smaller number of new (latent) variables. Latent variables were extracted in the form of orthogonal principal components (PCs), which are linear combinations of the original variables. New variables (PCs) are required to reflect as much as possible the original variables. The first component (PC1) accounts for a maximal amount of total variance in the observed variables, the second component (PC2) accounts for a maximal amount of variance in the data set that was not accounted for by the first component PCs reflect the different effects of the original variables. Such effects can be seen from the PCA score plot, which shows the component
score of the two principal components for all observed wood samples. The score plot identifies clusters of similar samples, samples outlying and strongly different from others
Descriptive Statistics
To assess colour variation in wood samples, mean and standard deviation values for L* , a* and b* were calculated. To compare the colourimetric data of selected wood samples, graphical outputs in the form of boxplot were used. The statistical analyses were processed using software Statistica 14
RESULTS AND DISCUSSION
The colour coordinates of the native surfaces of the analysed tropical wood species and thermally modified hardwoods are summarised in Tab. 1. Among the tropical wood species, considerable variation was observed in lightness (L*), which ranged from 34.88 for wengé, representing the darkest material in the set, to 64.50 for iroko, the lightest. This wide rangeillustratesthenaturaldiversityofcolourationfoundamong tropical woods.Alltropical wood species exhibited positive chromaticity values, confirming the presence of red and yellowhues in theirnatural appearance.Specifically,theredness coordinate (a*)rangedfrom 8.00 in wengé to 16.68 in sapelli, while the yellowness coordinate (b*) ranged from 10.34 (wengé) to 25.32 (iroko). These findings are consistent with earlier studies, including those by Meints et al. (2017) and da Silva et al. (2017), which similarly documented high variabilityincolour coordinatesacrosstropicalwoodspecies.Suchvariabilityisoftenlinked todifferencesinextractivecontent,heartwoodformation,andotheranatomicalandchemical features that contribute to each species' distinctive optical properties. Tropical wood species are widely appreciated for their natural beauty, which is often enhanced by their rich colour tones and surface lustre. Their aesthetic attributes, in combination with favourable durability and mechanical characteristics, make them highly desirable in applications such as flooring, decorative veneers, furniture components, and high-end joinery.
woods
Inthegroupofthermally modifiedtemperatehardwoods,thecolourcoordinatesreflect the significant impact of heat treatment. The lightness (L*) of treated samples ranged from
Tab.
35.05 for black locust and pedunculate oak to 58.88 for European hornbeam. These values suggest a notable darkening effect compared to native untreated wood (not shown), a wellknown outcome of thermal processing due to the degradation of hemicelluloses and the formation of coloured degradation products. Like tropical woods, all thermally modified samples also exhibited positive a* and b* values, indicating reddish and yellowish tones. Although these values were generally lower than in tropical wood species, their mutual similarity is noteworthy. These colour shifts are likely related to the thermal degradation of hemicelluloses and the formation of conjugated structures, contributing to the darkening and enhanced chromaticity observed in treated samples (Sandak et al., 2015; Vidholdová et al., 2019; Hill et al., 2021; Sandberg et al., 2021). The observed variation in colour response among species suggests that inherent anatomical and chemical properties, such as density and extractive content, strongly influence the efficiency of thermal treatment in achieving tropical-like hues (Janin, 2001; Babiak et al., 2004; da Silva et al., 2017; Meints et al., 2017; Vidholdová and Reinprecht, 2017; Geffert et al., 2019 and 2020).
The overlap in chromatic coordinates between some thermally treated hardwoods and certain tropical woods suggests that thermal modification can effectively mimic the appearance of exotic species. This resemblance supports the potential of using locally available hardwoods as a visual alternative to tropical timber, reducing dependency on imported materials while promoting sustainable material use. From both ecological and economic perspectives, thermally modified woods offer an attractive solution for applications that require the warm, rich tones typically associated with tropical hardwoods.
Tofurther assess andquantifythedegreeofvisual similarity betweenthestudied wood species, a principal component analysis (PCA) was applied to the colourimetric data (L* , a * , b*). This multivariate approach enables a more detailed exploration of patterns in colour space and facilitates the identification of species clusters based on shared optical characteristics. The results of the PCA provide a complementary statistical basis to support visual observations, revealing the extent to which thermally modified hardwoods approximate the colour profiles of tropical woods.
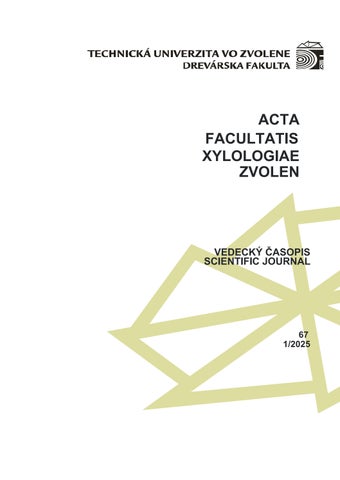
The results of the principal component analysis (PCA) based on the L* , a *, and b* colour coordinates are shown in Fig. 1.
Fig. 1 PCA score plot of tropical and thermally modified wood species.
The first two principal components (PC1 and PC2) together explained 98.93% of the total variancein thedataset, with PC1accountingfor80.31% andPC2for18.62%.This high level of explained variance confirms the suitability of PCA for reducing dimensionality while preserving the essential structure of the data.
The PCA score plot differentiates the tropical wood species from one another, highlighting their distinct colour profiles. Notably, certain thermally modified hardwoods (e.g., black locust and oak) are positioned near wengé, indicating a substantial similarity in their colourimetric characteristics. This supports the assessment presented in Tab. 1 and reinforces the notion that thermal modification can effectively replicate the optical qualities of tropical woods.
Furthermore, the clustering pattern observed in the PCA plot – such as thermally modified European beech aligning with ipé and thermally modified birch resembling more – suggests that colour coordinates alone are sufficient to distinguish between species groups while also revealing overlapping tendencies between selected thermally modified and tropical woods. This finding provides a statistical basis for recommending thermally treated temperate species as a sustainable alternative to tropical timber in decorative and designoriented applications.
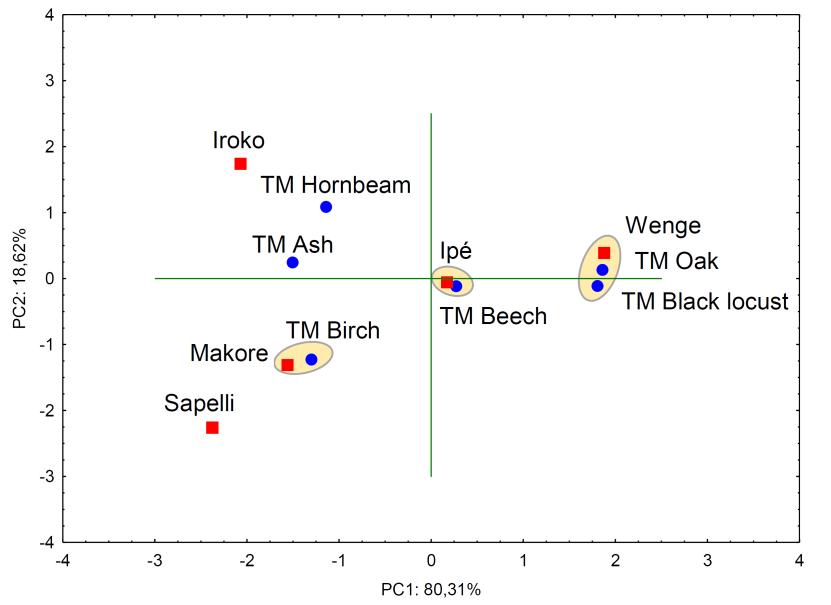
Based on the PCA assessment, four hardwood species thermally treated at 200°C for 3 hours, which exhibited a pronounced visual similarity to selected tropical woods, were positioned near them within the CIELAB space (Fig. 2).
CONCLUSION
The observed colour similarity between thermally modified local hardwoods and tropical wood species demonstrates that heat treatment can effectively alter the visual appearance of temperate wood, bringing it closer to the aesthetic qualities of tropical timber. Based on the experimental assessment, four hardwood species thermally treated at 200 °C for 3 hours exhibited a pronounced colour similarity to selected tropical woods.
Fig. 2 Comparison of CIELAB colour coordinates for tropical and selected modified hardwoods using boxplot visualisation.
Europeanbeech closely resembledipé,whilebirch approximatedmakoré; both pedunculate oak and black locust showed a colour match with wengé. Other thermally modified hardwoods only partially mimicked the appearance of tropical wood species, indicating a need for further optimisation.
To support and visualise these similarities, a principal component analysis (PCA) was performed using L* , a *, and b* colour coordinates. The first two principal components accounted for 98.93% of the total variance, clearly differentiating the tropical wood species and highlighting overlaps with selected thermally modified hardwoods. The PCA score plot confirmed the clustering of European beech with ipé, birch with makoré, and oak and black locust with wengé, providing a robust statistical basis for the visual observations.
These insights are highly relevant for the wood processing and furniture industries, offering opportunities to replace tropical wood species with thermally modified, locally sourced hardwoods, thereby combining aesthetic appeal with improved sustainability Future research should focus on refining treatment parameters ‒ such as temperature, duration, or pre-conditioning ‒ to achieve a closer resemblance for a broader range of species, and to deepen understanding of the link between thermal modification and resulting colourimetric transformations.
REFERENCES
Babiak, M., Kubovský, I., Mamoňová, M., 2004. Color space of the selected domestic species. in Interaction of Wood with Various Forms of Energy, Kurjatko, S., Kúdela, J., Eds.; Zvolen: Technical University in Zvolen, 113–117.
Da Silva, R A F , Setter, C , Mazette, S S , de Melo, R R , Stangerlin, D M , 2017 Colorimetry of wood from thirty tropical species. Ciência da Madeira (Brazilian Journal of Wood Science) 8, 1, 36–41. https://doi.org/10.12953/2177-6830/rcm.v8n1p36-41
Dudiak, M , Kminiak, R , Banski, A , Chuchala, D 2024 The Effect of Steaming Beech, Birch and Maple Woods on Qualitative Indicators of the Surface. Coatings 14, 117. https://doi.org/10.3390/coatings14010117
Dzurenda, L., 2022. Range of color changes of beech wood in the steaming process. BioResources, 17, 1, 1690. https://doi.org/10.15376/biores.17.1.1690–1702
Dzurenda, L., 2023. Natural Variability of the Color of Beech Wood in the Color Space CIE L* a * b* Forests, 14, 6, p.1103. https://doi.org/10.3390/f14061103
Gandelová, L., Horáček., P., Šlezingerová, J., 2009. The science of wood. Mendel University of Agriculture and Forestry in Brno. 176 p.
Geffert, A., Výbohová, E., Geffertová, J. 2019. Changes in the chemical composition of oak wood due to steaming. Acta Facultatis Xylologiae Zvolen, 61, 1, 19–29. https://doi.org/10.17423/afx.2019.61.1.02
Geffert, A., Geffertová J., Dudiak, M. Výbohová, E. 2020. Influence of steaming temperature on chemical characteristics and colour of alder wood. Trieskovea beztrieskove obrabaniedreva 12, 49–56.
Hill, C A , 2007. Wood modification: chemical, thermal and other processes. John Wiley & Sons. Hill, C., Altgen, M. Rautkari, L., 2021. Thermal modification of wood-a review: chemical changes and hygroscopicity. Journal of Materials Science 56, 6581–6614. https://doi.org/ 10.1007/s10853-020-05722-z
Hon, D N -S , Minemura, N , 2000 Color and discoloration. in: WoodandCellulosic Chemistry,2nd ed.; Hon, D.N.-S., Shiraishi, N., Eds.; CRC Press: New York, USA, 385–442. Hrčková, M., Koleda, P., Barcik, Š., Štefková, J., 2018. Color change of selected wood species affected by thermal treatment and sanding. Bioresources 13. https://doi.org/10.15376/biores.13.4.8956-8975
Janin, G., Gonçalez, J.C., Ananías, R., Charrier, B., Silva, G.F.D., Dilem, A., 2001. Aesthetics appreciation of wood colour and patterns by colorimetry. Part 1. Colorimetry theory for the CIE
Lab system. Maderas: Ciencia y Tecnología 3, 14. http://dx.doi.org/10.4067/S0718221X2001000100001
Katuščák, S., Kučera, J., 2000. CIE orthogonal and cylindrical color parameters and the color sequences of the temperate wood species. Wood Research 45, 9–21. Meints, T., Teischinger, A., Stingl, R., Hansmann, C., 2017. Wood colour of central European wood species: CIE Lab characterisation and colour intensification. European Journal of Wood and Wood Products 75, 499–509. https://doi.org/10.1007/s00107-016-1108-0
Ortiz-Hidalgo, C., Pina-Oviedo, S., 2019. Hematoxylin: Mesoamerica’s gift to histopathology. Palo de Campeche (logwood tree), pirates’ most desired treasure, and irreplaceable tissue stain. International Journal of Surgical Pathology 27(1), 4–14. https://doi.org/ 10.1177/1066896918787652
Sandak, A., Sandak, J., Allegretti, O., 2015. Quality control of vacuum thermally modified wood with near infrared spectroscopy Vacuum, 114, 44–48. https://doi.org/10.1016/j.vacuum.2014.12.027
Sandberg,D.,Kutnar,A.,Karlsson,O.,Jones,D.,2021.Woodmodificationtechnologies:principles, sustainability, and the need for innovation. CRC Press.
Slabejová, G , Šmidriaková, M , Fekiač, J , 2016 Gloss of transparent coating on beech wood surface. Acta Facultatis Xylologiae Zvolen 58, 37–44. https://doi.org/10.17423/afx.2016.58.2.04
Tolvaj, L , Persze, L , Lang, E , 2013 Correlation between hue angle and lightness of wood species grown in Hungary. Wood Research 58, 141–145.
Vidholdová, Z , Reinprecht, L , 2011 Thermowood Šmíra-Print, 89 p.
Vidholdová, Z , Reinprecht, L , Iždinský, J , 2017 Microbial resistance of tropical woods Zvolen: Technical University in Zvolen (in Slovak), Technical university in Zvolen, 67 p.
Vidholdová, Z , Sandak, A , Sandak, J , 2019 Assessment of the chemical change in heat treated pine wood by near infrared spectroscopy. Acta Facultatis Xylologiae Zvolen 61, 1, 31–42. https://doi.org/10.17423/afx.2019.61.1.03
ACKNOWLEDGMENT
This work was supported by the Slovak Research and Development Agency under the Contract no. APVV-21-0049 and APVV-21-0051.
AUTHORS’ ADDRESSES
Ing. Zuzana Vidholdová, PhD. Technical University in Zvolen Faculty of Wood Sciences and Technology Department of Wood Technology
T.G. Masaryka 24, 960 01 Zvolen zuzana.vidholdova@tuzvo.sk
RNDr. Tatiana Hýrošová, PhD. Technical University in Zvolen Faculty of Wood Sciences and Technology Department of Mathematics and Descriptive Geometry
T. G. Masaryka 24, 960 01 Zvolen tatiana.hyrosova@tuzvo.sk
ACTA FACULTATIS XYLOLOGIAE ZVOLEN, 67(1): 13 22, 2025
Zvolen, Technická univerzita vo Zvolene
DOI: 10.17423/afx.2025.67.1.02
DIMENSIONAL STABILITY OF BEECH BLANKS IN THE CONTACT DRYING PROCESS
Ivan Klement – Tatiana Vilkovská – Peter Vilkovský
ABSTRACT
Timber drying is a crucial process for a wide range of applications, including machining, processing, and final use. It enhances dimensional stability and improves mechanical and physical properties, as well as biological properties such as resistance to mould and fungal growth. The drying process is influenced by various factors, with primary objectives typically focused on minimising costs, reducing drying time, and achieving acceptable drying quality. Achieving an optimal balance between these objectives requires compromises among the rapid drying techniques. Contact drying has gained attention as a potential solution for speeding up the process. The application of contact drying, utilising heated plates at a temperature of 160°C, is investigated in the study. Three specific pressure levels were examined: 1.0 MPa, 1.4 MPa and 1.8 MPa. The results indicated a substantial increase in sample density during contact drying, with pressure playing a significant role in this effect. Additionally, the variation in sample thickness was more pronounced in tangential samples. Across both radial and tangential orientations, samples subjected to the contact drying method exhibited greater dimensional stability compared to those dried by convection.
Keywords: contact drying; beech blanks; press drying; dimensional stability.
INTRODUCTION
The European beech (Fagus sylvatica L.) is a native species of European forests. It accounts for 11.9% of Europe's forest stock (State of Europe's Forests 2020), with a proportion of 35.4% in Slovakia (Green Report 2023). Beech wood is in demand on the market because of its excellent physical and mechanical properties, good workability, and aesthetic appearance Konopka et al. (2021), Sedliačiková and Moresová (2022), Dudiak et al. (2024). The fundamental technological operations in beech wood processing include drying. This is a demanding hydrothermal process that requires constant attention due to the changes in wood properties during drying, the length of the drying process, the quality of the dried material, as well as its energy and economic demands, as reported in several scientific studies by Blomberg (2006), Kumar (2021) and Dzurenda (2022). After modification (by steaming, thermowood or heat treatment), beech wood acquires higher stability, durability, and extended possibilitiesofuse,including exterior(Tolvaj et al., 2009,Barcík andGašparík 2014, Dzurenda and Dudiak 2021, Suchta et al., 2021, Vidholdová and Slabejová 2021). In addition to the most common warm-air drying of timber and blanks in drying kilns, which is time and energy consuming, other drying technologies such as high-temperature drying
Barański et al. (2017), Klement et al. (2019) and contact drying Schmitdt (1967), Schrepfer and Schweingruber (1998) Kúdela and Rešetka (2012), Klement et al. (2022) and have also received research attention. Press drying or contact drying of wood is a method of wood drying processing. The main objectives of pressing are to increase the wood’s density, enhance its mechanical properties, and create a defined surface relief. The final properties of compressed wood are also strongly influenced by its dimensional stability following the pressing process (Kúdela andRešetka2012).Contact dryingisimplementedin apress where theheat from theheating plates is conductedfrom theupperandlowersurfaces ofthelumber inward towards the centre, in the direction of the plate thickness. Contact drying is a rapid method for removing moisture from wood. However, this quick-drying process and the high temperatures involved can cause changes in the wood, such as darkening its natural colour, and in particular species, severe cracking and honeycombing (Hittemeier et al., 1968, Heebink and Compton 1966). Contact drying offers several benefits, including keeping the wood flat during drying, improving its dimensional stability, reducing inventory requirements, and efficiently utilizing heat energy (Tang et al., 1994).
Significant research efforts by Hittemeier et al. (1968) focused on finding new products and processes to utilise this material better. One promising product is press-dried panelling, as described in a report by the U.S. Forest Products Laboratory. This process, knownas contact drying, involves applying heat to both sides ofa board using heated platens to remove moisture. The drying process typically occurs at temperatures ranging from 120 to230°C,withaplatenpressurebetween1.7MPaand2MPa.Whilecontact dryingprovides good contact with the board, it can result in thickness shrinkage and some defects, such as discolouration, cracks, and honeycombing. However, these colour changes may negatively affect the product for many uses, and the darker colour can even be more desirable than the original wood. The author also states in his work that boards of 1.5 cm thickness were dried to a final moisture content of 6% for about 25-75 minutes, while samples of 2.5 cm were dried for about 100-200 minutes, depending on the type of wood species (oak, ash, elm, beech etc.). from the point of view the density of pressed wood is primarily influenced by the degree of compression and the wood species (Blomberg et al., 2006). According to the authors Blomberg et al. (2006), for seven different wood species, including beech, pressed under constant pressure, the average density values ranged from 750 to 1100 kg·m⁻³, depending on the species; however, for beech wood, the values ranged from 700 to 800 kg·m⁻³. Comparable observations are in concordance with those of Zhou et al. (2018) and Simpson (1983), who researched density by contact drying. Samples were oven-dried temperatures at 115, 135, 160, 185, and 205°C, respectively. The thickness of the sample was dimensions of 50 mm (longitudinal) by 50 mm (tangential). Drying was underway, with the material placed between two plates and a pressure of 3.5 MPa applied in the radial direction. Contact drying created a curve of density: high density at the two surface regions that gradually decreased toward the core region. During contact drying, wood becomes plastic and can undergo large deformation under the combined effects of moisture, high temperature, and mechanical compression. As the drying process progressed, heat and water evaporation gradually moved inward, resulting in the densification of the core layer. Consequently, surface regions in the timber were compressed more than core regions, creating a density profile. Surface regions had a density ranging from 600 to 850 kg· m-³, and the core regions had a density of only between 400 and 450 kg· m-³ for maple wood (Simpson, 1983). Based on the cited work of Unsal and Candan (2008), the density and dimensional stability of lumber can be enhanced through the combined effects of thermal energy and compression treatment. As a result, studying the hot-press drying process of selected trees (pine, fir, poplar) holds significant theoretical value for promoting its efficient
and high-value utilisation. During hot-press drying, heat and mass transfer are critical factors influencing the drying behaviour of wood. The heat from the heating platens is conducted from both the upper and lower surfaces of the lumber inward toward the centre, following the direction of the board’s thickness.
The authors demonstrate that these conclusions were experimentally measured to investigate the effect of heating platens' temperature on the moisture state in poplar lumber with a moisture content (MC) above the fibre saturation point (FSP) during press drying. The maximum temperature and pressure were observed at the centre layer of poplar lumber during hot-press drying. As the temperature increased from 120 to 140 °C, the maximum temperature values rose from 111.2 to 127.3 °C, whereas those of pressure increased from 219.4 to 276.9 kPa. However, a delay occurred between the maximum values of pressure and temperature.
The aim of this article is to examine the effect of contact drying on the density and dimensional stability of wood. Specifically, beech wood, using temperatures of 160°C and under varying specific pressure levels of 1.0, 1.4 and 1.8 MPa.
MATERIALS AND METHODS
Beech wood (Fagus sylvatica L.) was used for experimental measurements. The samples were selected from two beech logs, each with a diameter of 40 cm and a length of 300 cm. The forest is located in the area known as Budča (475 m a.s.l.), which belongs to the University Forest Enterprise of the Technical University in Zvolen, Slovakia.
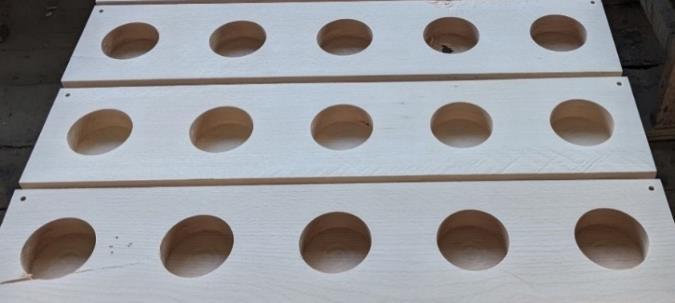
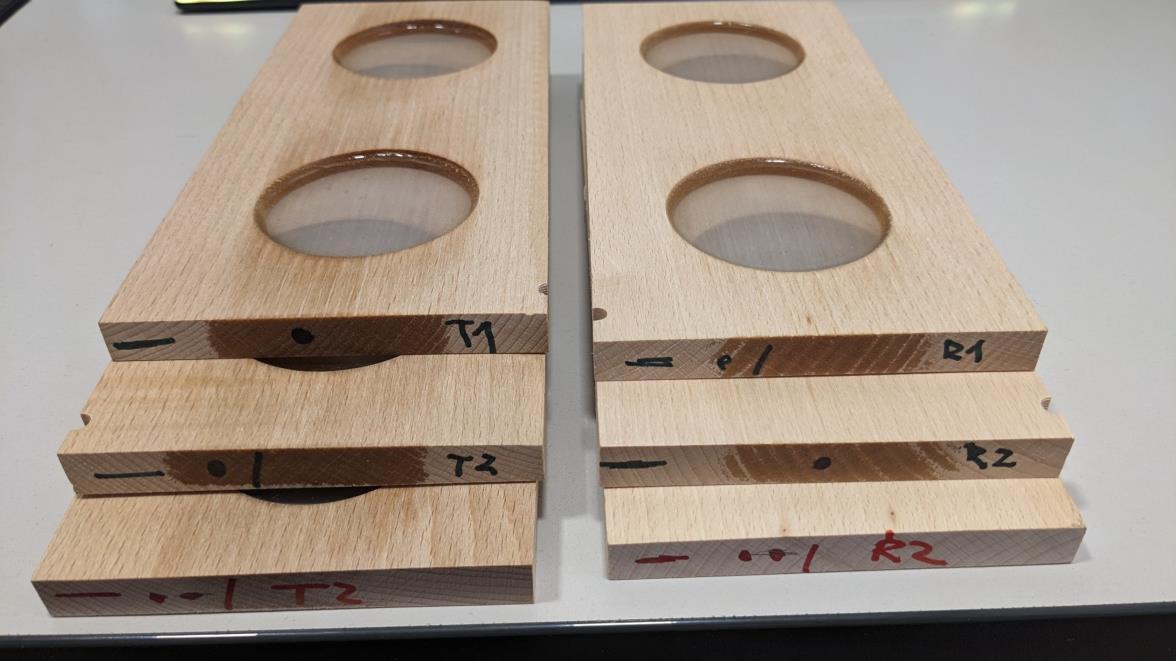
Radial and tangential samples were cut out from the log according to the cant sawing pattern. The dimensions of the drying samples were 120 × 800 × 30 mm (width × length × thickness).
The process of contact drying was conducted in a hydraulic single-storied press type CBJ 500-5 (TOS RAKOVNIK). The temperature of the heating plates was 160 °C. Three specific plate pressures of 1.0, 1.4 and 1.8 MPa were used. The group of samples was dried until the temperature measured at the centre of the sample reached the temperature of the pressing plate (tp = 155 °C). The contact drying was completed at that time.
One filling always consisted of samples from one radial (R) and one tangential (T) log.
The drying mode of contact drying consisted of three phases (I - III.). Samples were dried at a constant temperature (II.) after a gradual rise in temperature (I.) to 160 °C. The cooling phase was (III.) after reaching the desired temperature in the centre of the samples. The final phase was conducted at 20 °C.
Convection hot air drying in the Memmert HCP laboratory dryer was used to compare the changes in the monitored properties of the sample groups. According to ON 490651, the standard drying mode was applied to the given wood species, taking into account its thickness and initial moisture content. The samples were also cut to determine their initial moisture content and density. The initial and final moisture content (MC) of the wood was determined using the gravimetric method, as specified in STN EN 49 0103. The moisture content was calculated using Eq. 1
Where: mw is theweight ofthewet sample(g)and m0 istheweight oftheabsolutedrysample (g)
Oven-dried density was measured before and after contact drying. The measurement was performedunderlaboratoryconditions. Thedensity(ρ0)ofwoodat 0% moisturecontent was measured according to STN EN 49 0108. The oven-dried density was calculated using Eq. 2.
Where: m0 is the weight of oven-dried moisture samples (kg) and V0 is the volume of ovendried moisture samples (m-3).
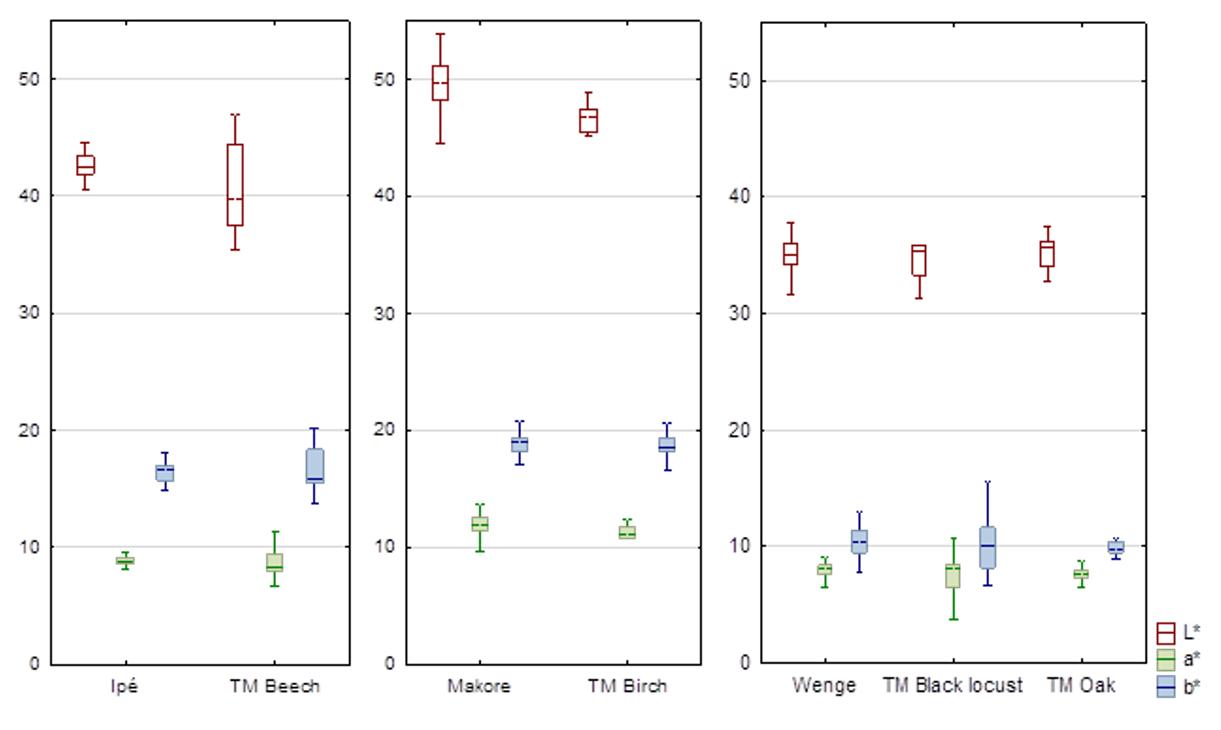
The thickness and width of the samples were measured before and after every contact drying with an accuracy of 0.01 mm. The samples were placed in an air-conditioning chamber at a temperature of 20 °C and a relative humidity of 60% after contact drying. Similarly, samples after convection drying were measured and conditioned. The dimensions of the samples were measured again after conditioning (Fig. 1).
Fig. 1 Scheme of measuring the thickness and width of samples.
All samples were still conditioned to an equilibrium moisture content of ≈20% and then the thicknesses and widths of the samples were measured. From these values, the stabilizing effect of contact drying on the width using the anti-drying factor was evaluated:
Where: bKV swelling of wood in width, dried by convection, transferred from one state of moisture balance to another (%), bKT swelling of wood in width, determined by the contact method, transferred from one wood state of moisture balance to another (%).
Effect of contact drying on thickness:
Where: hKV swelling of wood in thickness, dried by convection, transferred from one state of moisture balance to another (%), hKT swelling of wood in thickness, dried by the contact, method transferred from one state of moisture balance to another (%).
RESULTS AND DISCUSSION
Table 1 presents the measured average values of the initial and final humidity for individual groups of samples, as well as the total contact drying time. The average density values of the samples in the dry state, both before and after drying, are presented, along with an increase in average density resulting from contact drying.
Tab. 1 Initial and final moisture of the samples, drying time, and density of the samples.
It can be seen from the measured data that the initial moisture content of the samples ranged from 54.14%to 80.27%, andthe final moisture contentranged from 3.95% to 6.08%.Drying time was shorter for radial samples, while plate pressure had no effect on drying time, and the effect of sample type was also not significant. The drying time for contact drying is in the range of a few minutes, whereas conventional warm-air drying can take several hours or even days, which makes a significant difference in time requirements. For example, in the case of our sample beech wood, with a thickness of 30 mm and an initial moisture content of approximately 70%, the warm-air drying process would take approximately 169 hours. For a beech sample of the same thickness, the drying time for contact drying was approximately 110 minutes, so it is approximately 85 times shorter. Our measurements confirmed that the density after contact drying ranged from approximately 722 to 786 kg·m⁻³. As a result of contact drying, the density of the samples increased by an average of 92 kg·m-3, while the effect of plate pressure on the density value was confirmed.Alargerincreasein densitywas discoveredforradialsamples (averagevalue 102 kg·m-3). This difference was caused by the direction of the plate pressure. In the case of radial samples, the direction of the pressure was tangential, the densification, and thus the increase in density was greater. For tangential samples, the average value was 83 kg·m-3 . Blomberg et al. (2006) report that density after contact drying ranged from 700 to 800 kg·m-³ for beech wood specifically. As also shown by Jung et al. (1993), contact drying can affect the density of dried samples. According to Kúdela et al. (2018), the density distribution across the specimens in the pressing direction was not similar. The highest density values were observed in the surface layers (1–2 mm), gradually decreasing towards the centre. As the degree of compression increased, the density profiles across the specimen thickness (in the pressing direction) became more identical.
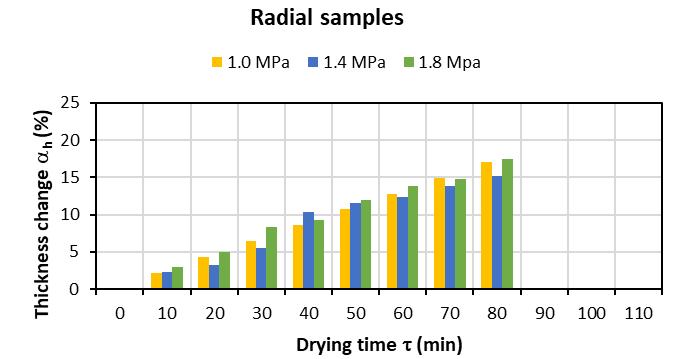
The change in the dimensions of the samples depending on the drying time are shown in Figures 2, 3 and 4.
Fig. 2 Thickness change at different contact drying pressures – radial samples.
In the case of radial samples, the influence of plate pressure was almost insignificant, and the differences in the change in the thickness of the samples at individual pressures were less than 1.0% (Fig. 2). The differences in the change of the thickness of the samples were caused by the fact that the direction of the pressure is in the tangential direction for the radial samples and the radial direction for the tangential samples.
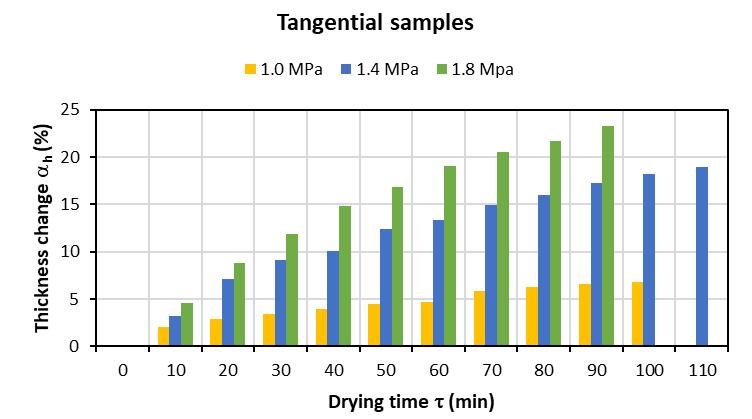
3 Thickness change at different contact drying pressures – tangential samples.
The influence of plate pressure during contact drying was more remarkable for tangential samples, where a thickness change of 6.75% was measured at a pressure of 1.0 MPa and a 23.3% change in thickness at a pressure of 1.8 MPa (Fig. 3).
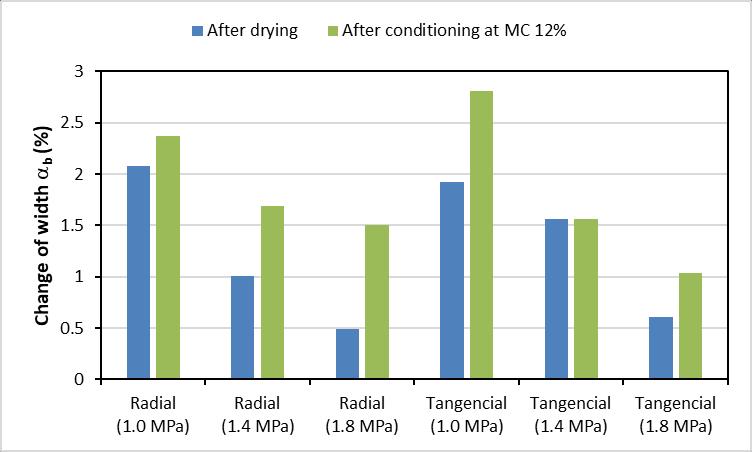
The values of the change in sample width are significantly smaller than the change in thickness (less than 3%). The effect of pressure on the change in width was confirmed for both radial and tangential samples (Fig. 4).
However, the effect of plate pressure is opposite to the change in thickness. As the pressure on the plates increased, the change in the width of the samples decreased. Greater values of the change in width were observed when evaluating the change in this dimension after conditioning the samples to a humidity of 12%. Based on the authors' work by Jung et al. (1993) and Hou et al. (2018), research was conducted on 24 mm thick samples using three species of coniferous wood (pitch pine, larch, and white pine), where the contact was dried under two-platen pressures of 0.17 and 0.34 MPa. The initial moisture content of the samples ranged from 30% to 89%.
Fig.
Results confirmed that an increase in the higher pressure caused thickness shrinkage. Other studies conducted by Kúdela and Rešetka (2012) confirm that dimensional stability is closely related to both the pressing temperature and the pressing time. Their experiments confirmed a noticeable improvement in dimensional stability as the pressing temperature and time were increased. These pressing conditions also resulted in a notable reduction in both the moisture content and the sorption capacity of the pressed wood.
Fig. 4 Width change at different contact drying pressures and samples.
This means that the thick swelling of the samples during contact drying was greater by the indicated Fh values at all pressures compared to convection drying. The bigger difference was with the radial samples. Some authors have also estimated the mechanical properties during contact drying, as shown by the cited work by Klement et al. (2022). The results showed a very favourable effect of contact drying on the change in the observed mechanical properties of beech wood. Increasing the bending strength enhances the use of wood in elements subjected to increased loads. Increasing the hardness of the surface after contactdryingwillallowtheuseofsuchdriedwoodinplaceswithhighstress,suchasfloors. Based onthemeasured changes in thedimensions ofthesamplegroupduringcontact and convection drying, the values of the anti-drying factor were calculated (Tables 2 and 3).
Tab. 2 Dimensional change during contact and convection drying and anti-drying factor: radial samples.
The difference before and after drying (%)
after air
Tab. 3 Dimensional change during contact and convection drying and anti-drying factor: tangential samples.
Measurements
The anti-drying factor F informs the stabilizing effect of contact drying compared to convection drying. The results of Fb mean that for both groups of samples and all pressures. The samples dried using the contact method are more dimensionally stable in terms of swelling than those dried using the convection method, particularly in terms of thickness swelling. The calculated Fh values were negative
CONCLUSION
The objective of this study was to assess the impact of contact drying on the changes in thickness and width of wood samples, as well as their overall dimensional stability and changes in density, depending on the pressure applied during the drying process. Samples with a thickness of 30 mm, exhibiting both radial and tangential grain orientations, were used for the experiment. Drying was performed at a plate temperature of 160°C, with pressures set at 1.0 MPa, 1.4 MPa, and 1.8 MPa. The results were then compared with those of conventional hot air drying.
Based on the data collected, the following conclusions can be drawn:
• contact drying proved to be highly efficient, reaching low final moisture content in a short period. In comparison to warm-air drying, which takes approximately 169 hoursforbeechwoodofthesamethickness, contact dryingshortenedthedrying time to less than 2 hours, approximately 85 times faster;
• radial samples dried faster than tangential samples, while the specific plate pressure had no significant effect on the drying time. During the contact drying process, the density of the samples increased considerably, with plate pressure playing a substantial role in this increase. For radial samples, the density increased by an average of 102 kg·m-3, while for tangential samples, it increased by 83 kg·m-3;
• the average thickness change for radial samples was 16.6%, with no notable effect from the plate pressure. However, plate pressure significantly influenced the thickness change for tangential samples, ranging from 7% to 23%;
• the width change in the samples during contact drying was nearly identical for both radial and tangential samples, with the highest values observed at the lowest plate pressures;
• in terms of dimensional stability during swelling, samples dried by contact drying showed greater stability compared to those dried by the convection method for both radial and tangential samples across all pressure levels;
• thickness swelling was greater forsamples dried by contact dryingcompared to those dried by convection, with the most significant difference observed in the radial samples.
REFERENCES
Barański, J., Klement, I., Vilkovská, T. and Konopka, A., 2017. High temperature drying process of beech wood (Fagus sylvatica L.) with different zones of sapwood and red false heartwood, BioResources 12(1), 1861-1870.
Blomberg, J, Persson, B., and Bexell, Ulf. 2006. Effects of semi-isostatic densification on anatomy and cell-shape recovery on soaking Holzforschung, vol. 60(3), pp. 322331. https://doi.org/10.1515/HF.2006.052
Dudiak, M., Kminiak, R., Banski, A., and Chuchala, D., 2024. The Effect of Steaming Beech, Birch and Maple Woods on Qualitative Indicators of the Surface. Coatings, 14(1), 117. https://doi.org/10.3390/coatings14010117
Dzurenda, L., Dudiak, M., 2021. Cross-correlation of color and acidity of wet beech wood in the process of thermal treatment with saturated steam. Wood Research, 66(1) 105–116. https://doi.org/10.37763/wr.1336-4561/66.1.105116
Dzurenda, L., 2022. Mode for hot air drying of steamed beech blanks while keeping the colours acquired in the steaming process. Acta Facultatis Xylologiae Zvolen. 64(1), 81-88. https://doi.org/10.17423/afx.2022.64.1.07
Dzurenda, L., Dudiak, M., Kučerová, V., 2023. Differences in some physical and chemical properties of beechwood with false heartwood, mature wood and sapwood. Forests 14(6), art. no. 1123.
Dzurenda, L., Dudiak, M., 2024 Homogenization of the Color of Beech Sapwood and False Heartwood by the Steaming Process. Forests, 15, 1009. https://doi.org/10.3390/f15061009
Esteves, B. M., and Pereira, H. M., 2009 Wood modification by heat treatment: A review, Bioresources 4(1), 370-404. https://doi.org/10.15376/biores.4.1.370-404
Forest Europe. State of Europe’s Forests 2020. Bratislava: Ministerial Conference on the Protection of Forests in Europe – FOREST EUROPE, Liaison Unit Bratislava, 2020. https://www.foresteurope.org
Hittemeier. M.E., Comstock G.L., Hann. R.A., 1968 Press drying nine species of wood. Forest Product Journal. 1968. 18(9):91-96.
Jung. S. H., Lee. H. N., Yeo. H., 1993 Press-drying of Plantation Softwood Lumber. Journal of the Korean Wood Science and Technology 21(3)
Klement, I, Vilkovská, T, Uhrín, M, Barański, J., Konopka, A., 2019 Impact of high temperature drying process on beech wood containing tension wood Open Engineering, vol. 9, no. 1, 2019, pp. 428-433. https://doi.org/10.1515/eng-2019-0047
Klement, I., Vilkovský, P., Vilkovská, T., 2020 The Effect of Contact-Drying on Physical Properties of European Beech (Fagus sylvatica L.). Forests 2020, 11, 890. https://doi.org/10.3390/f11080890
Konopka,A.,Chuchala,D.,Orlowski,K.A.,Vilkovská,T.,Klement,I.,2021.Theeffectofbeech wood (Fagussylvatica L.) steaming process on the colour change versus depth of tested wood layer. Wood Material Science & Engineering, 17(6), 420–428. https://doi.org/10.1080/17480272.2021.1942200
Kúdela, J , Rešetka, M., 2012. Influence of pressing parameters on dimensional stability and selected properties of pressed beechwood. I. Dimensional stability and density. Acta Facultatis Xylologiae Zvolen, 54(1): 15−24, Technical University in Zvolen
Kúdela, J., Rousek, R., Rademacher, P., 2018. Influence of pressing parameters on dimensional stability and density of compressed beech wood. European Journal Wood Products 76, 1241–1252 (2018): https://doi.org/10.1007/s00107-018-1298-8
Kumar B, Szepesi LG, Szamosi Z., 2021. Design and development of natural convective solar dryer. Multidiszciplináris Tudományok11(4):144–150. https://doi.org/10.3 592 5/j .multi.2021.4.18
Ministerstvo pôdohospodárstva a rozvoja vidieka Slovenskej republiky. (2023): Zelená správa 2023: Správa o lesnom hospodárstve v Slovenskej republike za rok 2022 [Ministry of Agriculture and Rural Development of the Slovak Republic. (2023): Green Report 2023: Report on Forestry in the Slovak Republic for 2022]. MPRV SR. https://www.mpsr.sk/zelena-sprava-2023/123 19005/
Sedliačiková, M., Moresová, M., 2022. Are Consumers Interested in Colored Beech Wood and Furniture Products Forests 2022, 13, 1470. https://doi.org/10.3390/f13091470
Schmitdt, J., 1967. Press drying of wood. Forest product journal 8(4) pp. 71-76. Schrepfer, V., Schweingruber, FH., 1998. Anatomical structure in reshaped press-dried wood. Holzforschung 52:615–622
Simpson, T. W., 1983. Maintaining timber quality in press drying by manipulating sawing patterns. Wood and Fiber Science. 1984. 16(3): 411-426.
Suchta, A., Barański, J., Vilkovská, T., Klement, I., Vilkovský, P., 2024 The impact of drying conditions on the surface color changes of pine wood BioResources 19(1), 656-669.
STN 490 108: 1993. Wood. Determination of density. Slovak Standards Institute. Bratislava. STN 490 103: 1993.Wood.Determination ofthemoisturecontent ofthephysical and mechanical testing. Slovak Standards Institute. Bratislava. Slovakia.
Tolvaj, L., Németh, R., Varga, D., Molnár, S., 2009 Colour homogenisation of beech wood by steam treatment. Drewno, 52(181), 5–17. http://yadda.icm.edu.pl/yadda/element/bwmeta 1.element.baztech-article-BAT8-0013-0043
Tang, YF , Hart, CA , Simpson, WT , 1994 A numerical model for heat transfer and moisture evaporation processes in hot-press drying, an integral approach. Wood Fib. Sci 26(1),78–90 Unsal, O., Candan, Z., 2008 Moisture content, vertical density profile and Janka hardness of thermallycompressedpinewoodpanelsas afunctionofpress pressureandtemperature.Dry. Technol., 26, 1165–1169
Vidholdová, Z., Slabejová, G., 2021. Colour Stabilisation of Surface of Four Thermally Modified Woods with Saturated Water Vapour by Finishes. Polymers, 13(19), 3373. Zhou, F , Gao., X., Fu.Z., Zhou. Y., 2018 Drying kinetics of poplar lumber during periodic hotpress drying. Drying Technology. https://doi.org/10.1080/07373937.2018.1426597
ACKNOWLEDGEMENTS
This work was supported by the Slovak Research and Development Agency under the Contract no. APVV-21-0049 and work was supported by the Scientific Grant Agency of the Ministry of Education, Science, Research and Sport of the Slovak Republic and the Slovak Academy of Sciences – project VEGA No. 1/0063/22.
AUTHOR´S ADDRESS
prof. Ing. Ivan Klement, CSc. Ing. Tatiana Vilkovská, PhD. Ing. Peter Vilkovský, PhD. Technical University in Zvolen, Faculty of Wood Sciences and Technology, T. G. Masaryka 24, 960 01 Zvolen, Slovakia klement@tuzvo.sk tatiana.vilkovska@tuzvo.sk peter.vilkovsky@tuzvo.sk
ACTA FACULTATIS XYLOLOGIAE ZVOLEN, 67(1): 23 33, 2025
Zvolen, Technická univerzita vo Zvolene
DOI: 10.17423/afx.2025.67.1.03
MODELING AND ANALYSIS OF TEMPERATURE DISTRIBUTION ACROSS THE CROSS-SECTION OF FLAT-PRESSED WOODPOLYMER COMPOSITES DURING COOLING STAGE
Lyutyy – Pavlo Bekhta – Ján Sedliačik
ABSTRACT
This study is aimed at formulating a mathematical model describing the thermal dissipation kinetics during the post-processing cooling of flat-pressed wood-polymer composites (FPWPC). The dependence of the composite cooling time and the spatiotemporal temperature distribution across its thickness on the wood particle content, initial surface temperature, and bulk density are elucidated in the study. Analysis of the core layer thermal profile revealed three distinct phases: an initial temperature rise, a thermal maximum, and a conduction cooling phase. The findings indicate that both the wood particle content and the initial surface temperature of the FPWPC significantly influence the rate of thermal dissipation. Elevated initial surface temperatures (200°C) resulted in an initially accelerated cooling rate followed by a deceleration. Composites with a higher wood particle content (60%) exhibited slower cooling rates, attributed to the lower thermal conductivity of wood compared to the thermoplastic polymer matrix, leading to enhanced thermal retention. The bulk density of the FPWPC plays a critical role in its thermal management, affecting its specific heat capacity, thermal conductivity, and convective heat transfer efficiency. The derived mathematical model has the potential to optimise FPWPC manufacturing processes.
Keywords: flat-pressed wood-polymer composites; post-processing cooling process; cooling time; cooling temperature
INTRODUCTION
Wood–polymer composites (WPCs) are considered promising materials due to their advantageous operational characteristics and broad applicability across various industrial sectors (Klyosov, 2006). WPCs can be manufactured using multiple processes, including extrusion, injection moulding, and compression moulding, depending on the intended geometry and application of the final product (Klyosov, 2006). Among these, extrusion is the most commonly employed method for WPC production in the United States and Europe (Rowell, 2005), primarily used to create continuous profiles with limited crosssectional complexity. In addition to extrusion, WPCs can also be produced via flat pressing in hot presses (Ayrilmis and Jarusombuti, 2011; Benthien and Thoemen, 2012; Lyutyy et al., 2014). This hot-pressing method has been the focus of significant academic research aimed at improving the structural and functional performance of flat-pressed WPCs (FPWPCs) (Ayrilmis and Jarusombuti, 2011; Benthien and Thoemen, 2012; Lyutyy et al.,
Pavlo
2014). Mathematical models have been developed to optimize the hot-pressing process, thereby enhancing efficiency and product consistency (Lyutyy et al., 2024). A critical yet often underexplored aspect of FPWPC production is the post-pressing cooling stage, which plays a crucial role in consolidating the composite final properties. Although some studies refer to this stage simply as the final cooling phase – typically concluding when the material reaches approximately 50 °C – they often lack a detailed examination of key process parameters, such as cooling time and the temperature of the cooling surfaces (Benthien and Thoemen, 2012; Benthien and Thoemen, 2013).
Previous research has investigated optimal cooling strategies for thermoplastic composites in the post-manufacturing phase (Sonmez and Eyol, 2000). One such study focused on determining the most effective cooling regime to reduce processing time during the cooling stage of APC-2 laminate press moulding. Additionally, an experimental investigation examined the thermal dissipation behavior of WPCs that were initially heated to 150°C in an electric furnace and subsequently cooled at ambient conditions (21°C) (Matthews et al., 2015).
Despite the recognized importance of the thermal dissipation stage in the production of flat-pressed wood–polymer composites (FPWPCs), a review of the existing literature reveals a significant gap in research addressing the mathematical modeling of the cooling process in these materials. Therefore, the objective of the present study was to develop a mathematical model capable of predicting the cooling duration of FPWPCs produced in periodical action presses. The goal was to determine the optimal cooling time required for the core layer of the composite to reach the polymer solidification temperature.
MATERIALS AND METHODS
Development of the mathematical model
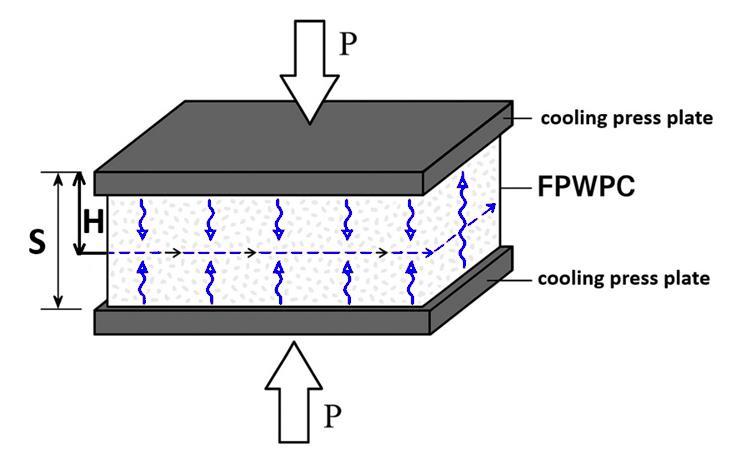
The time required to close and open the press plates, as well as the time to increase and decrease the pressure, are determined by the type of flat pressing equipment and any modifications made to it. Primarily, the cooling time for FPWPC panels is determined by the time to reach a predetermined temperature in the core layer (H) (Fig. 1).
Fig. 1 Cooling model of FPWPC after hot-pressing.
In the case of one-dimensional transient heat conduction, incorporating Fourier’s Law and principles consistent with the Second Law of Thermodynamics, the heat conduction equation takes the following form:
Where: T (x,t) – temperature at point x at time t; α – the thermal diffusivity (α), a property determined by:
Where: λeff – effective thermal conductivity of FPWPC; ρ – density of FPWPC; Cfpwpc –heat capacity of the FPWPC.
FPWPC consists from wood particles and thermoplastic polymer, therefore effective thermal conductivity of FPWPC can be calculated using formula:
Where: λwood and λpol – are the thermal conductivities of wood and polymer, respectively; φwood is the volumetric fraction of wood particles in the composite material, expressed as a fraction.
Therefore, the volumetric fraction of wood particles can be calculated in the following manner:
Where: VWPC is volume of FPWPC and Vwood is the volume of wood particles within the FPWPC.
The thermal conductivities of wood and thermoplastic polymer (in our mathematic we will choose high-density polyethylene (HDPE)) are determined using experimental linear equations (Prisco, 2014):
The specific heat capacity of the FPWPC can be calculated using the following equation:
Where: сW wood and сpol are the specific heat capacities of moist wood particles and thermoplastic polymer, respectively.
Then the specific heat capacity of moist wood particles, considering their moisture content, can be determined as follows (Thoemen and Humphrey, 2005):
The specific heat capacity of a HDPE is temperature dependent and can be calculated by (Gaur and Wunderlich, 1981):
An explicit scheme of the finite difference method is used for the numerical solution. The discretization in time and space is presented as follows.
Spatial distribution:
distribution:
Spatial step:
Where: S – thickness of FPWPC (S = 2 H).
Temporal step:
The discretization of the Fourier equation results in:
Where: Ti n – temperature at the i-th node at the n-th time step; T
– temperature at the adjacent nodes; – dimensionless coefficient.
Subsequently, the initial conditions can be formulated in the following manner. At the onset of the modeling process, the temperature distribution is defined through the thickness of the FPWPC:
And boundary conditions will be:
Within the numerical discretization:
The finite element method (FEM) was employed as the numerical approach for solving the boundary value problem. FEM is based on the principle of approximating a continuous function with a discrete model composed of piecewise constant functions defined over a finite number of subdomains known as finite elements. The geometric domain of interest is discretized into these elements, within which the unknown function is approximated using trial functions. These trial functions are required to satisfy both interelement continuity and the boundary conditions specified by the problem.
To implement the developed model, the Matlab R2021b (9.11) computational environment (MathWorks, Natick, MA 01760-2098, USA) was utilized, specifically the Matlab Partial Differential Equation Toolbox (PDE Toolbox), which supports FEM-based simulations. The toolbox graphical user interface (GUI), accessed via the functions “pdeinit” and “pdetool”, facilitates the interactive setup of the PDE model. This includes defining the geometry of the domain, specifying boundary conditions, selecting the equation type and its coefficients, generating a computational mesh, solving the problem, and visualizing the results.
Given that surface temperature after pressing, wood mass fraction, and board density are variable factors in the cooling process, a custom Matlab function, “calculate.m”, was developed. This function accepts these parameters as input and returns numerical simulation results, specifically, temperature distributions at the mesh nodes over time, presented in matrix form.
Graphical representations of the simulated data were generated for an FPWPC sample with a thickness of 18 mm, assuming a constant cooling platen temperature of 25 °C. The initial temperature of the core layer was set at 120 °C. The simulation was concluded when the temperature at the composite core decreased to 50 °C. The moisture content of wood particles was 3%.
The parameters used in the simulation of the FPWPC cooling model are summarised in Table 1.
Conditions
Initial surface temperature (оС)
Wood particles content, (%)
Density of FPWPC (kg/m3)
Values
160, 180, 200
20, 40, 60
800, 900, 1000
RESULTS AND DISCUSSION
The execution of the mathematical model yielded a plotted relationship illustrating the dependence of the FPWPC cooling time on its initial surface temperature, as well as the spatiotemporal temperature distribution across the material cross-section throughout the entire cooling cycle (Fig. 2).
Tab 1 Variable parameters
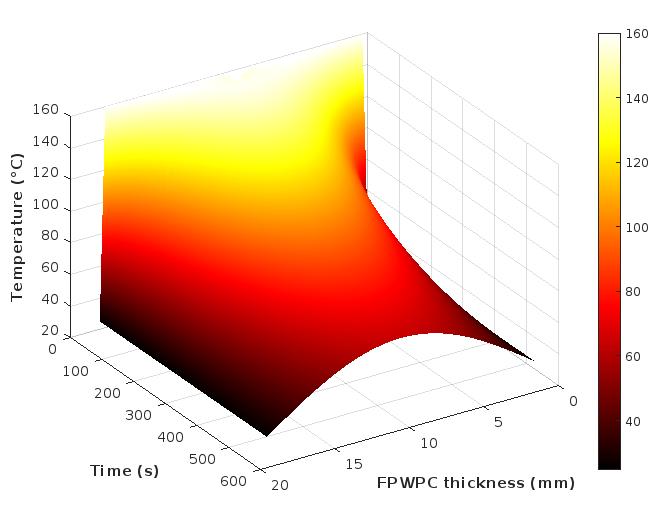
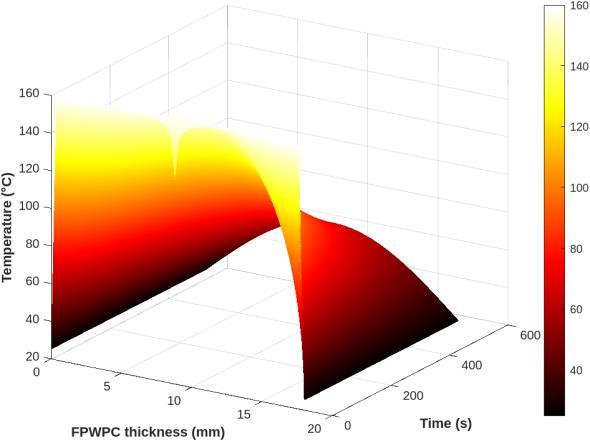
Fig. 2 Temperature distribution within the FPWPC across its thickness until the internal temperature reaches 50 °C, with an initial surface temperature of 160 °C and a composite density of 1000 kg/m³.
The non-uniform cooling behavior of FPWPC along its thickness is evident and results from the varying heat transfer rates in different layers of the composite. At the onset of the cooling phase, the surface regions exhibit the highest temperature, corresponding to the press plate temperature during the hot-pressing stage. In contrast, the core layer initially exhibits a lower temperature – approximately 10 °C above the fusion temperature of the thermoplastic polymer (Lyutyy et al., 2024). However, as cooling progresses, the surface layers are the first to experience a temperature drop, while the core temperature continues to rise due to thermal inertia. This heat redistribution from the surface to the core creates a steep temperature gradient across the thickness of the material.
Temporally, the cooling of the FPWPC core layer can be divided into three distinct phases:
1. initial temperature rise (0~40 s);
2. thermal maximum (~40~60 s);
3. convective cooling phase (~60~800 s)
In the first phase – the initial temperature rise (0~40 s) a rapid increase in the core temperature is observed, particularly during the first 10–20 seconds. This occurs due to the significant temperature difference between the hotter surface layers and the cooler core. As heat from the surface begins to conduct inward, the core temperature increases sharply, driven by the established thermal gradient. The rate and duration of this temperature rise are influenced by factors such as the initial surface temperature, wood particle content, and bulk density of the FPWPC (Fig. 3). A greater temperature gradient between the surface and the core layers leads to a more extended transition period before the composite enters the cooling phase proper. It is important to note that the core temperature does not rise instantaneously; instead, it increases progressively as thermal energy accumulates in the upper layers before being conducted inward.
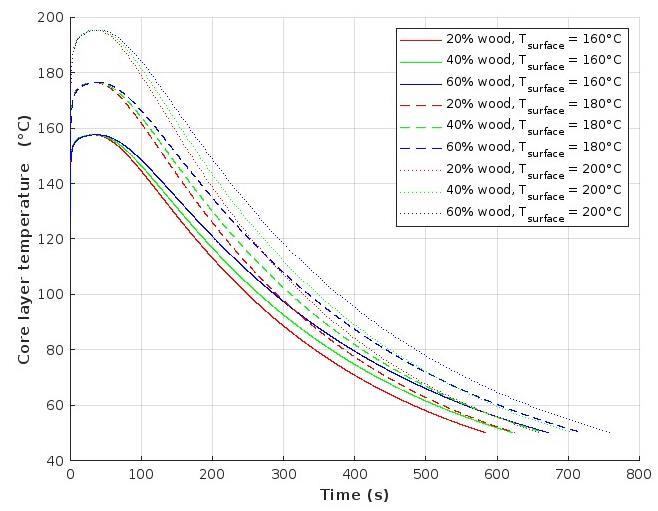
Fig. 3 Temperature distribution curves in the core layer of FPWPC over time at different initial surface temperatures and wood particle content, at a composite density of 1000 kg/m3 .
The second stage of the cooling process, referred to as the thermal maximum phase (~40–60 s), is characterized by the attainment of a peak temperature within the core layer of the FPWPC. This peak occurs as a result of delayed heat transfer into the core, a phenomenon governed by the thermal inertia of the composite. Initially, heat accumulates in the surface layers due to their direct exposure to the hot press plates. As the cooling process begins, this accumulated heat gradually diffuses inward, resulting in a temperature rise within the core and ultimately forming a distinct temperature peak.
Once the temperature in the core layer reaches its maximum, heat begins to dissipate more rapidly due to two simultaneous processes:
The part of the heat is transferred from the core to adjacent, cooler layers;
The surface of the composite, already in contact with the press cooling plates, begins to cool, reducing the thermal influx into the interior.
As a result, the core temperature gradually begins to decline, marking the transition to the third cooling phase. Notably, the magnitude and timing of the thermal peak are strongly influenced by both the initial surface temperature and the wood particle content of the FPWPC. A higher initial surface temperature (e.g., 200 °C) results in a more pronounced and earlier peak. Similarly, increasing the wood particle content delays the thermal maximum and elevates its magnitude due to the wood lower thermal conductivity compared to the thermoplastic matrix. For instance, at 20% wood content, the temperature peak is lower, and cooling begins sooner, whereas at 60%, the peak is higher and occurs later, indicating enhanced heat retention.
This phase can be further subdivided into three sub-phases:
Rapid temperature peak, especially for composites with high initial surface temperatures (e.g., 200 °C);
Gradual temperature stabilization, where the rate of increase levels off;
Onset of temperature decline, indicating transition into the cooling phase.
The third stage – the cooling phase (~60–800 s) begins once the core temperature peaks and subsequently decreases exponentially. The core does not cool instantaneously; instead, heat continues to transfer into deeper layers before being entirely dissipated. During the early stages of this phase, a significant temperature gradient exists between the composite surface and the press plates, driving rapid heat transfer. However, as this gradient diminishes, the cooling rate progressively slows. This transition typically occurs between 300 and 400 seconds.
The cooling rate in this phase remains dependent on both the initial surface temperature and wood content. FPWPCs with higher initial surface temperatures cool rapidly at first but exhibit slower rates later in the cycle. Meanwhile, composites with higher wood content (60%) exhibit slower overall cooling due to wood's lower thermal conductivity and greater thermal mass. As cooling progresses, the temperature curves of the core layer gradually converge toward an asymptotic value, stabilising around 50°C, indicating the completion of the cooling process.
The time evolution of this phase can be divided into two distinct sub-phases:
- Fast cooling (~160~300–400 s): Characterized by a rapid temperature drop accounting for approximately 50–70% of the total cooling time;
- Slow stabilization cooling (~300–400–800 s): The rate of cooling diminishes as thermal gradients decrease and the temperature in the core layer approaches equilibrium. Eventually, the core layer temperature stabilizes at a temperature close to the target threshold of 50 °C.
A comparison of the model-generated cooling curves with the experimental results reported by Matthews et al. (2015) reveals a substantial similarity. In their study, the cooling curve was divided into two distinct curves based on observations of different cooling rates near the melt temperature of 125 °C. Initially, the cooling rate decreased rapidly until it reached the hot-melt temperature of 125 °C of the composite material. We can see the same cooling dynamics in the curves shown in Fig. 2. At the beginning of the process, the surface layers of the WPC cool rapidly with a gradual transfer of heat to the inner layers, as a result of which the cooling process slows down and transitions to the slow stabilization cooling phase. However, it is essential to note that the referenced study measured surface temperatures under ambient cooling conditions, whereas the present model simulates forced cooling between press plates – conditions more representative of industrial FPWPC production.
In a study by Grzybek et al. (2024), the panel ability to absorb and release thermal energy of bio-based composites using sawmill by-products, recycled paper, and biobinders was investigated. During the cooling process, it is observed that all investigated samples start to cool down until they reach the phase transition temperature (solidification temperature), at which the samples start to change phase from liquid to solid. The starting temperature of the cooling process was 40 °C, and then it was placed in a climate chamber with a temperature set at 0°C. The cooling curves are similar to the last stage of FPWPC.
Similar cooling curves were also observed by García-Martínez et al. (2025), but in this case, cooling took place in an autoclave under pressure. At the same time, the material used for testing was a carbon fibre H-beam. Both experimental and model processes were investigated. The results show that both pressure and temperature variation curves follow a physically consistent pattern, confirming that the model operates correctly.
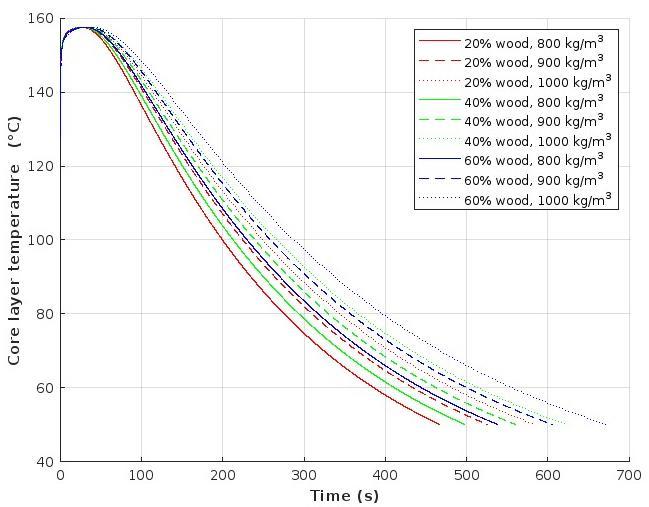
Additionally, the simulation revealed that composites with higher bulk densities (e.g., 1000 kg/m³) cool more slowly than those with lower densities (e.g., 800 kg/m³) due to their increased thermal mass and reduced heat transfer efficiency (Fig. 4).
Fig. 4 Curves of temperature distribution in the core layer of FPWPC in time at different densities and contents of wood particles and at an initial temperature of the composite surface of 160 oC.
Further insights results are supported by the findings of Deliiski et al. (2024), who investigated the thermal energy components necessary for thawing logs. Their study presents a comprehensive model for calculating the specific heat capacity and latent heat components of wood during phase transitions from a frozen to an unfrozen state. In the context of FPWPC cooling, the temperature range remains above freezing, and the understanding of energy components from thawing logs helps clarify the complex interplay of heat transfer, storage, and phase-related thermal inertia in wood-containing composites. This observation aligns with the non-uniform cooling profiles observed in the FPWPC cross-section, where surface layers cool faster while the core retains heat longer due to delayed thermal diffusion.
This behavior can be attributed to the fact that as the density of the FPWPC increases, so does its mass and, consequently, its capacity to store thermal energy. As a result, denser composites require more time to dissipate the accumulated heat, leading to a slower cooling rate. Although materials with higher density often exhibit greater thermal conductivity, promoting faster internal heat transfer, the increased heat capacity frequently outweighs this effect. Therefore, the net effect is that denser FPWPCs tend to cool more slowly than their less-dense counterparts.
CONCLUSION
It was observed that the cooling of flat-pressed wood-polymer composites (FPWPCs) is a non-linear process characterized by an initially rapid temperature drop followed by a gradual deceleration. One of the key factors influencing the cooling rate is the wood particle content. An increase in wood content leads to a reduction in thermal conductivity, thereby slowing down heat transfer and prolonging the cooling duration of the composite inner layers. In addition to the wood content, the thickness of the FPWPC significantly
impacts its cooling behavior. While the surface layers cool rapidly due to direct exposure to the cooling plates, the core retains heat for a more extended period, resulting in a pronounced delay in reaching thermal equilibrium. The initial surface temperature also plays a critical role. A higher initial surface temperature extends the pre-cooling phase, delaying the onset of actual cooling in the core. However, once cooling begins, composites with higher initial temperatures exhibit a faster initial cooling rate due to the larger temperature gradient. This effect is temporary, as a noticeable slowdown typically occurs between 300 and 400 seconds into the cooling process. The bulk density of the FPWPC further influences cooling performance by affecting its heat capacity, thermal conductivity, and overall heat dissipation efficiency. Lower-density composites cool more rapidly, while higher-density composites retain heat for longer durations. This difference becomes especially pronounced after approximately 100 seconds of cooling when thermal inertia in denser materials begins to dominate the process. The developed mathematical model can be applied to calculate the cooling time of flat-pressed wood-polymer composites (FPWPCs) fabricated with various thermoplastic polymer matrices.
REFERENCES
Ayrilmis, N., Jarusombuti, S., 2011. Flat-pressed wood plastic composite as an alternative to conventional wood based panels. J. Compos. Mater. 45, 103–112. https://doi.org/10.1177/0021998310371546
Benthien, J.T., Thoemen, H., 2012. Effects of raw materials and process parameters on the physical and mechanical properties of flat pressed WPC panels. Compos. Part A-Appl. S., 43(3), 570–576. http://doi.org/10.1016/j.compositesa.2011.12.028
Benthien, J.T., Thoemen, H., 2013. Effects of agglomeration and pressing process on the properties of flat pressed WPC panels. Journal of Applied Polymer Science, 129(6), 3710-3717. https://doi.org/10.1002/app.39155
Deliiski, N., Dzurenda, L., Angelski, D., Vitchev, P., Atanasova, K., 2024. Calculation of the thermal energy and its components required for thawing logs Acta Facultatis Xylologiae Zvolen, 66(1), 5–16. https://doi.org/10.17423/afx.2024.66.1.01
García-Martínez, Á., Fernández-Jiménez, A., González-Caballín Sánchez, J.M., GutiérrezTrashorras, A.J., 2025. Thermal effects of cooling dynamics in autoclave processing on composite materials. The International Journal of Advanced Manufacturing Technology, 137(5), 2979–2989. https://doi.org/10.1007/s00170-025-15346-9
Grzybek, J., Nazari, M., Jebrane, M., Terziev, N., Petutschnigg, A., Schnabel, T., 2024. Enhancing fire safety and thermal performance: Wood composites with bio-based phase change materials and fire retardants for building applications. Fire and Materials, 48(8), 838–846. https://doi.org/10.1002/fam.3238
Gaur, U., Wunderlich, B., 1981. Heat capacity and other thermodynamic properties of linear macromolecules. II/ Polyethylene. Journal of Physical Chemistry, 10(1), 119–152.
Klyosov, A.A., 2007. Wood plastic composites. John Wiley & Sons, Hoboken, New Jersey. Lyutyy, P., Bekhta, P., Sedliacik, J., Ortynska, G., 2014. Properties of flat-pressed wood-polymer composites made using secondary polyethylene. Acta Fac. Xylologiae Zvolen, 56(1), 39–50. Lyutyy, P., Bekhta, P., Protsyk, Y., Gryc, V., 2024. Hot-Pressing Process of Flat-Pressed WoodPolymer Composites: Theory and Experiment. Polymers, 16(20), 2931; https://doi.org/10.3390/polym16202931
Matthews, S., Toghyani, A.E., Eskelinen, H., Kärki, T., Varis, J., 2015. Manufacturability of Wood Plastic Composite Sheets on the Basis of the Post-Processing Cooling Curve. BioResources, 10(4), 7970–7984. https://doi.org/10.15376/biores.10.4.7970-7984
Prisco, U., 2014. Thermal conductivity of flat-pressed wood plastic composites at different temperatures and filler content. Science and Engineering of Composite Materials, 21, 2, 197–204. https://doi.org/10.1515/secm-2013-0013
Rowell R.M., 2005. Handbook of wood chemistry and wood composites. Boca Raton: CRC Press. Sonmez, F. O., and Eyol, E., 2002. Optimal post-manufacturing cooling paths for thermoplastic composites, Compos. Part A-Appl. S. 33(3), 301–314. https://doi.org/10.1016/S1359835X(01)00133-6
Thoemen, H., Humphrey, P.E., 2005. Modeling the physical processes relevant during hot pressing of wood-based composites. Part I. Heat and mass transfer. Holz als Roh- und Werkstoff, 64(1), 1–10. https://doi.org/10.1007/s00107-005-0027-2
ACKNOWLEDGMENT
This research was funded by the Czech Science Foundation (GAČR), project no. 25-18154S “Research on renewable thermoplastically bonded wood composites as new formaldehyde-free materials in construction”. This work was supported: by the EU NextGenerationEU through the Recovery and Resilience Plan for Slovakia under project No. 09I03-03-V01-00124, and by the Slovak Research and Development Agency under the contracts No. APVV-18-0378, APVV-220238, by the projects VEGA 1/0450/25 and VEGA 1/0077/24.
AUTHORS’ ADDRESSES
Dr. Pavlo Lyutyy
(1) Ukrainian National Forestry University, Department of Wood-Based Composites, Cellulose and Paper, 79057 Lviv, Ukraine
(2) Green Cotton Group A/S, 7430 Ikast, Denmark lyutyj_p@nltu.edu.ua
prof. Ing. Pavlo Bekhta, DrSc.
(1) Ukrainian National Forestry University, Department of Wood-Based Composites, Cellulose and Paper, 79057 Lviv, Ukraine
(2) Technical University in Zvolen, 960 01 Zvolen, Slovakia
(3) Mendel University in Brno, 613 00 Brno, Czech Republic bekhta@nltu.edu.ua
prof. Ing. Ján Sedliačik, PhD. Technical University in Zvolen, Department of Furniture and Wood Products, 960 01 Zvolen, Slovakia jan.sedliacik@tuzvo.sk
ACTA FACULTATIS XYLOLOGIAE ZVOLEN, 67(1): 35 48, 2025
Zvolen, Technical University in Zvolen
DOI: 10.17423/afx.2025.67.1.04
OF CNC MILLING ON THE SURFACE QUALITY OF BEECH PLYWOOD
Veronika Šugárová – Lukáš Adamčík – Richard Kminiak
ABSTRACT
The milling process is one of the most used methods for machining wood and wood-based materials. This paper is focused on the analysis of the effect of technical and technological parameters on the surface quality of plywood. Beech plywood was used in the experiment, and the samples were machined using a 5-axis CNC machining centre under different feed speed settings and tool variations. Surface roughness (Ra, Rz, Rp, and Rv) was measured using a Keyence VHX-7000 digital microscope. The results show that by an appropriate combination of technical and technological parameters, it is possible to minimise surface roughness and eliminate defects such as fibre pull-out, fuzziness or surface irregularities. The paper contributes to a better understanding of the relation between CNC milling parameters and the resulting surface quality, thereby providing valuable information for optimising the production process in the woodworking industry.
Keywords: surface roughness; CNC milling; Keyence VHX microscope; plywood; feed speed; tool geometry.
INTRODUCTION
CNC wood milling is currently a key research topic in the field of wood science (Atanasov, 2021). With technological advancements, this woodworking method is being increasingly applied in industry, resulting in a growing number of CNC machines in woodworking enterprises (Hanincová et al., 2024a).
A wide range of adjustable parameters requires optimisation, which can be aimed at, for example, reducing the energy consumption of CNC machining (Bal et al., 2022). The key factor remains primarily the surface quality of the material after milling (Aras and Sofuoğlu, 2024, Demir et al., 2022). Research by Hanincová et al. (2024b) demonstrated that the optimal combination of cutting tools and correctly set milling parameters results in reduced cutting forces, leading to less tool wear, lower energy consumption, and improved surface quality. One of the most important adjustable factors affecting the quality of machining is the feed speed, as noted by Bendikiene and Keturakis (2016), Smajic and Jovanovic (2021), and Çakiroğlu et al. (2019), as well as the tool speed. These then act on parameters such as cutting speed (Sedlecký et al., 2018) and feed per tooth (Demir et al., 2022). The most significant influences on the quality of the milled surface are feed speed and rotational speed (Pinkowski et al., 2018; Singer and Özşahin, 2022). At the same time, research has shown that at higher feed speeds, there is an increase in surface roughness
(Csanády et al., 2015; Yang et al., 2023). In addition to these parameters, however, some factors cannot be directly regulated but have a significant impact on the final quality of the milled surface. These include cutting-edge wear Djurković et al. (2019), Koleda et al. (2019), as well as the natural physical properties of wood, such as its hardness and moisture content Benkreif et al. (2021).
In addition to surface roughness, a significant defect is delamination, which negatively impacts the quality of wood material processing. In production, it represents an error, often leading to the exclusionoftheworkpiece. It manifests as theseparation ortearingofmaterial layers, most often in the area of the edges, which leads to a violation of the product's structural integrity and aesthetic properties. (Pérez-Salinas et al., 2023). This phenomenon is particularly critical when machining multi-layer materials such as plywood, where individual veneers can separate due to the action of cutting forces (Pérez-Salinas et al., 2023). Increased tool wear and inappropriate settings of milling parameters can lead to an increase in the rate of delamination (de Castro Saiki and Gomes, 2024; Szwajka and Trzepieciński, 2016).
This paper is focused on evaluating the processing quality unevenness that would be acceptable for downstream operations. The aim is to achieve a level of unevenness that is acceptable for downstream operations, such as sanding. The objective of setting the technological parameters of the CNC machining centre correctly is to minimise the formation of torn fibres, which can lead to the delamination of layered materials, surface fuzziness, and tool traces. In the paper, the roughness of the milled surface of 11-ply beech plywood was quantified at different CNC feed speed settings of a 5-axis machining centre and with three types of tool-shank spiral milling cutters featuring positive, negative, and positive-negative helix.
MATERIALS AND METHODS
Sample preparation before CNC milling
The material used in this experiment was beech (Fagus sylvatica L.) 11-layer plywood (JAF HOLZ Slovakia s.r.o., Špačince, Slovakia) with dimensions of 15 mm × 1 250 mm × 2 500 mm (thickness × width × length). The plywood used was of BB quality, i.e. with a repaired surface and occasional fused lumps. Before cutting, the plywood was stored indoors, achieving an equilibrium moisture content of between 8 and 10 % (measured by the gravimetric method). The samples were cut using a sliding table saw with a scoring blade, and their dimensions (were 15 × 70 × 400 mm). The purpose of using a scoring blade was to achieve saw blade cut quality on both sides (i.e. no torn fibers on the underside of the sample). Dimensions were selected in consideration of the clamping system of the CNC machining centre. The aim was to ensure clamping stability and reduce the vibration of the loose ends of the samples during machining. A total of 36 samples were prepared.
CNC Sample Milling
The samples were milled using a 5-axis CNC machining centre SCM Tech Z5 (SCM Group S.p.A., Rimini, Italy). The samples were fixed with the VCMC-S4 12-80 combined mechanical-vacuum clamping system (Schmalz GmbH, Glatten, Germany), which ensured stable clamping during machining (Fig. 1 b)). Three types of IGM (IGM nástroje a stroje s.r.o., Praha, Czech republic) shank spiral milling cutters were used for machining: with a positive helix (IGM 193, HWM; Z3), with a negative helix (IGM 194, HWM; Z3) and with acombinedpositive-negativehelix(IGM190;HWMZ2)(Fig.1 a)).Alltoolshadadiameter
of 10 mm, with the positive and negative cutters having three teeth, while the positivenegative cutter had two teeth. The position of the positive-negative helix geometry was varied in the middle of the plywood edge (to achieve the best possible quality on both sides). All tools had a total length of 90 mm, with a cutting edge length of 42 mm, and were made of tungsten carbide. It is well known from studies that the final quality of the milled surface is also affected by the number of teeth (Budakçı et al., 2011, Kminiak 2014). The tools were clamped in a GM 300 HSK63F hydrodynamic chuck (Gühring KG, Albstadt, Germany). This chuck features higher tool clamping accuracy, which reduces tool run-out, improves machining accuracy, and minimises surface unevenness. Each tool was first run-in by milling so that the results were not distorted by the initial wear of the cutting edge (stabilisation).
Climb (down) milling was chosen due to the setting of the CNC machine and the direction of the movement of the cutter. In the case of climb milling, the tool rotates in the direction of the workpiece's feed (Kopecký et al., 2019a, Korčok et al., 2018). According to thestudybyŚmietańska et al. (2020),however,climbmillingcancausehigherdelamination. Accordingto Siklienka et al. (2017),climb millinghas abeneficial effect oncutting stability, as cutting forces are directed into the material, reducing the occurrence of vibrations and the risk of workpiece deformation. According to (Darmawan et al., 2018), the surface roughness is lower in climb milling compared to conventional milling due to lower cutting forces. Each sample was machined in two tool passes with a layer thickness of ae = 1 mm, which corresponds to the finishing milling process. The first pass of the milling cutter was equalising (removing unevenness after sawing and creating a flat surface), and the second pass removed a constant layer, making the unevenness characteristic of milling. With the removed material, the thickness of the cutting forces is reduced, resulting in a smoother surface. The susceptibility to fibre chipping is also reduced. The set feed speeds were 6, 10, 14 and 18 m·min-1, while the rotational speed was fixed at 20,000 rpm – the maximum value defined by the CNC machine and the tools used. This speed was selected to achieve the smallest feed per tooth and the smallest chip thickness, which, together with the amount of material removed, also affects the cutting force. The lower the cutting force, the lower the assumption of unevenness on the surface (Guo et al., 2021).

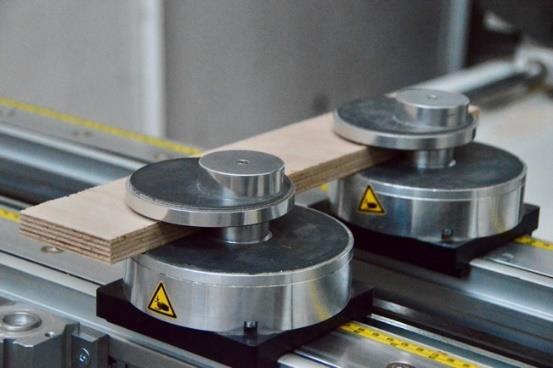
Surface Roughness Measurement
Theroughness was evaluatedwith aKeyence VHX-7000digitalmicroscope(Keyence Corporation, Osaka, Japan). The milled edge of the samples was scanned using five evenly spaced scans, each measuring 4 mm × 18 mm. All scans were taken at 100× zoom using a VH-Z100R lens. First, the longer side of the scanning area was oriented perpendicular to the
Fig. 1 Finishing spiral milling cutters with positive-negative, positive and negative helix (a); VCMC-S4 mechanical-vacuum clamps with clamped sample (b).
plane of the board (Fig. 2). From previous experiments, it was found that unevenness in this direction is primarily due to height differences between veneers milled differently.
Fig. 2 Folding Lines in the direction perpendicular to the plane of the board.
Subsequently, the same area was analysed in the direction of movement of the instrument, with the lines interposed across two transverse and two longitudinal layers of veneer in the images (Fig. 3). This procedure aimed to identify the traces of the passage of the cutter in more detail.
3 Folding Lines in the direction of tool movement.
Four profile traces were evaluated from each image, resulting in a total of 20 measurements performed for each parameter in two directions: perpendicular to the board plane and parallel to the tool feed. The evaluation length of the profile was 12.5 mm. Filters according to the STN EN ISO 21920: 2022 standard were applied for the filtration of the roughness profile: L-filter (λc) with a value of 2.5 mm and an S-filter (λs) with a value of 8 μm. The evaluation of the roughness of the milled surface was conducted based on an analysis of roughness parameters, specifically Ra and Rz. Parameter Ra was elected because of its relative stability and widespread use in the scientific literature, allowing comparison with the results of other studies. Since profiles with different shapes (due to varying unevenness) can have the same Ra value (Musolff and Malburg, 2021), the amplitude parameter Rz was also included in the analysis. This was used to capture the differences
Fig.
between the highest and lowest points on the surface, thus expressing the total height of unevenness.
Measurement of the delamination of plywood veneers
Again, the Keyence VHX-7000 digital microscope with a magnification of 200× was used to analysethedegreeofdelamination aftermilling. Thedelamination measurement was always performed on the side with the worst quality. In each case, a horizontal line perpendicular to the edge was determined, and the average profile function was applied, evaluating five profiles on both sides at a spacing of 250 μm. The scanned area was 20 × 5 mm in size (Fig. 4).
4
Two indicators were evaluated from the profiles: the depth of delamination (the differencebetweentheundamagedsurfaceoftheplywoodandthedeepestpointof thecrack) and the length of delamination (the extent of damage in the horizontal plane). For each tool and feed combination, one scan was analysed at the point of most significant damage. The results were classified into four categories according to the severity of the damage (Tab. 1).
Tab. 1 Categorisation of the degree of edge delamination.
Score Depth of damage
Description
0 0 – 100 0 – 500 No visible damage, clean edge
1 101 – 300 501 – 1500 Slight fuzziness or minor damage to the edge
2 301 – 500 1501 – 3000 Bright cracks or local tearing off of the veneer
3 >500 > 3000 Significant delamination, deep and extensive damage
RESULTS AND DISCUSSION
Influence of feed speed on surface roughness
Before the actual descriptive and inductive statistical analysis, outliers, which could negatively affect the reliability of the results and, thus, the conclusions of hypothesis testing, were removed from the dataset. These extreme values represent measured values that differ
Fig.
3D visualisation and surface profile with marked damaged edge.
from the group average by several standard deviations. They most often arise due to local steep elevations of the surface (surface contamination) or incorrect conditions for scanning the surface with a digital microscope. The Z-score method was used to identify these values. Statistical analyses were performed using STATISTICA 14 software (TIBCO Software Inc., Palo Alto, California). The hypotheses were tested at a significance level of α = 5 %. After removing the outliers, descriptive statistics were performed, specifically arithmetic averages and standard deviations for the Ra parameter, which is the most widely used roughness parameter. Analysis of variance was used as part of the inductive statistics. The results confirmed that the technological parameters of milling – feed speed and tool geometry –have a statistically significant influence on all monitored surface roughness parameters (Ra, Rz, Rp, Rv; p-level = 0.000).

Fig. 5 Development of the Ra roughness parameter depending on feed speed and the inclination of the tool helix in different measurement directions.
Fig. 5 shows the change in the Ra parameter due to varying feed speeds when using three different tool geometries (Bendikiene and Keturakis, 2016; Smajic and Jovanovic, 2021). The results show that the negative spiral milling cutter formed the lowest roughness at the mean feed speed values (10 and 14 m·min-1), while at the lowest speed of 6 m·min-1 there is a significant increase in roughness. This effect can be attributed to lower cutting stability and increased fibre crushing at slower feed speeds, resulting in surface disruption. As the feed speed increases, the cut becomes smoother, reducing surface roughness. Similar trends have been observed in the works of Csanády et al. (2015) and Demir et al. (2022), where it has been demonstrated that increasing the feed speed in CNC machining increases the likelihood of vibration and disruption of cutting smoothness, resulting in higher surface roughness values.
The negative cutter showed the lowest roughness values at medium feeds (10 – 14 m·min-1), while the lowest (6 m·min-1) and the highest feed speed (18 m·min-1) led to an increase in surface roughness. The positive cutter generally formed the lowest roughness among all tools, especially at low feed speeds. On the contrary, the positive-negative cutter showed the highest values of Ra, with roughness increasing significantly as the feed speed increased, especially in the direction perpendicular to the board plane. Microscopic analysis shows that the surface roughness of the edge of the plywood is caused by torn fibers, crack formation, surface fuzziness and differences in heights between transverse and longitudinally milled veneers (Fig. 6).
Fig. 6 Microscopic image of a surface milled with a positive milling cutter at a feed speed 18 m·min-1. Lens zoom 100×
According to the study by Ibrisevic et al. (2023a), one of the leading causes of the observed unevenness of the surface is the construction of the plywood itself. Alternating the layering of veneers with the direction of the fibres changing causes the orientation of the cutting edge to change relative to the fibres during milling. As a result, two distinct cutting models are applied in machining – the face-cutting model and the longitudinal-cutting model. With a face-cutting model, up to three times the cutting force is required (Curti et al., 2021, Wang et al., 2021), leading to more intense fibre pulling and a rougher surface. A study by Guo et al. (2021) shows that cutting force and wood roughness are correlated with each other. A higher cutting force leads to a rougher surface under standard conditions. A similar relationship was confirmed by (Guo et al., 2018) in plywood milling. It follows that with the face-cutting model, the higher cutting force during milling will cause a greater roughness of the cross-section of plywood veneers. In the case of a longitudinal cutting model in the direction of wood fibres, the cutter creates a smoother surface with fine but distinct cycloidal waves – undulations (Brenci and Gurău 2024, Kopecký et al., 2019b), which can also be seen in Fig. 6.
Authors Wei et al. (2021) report that at a higher feed speed, the cutting edge removes a larger volume of material, increasing the average cutting depth. This leads to a higher load on the tool, an increase in vibration amplitude, and, consequently, higher surface unevenness. By increasing the rotational speed, the surface roughness is expected to be reduced; however, according to studies by Li et al. (2014) and Pelit et al. (2021), it has been shown that increasing the speed from 12,000 rpm to 18,000 rpm can reduce roughness by 8 to 12%. In this analysed case, however, at high speeds (18,000 rpm), the opposite effect occurs – an increase in roughness, which can be attributed to the increased level of vibration of the tool. This phenomenon does not contradict previous studies, as the vibration reduction effect is particularly evident in the optimised feed per tooth. If the feed speed or rotational speed is too high, the process can be destabilised, and the machining quality deteriorates. Fig. 5 shows that as the feed speed increases; the roughness tends to increase. The same results are presented in the thesis (Ibrisevic et al., 2023b, Smajic and Jovanovic 2021).
A positive tool produced lower roughness at the lowest feed speed compared to a negative one, as addressed by research by Karim et al. (2013), which investigated the effect of positive and negative tool face angles on tool wear and surface quality. With increasing feed speed, there was a slight increase in roughness. This trend is related to the rise in chip volume and an increase in feed per tooth, which, according to a study by Pinkowski et al. (2024), has led to a deterioration in surface quality. When using a positive-negative tool, the highest values of the parameter were measured in the direction of movement of the tool Ra
Face milling of transversely oriented veneer = torn fibers
Longitudinal milling of longitudinally oriented veneer = cycloidal ripples
compared to other tool geometries. The roughness increased significantly with the feed speed, with the highest values being achieved at a feed of 18 m·min-1. A similar trend was observed in measurements perpendicular to the plane of the board. It indicates that this helix inclination is less suitable for the final surface treatment at higher feeds in terms of the roughness of the machined surface. Analogous trends observed for the Ra parameter were also evident for the Rz parameter (Fig. 7).
Fig. 5 Development of the Rz roughness parameter depending on feed speed and the inclination of the tool helix in different measurement directions.
Influence of Feed Speed and Cutter Geometry as Independent Factors on External Veneer Delamination Rate
As can be seen from the results presented in Table 2, most of the samples did not show extensive or continuous surface damage and were classified in category 0. In many cases, this was not a typical delamination in the form of tearing off part of the top veneer but rather fuzziness caused by the orientation and protrusion of the fibres. Such damage can usually be easily removed by sanding.
In the production of furniture parts, edges with a radius of 2 mm are rounded, and in children's furniture, even a radius of 4-5 mm is used, which not only increases safety but also makes it easier to remove minor damages, such as delamination or fuzziness. Such modifications follow applicable technical standards
Tab. 2 Evaluation of the degree of delamination of upper veneer depending on milling parameters.
With a feed speed of 6 m·min-1 and the use of a positive spiral milling cutter, no significant cracks or delamination occurred. However, the surface showed fuzziness in places due to the plucking of fibres. Similar findings are confirmed by the research of (de
Moura and Hernández 2006); knives with a positive spiral in face milling showed "only slightly slenderfibres" without deeper cracks. Thesesurfacedefects could be easilyremoved by fine sanding. Even in this experiment, the damage is mainly characterised by bent fibres (protruding fibres) rather than cracks at the material's depth, so we do not consider this damage to be severe.
The feed speed of 10 m·min-1 deteriorated the surface quality compared to the lower speed. Cracks up to 172 μm deep and 2,332 μm long are present on the scan. The surface exhibits a tendency to delaminate and tear off the fibres, which can be attributed to higher dynamic stress on the material. Rounding the edge to a minimum radius of 2 mm can be an effective way to remove this damage in this case.
Withafeedspeedof14m·min-1 andapositivemillingcutterhelix,thedamagereached a maximum depth of 485 μm and a maximum length of 4135 μm. Although the depth corresponds to the second degree, the length exceeds the limit for the score of 3 assigned to this section and corresponds to significant delamination. At the same time, the scan revealed a split under the surface veneer, representing severe damage that significantly reduces the product quality. Likewise, when rounding the edge to a minimum radius of fillet of 2 mm, the damage to the edge would be preserved, which is not desirable from a qualitative point of view.
Atafeedspeedof18m·min-1,amaximumdepthofdamageof722μmandamaximum length of 3288 μm were recorded, which corresponds to the highest degree of damage (score 3) – significant delamination and extensive edge disruption (Fig. 8). The damage extends beyond the thickness of the surface veneer and extends into the deeper parts of the veneer, making it impossible to remove it by sanding. In this case, the damage goes beyond the area of the radius of curvature, and a significant part would be preserved, which still ranks it as unacceptable from a qualitative point of view.
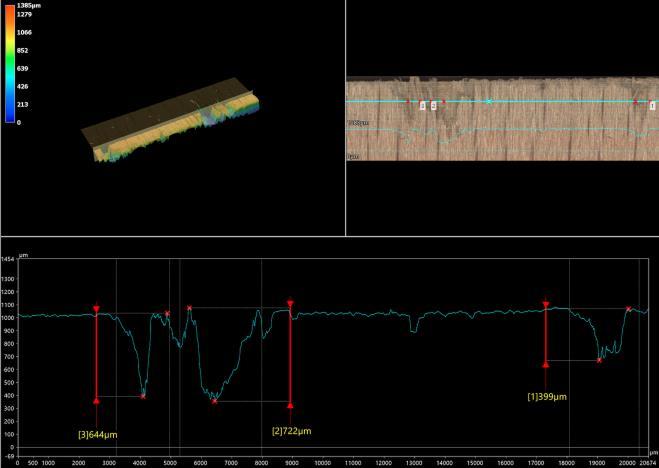

At a feed speed of 6 m·min-1 for the negative cutter, the quality of the machined edge was slightly lower than that of the positive cutter at the same speed, while similar results were reported by Śmietańska et al. (2020). They found that with minor to moderate tool wear, positive milling with melamine-coated MDF was significantly more favourable than with a negative milling cutter in terms of delamination. The edges remained clean, without
Fig. 8 3D sample scan at vf = 18 m·min-1 and positive cutter used.
continuous cracks. The surface remains compact and uniform, without cracks, which corresponds to a damage category of 0.
With a feed speed of 10 m·min-1 and the use of a negative cutter, increased edge fuzziness was observed. From the microscopic measurement, an irregular line with frequent protrusions up to 350 μm is visible. The profile exhibits significant fluctuations in height, indicating an insufficiently clean cut but without any visible cracks. Such an edge is classified in damage category 0 in terms of quality, although it visually appears rough and frayed. These defects are easily removed by sanding.
With a feed speed of 14 m·min-1 and a negative spiral milling cutter, the quality of the machined surface was reduced compared to lower speeds. Significant defects, with a depth of up to 501 μm and a length of 3224 μm, are visible on the scanned profile, indicating a violation of the edge zone. The occurrence of fibre plucking is observed, which may be a consequence of increased dynamic loading of the material at higher feed speed. This combination of parameters appears to be less favourable in terms of machining quality, as damage could remain present even in subsequent edge rounding and sanding operations.
With a feed speed of 18 m·min-1 and a negative spiral milling cutter, a maximum damage depth of 659 μm and a length of 3838 μm were measured. These values represent the most significant degree of edge disruption, characterised by significant delamination and extensive material damage (Fig. 9). The defect extends deeper than just the surface layer. When rounding the edge and then sanding, the damage can be partially eliminated; however, in this case, it exceeds the minimum radius of 2 mm, so a significant part of the defect would remain even after rounding. For this reason, the quality of such an edge is still rated as unsatisfactory.
Fig. 9 3D sample scan at vf = 18 m·min⁻¹ and negative cutter used.
When using a positive-negative spiral milling cutter, the quality of the machined edges was very high at all investigated feed speeds (6, 10, 14 and 18 m·min-1). In cases with a lower feed speed (6 and 10 m·min-1), there was no visible damage – the value of both the depth and length of the violation remained below 100 μm, which corresponds to the lowest degree of damage (score 0). At higher speeds (14 and 18 m·min-1), a slight fuzziness of the marginal zone appeared, but it was not delamination in the true sense of the word. The
damagewaslimitedtoprotrudingfibersonthesurfaceanddidnotexhibitthecharacteristics of a crack or a torn layer of veneer. Therefore, it was still rated as a score of 0 (Fig. 10)
Fig. 10 3D sample scan at vf = 18 m·min⁻¹ and positive-negative cutter used.
The measurement result can be directly attributed to the specific geometry of the positive-negative cutter. This combined helix has a positive inclination of the cutting edge at the bottom (chips point upwards) and a negative slope at the top (chips point downwards), eliminating torn fibres around the edge. This geometry reduces the risk of tearing out the fibres at both the top and bottom edges of the machined material, resulting in a symmetrical and even cut based on our measurements.
These observations correlate well with the review study of Trzepieciński et al. (2025), which highlights that the lowest delamination coefficients are achieved at lower feeds and/or in cutting geometries where the chip is compressed back into the material. At the same time, the authors state that even a slight increase in feed speed leads to an increase in traction forces and the risk of pulling out the fibres. Our finding that the positive-negative cutter virtually eliminates delamination even at 18 m·min-1 feeds is in line with the work of Śmietańska et al. (2020), where climb and conventional milling of melamine-coated MDF was compared.
CONCLUSION
Based on the experiments conducted, it can be stated that the quality of processing the beech plywood edge is significantly influenced by the technological parameters of CNC milling, particularly by the geometry of the tool used and the feed speed. The results showed that the lowest surface roughness values (both Ra and Rz) were achieved when using a positive spiral milling cutter at low feed speeds (6 – 10 m·min-1), confirming its suitability for applications where high quality of the edge is important. The negative cutter performed best at medium feeds (10 – 14 m·min-1), while the positive-negative cutter showed the highest surface roughness, especially at higher feed rates. Microscopic analysis reveals that surface unevenness primarily results from the plucking of fibres and variations in the orientation of the veneers. The combination of the face and longitudinal cutting models, characteristic of the multilayer composition of plywood, leads to irregular loading of the cutting tool and the formation of micro-defects. As the feed speed increases, the tool load, the amplitude of vibration, and thus the surface unevenness increase. In terms of eliminating
delamination and plucking of fibres, the positive-negative cutter proved to be the most effective, thanks to the combined inclination of the spirals, which minimised damage to the edges. At all speeds, it was in the score category of 0 – with no visible damage. On the contrary, with positive and negative cutters, defects occurred at higher feeds, which in some cases exceeded the 2 mm rounding limit, making it impossible to eliminate them during machining. The results confirm that to achieve optimal processing quality of the side surfaces of plywood, it is advisableto choose alowerto medium feedspeed andchoosetools with a stable cutting geometry. From a comprehensive perspective, it can be concluded that a positive tool is best suited for machining the edge, while a positive-negative cutter is optimal for edge processing. Where the highest visual and structural quality of the entire viewing area is required, a positive-negative milling cutter is the most versatile solution, as it provides consistent results without significant damage, even at higher feeds.
REFERENCES
Aras, O., Sofuoğlu, S.D., 2024. Analyze the effects of CNC machining parameters on the surface roughness (Rz) of Anatolian chestnut. Ağaç ve Orman 5(1), 42–50.
Atanasov, V., 2021. Experimental research on the cutting force during longitudinal milling of solid wood and wood-based composites. Acta Facultatis Xylologiae 63, 73–84.
Bal, B.C., Mengeloğlu, F., Akçakaya, E., Gündeş, Z., 2022. Effects of cutter parameters on surface roughness of fiberboard and energy consumption of CNC machine. Kastamonu University Journal of Forestry Faculty 22(3), 264–272.
Bendikiene, R., Keturakis, G., 2016. The effect of tool wear and planning parameters on birch wood surface roughness. Wood Research 61, 791–798.
Benkreif, R., Brahmia, F.Z., Csiha, C., 2021. Influence of moisture content on the contact angle and surface tension measured on birch wood surfaces. European Journal of Wood and Wood Products 79(4), 907–913.
Brenci, L.-M., Gurău, L., 2024. A stratified characterization of surface quality of beech processed by profile milling. Applied Sciences 14(1), 129.
Budakçı, M., İlçe, A.C., Korkut, D.S., Gürleyen, T., 2011. Evaluating the surface roughness of heattreated wood cut with different circular saws. BioResources 6(4), 4247–4258.
Çakiroğlu, E.O., Demir, A., Aydin, İ., 2019. Determination of the optimum feed speed and spindle speed depending on the surface roughness of some wood species processed with CNC machine. Journal of Anatolian Environmental and Animal Sciences 4(4), 598–601.
Csanády, E., Magoss, E., Tolvaj, L., 2015. Surface roughness of wood. In: Quality of Machined Wood Surfaces. Springer, Cham, 183–236.
Curti, R., Marcon, B., Denaud, L., Togni, M., Goli, G., 2021. Generalized cutting force model for peripheral milling of wood, based on the effect of density, uncut chip cross section, grain orientation and tool helix angle. European Journal of Wood and Wood Products 79, 667–678.
Darmawan, W., Azhari, M., Rahayu, I.S., Nandika, D., Dumasari, L., Malela, I., Nishio, S., 2018. The chips generated during up-milling and down-milling of pine wood by helical router bits. Journal of the Indian Academy of Wood Science 15(2), 172–180.
Demir,A.,Çakiroğlu,E.O.,Aydin,I.,2022.EffectsofCNCprocessingparametersonsurfacequality of wood-based panels used in furniture industry. Wood Industry 73(4), 363–371.
De Moura, L., Hernández, R., 2006. Characteristics of sugar maple wood surfaces produced by helical planing. Wood & Fiber Science 38(1), 166–178.
De Castro Saiki, L.E., Gomes, G.F., 2024. Understanding and mitigating delamination in composite materials: A comprehensive review. Mechanics of Advanced Materials and Structures 31(30), 13147–13167.
Djurković, M., Milosavljević, M.M., Mihailović, V., Danon, G., 2019. Tool wear impacts on cutting power and surface quality in peripheral wood milling. Wood Design and Technology 8, 9–17.
Guo, X., Wang, J., Buck, D., Zhu, Z., Ekevad, M., 2021. Cutting forces and cutting quality in the up-milling of solid wood using ceramic cutting tools. International Journal of Advanced Manufacturing Technology 114(5), 1575–1584.
Hanincová, L., Procházka, J., Novák, V., 2024. Comparative analysis of cutting forces in CNC milling of MDF: The role of tool coatings, cutting speed, and feed per tooth. Coatings 14, 1085. Ibrišević, A., Obučina, M., Hajdarević, S., Mihulja, G., Kuzman, M.K., Busuladžić, I., 2023. Effects of cutting parameters and grain direction on surface quality of three wood species obtained by CNC milling. Bulletin of the Transylvania University of Brasov, Series II: Forestry • Wood Industry • Agricultural Food Engineering 16(65 3), 127–140.
Karim, Z., Azuan, S.A.S., Yasir, A.M.S., 2013. A study on tool wear and surface finish by applying positive and negative rake angle during machining. Australian Journal of Basic and Applied Sciences 7(10), 46–51.
Kminiak, R., 2014. The influence of the saw blade design on the quality of the created surface during cross-sawing of spruce lumber on a mitre saw. Acta Facultatis Xylologiae Zvolen 56(2), 87–96. Koleda, P., Barcík, Š., Svoreň, J., Naščák, Ľ., Dobrík,A., 2019. Influence of cutting wedge treatment on cutting power, machined surface quality, and cutting edge wear when plane milling oak wood. BioResources 14(4), 9271–9286.
Kopecký, Z., Hlasková, L., Solař, A., Nesázal, P., 2019. Cutting forces in quasi-orthogonal CNC milling. Wood Research 64(5), 879–890.
Korčok, M., Koleda, P., Barcík, Š., Vančo, M., 2018. Effects of technical and technological parameters on the surface quality when milling thermally modified European oak wood. BioResources 13(4), 8569–8577.
Li, Y.W., Sun, Y.S., Zhou, X.G., 2014. Theoretical analysis and experimental verification that influence factors of climb and conventional milling on surface roughness. Applied Mechanics and Materials 459, 407–412.
Musolff, F.C., Malburg, C.M., 2021. The Surface Texture Answer Book. Digital Metrology Solutions, Indianapolis, 423 pp.
Pelit, H., Korkmaz, M., Budakçı, M., 2021. Surface roughness of thermally treated wood cut with different parameters in CNC router machine. BioResources 16(3), 5133–5147.
Pérez-Salinas, C., Castro-Miniguano, C., Moya-Moya, E., Goyos, L., 2023. Analysis of surface roughness and delamination factor applied to the drilling of hybrid polymeric composite materials by the Taguchi method. Materials Today: Proceedings 103, 999–1006
Pinkowski, G., Piernik, M., Wołpiuk, M., Krauss, A., 2024. Effect of chip thickness and tool wear on surface roughness and cutting power during up-milling wood of different density. BioResources 19(4), 9234–9248.
Pinkowski, G., Szymański, W., Krauss, A., Stefanowski, S., 2018. The effect of feed speed and rotation speed of plane milling on the surface roughness of beech wood. Research Papers of Poznań University of Life Sciences – Forestry 70, 59–69.
Sedlecký, M., Kvietková, M., Kminiak, R., Kaplan, L., 2018. Medium-density fiberboard and edgeglued panel after edge milling – surface waviness after machining with different parameters measured by contact and contactless method. Wood Research 63, 683–698.
Siklienka, M., Kminiak, R., Šustek, J., Jankech, A., 2017. Cutting and woodworking. Technical University in Zvolen, Zvolen, 348 pp.
Singer,H.,Özşahin,Ş.,2022.Prioritizationoffactorsaffectingsurfaceroughnessofwoodandwoodbased materials in CNC machining: A fuzzy analytic hierarchy process model. Wood Material Science & Engineering 17(2), 63–71.
Smajić, S., Jovanović, J., 2021. Influence of different machining on the roughness of oak wood. Bulletin of the Transylvania University of Brasov 14(63 1), 101–108.
Śmietańska, K., Podziewski, P., Bator, M., Górski, J., 2020. Automated monitoring of delamination factor during up- (conventional) and down- (climb) milling of melamine-faced MDF using image processing methods. European Journal of Wood and Wood Products 78(3), 613–615.
Szwajka, K., Trzepieciński, T., 2016. Effect of tool material on tool wear and delamination during machining of particleboard. Journal of Wood Science 62(4), 305–315.
Trzepieciński, T., Szwajka, K., Zielińska-Szwajka, J., Szewczyk, M., 2025. Current trends in monitoring and analysis of tool wear and delamination in wood-based panels drilling. Machines 13(3), 249.
Wang, J., Wu, Z., Zhang, F., 2025. Research on the end-milling surface quality of Paulownia based on response surface model in terms of force and chip morphology. Forests 15(2), 325. Wei,W.,Cong,R.,Xue,T.,Abraham,A.D.,Yang,C.,2021.Surfaceroughnessandchipmorphology of wood-plastic composites manufactured via high-speed milling. BioResources 16(3), 5733–5745.
Yang, C., Liu, T., Ma, Y., Qu, W., Ding, Y., Zhang, T., Song, W., 2023. Study of the movement of chips during pine wood milling. Forests 14(4), 849.
ACKNOWLEDGMENT
This experimental research was prepared within the grant project supported by the Slovak Research and Development Agency under the Contract No. APVV-20-0403 and funded by the EU NextGenerationEU through the Recovery and Resilience Plan for Slovakia under the project No. 09I03-03-V05-00016.
AUTHORS' ADDRESSES
Bc. Veronika Šugárová
Ing. Lukáš Adamčík doc. Ing. Richard Kminiak, PhD. Technical University in Zvolen Faculty of Wood Sciences and Technology Department of Woodworking T. G. Masaryka 24, 960 01 Zvolen, Slovakia xsugarova@tuzvo.sk xadamcikl@tuzvo.sk richard.kminiak@tuzvo.sk
ACTA FACULTATIS XYLOLOGIAE ZVOLEN, 67(1): 49 59, 2025
Zvolen, Technická univerzita vo Zvolene
DOI: 10.17423/afx.2025.67.1.05
INFLUENCE OF THE CUTTING MODE ON THE NOISE EMISSION LEVEL DURING LONGITUDINAL-PLANNER MILLING OF LINDEN AND BEECH WOOD
Pavlin Vitchev – Engindzhan Halim
ABSTRACT
The change in noise emissions generated during longitudinal flat milling of solid wood specimens using a knife shaft with spirally arranged flat knives is investigated in the paper. The influence of the feed rate (Vf) and the thickness of the cut-out layer (h) on the change in the A-weighted sound pressure level in dB(A) was determined. For the purpose of the study, specimens from beech and linden wood with widths (B) of 50, 100 and 150 mm were used. Based on the performed measurements, graphical dependencies illustrating the influence of the investigated factors on the noise emission levels were derived. The results confirmed the predicted influence of the feed rate (Vf) on the changes in the noise emission levels as follows: the Vf increased from 88.3 dB(A) to 92 dB(A) during processing beech wood specimens, and from 87.1 dB(A) to 89.9 dB(A) when processing linden wood specimens. Depending on the thickness of the cut-out layer (h), the sound pressure level varies within the range from 90.5 dB(A) to 97.3 dB(A) when processing beech wood specimens and from 86.2 dB(A) to 88.6 dB(A) for linden wood specimens. For the practical applicability of the obtained results and in order to ensure lower noise emission levels consistent with the maximum permissible sanitary and hygienic standard of 85 dB(A), recommendations for the optimal values of the feed rate (Vf) and the thickness of the cut-out layer (h) were made.
Keywords: milling; noise; sound pressure level; beech; linden
INTRODUCTION
For the current evaluation of modern technological equipment, both technical performance and sound emission levels have to be taken into consideration. Woodworking machines are among the noisiest working machines, primarily due to the mechanical and aerodynamic oscillating processes created by the high rotational speed of their cutting tools (Stasa et al., 2008; Romanchenko, 2010; Junai et al., 2019). Increased noise levels due to the high rotational speed of the cutting head can be compensated by changes in their structure, linear and angular parameters, or by structural changes in the machine itself (Tscheschmedjiev et al., 1988; Svoren, 2011; Kopecký et al., 2012; Gross et al., 2016; Dursan et al., 2018; Vitchev et al., 2018; Ruslyakov, 2021; Vitchev, 2023). The factors influencing the change in noise levels during the processing of wood and wood-based materials generally depend on: (i) the characteristics of the processed materials (type, density, dimensions); (ii) the cutting regime (cutting and feed speeds, thickness of the removed layer, cutting height); (iii) the characteristics of the cutting tool (shape and number
of teeth, diameter, cutting angles, type of material from which the teeth are made) (HSE, 2007; HSE, 2009; Mikal, 2016) The ever-increasing quality requirements for the treated surface necessitate the production of woodworking machinery with high-speed cutting tools. However, the speed of these cutting tools is a significant factor influencing the aerodynamic noise level. Aerodynamic noise produced by high-speed milling cutters is a serious environmental concern. Therefore, assessing sound emission levels is of great importance to ensure a working environment that complies with Good Manufacturing Practice (GMP).
Due to the adverse effects of noise on workers' health, the European Directive 2003/10/EC sets the upper safe limit for an eight-hour exposure without the use of personal protective equipment at LEX, 8h = 85 dB(A).
Generated noise can be categorised into idling noise and cutting noise, depending on the working process; each must be assessed and analysed independently.
Due to their diverse applications in furniture and joinery manufacturing, milling machinesareamongthe mostwidelyusedinthewoodworkingandfurnitureindustries. They also belong to the loudest woodworking machinery with A-weighted sound pressure levels Lp(A) around 100 dB(A) measured in the workplace (HSE, 2007).
The aim of the current study was to investigate the changes in noise emission levels generated during the longitudinal flat milling of specimens from linden (Tilia Sp.) and beech (Fagus sylvatica, L.) wood using a knife shaft with spirally arranged flat knives. The influence of various factors, including feed rate (Vf), the thickness of the out-cut layer (h) and the width of milling (B) on the generation of noise emission levels was evaluated.
MATERIALS AND METHODS
The experiments were performed using a woodworking planer machine, type Hammer A3-41 (Felder Group, Austria) (Fig. 1) with the following technical characteristics: power P = 4 kW; rotation frequency of the knife shaft n = 5000 min-1; diameter and length of the knife shaft D = 72 mm and L = 400 mm, respectively.
Thecuttingheadconsistsof62segmentkniveswithasidelengthof13.8mm,arranged spirally concerning the axis of rotation of the shaft (Fig. 2).
Fig. 1 Planer machine, type Hammer А3-41 (Felder Group, Austria) – general view.
2 Cuter head with segmental knives.
The machine is equipped with a roller feeder (Fig. 3) with a two-speed motor with a power rating of P1 = 0.75 kW. Thanks to the two engine speeds and the exchange of gears, the feeder provides four possible feed rates (Vf), namely: 4, 8, 11 and 22 m.min-1
Fig.
In the course of the study, specimens from Linden wood (Tilia Sp.), with the following characteristics: density ρ = 530 kgm-3 and moisture content W = 11,5 %, and Beech (Fagus Sylvatica L.) with the following characteristics: density ρ = 720 kgm-3 and moisture content W = 12 % were processed. The characteristics of the material used were determined in accordance with the standards BDS ISO 3131 and BDS ISO 3130. The processed specimens weretangentially oriented, with thefollowing dimensions: length(l)of1000mm andmilling width (B) of 50, 100 and 150 mm. The details were fed automatically by a roller power feeder.
To evaluate the influence of the factors feed rate (Vf) and thickness of the cut-out layer (h) on the roughness of the processed surface, they were changed as follows:
• feed rate Vf – 4, 8, 11 and 22 mmin-1 , compliant with the technical specifications of the equipment;
• thickness of the cut-out layer h – 1, 2 and 3 mm.
The machine was placed on a concrete sound-reflecting floor in a parallelepipedshaped room with dimensions: length, width and height, L x B x H – 10 x 8 x 4 m respectively. During the experiments no other technological machinery worked in the room, which also included the aspiration system.
The noise emission level generated by the tested machine during idling was determined on the basis of the sound pressure level (Lp) in dB, measured in octave bands with geometric mean frequencies from 63 Hz to 16000 Hz. The noise emission level generated during the working mode of the tested machine was determined on the basis of the A-weighted sound pressure level (LpА) in dB(A).
The measuring point was located at a distance of 1 m from the corpus of the machine, corresponding to the operator’s position, and was 1.5 m above the sound-reflecting floor.
When determining the actual sound pressure level (Lp and LpA), the influence of the background noise with the correction coefficient K1 and the influence of the characteristics of the sound field with the correction coefficient K2 were taken into account, in accordance with BDS EN ISO 3744:2010 in the following the formula:
Where: ������ ′ is the measured sound pressure level; K1– the correction coefficient accounting for the influence of the background noise; K2– the correction coefficient accounting for the characteristics of the sound field
Background noise refers to the noise generated by all other internal and external sources, except for the noise produced by the machine under study. To assess its influence, the difference between the sound pressure level from the sound source and the background
Fig. 3 Roller Power Feeder: A – general wiue; B – gear.
noise level (ΔLp) was calculated. In cases where ΔLp<6 dB, measurements are not recommended as the background noise will have a significant impact on the results. When 6≤ΔLp≤15, the correction coefficient K1, which shows the influence of background noise, is necessary to be calculated using the following formula:
1 = 10����(1 10 01∆����),���� (2)
Where: ∆���� =������(����) ′ ������(��); ������(����) ′ – sound pressure level at the measuring point during operation of the machine; ������(��) – background noise sound pressure level.
When ΔLp>15 dB, the background noise does not affect the measurements because the sound emission of the sound source masks the sound pressure it generates. In this case, K1 = 0.
The correction coefficient K2 which shows the characteristics of the sound field, depends on the volume of the room in which the measurements are made, on the sound absorption capacity of its surfaces (walls, floor, ceiling) and on the area of the measuring surface. From a practical point of view, it is most often accepted that the calculation of the correction coefficient K2 is based on the sound absorption capacity of the room and is calculated using the formula:
(3)
Where: А is the equivalent sound absorbing area of the room, m2; S – the area of the measuring surface, m2
The equivalent sound absorption area of the room is calculated using the formula:
(4)
Where: α is the sound absorption coefficient of the room surfaces using standardized values; Sv – the total area of the room surfaces (walls, ceiling and floor), m2 .
When K2 > 4 dB(A), the conditions for a free or approximately free sound field are not met and the measurement results are not accurate (BDS EN ISO 3744).
The sound pressure level was measured with digital precision sound level meter CEL620B1/K1 (CASELA, Great Britain) with built-in octave frequency filters with geometric mean frequenciesfrom63 Hzto 16,000 Hz andstandardfrequency correctioncharacteristics A, B, C, according to accepted international standards which measures sound pressure levels from 20 Hz to 20 kHz.
The tests were performed according to the requirements of BDS EN ISO 3744 and BDS ISO 7960.
RESULTS AND DISCUSSION
Influence of background noise
The measurements of the sound pressure levels show the following results:
• the sound pressure level (Lp) measured in all octave frequencies during idling showed changes from 50 dB to 76 dB. A-weighted sound pressure level resulting from the idle mode of the tested machine was 77 dB(A) (see Fig. 4);
• the sound pressure level of the background noise showed changes from 32 dB to 48 dB. A-weighted sound pressure level of the background noise was 49 dB(A).
The values obtained showed that the difference between the sound pressure level of the sound source and the background noise, both in the octave frequency band and Aweighted, was ΔLp>15 dB/B(A). Therefore, the background noise did not affect the sound pressure measurements of the studied sound source, i.e., the correction coefficient, which indicates the influence of background noise, was K1 = 0.
Characteristics of the sound field
The machine is placed on a concrete sound-reflecting floor in a room measuring L x B x H – 5 x 4 x 3.6 m. The measuring surface is located 1 m from the base parallelepiped and has the shape of a regular parallelepiped with an area of S = 29 m2. According to the classification of the type of premises, according to ISO 7960, the room is “a cuboid room with machines or an industrial room" with a sound absorption coefficient of its surfaces α = 0.15. After making the calculations using formula (3), it was found that the correction coefficient showing the characteristics of the sound field had a value of K2 = 2.2.
The values of the coefficients K1 and K2 were subtracted from the measured sound pressure level of the tested machine as per formula (1).
Sound pressure level measured during idling
The sound pressure levels generated during the idle mode of the machine are graphically presented in Fig. 4. The results show that the A-weighted sound pressure level is 77 dB(A). This is significantly lower than the recommended exposure limit of 85 dB(A)/per 8-hour working day.
Fig. 4. Sound pressure level in octave frequency bands and A-weighted sound pressure level, generated during idling.
The spectral distribution showed that the emitted sound energy was most pronounced in the low- and mid-frequency regions of the octave bands, with geometric mean frequencies ranging from 500 Hz to 4000 Hz. The peak value of the sound pressure level of
A 76 dB measurement was recorded in an octave frequency band with an average geometric frequency of 1000 Hz.
It is determined that the harmful effect of noise on the human body is most pronounced in octave frequency bands with geometric mean frequencies of 1000 Hz and 2000 Hz; however, under the conditions of this study, the measured values of the sound pressure level are 75 dB and 76 dB, respectively, which is significantly below the recommended hygienic norm of 85 dB(A) The relatively low level of noise generated during idling can be attributed to the geometry of the cutting head and its cutting teeth, which are arranged spirally concerning the rotating axis.
Sound pressure level measured during cutting mode of the machine
In the experiments performed during the cutting mode of the machine, the changes in the A-weighted sound pressure level were measured depending on the feed rate (Vf), the thickness of the cut-out layer (h) and the width of milling (B) at the operator’s workplace. Specimens from linden and beech wood were processed.
Influence
of the feed rate on the sound pressure level
The changes in the sound pressure level (LpA) concerning the feed rate (Vf) at thicknesses of the cut-out layers h = 1 mm, h = 2 mm and h = 3 mm are presented in Fig. 5, 6 and 7, respectively.
The results showed a significant correlation between the feed rate and the levels of the generated noise. In general, the noise emission level increases with the increase in the feed rate. This correlation confirms the results reported by other authors as well (Romanchenko 2010, Vitchev,2023).
Fig. 5 Changes in the sound pressure level (LpA) in relation to the feed rate (Vf) during milling of specimens from linden and beech wood at thickness of the cut-out layer h = 1 mm.
Feed rate, Vf, m.min
Linden Beech
Fig. 6 Changes in the sound pressure level (LpA) in relation to the feed rate (Vf) during milling of specimens from linden and beech wood at thickness of the cut-out layer h = 2 mm
Fig. 7 Changes in the sound pressure level (LpA) in relation to the feed rate (Vf) during milling of specimens from linden and beech wood at thickness of the cut-out layer h = 3 mm.
When comparing the sound pressure levels generated during the processing of specimens from linden and beech wood, it can be concluded that a higher noise level is generated during the processing of beech wood specimens compared to those made of linden wood. This is likely due to the higher density of beech wood compared to linden wood. As is visible from the graphical representation of the results (Figs. 5, 6, and 7), the values of the noise emission levels also differed depending on the different feed rates and thicknesses of the cut-out layer. The results showed that at various feed rates and thicknesses of the cut-out layer, the measured sound pressure level falls within the range of 87 to 95 dB(A).
Influence of the cut-out layer on the sound pressure level
The results of the performed experiments are presented in Fig. 8.
Linden Beech
Linden Beech
Fig. 8 Changes in the sound pressure level (Vf) in relation to the cut-out layer (h) during milling of specimens from linden and beech wood at feed rate Vf = 8 m.min-1 .
From the graphs, it is visible that the noise emission level increases with the increase in the thickness of the cut-out layer and its values exceed the maximum permissible exposure limit of 85 dB(A)/per 8-hour working day. The peak values of the sound pressure level are measured at the highest thickness of h = 3 mm and amount to 88.6 dB(A) and 97.3 dB(A) for beech and linden, respectively. A similar influence of the thickness of the cut-out layer on the noise emission level was reported in the study of DURCAN et al. (2018), in which the authors report that the noise level at a thickness of 1 mm is 84.25 dB(A) and rises to 90.27 dB(A) at a thickness of 3 m.
Regarding the influence of the processed material on noise emissions, the results align with those presented in Figs. 5, 6, and 7. It is evident that the milling of specimens from beech wood results in the generation of higher sound pressure levels compared to the processing of linden wood specimens. The most significant difference in sound pressure levels between the two wood species used was found at a thickness of the cut-out layer of 1 and 3 mm. At h = 1 mm the measured sound pressure level generated during the milling of linden wood is 86.1 dB(A) and the one generated during the milling of beech wood is 90.3 dB(A). The difference between the two species is about 4 dB(A).
Under the conditions of this study, the optimal thickness of the cut-out layer appears to be h = 2 mm, at which the sound pressure level for linden and beech is 87.1 dB(A) and 87.4 dB(A), respectively. Based on these results, at a thickness of the cut-out layer h = 2 and at feed speed Vf = 8 mmin-1 , a batter base-forming of the details would be achieved in one go.
Influence of the milling width (B) on the sound pressure level
The results of the performed experiments investigating the influence of the milling width on the sound pressure level, generated during longitudinal flat milling are presented in Fig. 9.
Cut-out layer, h, mm
Linden Beech
Fig. 9 Changes in the sound pressure level (Vf) in relation to the milling width (B) during milling of specimens from linden and beech wood at feed rate Vf = 8 m.min-1 and cut-out layer h = 2 mm.
From the graphs, it is evident that with an increase in the milling width, i.e., the width of the processed surfaces, the noise emission levels also increase. This increase in the overall sound pressure level is primarily due to the rise in technological noise resulting from the interaction between the cutter head and the workpieces being processed.
The results show that at B = 50 mm, the difference in sound pressure levels generated during the milling of linden and beech wood specimens is only 0.3 dB(A) In practice, it can be assumed that they have the same values of LpA = 87.3 dB(A). When increasing the width of the processed surfaces from 50 to 100 mm, a steep increase in the level of generated noise emissions is observed, resulting in 88.7 dB(A) and 93.9 dB(A) when processing linden and beech wood, respectively. With the subsequent increase in milling width to 150 mm, the sound pressure level values are 89.2 dB(A) and 95.2 dB(A) for linden and beech, respectively. Compared to the values generated at B=100 mm, this is a relatively small increase. The results also confirm the observation that the type of the processed material has an impact on the generated noise.
Additionally, in this experiment, the noise generated during the processing of specimens from beech wood is greater than that generated by linden wood at all tested milling width values. The influence of the type of processed material and the milling width on the noise emission level is also reported by other authors (Durcan et al., 2018). Their results indicate that as the milling width increases, the generated noise level also increases.
CONCLUSIONS
Based on the results obtained under the conditions of this study, the following conclusions can be drawn:
• The sound pressure level generated during the idle mode of the woodworking planner machine with spirally arranged flat knives amounts to 77 dB(A), which is significantly below the recommended exposure limit of 85 dB(A) for an 8-hour working day.
• The highest values, amounting to 88.6 dB(A) and 97.3 dB(A) for beech and linden wood, respectively, were measured at a feed rate of Vf = 8 m/min and a thickness of the cut-out layer of h = 3 mm.
The results of this study were compared with the sound pressure levels provided by the manufacturer of the same machine but using straight, flat knives. The values are 89.3 dB(A) during idle and 100.0 dB(A) during cutting mode of the machine.
Linden Beech
Basedonthiscomparison,oneofthemostsignificantadvantagesofthewoodworking planner machine with spirally arranged flat knives is the decrease in the aerodynamic noise, as witnessed by the lower noise emission levels during idling. This construction, however, does not significantly affect the noise generated during cutting. Therefore, attempting to mitigate noise emissions solely by modifying the cutting shaft design is insufficient. In this sense, the use of additional personal protective equipment, such as helmet earmuffs, as well as reducing exposure to the nose by decreasing the time spent at the machine, should be recommended to the machine’s operators.
REFERENCES
BDS EN ISO 3744:2010, Acoustics – Determination of sound power levels and sound energy levels of noise sources using sound pressure – Engineering methods for an essentially free field over a reflecting plane.
BDSISO 3130 (1999): Wood – Determination of moisture content for physical and mechanical tests.
BDS ISO 3131 (1999): Wood – Determination of density for physical and mechanical tests.
BDS ISO 7960:2007 Airborne noise emitted by machine tools. Operating conditions for woodworking machines.
Directive 2003/10/EC of the European Parliament and of the Council of 6 February 2003 on the minimum health and safety requirements regarding the exposure of workers to the risks arising from physical agents (noise) (Seventeenth individual Directive within the meaning of Article 16 (1) of Directive 89/391/EEC). Available at: https://eur-lex.europa.eu/eli/dir/2003/10/oj/eng.
Durcan, F., Burdurlu, E., 2018. Effects of some machining parameters on noise level in planing of some wood materials. BioResources 13(2): 2702-2714, ISSN: 1930-2126, https://doi.org/10.15376/biores.13.2.2702-2714
EN ISO 3744:2010 Acoustics – Determination of sound power levels and sound energy levels of noise sources using sound pressure – Engineering methods for an essentially free field over a reflecting plane.
Gross, L., Heisel U., 2016. Parameters influencing the noise emission of planing machines, Journal of Environmental Science and Engineering A 5, pp. 102-108. https://doi.org/10.17265/21625298/2016.02.007
Health and Safety Executive (HSE)., 2007. Noise at woodworking machines. Leaflet WIS13, HSE books.
Health and Safety Executive (HSE)., 2009. Noise at woodworking machines, Woodworking Information Sheet No 13.
HSE , 1998 Health and Safety Executive Buying new machinery: A short guide to the law and some information on what to do for anyone buying new machinery for use at work, Leaflet INDG271. Junai, P., Travnicek, P., Ruzbarsky, J., Kopecky, Z., Solar, A., 2019 Nooise emissions of older woodworking machines at parallel operation process, MM Science Journal, pp. 2832-2838 https://doi.org/10.17973/MMSJ.2019_03_201870
Kopecký, Z., Rousek, M., Veselý, P., Svoreň, J., Karolczak, P., 2012 Effect of irregular tooth pitch on the noise level of circular saw-blade, Chip and Chipless Woodworking, 8 (1):155-159.
Mika1, D., Józwik, J., 2016. Normative measurements of noise at CNC machines work stations. Advances in Science and Technology 30 (10): 138-143, https://doi.org/10.12913/22998624/63387
Romanchenko, M. K., 2010 Reduction of Noise and Vibration in Woodworking, Russian Engineering Research, 30 (11): 1188-1189.
Ruslyakov, D., 2021. Acoustic models of the main sources of noise of multi-spindle drilling woodworking machine. Akustika, Volume 39: 4-17 https://doi.org/10.36336/akustika20213910
Stasa, J., Skele, A., Pagasts, I., 2008. Dynamics of noise caused by woodworking machinery. Proceeding of 7th International scientific conference – Engineering for rural development, Jelgava, Latvia, May 29-30: 290-295.
Svoren, J., 2011. Vplyv polohy kompenzačných drážok, medených nitov v tele pílového kotúča a nerovnomerného rozstupu zubov na kritické otáčky [The influence of the position of compensation grooves, copper rivets in the saw blade body and uneven tooth spacing on critical speeds]. Acta facultatis technicae, XVI, 2011 (1): 125-132.
Tscheschmedjiev A., Dinkov, B., Brezin, W., 1985. Abhangigkeit des Schalldruckpegels von der Drehzahlfrequenz rotierenden Messerwellen, Mobel und Wohnraum, 1985, 8:245-250.
Vitchev P., Angelski, D., Atanasov, D., Mihailov, V., 2018. Study on the influence of certain factors on the sound pressure level generated during cutting with the circular saw. Proligno 14(4): 6572, Online ISSN 2069-7430, ISSN-L 1841-4737.
Vitchev,P.,2023.Assessment of noise emission level generated by a CNC milling machine. Science Journal InnovationsinForest Industryand EngineeringDesign,24(2):78-85,ISBN:1314-6149.
ACKNOWLEDGEMENTS
This research is supported by the Bulgarian Ministry of Education and Science under the National Program “Young Scientists and Postdoctoral Students – 2“ (2022 – 2025).
AUTHORS’ ADDRESSES
Assoc. Prof. Pavlin Vitchev, PhD
Assist. Prof. Engindzhan Halim
University of Forestry, Faculty of Forest Industry 10 Kliment Ohridski Blvd. 1797 Sofia, Bulgaria p_vitchev@ltu.bg e_halim@ltu.bg
ACTA FACULTATIS XYLOLOGIAE ZVOLEN, 67(1): 61 74, 2025
Zvolen, Technická univerzita vo Zvolene
DOI: 10.17423/afx.2025.67.1.06
HEAT BALANCES OF CONCRETE PITS WHEN STEAMING OR BOILING UNFROZEN LOGS
Ladislav Dzurenda – Nencho Deliiski –Dimitar Angelski – Pavlin Vitchev –Krasimira Atanasova
ABSTRACT
An approach to calculating the heat balance of concrete pits during the steaming or boiling of unfrozen logs intended for the production of peeled veneer is presented. Using our nonstationary model, the heating times of beech logs with a diameter of 0.4 m, initial temperatures of 0, 10, and 20 °C, and humidity of 0.6 kg.kg-1 at an operating temperature in the pit of 80 °C were determined. Using the determined log heating times and our stationary model, the change in total energy required to perform the entire steaming or boiling process, as well as the energy needed for each of the individual components of the pit heat balance, was calculated. Computer simulations were performed for a concrete pit with overall dimensions of 7.4 × 2.8 × 2.5 m, a working volume of 20 m³, and a degree of filling with logs of 45%, 60%, and 75%. The total heat consumption for heating beech logs with a diameter of 0.4 m, an initial temperature tw0 = 10 °C, and a humidity of 0.6 kg∙kg-1 at an operating temperature in the pit tm1 = 80 °C and a degree of filling f = 75% is equal to 114.7 kWh.m³ for log steaming and 152.7 kWh.m³ for log boiling. It was found that increasing the initial log temperature from 0 °C to 20 °C results in a decrease in the total energy consumptionofthepit, from 122.8to 106.3kWh.m³ forthesteamingprocess andfrom 159.7 to 145.4 kWh.m³ for the boiling process. Reducing the pit load from 75% to 45% would result in an increase in energy consumption in the pit from 114.7 to 157.0 kWh.m³ in the log steaming process and from 152.7 to 278.8 kWh/m³ in the log boiling process.
Keywords: pits; heat balance; steaming or boiling logs; plasticizing; veneer production.
INTRODUCTION
It is well known that steaming and boiling wood are technological processes in which wet wood materials are subjected to heating using saturated water steam or hot water, and their physical, mechanical and partly chemical properties change (Chudinov, 1968; Kollmann and Côté, 1984; Pervan, 2009; Niemz and Sonderegger, 2017).
The heat treatment of logs in steaming or boiling pits is carried out most often to plasticize the wood to reduce the cutting resistance during the formation of quality veneer (Lawniczak, 1995; Mahút et al., 1998 Trebula and Klement, 2002; Deliiski, 2003, 2004; Videlov, 2003; Steinhagen, 2005; Deliiski and Dzurenda, 2010; Kavalov and Angelski, 2014; Klement et al., 2021; Niemz et al., 2023; Klement et al., 2024).
The steaming and boiling processes of wood in pits are characterized by high energy consumption and low energy efficiency. The works (Sohor and Kadlec, 1990; Lawniczak,
1995;DzurendaandDeliiski,2019)statethatinsteamingpits,whenheatingwoodforveneer production, the heat effectively used for heating the wood does not exceed 25 – 30% of the total heat consumed.
Publications devoted to determining the energy required to steam or boil wood materials in pits are scarce. Only in Dzurenda and Deliiski (2019), a mathematical model of the heat balance of the concrete pit (Fig. 1) was proposed when boiling unfrozen wooden prisms intended for veneer production. When studying with this model, the balance of the pit for the case of boiling in it 12 m3 beech prisms with dimensions 0.4 × 0.25 × 1.2 m, moisture content of 0.8 kg·kg-1, the initial temperature of 10 °C at a water temperature of 80 °C until reaching a temperature in the center of the prisms of 70 °C, the total energy consumptionofthepitof 630.13MJ·m-3 wascalculated.Thefollowingresultswereobtained for the individual components in the heat balance: 29.3% for heating the prisms, 31.1% for heating the pit construction, 35.4% for warming up the water, 3.2% for covering the heat losses, 1.0% for warming up of the pit metal radiator, which is powered by steam or hot water under increased pressure and provides indirect heating of boiling water in the pit. Using this model, the components of the energy required to heat the individual parts of the pit construction were calculated.
Theaim ofthis work is to updatethemodelpresented in (Dzurenda andDeliiski, 2019) and, after its extension by a model for wood steaming in pits and to compare the heat balances of the same concrete pit for the cases of separate steaming or boiling of unfrozen wooden prisms intended for veneer production.
MATERIAL AND METHODS
Design features of the pit, in which the logs are subjected to steaming or boiling
The study was conducted on the heat balances of the pit shown in Fig 1, which has the following dimensions: length Lp = 7.4 m, width Bp = 2.8 m, and depth Hp = 2.5 m.
Thesymbols, units, and valuesofall theparameters markedin Fig. 1aregivenin Table 1. The pit is a concrete tank with steel reinforced walls and a steel armature at the bottom. The body of the tank is waterproofed against both the escape of hot water from the pit and the penetration of groundwater into the pit. The walls and the bottom of the pit are thermally insulated in order to reduce the density of the heat flow from the inside of the pit to the atmospheric air in the above-ground part of the pit walls and the heat flow to the soil in the part of the pit located in the ground.
Fig. 1 Longitudinal and transverse section of the pit for steaming or boiling wood materials used during the computations of its heat balances.
Tab. 1 Main set parameters of the concrete pit used to solve the mathematical models.
1. Length of the working volume of the pit
2. Width of the working volume of the pit
3. Depth of the working volume of the pit
4. Depth of the pit walls h m
5. Depth of the upper (above-ground) part of the pit
6. Working volume of the pit,
7. Thickness of the walls and bottom of the pit
8. Thickness of the insulating layer of the walls and steel lid
9. Thickness of the steel sheets of the pit lid
10. Distance of the drainage channel from the pit edge
11. Density of the concrete walls and bottom of the pit
12. Density of the insulating layers of the pit walls and lid
13. Density of the steel sheets of the lid
16. Specific heat capacity of the concrete (average value)
22.
of the area of at the bottom of the pit
23. Temperature of the heat carrier in the radiator of the pit
24. Temperature of the surrounding air of the pit
25. Loading level of the pit, i.e. the degree of filling in with logs f %
During the steaming or boiling process of wood materials, the pit is closed with a removable, well-insulated metal lid to protect workers from falling into the working area of the pit and to minimize heat losses into the surrounding air. The walls of the pit construction are finished with a groove filled with water, into which the protruding edge of the lid is immersed when the pit is closed, creating a perfect water seal.
The required operating temperature in the pit during log steaming is provided by direct saturated water steam, which is introduced into the pit through the heating elements of a tubular radiator. The radiator is located in the lower part of the pit and is supplied with water steam from a steam generator of appropriate performance. The tubular elements of the
radiator are perforated on their underside, allowing steam to pass through a layer of condensed water as it heats the pit and the logs within. After steaming is completed, the pit is drained, and the condensed water is removed from it.
The heating of the water in the pit to the required operating temperature during log boiling is carried out indirectly using heating elements in the radiator, which is located at the lower end of the pit. In this case, its tubular elements are not perforated. The radiator connectedtotheplant'sheatingsystemispoweredbysteamorhotwaterwithpressurehigher than atmospheric and with a temperature of 120–140 °C (Dzurenda and Deliiski, 2019).
Logs and modes parameters used in the computer simulations
This research was conducted over unfrozen beech (Fagus sylvatica L.) logs, which are commonly used in veneer and plywood production.
Fig. 2 illustrates the variation in processing medium temperature (tm) in commonly applied modes for heating wood materials with hot water or saturated steam to plasticize them in equipment operating at atmospheric pressure (Shubin, 1990; Pervan, 2009). These modes consist of two stages, during which tm changes as follows:
- during the first stage, in the course of time 0 – τ1, an increase in tm from tm0 to tm1 takes place by fully or partially opening the valve to introduce a heat carrier to the pit;
- during the second stage of the modes, in the course of time τ1 – τ2, the dosed introduction of the heat carrier into the pit radiator is carried out to maintain a constant technologically permissible value of tm, equal to the maximum mode’s value tm1.
When the time τ2 is reached, the logs subjected to steaming or boiling reach the optimal temperature required for their subsequent mechanical processing in the veneer production
2 Change of the processing medium temperature tm in modes for steaming or boiling of wood materials in pits.
Thesymbols, units, and valuesofthelogs’andalsoofthesteaming and boilingmodes’ parameters involved in the equations of the models given below, which were used in the numerical calculations of the pit heat balances, are presented in Table 2.
Modelling the 1D temperature distribution in logs subjected to steaming or boiling
To calculate the heat balance of the pits for cases of heating unfrozen logs, it is necessary to know the duration of their steaming and boiling, τ2 (Fig. 2), which depends on the influencing factors.
Fig.
Tab. 2 Main set parameters of the logs and their steaming and boiling modes used to solve models.
1. Diameter of the logs subjected to steaming or boiling
2. Length of the logs
3. Volume of the logs loaded in the pit for steaming or boiling, which is equal to f Vpit : (a – at f = 75%; b – at f = 60%; c –at f = 45%)
4. Moisture content of the logs
5. Fiber saturation point of beech wood at 293.15 K (20 oC) ufsp(293.15K)
6. Basic density of the beech wood
7. Density of the wood, equal to ρb·(1+u)
8. Specific heat capacity of the water in the pit
9. Initial average mass temperature of the logs
10. Minimum temperature in the center of the logs at the end of their steaming or boiling (i.e. at τ = τ2)
11. Initial value of the operating temperature in the pit
12. Maximum value of the operating temperature in the pit
13. Time constant of exponential increase of t
14.
15. Entire duration of the steaming and boiling modes of the logs, depending on tw0 (d – at two = 0 oC; e – at two = 10 oC; g – at two = 20 oC)
16. Average temperature of all logs at the end (i.e. at τ = τ2) of their steaming or boiling
17. Specific heat capacity of the logs at the beginning of their steaming and boiling, depending on tw0
18. Specific heat capacity of the logs at the end of their steaming or boiling (i.e. at tavg-end = 72.7 oC)
19 Thermal conductivity of the logs in the radial direction at the beginning of their steaming and boiling, depending on tw0
20 Thermal conductivity of the logs at tw = tm1 = 80 oC
21. Condensation heat of steam in the pit at τ = τ2 and 80 oC
22. Enthalpy of the condensation water in the pit at tm1=80 oC
Since the heating of the logs is a multifactorial process, the duration τ2 is most suitable to be determined with the help of a non-stationary mathematical model adequate to the real process. When the length of the logs, L, is at least 4 times their diameter, D, their steaming and boiling duration can be determined using the following experimentally verified 1D model (Deliiski, 2011, 2013):
and boundary condition, which is the same for steaming and boiling logs due to the very high heat transfer to the logs from the condensing water steam or hot water respectively:
Where: cw is the specific heat capacities of the unfrozen wet wood, J·kg 1·K 1; λw-r thermal conductivity coefficient in radial direction of the unfrozen wet wood, W·m-1·K-1; ρw –density of the wood, kg·m-3; ρb – basic density of the wood, equal to dry mass divided by green volume, kg·m-3; u – wood moisture content, kg·kg-1; r – coordinate along the log radius: 0 ≤ r ≤ R, m; R – radius of the log, m; T – temperature, K; Tw0 – initial average mass temperature of the log, K; Tm – operating temperature of the processing steaming or boiling medium in the pit, K; τ – time, s.
The specific heat capacity cw, density ρw, and thermal conductivity λw-r of the unfrozen wood above the hygroscopic range can be calculated according to the following equations (Deliiski, 2003, 2011, 2013; Deliiski and Dzurenda, 2010):
Where: λw0-r is the wood thermal conductivity at 273.15 K (i.e., at 0 oC), W·m-3·K-1; Kad-r –coefficient, which takes into account the influence on λw0-r of the heat flux towards the radial anatomic direction of the wood. In Deliiski (2003, 2013), it was found that Kad-r = 1.35 for the beech wood
During the solving of the model (1) – (3), the current average mass temperature of the log, n Tavg , can be calculated according to the following equation (Deliiski, 2011):
(8)
Where: R is the radius of the log, m; Δτ – step along the time coordinate, s; n – time level during the model solving: n = 0, 1, 2, 3, …, 2
The values of Tavg at the moment when the slowest changing temperature in the central point of the logs reaches the minimum temperature Twc-min, required for optimal plasticization of the logs, i.e. value Tavg-end, nd this is an indicator of the completion of the log steaming or boiling modes at τ = τ2 (Fig. 2), are needed below to calculate the energy consumed by the logs up to that moment.
Mathematical models of the heat balances of pits during the steaming or boiling of logs
The heat balances of the pit during the steaming or boiling of logs in it can be mathematically presented by the following models:
• during the steaming of logs:
Constr. Wood -steamingPit
• during the boiling of logs:
Constr. Wood -boilingPit
(9)
(10)
Where: QPit-steaming and QPit-boiling are the total specific (relating to 1 m3 wood) heat energies required for the implementation of the entire processes of plasticizing the logs subjected respectively to steaming or boiling in the pit; QWood – the energy required for warming up of the logs themselves subjected to heating; QConstr. – the energy required for heating the pit construction materials; QCond. water – energy in the condensed water that accumulates at the bottom of the pit during the steaming of the logs and is removed from the pit at the end of the steaming modes; QHot water – energy required to heat the water in the pit to the set maximum temperature tm1 of the boiling regime (Fig. 2); QRadiator – the energy required to heat the metal radiator of the pit, with the help of which saturated water vapor is introduced when steaminglogs orthewaterin thepit is heated whenboiling logs; QHeatlosses –theenergy required to cover heat losses of the pit during the logs’ steaming or boiling processes. The unit of all specific energies Q in equations (9) and (10), and also everywhere below, is kWh·m-3 .
The mathematical model (10) differs from the analogous model proposed by Dzurenda and Deliiski (2011, 2019) in that it lacks the component that accounts for the energy required to heat the moist air in the space between the boiling water and the pit lid. According to the cited sources, this component has a negligibly small value, accounting for only 0.03% of the heat balance of the boiling pit.
Mathematical model of Qwood
The specific energy required for heating the unfrozen logs subjected to steaming or boiling in the pit, Qwood, can be calculated using the following equation (Deliiski, 2013; Deliiski at al., 2023):
Where: the specific heat capacity cw, density ρw , and average mass temperature Tavg-end (at τ = 2 according to Fig 2) are calculated using equations (4), (5), and (8), respectively.
Mathematical model of ��Constr.
The specific heat energy required for warming up the construction materials of the pit, QConstr., can be expressed by the following model: Constr.4 Constr.3 Constr.2 Constr.1 Constr. Q Q Q Q Q + + + = (12)
Where: QConstr.1 and QConstr.2 are the energies required for heating of the walls of the aboveground partand thoselocatedin thegroundpart,respectively, ofthe pit construction; QConstr.3 and QConstr.4 – the energies required for heating of the pit bottom and pit lid, respectively. In (Dzurenda and Deliiski, 2010, 2011, 2019; Deliiski et al., 2023) equations are given for the calculation of each of the four components of QConstr. depending on the set of constructive and thermophysical factors influencing them, which are given in Table 1
Mathematical model of QCond.water
The specific heat energy accumulated in the condensed water, which during steaming is collected at the lower end of the pit and is removed from it at the end of the steaming regimes, QCond.water, can be calculated by the following model:
Where:
Thevolumeofthewoodmaterialssubjectedtosteamingorboilinginthepit, Vw,which participates in equations (13) and (14), is equal to
(15) where f is the loading level of the pit with wood materials subjected to steaming, m3·m-3; Vpit – working space of the pit equal to (Fig. 1)
(16)
The values of the mass of condensed water in the pit, mcw, and the energy dependent on it, QCond.water, are calculated with equation (14) for the conditions of the end of the second stage of the steaming regimes (Fig. 2), i.e., at tm = tm1 and τ = τ2, when the valve for draining the condensed water from the pit is fully opened. The mass mcw is formed by the amount represented in J·m-3 of the sum of the energies QWood, QConstr, and QHeat losses after dividing it by condensation heat of steam in the pit, rsteam, at the moment τ = τ2. The values of enthalpy of the condensation water, hcw, and of rsteam, are given in Table 2. They are taken from reference books on the thermodynamic parameters of water and saturated steam at tm1 = 80 °C (Dzurenda and Deliiski, 2019).
Mathematical model of QHot water
The specific thermal energy required to heat the boiling water in the pit, QHot water, can be expressed by the following model:
Themeaning andvalues ofall variablesin equation(17)aregivenin Table 1 andTable 2. Equation (17) applies to cases where the water in the pit at the beginning of the logs’ boiling process is not contaminated with diluted organic acids and other water-leachable substances from the previous wood thermal treatment process.
Mathematical model of QRadiator
The specific heat energy required for warming up the metal radiator of the pit itself at the beginning of the wood steaming or boiling process, QRadiator, can be expressed by the following model:
The meaning and values of all variables in equation (18) are given in Table 1 and Table 2.
Mathematical model of QHeat losses
Thespecificheat energy required to cover theheat lossesofthe pit duringthe steaming or boiling processes, QHeat losses, can be expressed by the following model:
where QHeat losses1, and QHeat losses2, are the energies required to cover the heat losses caused by the heat emission through the walls of the above-ground part and those located in the ground part of the pit construction, respectively; QHeat losses3, and QHeat losses4, – energies required to cover the heat losses caused by the heat emission through the pit bottom and pit lid, respectively.
In (Dzurenda and Deliiski 2011, 2019; Deliiski et al., 2023) equations are given for the calculation of each of the four components of QHeat losses, depending on the influencing structural, thermophysical and time factors, some of which are given in Tables 1 and 2.
Solving the models (1) – (3) and (4) − (19)
The mathematical descriptions of the thermo-physical characteristics of wood, as indicated in the Materials and Methods section, were entered into models (1)– (3), which were solved using the finite difference method with the aid of a custom software program in the Visual FORTRAN Professional computing environment. From the obtained change of the temperature along the radius of the logs, and in particular from that of the temperature in theircenter and oftheaveragemasstemperature tavg,thedurationofthesteamingandboiling modes of the logs, τ2, indicated in Table 2, was determined for the three investigated values of the initial average mass temperature of the logs, namely tw0 = 0, 10, and 20 oC.
An Excel program was prepared for joint solving of the equations involved in the models(4),(5),and (9)– (19)(http://www.gcflearnfree.org/excel2010).Usingthisprogram, the heat balances of the pit shown in Fig. 1 were investigated separately for the cases of steaming and boiling in it of the studied unfrozen beech logs at a degree of filling of the pit with logs, f, equal to 45%, 60%, and 75%. As input data relating to the design parameters of the studied pit (Fig. 1), as well as to the characteristics of the logs subjected to steaming or boiling and to the operating temperature in the pit (Fig. 2), those specified above in Table 1 and Table 2 were used.
RESULTS AND DISCUSSION
Fig. 3 shows the change in the slowest increasing temperature in the center of the studied logs, twc, and also the average mass temperature of the logs, tavg, calculated with the model (1) (3) and equation (8) during logs’ steaming or boiling at the operating temperature tm in the pit. The temperature tm changes from the initial value tm0 = 10 oC to its maximum values tm1 = 80 oC.
The time constants in the equation for the exponential increase in tm from tm0 = 10 oC to tm1 were so chosen during the simulations that the duration of this increase τ1 (Fig. 2) was equal to 4 h (i.e., 14,400 s) for all three investigated values of tw0, equal to 0, 10, and 20 oC
tm attm1=80C
tavgattw0=20C
tavgattw0=10C
tavgattw0 = 0C
twcattw0=20C
twcattw0=10C twcat
= 0C
Fig. 3 Change in tm, twc, and tavg of the studied logs during their boiling, depending on tw0.
In Fig 3 it can be seen that both the steaming and the boiling at tm1 = 80 oC of the studied logs having a diameter of D = 0.4 m and a moisture content u = 0.6 kg·kg-1 ends as follows: after τ2 = 21.0 h at tw0 = 0 oC, after τ2 = 20.0 h at tw0 = 10 oC, and after τ2 = 18.5 h at tw0 = 20 oC.
At these values of τ2, the temperature of the slowest-heating central point of the logs reaches 62°C, which corresponds to the minimum required temperature necessary to obtain a quality veneer from the heated and plasticized beech logs (Mörath, 1949; Deliiski and Dzurenda, 2010). It is also seen that during both the steaming and the boiling processes, the average mass temperature of the logs rises from its initial values of tw0 = 0 oC, tw0 = 10 oC, and tw0 = 20 oC to the same final average mass temperature, equal to tavg-end = 72.7 oC.
Fig. 4 presents the change in all components of the heat balances of the tested pit at its loading level f = 75%, as well as the total energy consumption (in kWh m-3) of the pit required to carry out the entire steaming or boiling processes, depending on tw0.
Fig 5 shows the change of the individual components of the heat balances of the pit Qi at f = 75% in % to the total energy consumption, Qsteam-total and Qboil-total respectively, depending on the studied values of tw0.
Fig 6 presents the change in all components of the heat balances of the pit at tw0 = 10 oC, as well as the total energy consumption of the pit required to realize the entire steaming and boiling processes, depending on the studied values of the degree of filling of the pit with logs f = 45, 60 and 75%.
Fig. 7 shows the change of the individual components of the heat balances Qi at tw0 = 10 oC in % to the total energy consumption, Qsteam-total and Qboil-total respectively, depending on the loading level of the pit f.
Fig. 4 Change in the components of the heat balances and the total energy (in kWh∙m-3) of the pit required for steaming (a) or boiling (b) the studied logs, depending on tw0.
Fig. 5 Change in the components of the pit heat balances in % to the total energy when steaming (a) or boiling (b) logs, depending on tw0.
When expressing the heat balances of the pit in kWh∙m-3, an increase in tw0 from 0 oC to 20 oC caused a decrease in the total energy consumption of the pit from 122.8 to 106.3 kWh∙m-3 for the steaming process and from 159.7 to 145.4 kWh∙m-3 for the boiling process. In this case, the individual components of the heat balances of the pit changed as follows:
▪ when steaming the logs: QWood, QCond.water, and QHeat losses decreased from 51.3 to 37.9 kWh.m-3, from 15.4 to 13.3 kWh∙m-3, and from 6.6 to 5.6 kWh∙m-3 , respectively; Qconstr. and QRadiator remained unchanged with values of 48.1 kWh m-3 and 1.4 kWh m-3 , respectively.
▪ when boiling the logs: QWood and QHeat losses decreased in the same way as during the steaming from 51.3 to 37.9 kWh∙m-3 and from 6.6 to 5.6 kWh∙m-3 , respectively; Qconstr. and QRadiator remained unchanged as well as during the steaming − with values of 48.1 kWh∙m-3 and 1.4 kWh∙m-3 , respectively; QHot water remained unchanged with a value of 52.3 kWh∙m-3 .
When expressing the individual components of the pit heat balances Qi as a % of the total energies Qsteam-total and Qboil-total, an increase in two from 0 oC to 20 oC caused the following change in the fraction of each component of these balances (Fig 5):
▪ when steaming the logs: Qconstr. and QRadiator increased from 39.1% to 45.2% and from 1.1% to 1.3%, respectively; QWood and QHeat losses decreased from 41.8% to 35.7% and from 5.5% to 5.3%; QCond.water remained unchanged with a value of 12.5%.
Fig. 6 Change in the components of the pit heat balances in % to the total energy when steaming (a) or boiling (b) logs, depending on f.
Fig. 7 Change in the components of the pit heat balances in % to the total energy when steaming (a) or boiling (b) logs, depending on f.
▪ when boiling the logs: QHot water and Qconstr. increased from 32.8% to 36.0% and from 30.1%to 33.1%, respectively; QWood and QHeatlosses decreasedfrom32.1% to 26.1% andfrom 4.1% to 3.9%, respectively; QRadiator remained unchanged with a value of 0.9%.
When expressing the heat balances of the pit in kWh m-3, a decrease in the degree of filling of the pit with logs f from 75% to 45% caused at tw0 = 10 oC an increase in the total
energy consumption of the pit from 114.7 kWh.m-3 to 157.0 kWh∙m-3 for the steaming process and from 152.7 kWh.m-3 to 278.8 kWh m-3 for the boiling process. In this case, the individual components of the heat balances of the pit changed as follows (Fig. 6):
▪ when steaming the logs: Qconstr., QCond.water, QHeat losses, and QRadiator increased from 48.1 to 80.1 kWh∙m-3; from 14.3 to 19.6 kWh∙m-3 , from 6.1 to 10.2 kWh∙m-3, and from 1.4 to 2.3 kWh∙m-3 , respectively. The reason for the increase in the indicated components is the fact that their calculated total values for the entire pit were divided by a decreasing amount of log volume in the pit, namely: by 15 m3 at f = 75%, by 12 m3 at f = 60% and by 9 m3 at f = 45%.
The specific energy for warming up the wood of the logs did not depend on f and it remained unchanged and equaled to QWood = 44.8 kWh∙m -3 when f decreased.
▪ when boiling the logs: Qconstr., QCond.water, QHeat losses,and QRadiator increased in the same way as during the steaming, but QHot water increased much more than the increase in QCond.water – from 52.3 to 141.4 kWh∙m-3 when f decreased. Theenergy QWood remained unchanged and, as during the steaming of the logs, it was equal to 44.8 kWh m-3 .
Whenexpressingthecomponents ofthe pit heat balances Qi as a%ofthetotal energies Qsteam-total and Qboil-total, a decrease in f from 75% to 45% caused the following change in the fraction of individual components of these balances (Fig. 7):
▪ when steaming the logs: Qconstr., QHeat losses, and QRadiator increased from 41.9% to 51.0%, from 5.4% to 6.5%, and from 1.2% to 1.5%, respectively; QWood decreased from 39.0% to 28.5%, and QCond.water remained unchanged with a value of 12.5%.
▪ when boiling the logs: QHot water increased from 34.3% to 50.7%; Qconstr., QWood, QHeat losses, and QRadiator decreased from 31.4%to 28.7%,from 29.3%to 16.1%, from 4.1%to 3.7%, and from 0.9% to 0.8%, respectively.
CONCLUSIONS
It was found that at the commonly used values of tw0 = 10 oC, tm1 = 80 oC and f = 75%, the total energy consumption of the pit is equal to 114.7 kWh m-3 when steaming logs with u = 0.6 kg.kg-1 and to 152.7 kWh∙m-3 when boiling the same logs in it.
The reason for the higher energy consumption during boiling of logs is the significant amount of energy required to heat the water in the pit, QHot water, which is equal to 52.3 kWh∙m-3 and constituting 34.3% of the total energy Qboil-total. In the heat balance of the pit during steaming the logs, instead of energy QHot water, energy QCond. water participates, which is contained in the condensed water removed from the pit at the end of the steaming modes. In the case under consideration, the energy QCond. water is equal to 14.3 kWh∙m-3 and constitutes only 12.5% of the total energy Qsteam-total.
An increase in tw0 from 0 oC to 20 oC at f = 75% causes a decrease in the total energy Qsteam-total from 122.8 kWh.m-3 to 106.3 kWh m-3 (i.e., by 13.4%) and from 159.7 kWh m-3 to 145.4 kWh∙m-3 (i.e,. by 9.0%) of the energy Qboil-total.
A decrease in f from 75% to 45% at two = 10 oC and tm1 = 80 oC causes an increase in the energy Qsteam-total from 114.7 kWh.m-3 to 157.0 kWh m-3 (i.e., by 36.9%) and from 152.7 kWh.m-3 to 278.8 kWh∙m-3 (i.e., by 82.6%) of the energy Qboil-total.
The ratio of the calculated values of QWood to those of the total energies Qsteam-total and Qboil-total shows that when the initial temperature of the logs increases from 0 oC to 10 oC, the heat efficiency of the well-insulated concrete pit during steaming and boiling processes decreases from 41.8%to 35.7%and from32.1%to 26.1%, respectively.The obtainedresults show that when the loading level of the pit decreases from 75% to 45%, the heat efficiency
of the pit during steaming and boiling processes decreases from 39.0% to 28 5% and from 29.3% to 16.1%, respectively.
The presented approach can be applied to compute heat balances and energy consumption of pits during the steaming or boiling of frozen and unfrozen logs from various wood species and with different characteristics to achieve any desired final average mass temperature required for the mechanical processing of the plasticized logs. It could be easily modified and used to calculate the heat balance of concrete pits of any design and construction parameters.
REFERENCES
Chudinov, B. S., 1968. Teoria teplovoy obrabotki drevesiny [Theory of the Heat Treatment of Wood]. Nauka, Moscow, 255 pp.
Deliiski,N.,2003.Modeliraneitehnologii zaproparvanenadarvenimateriali vavtoklavi [Modelling and Technologies for Steaming Wood Materials in Autoclaves]. Dissertation for DSc., University of Forestry, Sofia, 358 pp.
Deliiski, N., 2004. Modelling and Automatic Control of Heat Energy Consumption Required for Thermal Treatment of Logs. Drvna Industrija, 55(4), 181 199.
Deliiski,N.,Dzurenda,L.,2010.Modelirovaniyeteplovykhprotsessovvtekhnologiyakhpererabotki drevesiny. [Modelling of the Thermal Processes in the Technologies for Wood Processing] Technická univerzity vo Zvolen, 224 pp, Slovakia.
Deliiski, N., 2011. Transient Heat Conduction in Capillary Porous Bodies. In Ahsan A. (ed.) Convection and Conduction Heat Transfer. InTech Publishing House, Rieka, Croatia, 149-176, https://doi.org/10.5772/21424
Deliiski,N.,2013.ModellingoftheEnergyNeededforHeatingofCapillaryPorousBodiesinFrozen andNon-FrozenStates.Lambert AcademicPublishing,Scholars’Press,Saarbrücken,Germany, 106 pp., http://www.scholars-press.com//system/covergenerator/build/1060
Deliiski, N., Niemz, P., Dzurenda, L., Vitchev, P., Angelski, D., 2023. An approach for computing the thermal balance and energy consumption of concrete pits during boiling of frozen logs for veneer production. Wood Material Science & Engineering, vol. 18(6), 2153-2163, https://doi.org/10.1080/17480272.2023.2275758
Dzurenda L., Deliiski, N., 2011 Mathematical model for calculation standard values for heat energy consumption during the plasticization process of wood logs and prisms by hot water in pits. Acta Facultatis Xylologie, 53(2), 25-36.
Dzurenda, L., Deliiski, N., 2019. Tepelné procesy v technológiách spracovania dreva. [Thermal Processes in the Woodworking Technologies]. Technická univerzita vo Zvolen, 283 pp, Slovakia
Kavalov A., Angelski D., 2014. Tehnologia na mebelnoto proizvodstvo [Technology of Furniture] University of Forestry, Sofia, 390 pp.
Klement, I., Vilkovský, P., Vilkovská, T., 2021. The Influence of Wood Moisture Content on the Processes of Freezing and Heating. Applied Sciences. 11. 6099. https://doi.org/10.3390/app11136099
Klement, I., Vilkovská, T., Vilkovský, P., 2024. The Effect of Pine Wood Thickness on the Freezing and Heating Process in Warm-Air Drying. Applied Sciences. 14. 9464. https://doi.org/10.3390/app14209464.
Kollmann, F. F. , Côté, W. A. Jr., 1984. Principles of wood science and technology. I. Solid wood. Springer-Verlag, New York, Berlin, Heidelberg, 592 pp.
Lawniczak, M., 1995. Zarys hydrotermicznej i plastycznej obróbki drewna. Czesc I. – Warzenie i parzeniedrewna.[Outlineofhydrothermal andplasticwoodprocessing.Part I. –Woodboiling and steaming]. Poznan: Wydawnictwo AR w Poznaniu,149 pp.
Mahút J., Réh R., Víglaský, J., 1998. Kompozitné drevené materiály, I. časť. Dyhy a laminované výrobky [Composite wood materials, Part I. Veneers and laminated products.] Technická univerzity vo Zvolen, 266 pp, Slovakia.
Niemz, P., Sonderegger, W., 2017. Holzphysik: Physik des Holzes und der Holzwerkstoffe Carl Hanser Verlag GmbH & Company KG, Munich, 580 pp. Niemz, P., Teischinger, A., Sandberg, D., (Eds.), 2023. Springer handbook of wood science and technology. Springer Nature Switzerland AG, Cham, 2069 pp. Pervan,S.,2009.Tehnologijaobradedrvavodenom parom[TechnologyforTreatment ofWoodwith Water Steam]. University in Zagreb, Zagreb, Croatia. Sohor, M., Kadlec, P., 1990. Hydrotermicka úprava dreva na výrobu dyhy. [Hydrothermal treatment of wood for production of veneer]. Drevo, № 2. Steinhagen, H. P., 2005. Veneer block conditioning manual for veneer and plywood production. Maderas. Ciencia y Tecnología, 7 (1), 49–56.
Trebula, P., Klement, I., 2002. Sušenie a hydrotermická úprava dreva [Drying and Hydrothermal Treatment of Wood]. Technická univerzity vo Zvolen. 449 pp, Slovakia. Videlov, H., 2003. Sushene i toplinno obrabotvane na darvesinata [Drying and Thermal Treatment of Wood]. University of Forestry, Sofia, 335 pp.
ACKNOWLEDGMENT
This research was prepared within the framework of the grant projects VEGA 1/0256/23 and APVV 17-0456, as a result of the work of the authors and significant assistance from the VEGA agency and the APVV grant agency.
AUTHORS’ ADDRESSES
prof. Ing. Ladislav Dzurenda, PhD. Technical University in Zvolen Faculty of Wood Science and Technology Department of Woodworking T. G. Masaryka 24 960 01 Zvolen, Slovakia dzurenda@tuzvo.sk
prof. Nencho Deliiski, DSc. prof. Dimitar Angelski, PhD. Assoc. Prof. Pavlin Vitchev, PhD. Chief Assist. Prof. Krasimira Atanasova, PhD. University of Forestry, Faculty of Forest Industry Kliment Ohridski Blvd. 10 1797 Sofia, Bulgaria deliiski@netbg.com d.angelski@gmail.com p_vitchev@abv.bg k_atanasova@ltu.bg
ACTA FACULTATIS XYLOLOGIAE ZVOLEN, 67(1): 75 88, 2025
Zvolen, Technická univerzita vo Zvolene
DOI: 10.17423/afx.2025.67.1.07
PRODUCTION OF BINDER-FREE BOARDS FROM BIODEGRADED ABIES SIBIRICA WOOD
Vladimir Yermolin – Mikhail Bayandin –Sergey Eliseev–Sergei Kazitsin –Nikolay Smertin – Lilit Kazaryan – Tatyana Strekaleva
ABSTRACT
The aim of this paper is to investigate the feasibility of obtaining binder-free wood boards from rotted wood at the final stages of biodegradation. The rot-affected wood of Abies sibirica harvested from a stand killed by exposure to Polygraphus proximus Blandford was used as a subject of research. The wood boards from rotted wood were produced by wet hot pressing. The wood pulp was prepared by hydrodynamic treatment in a rotary pulsation disperser. The obtained wood boards with a density of 800 ± 20 kg/m3 and a thickness of 8 mm have an ultimate static bending strength of 28 MPa, modulus of elasticity (MOE) of 3.5 GPa, ultimate tensile strength perpendicular to the plate of 0.92 MPa, swelling in terms of thickness of 4.61 % in 24 hours. The boards dried after swelling tests retained 96% of their initial strength. The boards produced of biodegraded wood correspond to the EN622-3 semihard fibreboards (MB) in terms of mechanical parameters and are significantly superior in terms of water resistance.
Keywords: rotted wood; brown rot; dead wood; boards; properties; hydrodynamic treatment.
INTRODUCTION
In the context of climate change and imbalance, as well as active anthropogenic activities, thereisanincreasingincidenceofmassivemortalityofforeststands.Treesdieasaconsequence of changes in forest growth conditions caused by droughts (Dietze and Moorcroft, 2011, Anderegg et al., 2013, Anderegg et al., 2015, Berdanier and Clark, 2016), forest fires (Shvidenko and Shchepashchenko, 2013, Erisov et al., 2016, Wang et al., 2014), widespread outbreaks of pests and diseases (Cherpakov, 2012, Tatarintsev et al., 2021, Rizzo, 2003, Campbell et al., 2002, Volney, 1998, Basham, 1957), harmful species invasions (Roques et al., 2016, Okland et al., 2019, Littell et al., 2009, YuN et al., 2011, Melnik et al., 2018, Asner et al., 2018), etc. In regions where forestry experiences massive tree mortality, felling of dead stands is practiced within the first 2-3 years. It allows mechanized harvesting at no additional cost and the use of woodalmost without restrictions (Basham, 1986). Nevertheless, felling dead trees in a short period is not always possible. This may be due to the extent of stand mortality, insufficient transportation infrastructure, or a lack of sufficient production capacity for logging companies. In this case, with the increase in the age of a stand, the trunks of dead trees undergo a consistent process of destruction under the influence of physical and biological factors. The final stage of wood destruction is the development of wood-destroying fungi in it.Their activity
is associated with a sharp decrease in the consumer properties of wood. Such wood is in low demand by the wood processing industry (Basham, 1984).
The destruction of coniferous wood is primarily caused by basidiomycete fungi, which result in the development of brown rot in wood (Schwarze et al., 2000; Qi et al., 2022; Kim et al., 1996; Ruddick, 1986). It is one of the most destructive types of wood rot (Qi et al., 2022; Green and Highley, 1997). The peculiarity of brown rot is that in the process of destruction under the action of fungal enzymes, first of all, polysaccharides such as cellulose and hemicellulose contained in wood cell walls are decomposed, while lignin is practically unaffectedbythem (Curling et al., 2002,Green and Highley,1997, Goodell andJellison, 2001). As the wood decomposes, the porosity of the wood cell wall increases, and the destruction of the strong reinforcing cellulose framework makes it brittle the cell wall cracks and shatters (Eriksson et al., 2012).
Thus, biologically infested wood differs significantly in properties from healthy wood, which requires the development of special approaches to its processing.
As the analysis of the works (Barrette et al., 2015, Jouzani et al., 2020, Luo et al., 2010, Bowyer et al., 2003, Solomatnikova et al., 2011) shows, the main direction of processing of such wood is obtaining solid, liquid or gaseous fuel, as well as pulp and paper products. Nevertheless, when using this type of raw material in the production of fibrous materials, several limitations arise. Wood processing with low moisture content (less than 30%) does not allow for providing the required dimensional and qualitative characteristics of wood fibers (Lewis et al., 2006). It is also noted that the penetration of wood-dyeing fungi changes the colour of wood, which creates problems with bleaching in pulp production. And when wood is infested with brown rot, it significantly reduces pulp yield (Hoeger et al., 2014).
One of the most intensively developing areas of wood processing is the production of boards (Muhcu et al., 2015). In classical technology for wood boards, the addition of no more than 10% rotted wood is allowed, as it reduces the mechanical properties of the material, increases the consumption of binders, and worsens the strength of adhesive joints due to a decrease in the pH of the wood (G. Nemli et al, 2018, Goncalves et al., 2008, Byrne et al., 2007).
Binder-free boards are of particular interest in modern conditions. The basis of such technology is the pre-treatment of wood through mechanical (Schell et al., 1994; Shu et al., 2021), chemical (Maloney, 1996; Widsten and Kandelbauer, 2008), or biological activation.
Biological methods of wood modification are of great interest to researchers. For example, Kerner suggest that, to obtain dry MDF boards with a density of 700 kg/m3, chips should be pretreated with the brown rot fungus Coniophora puteana (Kerner et al., 2001). This woodpreparationreduces theenergyrequiredformilling in therefinerby40%.Themechanical properties of the boards are higher, and the swelling is 60% lower compared to boards made from healthy wood.
According to the authors of the paper (Wu et al., 2019), the hydrodynamic method is promising in the activation of lignocellulosic raw materials. Hydrodynamic activation of wood in a rotary pulsation disperser enables an increase in interfacial surfaces of wood particles by more than 2.5 times. It is due to the fibrillation of wood cell walls in the form of partial detachment of cellulose fibril bundles, as well as an increase in the proportion of fine fraction (size less than 20 microns) with a large specific surface area in the wood pulp. As a whole, this creates conditions for the formation of board structures without the use of adhesives due to the interphase interaction between wood particles of the activated mass (Bimestre et al., 2020, Wu et al., 2019, Ermolin et al., 2020, Karinkanta et al., 2018, Akpan et al., 2021).
The purpose of this paper is to study the possibility of obtaining medium density boards from hydrodynamically activated wood of Abies sibirica affected by brown rot at the last stages of development.
MATERIALS AND METHODS
Materials
The studies were conducted on Abies sibirica wood affected by brown rot, harvested from a stand located 20 km west of the city of Krasnoyarsk. The billets were sawn from the dead trees affected by the Polygraphus proximus Blandford 20 years ago. The wood had a light brown colour. The density in the dry conditions was 245 kg/m3; the compression resistance along the fibers was 13 MPa. The uninfested Abies sibirica wood from the same region was used as a control for wood properties. In its absolutely dry state, it had a density of 365 kg/m³ and a compression resistance along the fibres of 38 MPa. The primary disintegrating of biodegraded wood was carried out using a laboratory chipping machine. The obtained wood chips were ground using a laboratory hammer mill with an 8 mm sieve diameter. The photo of the obtained particles is presented in Fig. 1. The fractional composition of the particles in the infested wood, determined by the dry fractionation method, is shown in Fig. 2.


Fig.2 Fractional composition of the particles of the infested wood of Abies Sibirica.
Thermogravimetric analysis of wood
When wood is affected by wood-destroying fungi, some changes occur that significantly influence the thermal degradation processes of wood (Poletto et al., 2010, Loskutov et al., 2022). It predetermines the possibility of studying the physicochemical state
(a)
(b)
Fig. 1 Rotted wood: а – solid wood; b – disintegrated wood.
of wood by the thermogravimetric analysis (TG/DTG). This method is widely used to study the primary polymeric components of wood, including rotted wood, and to determine the ratio of aromatic and carbohydrate components (Poletto et al., 2012; Nassar, 1984).
Taking this into account, to evaluate the physicochemical changes in wood affected by rot, the thermogravimetric method (TG/DTG) was applied. Wood particles of healthy and rot-infested Abies sibirica wood were used as samples (Fig. 1).
The TG/DTG was carried out using the TG 209 F1 instrument (‘NETZSCH’, Germany) under the following conditions. The heating rate of samples in an oxidising atmosphere (compressed air) is 10 °Сmin-1 from 25 to 700 °C; the flow rate of protective and purging gases is 20 mlmin-1; the mass of samples of healthy wood and the wood in the final stages of rot is 3.94 and 4.27 mg respectively; Al2O3 crucible has a cylindrical shape. The calibration of the device was carried out according to the manufacturer's procedure and using standard substances from ‘NETZSCH’. The data processing of the thermal analysis was carried out using the software package called ‘NETZSCH. ProteusThermalAnalysis. 4.8.4.’
Hydrodynamic processing of wood
Wood processing was carried out in a laboratory hydrodynamic disperser of rotarypulsation type (Fig. 3). The chopped wood was mixed with water at a temperature of 8-10°C in the tank (1) to a concentration of 6%. The unit was started, and the mass was repeatedly processed by passing through the processing chamber of the unit (rotor and stator) (3). The rotor speed was 2950 rpm. During the operation, axial oscillation of the rotor occurs.
The fractional composition of WP mechanical wood pulp was studied using the sieve analysis method with the aid of a Retsch AS 200 control analytical screen sieve (Retsch GmbH, Haan, Germany). The weighing operation was performed using a laboratory balance with an accuracy of 0.001 g.
The morphology of wood pulp particles obtained from hydrodynamic treatment was studied using a scanning electron microscope (SEM) (Hitachi TM4000Plus, Japan).
During the hydrodynamic treatment of wood pulp, several changes occur. The dynamics of these changes depend on the type and design features of a given apparatus. Therefore, it is not reasonable to assess the results of processing by the duration. When processing fibrous materials (such as wood and cellulose), different express methods are used, which, through indirect indicators, allow us to estimate qualitative changes in the material. To assess the results of wood and cellulose milling, the water retention value (WRV)ortheSchopper-Rieglerdegree(0SR)isused(Jayme et al., 1966,ISO5267-1,2002).
Wood affected by rot, especially brown rot, is a poorly studied material. Therefore, both methods were used to assess the degree of wood processing to select the most appropriate one.
Fig. 3 General view of the experimental unit: 1 tank; 2 electric motor; 3 hydrodynamic disperser; 4 stop valve (gate valve); 5 circulation pipe.
The water retention value (WRV, %) was determined according to Jaime's method (Jayme et al., 1966). It represents the moisture content of the wood pulp after it has been centrifuged. The wood pulp samples were centrifuged at 3000 g for 10 minutes using the Janetzki T23 centrifuge. After that, they were dried to an absolute dry condition. The fineness was determined using a Schopper-Riegler instrument according to PN-EN ISO 5267-1 (2002).
Hot pressing of the boards
Mat formation was carried out by pouring the obtained wood pulp into a special metal mould with a mesh bottom. To dewater the mat, mechanical thrust in a cold press with a pressure of 1.0 MPa was used. After that, the boards were placed on the mesh pallets into a hot press called Fontijnepresses LabPro 1000 (Denmark). Hot pressing was carried out at a temperature of 180 °C, a specific pressure of 2.5 MPa, and a specific duration of 2 min/mm. The distance between the spacing strips corresponded to the thickness of the finished board with a format of 400 by 400 mm and a density of 800 ±20 kg/m3. To ensure a coefficient of variation of no more than 15% in the subsequent physical and mechanical tests, five boards were produced from each type of wood pulp with varying processing times.
Testing of the boards
After pressing, the boards were kept in the laboratory for conditioning for one week. Next, the boards were cut into samples for testing. The mechanical properties of the boards were determined on the UTS-30 testing machine (Russia). The tests were carried out according to the following standards: static bending (BP), modulus of rupture in bending (MOR) (EN 310), tensile strength perpendicular to the plate IB, and swelling.
For a more detailed study of the moisture resistance of the obtained boards, further studies were conducted. The test samples were placed in a water bath and filled with water that had a temperature of (20±2) °C. The distance between the samples and the walls of the water bath was 15 mm. The water was heated to the boiling point (100°C) for (90±10) min. The duration of boiling of the samples was (120±5) min. Then, the samples were taken out of the bath, and the moisture from the surface of the samples was removed with a paper towel and placed in a drying box at (70±2) °C for (960±15) min. After drying, the samples wereremovedfromthedryingboxandcooledto roomtemperature. Todeterminethetensile strength perpendicular to the plate (IBW), metal blocks were bonded with epoxy resin and tested according to EN 319 (1993).
Statistical processing
Microsoft Excel 2010 for Windows 8 was used for statistical processing. Physical and mechanical parameters were determined on at least eight samples. The mean value, standard deviation, and confidence intervals were calculated. The significance level was 0.05. All samples were tested for homogeneity of dispersion using Fisher's criterion. The significance of the differences between the samples was carried out by the Student's test.
RESULTS AND DISCUSSION
Thermogravimetric analysis
Table 1 presents experimental data obtained using the thermogravimetric method (TG/DTG) for samples of healthy and rotted Abies sibirica wood. The TG curve (Fig. 4a) shows four temperature ranges characteristic of the wood (Poletto et al., 2012), at which
there is a mass loss of the sample. In the first step of heating the wood from 20 to 115°C, water evaporation (Δm1) occurs. The decrease in sample mass at further temperatures up to 360°C is mainly caused by the thermal decomposition of hemicelluloses and the amorphous part of cellulose (Δm2). Further mass loss is attributed to the thermal decomposition of the crystalline part of cellulose (Δm3) (Nada et al., 2000; Poletto et al., 2010). At the last stage of heating from 406 to 518°C, the preferential thermal decomposition of lignin (Δm4) and combustion of the formed carbon occur.
Tab. 1 Stages of thermal decomposition of wood samples.
As a result, it is found (Table 1) that the healthy and rotted wood have similar moisture contents, 4.23% and 3.94%, respectively. Herewith, the content of hemicelluloses and amorphous part of cellulose Δm2 in the sample of the rotted wood is 18.61 % higher than that of the healthy wood. In addition, the proportion of the crystalline part of cellulose Δm3 in the rotted wood sample is 65.92 % lower than that of the healthy wood sample. A higher proportion of lignin in the rotted wood (Δm4) by 51.43 % was also recorded. It should be noted that the obtained values of mass loss do not reflect the mass content of the main components of the wood but rather their proportion in the tested samples.
(a)
(b)
Fig. 4 TG/DTG thermal decomposition curves of wood.
The DTG curve obtained for healthy fir wood (Fig. 4a) is broadly consistent with data from the following studies (Loskutov et al., 2022; Yang et al., 2006). It is important to note that a relatively high rate of thermal decomposition of Abies sibirica wood (at a temperature of 320.4°C – 9.27 % / min and at a temperature of 434.6 °C – 17.50 % / min) in comparison with other conifers is mainly due to its low density. The DTG curve of the rotted wood (Fig. 3b) also exhibits two main peaks in the mass loss rate, at 5.45% /min and –26.96% /min, respectively, corresponding to temperatures of 300°C and 427°C. At almost equal temperatures, the dynamics of thermal decomposition of healthy and rotted wood differ significantly. The thermal decomposition rate of healthy wood compared to rotted wood is 70.09% higher at ~300°C. This is caused by the higher proportion of hemicelluloses, which have low thermal stability and, consequently, a high rate of mass loss. At the same time, at ~ 430°C, the rate of thermal decomposition of the rotted wood is almost twice as high as that of healthy wood. Under these conditions, the processes of thermal decomposition occur. They occur to a greater extent in the crystalline part of cellulose and lignin. However, as noted earlier, at the final stages of brown rot development, the proportion of crystalline cellulose decreases.
Additionally, lignin modification occurs. Such changes create conditions that enhance the dynamics of wood thermal decomposition (Loskutov et al., 2022; Yang et al., 2006; Poletto et al., 2012). Thus, the results obtained confirm that the wood being studied is affected by brown rot.
Fractional composition of wood pulp
The results of the studies on the fractional composition of wood pulp (WPs) during hydrodynamic treatment are shown in Fig. 5. The proportion of the most significant fraction (more than 300 µm) remains practically unchanged during treatment. Herewith, the proportion of the fraction with the size less than 20 μm (bottom) increases. The proportion of all other fractions gradually decreases.
SEM images
The analysis of the SEM images of WPs obtained through hydrodynamic treatment of biodegraded wood reveals the following. The mass has a homogeneous structure without significant components (Fig. 6a.) The particles retain a cellular structure. It is necessary to pay special attention to the nature of fracture. Previously, we noted that the hydrodynamic treatment of uninfested wood exhibits strongly marked fibrillation, characterized by partial delamination of the end sections of particles into bundles of fibrils, as well as the formation of ribbon-shaped particles (Ermolin et al., 2019). In the particles of infested wood, there are only rudiments of such delaminations (Fig. 6b). The surfaces of many wood particles are smooth, which is characteristic of a brittle fracture (Fig. 5c). This pattern of the destruction of the wood affected by brown rot is most likely due to the decomposition of the strong reinforcing cellulose frame (Eriksson et al., 2012). The images in Figures 6b and 6c clearly
Fig. 5 Change of fractional composition in the process of hydrodynamic treatment.
show that the inner layer of S3 cell walls is not destroyed by fungi (indicated by arrows). This confirms the data (Liese, 1970, Wilcox, 1968) that this layer is more resistant to brown rot enzymes than the S2 inner layer.
6. SEM images of activated mass at 70 0 SR from rotted
The change in the WRV index during the hydrodynamic treatment process is shown in Fig. 7a. For the first 2 minutes of treatment, there is a sharp increase in this index, from 84% to 245%. After that, a decrease in the growth rate is observed. For the next 2 minutes, the index increases by up to 266%. Then it decreases and stabilizes at a level of 220%.
The pattern of 0SR (Fig. 7b) changes significantly during the treatment process. Initially, there is also intensive growth. During the first two minutes, it increases from 14 to 50. Then, the growth rate slows down significantly, and a monotonous increase occurs.
Fig.7 The change of the WRV and 0SR indices in the process of hydrodynamic treatment.
The results of studying the influence of processing time on the mechanical properties of the boards are presented in Fig. 8. The ultimate static bending strength increases with increasing processing time. Up to the sixth minute, it intensifies further. Then the growth slows down. The ultimate tensile strength perpendicular to the plate (Fig.8a) increases monotonically with increasing processing time.
(a)
(b)
(c)
Fig.
Abies sibirica.
Fig. 8 Properties of boards depending on processing time.
The swelling of the boards (TS) is illustrated in Fig. 8d. The swelling value decreases with increasing processing time. In general, this indicator has low values in the obtained boards. It should be noted that even at the minimum processing time of 2 minutes, the value is much lower than that allowed by EN 622-3:2009 for the MBH.HLS fiber boards.
When studying the moisture resistance of the boards by boiling them in water, it was obtained that the boards did not fracture. After drying, they had a sufficiently high strength, which also depended on the processing time (Fig. 9). The appearance of the samples remained unchanged. During the drying process, the dimensions of the samples practically returned to their original values. The residual swelling does not exceed 0.51 %.
Fig. 9 Ultimate tensile strength perpendicular to the plate after boiling in water for 2 hours.
It follows from the results obtained that during processing, qualitative changes gradually occur in the wood pulp, resulting in improved board properties. The value of 0SR can most adequately assess these changes. As the 0SR increases, the properties of the boards also increase. Therefore, this rapid method can be used to determine the results of hydrodynamictreatment ofwood.Thepatternsofchanges in waterretentionvalueandboard properties do not coincide. In earlier studies using uninfested wood, it was found that this parametercould beusedtoassesstheprocessingeffect (Ermolin et al., 2019).Thedifference in the patterns is because processing biodegraded wood produces particles of a different shape, specifically shorter particles. Also, the size of fine-fraction particles is significantly
smaller. Therefore, it is not reasonable to use the WRV index when processing the rotted wood.
The closest analogue of these boards is MB. Comparing the properties of the boards with the requirements of EN 622-5:2009, the following can be noted. The boards obtained from rotted wood are fully compliant with the requirements for non-load-bearing boards in both dry and wet conditions. The indicator that limits the use of the obtained boards as loadbearing is bending strength. The tensile strength perpendicular to the plate and the swelling in thickness meet the requirements for this type of board.
One of the advantages of boards made of rotted wood is high moisture resistance. The residual tensile strength perpendicular to the plate after boiling in water varies from 0.49 MPa to 0.85 MPa. According to the standard, this index should be not less than 0.15 MPa. Thus, its values are many times higher than the norms. Herewith, as already mentioned, the boards have minimal residual swelling.
Studies have shown that wood with low mechanical properties resulting from brown rot infestation can be used to produce relatively strong and moisture-resistant binder-free boards. The evident reason for the high values of physical and mechanical properties of the boards is a different mechanism of their structural formation. This requires specific analysis. Since no binder is used, the structure of these boards is formed by interfacial interactions between the wood particles. During the hydrodynamic treatment process, the size of the wood particles decreases, increasing the area of interfacial surfaces and creating prerequisites for the formation of a bonded structure. The nature of the interfacial interactions is determined by the material properties. This wood contains much more lignin with altered properties (Kirk, 1975, Goodell, 2003). In particular, it contains numerous phenolic hydroxyl groups and carboxyl groups. This suggests the possibility of hydrogen bonding in the contact zone of wood particles. In addition, it was observed that pretreating wood under artificial conditions with brown-rot enzymes allows to produce binder-free fibreboards with high mechanical properties. The reason for the increase in adhesion, as suggested by the authors of the works (Felby et al., 2004; Widsten et al., 2002), is that interfibre covalent bonds form between the structural elements of modified lignin in the contact zone during the hot pressing of the boards. The exact process can also occur between the wood particles of the activated mass. In sum, this results in a sufficiently strong board structure. The high moisture resistance of the boards can also be explained by the formation of covalent bonds.
CONCLUSION
Wood affected by brown rot is a significant raw material resource that requires finding ways to utilize it efficiently. The processes that occur in wood under the influence of wooddestroying fungi, along with the deterioration of various properties, create prerequisites for obtaining qualitatively different types of materials. The boards obtained in this work have significantly higher moisture resistance compared to traditional wood boards. Herewith, moisture resistance is achieved not by introducing modifying additives into the boards, as is the case with MB. It is caused by the changes that occur during rotting as a result of hydrodynamic processing. Studying the nature of these changes may reveal some ways to improve board properties.
REFERENCES
Akpan, E. I., Wetzel, B., Friedrich, K., 2021. Eco-friendly and sustainable processing of wood-based materials. Green Chemistry, 23(6), 2198-2232.
Anderegg, W. R., Hicke, J. A., Fisher, R. A., Allen, C. D., Aukema, J., Bentz, B., Zeppel, M., 2015. Tree mortality from drought, insects, and their interactions in a changing climate. New Phytologist, 208(3), 674-683. https://doi.org/10.1111/nph.13477
Anderegg, W. R., Plavcová, L., Anderegg, L. D., Hacke, U. G., Berry, J. A., Field, C. B., 2013. Drought's legacy: multiyear hydraulic deterioration underlies widespread aspen forest die off and portends increased future risk. Global change biology, 19(4), 1188-1196.
Asner, G. P., Martin, R. E., Keith, L. M., Heller, W. P., Hughes, M. A., Vaughn, N. R., Balzotti, C., 2018. A spectral mapping signature for the Rapid Ohia Death (ROD) pathogen in Hawaiian forests. Remote Sensing, 10(3), 404.
Barrette, J., Durocher, C., Mansuy, N., Béland, M., & Thiffault, E., 2017. From Unloved Woods to Diserable Renewable Biofuels.
Barrette, J., Thiffault, E., Saint-Pierre, F., Wetzel, S., Duchesne, I., Krigstin, S., 2015. Dynamics of dead tree degradation and shelf-life following natural disturbances: can salvaged trees from boreal forests ‘fuel’the forestry and bioenergy sectors? Forestry: An International Journal of Forest Research, 88(3), 275-290.
Basham, J. T., 1957. The deterioration by fungi of jack, red, and white pine killed by fire in Ontario. Canadian journal of botany, 35(2), 155-172.
Basham, J. T., 1984. Degradation and loss of wood fibre in spruce budworm-killed timber, and effects on utilization. The Forestry Chronicle, 60(1), 10-14.
Basham, J. T., 1986. Biological factors influencing stem deterioration rates and salvage planning in balsam fir killed after defoliation by spruce budworm. Canadian Journal of Forest Research, 16(6), 1217-1229.
Berdanier, A. B., Clark, J. S., 2016. Multiyear drought‐induced morbidity preceding tree death in southeastern US forests. Ecological Applications, 26(1), 17-23.
Bimestre, T. A., Júnior, J. A. M., Botura, C. A., Canettieri, E., Tuna, C. E., 2020. Theoretical modeling and experimental validation of hydrodynamic cavitation reactor with a Venturi tube for sugarcane bagasse pretreatment. Bioresource technology, 311, 123540.
Bowyer J.L.,ShmulskyR.,HaygreenJ.G.,2003.Forest productsandwoodscience: anintroduction.
Byrne, T., Stonestreet, C., Peter, B., 2007. Characteristics and utilization of post-mountain pine beetle wood in solid wood products. The mountain pine beetle: a synthesis of biology, management and impacts on lodgepole pine, 233-253.
CEN, 1993a. EN 310 Wood-based panels - Determination of modulus of elasticity in bending and of bending strength
CEN, 1993c. EN 317 Particleboards and fibreboards - Determination of swelling in thickness after immersion in water
Campbell F. T., Schlarbaum. Scott E., 2002. Fading forests II: trading away North America's natural heritage. – Healing Stones Foundation.
Cherpakov, V. V., 2012. Bacterial diseases offorest speciesin pathology of forest.SPb.: SPb GLTU, 200, 292-303.
Curling S. F., Clausen C. A., Winandy J. E., 2002. Relationships between mechanical properties, weight loss, and chemical composition of wood during incipient brown-rot decay.
DIN,1993b.EN319Particleboardsandfibreboards -Determinationoftensilestrengthperpendicular to the plane of the board
Dietze, M. C., Moorcroft, P. R., 2011. Tree mortality in the eastern and central U nited S tates: patterns and drivers. Global Change Biology, 17(11), 3312-3326.
Eriksson K. E. L., Blanchette R. A., Ander P., 2012. Microbial and enzymatic degradation of wood and wood components. – Springer Science & Business Media.
Erisov, A. M., Lomov, V. D., Volkov, S. N., 2016. Katastroficheskie lesnye pozhary poslednih let, Disastrous forest fires in recent years. Lesnoy vestnik, 5, 106-110.
Ermolin V. N., Bayandin M.A., Ostrykova V.A., 2023. Structural and mechanical properties of hydrodynamic activated wood pulp in additive technologies //News of higher educational institutions. Forest Magazine. 2. – pp. 121-131. https://doi.org/10.37482/0536-1036-2023-2121-131.
Ermolin V. N., Bayandin M.A., Kazicin S.N., Namyatov A.V., 2020. Water resistance of wood slabs produced without the use of binders //News of higher educational institutions. Forest Magazine. 3 (375). – pp. 151-158. https://doi.org/10.37482/0536-1036-2020-3-151-158
Ermolin, V.N., Bayandin M. A., Kozitsyn S. N., Namyatov A. V., 2019. Formation of the structure of low-density slabs from hydrodynamic activated soft woodworking waste. Proceedings of higher educational institutions. Forest Journal, No. 5 (371), pp. 148-157.
Felby, C., Thygesen, L. G., Sanadi, A., & Barsberg, S. Native lignin for bonding of fiber boards–evaluation of bonding mechanisms in boards made from laccase-treated fibers of beech (Fagus sylvatica). Industrial Crops and Products 20.2 (2004): 181-189.
GOST 34599 Medium fibreboards and hardboards. Moscow city, Standartinform, 2019, p.15
Goncalves, F. G., Lelis, R. C. C., Oliveira, J. T. D. S., 2008. Influence of the composition of tanninurea-formaldehyde resins in the in the physical and mechanicals properties of particleboard. Revista Arvore, 32, 715-722.
Goodell, B., Jellison, J., 2001. Non-enzymatic Gloeophyllum trabeum decay mechanisms: Further study, International Research Group on Wood Preservation. Document No IRG/WP 01-10395: 1-4.
Goodell, B., 2003. Brown-rot fungal degradation of wood: our evolving view. 97-118.
Green III, F., Highley, T. L., 1997. Mechanism of brown-rot decay: paradigm or paradox. International Biodeterioration & Biodegradation, 39(2-3), 113-124.
Hoeger, I., Gleisner, R., Negrón, J., Rojas, O. J., Zhu, J. Y., 2014. Mountain pine beetle-killed lodgepole pine for the production of submicron lignocellulose fibrils. Forest Science, 60(3), 502-511. https://doi.org/10.5849/forsci.13-012
ISO P. 5267-1., 2002. Pulps–Determination of the degree of beating–Part 1: Schopper-Riegler method // Polish Committee for Standardization, Warsaw, Poland.
Jayme, G., Büttel, H., 1966. Über die Bestimmung und Bedeutung des Wasserrückhaltevermögens (des WRV-Wertes) verschiedener gebleichter und ungebleichter Zellstoffe. Das Papier, 20(7), 357-366.
Jouzani, G.S., Tabatabaei, M., Aghbashlo, M., 2020. Fungi in Fuel Biotechnology. Fungi in Fuel Biotechnology.
Karinkanta, P., Ämmälä, A., Illikainen, M., Niinimäki, J., 2018. Fine grinding of wood–Overview from wood breakage to applications. Biomass and Bioenergy, 113, 31-44.
Kim G. H., Jee W. K., Ra J. B., 1996. Reduction in mechanical properties of Radiata pine wood associated with incipient brown-rot decay //Journal of the Korean Wood Science and Technology. 24 (1) pp. 81-86.
Kirk, T. Kent., 1975. Effects of a brown-rot fungus, Lenzites trabea, on lignin in spruce wood. 99107. https://doi.org/10.1515/hfsg.1975.29.3.99
Krner, I., Khne, G., Pecina, H., 2001. Unsterile Fermentation von Hackschnitzeln eine Holzvorbehandlungsmethode fr die Faserplattenherstellung. Holz als Roh-und Werkstoff, 5(59), 334-341.
Lewis K., Thompson, D., Hartley, I., Pasca, S. 2006. Wood decay and degradation in standing lodgepole pine (Pinus contorta var. latifolia Engelm.) killed by mountain pine beetle (Dendroctonus ponderosa Hopkins: Coleoptera).
Liese, W.A. L. T.E. R., 1970. Ultrastructural aspects of woodytissue disintegration. Annual Review of Phytopathology, 8(1), 231-258.
Littell, J. S., McKenzie, D., Peterson, D. L., Westerling, A. L., 2009. Climate and wildfire area burned in western US ecoprovinces, 1916–2003. Ecological Applications, 19(4), 1003-1021.
Luo, X., Gleisner, R., Tian, S., Negron, J., Zhu, W., Horn, E., Zhu, J. Y., 2010. Evaluation of mountain beetle-infested lodgepole pine for cellulosic ethanol production by sulfite pretreatment to overcome recalcitrance of lignocellulose. Industrial & Engineering Chemistry Research, 49(17), 8258-8266.
Maloney, T. M. 1996. The family of wood composite materials. Forest products journal, 46(2), 18.
Melnik, M. A., Volkova, E. S., Bisirova, E. M., Krivets, S. A., 2018. Assessment of the ecological and economic damage to forest management caused by the invasion of the Ussuri polygraph into the dark coniferous ecosystems of Siberia // Proceedings of the St. Petersburg Forestry Academy. 225. pp. 58-75. https://doi.org/10.21266/2079-4304.2018.225.58-75
Muhcu, S., Nemli, G., Ayrilmis, N., Bardak, S., Baharoğlu, M., Sarı, B., Gerçek, Z., 2015. Effect of log position in European Larch (Larix decidua Mill.) tree on the technological properties of particleboard. Scandinavian Journal of Forest Research, 30(4), 357-362.
Nada,Abd-AllaMA.,SamirK.,MohamedEl-S.,2000.Thermalbehaviourandinfraredspectroscopy of cellulose carbamates." Polymer Degradation and Stability 70.3 347-355.
Nassar, M., 1984. Mechanism of thermal decomposition of lignin / M. Nassar, G. MacKay // Wood Fiber Sci. Vol. 16. pp. 441–53.
Nemli, G.,Ayan, E., Ay, N., Tiryaki, S.,2018.Utilization potential of waste woodsubjectedtoinsect and fungi degradation for particleboard manufacturing. European journal of wood and wood products, 76, 759-766.
Okland, B., Flo, D., Schroeder, M., Zach, P., Cocos, D., Martikainen, P., Voolma, K., 2019. Range expansion of the small spruce bark beetle Ips amitinus: a newcomer in northern Europe. Agricultural and Forest Entomology, 21(3), 286-298.
Poletto, M., Dettenborn, J., Pistor, V., Zeni, M., Zattera, A. J., 2010. Materials produced from plant biomass: Part I: evaluation of thermal stability and pyrolysis of wood. Materials Research, 13, 375-379. https://doi.org/10.1590/S1516-14392010000300016
Poletto, M., Zattera, A. J., Forte, M. M., Santana, R. M., 2012. Thermal decomposition of wood: Influenceofwoodcomponentsandcellulosecrystallitesize.BioresourceTechnology,109,148153. https://doi.org/10.1016/j.biortech.2011.11.122
Qi J., Li, F., Zhang, X., Luo, B., Zhou, Y., & Fan, M , 2022. Different selectivity and biodegradation path of white and brown rot fungi between softwood and hardwood.
Rizzo, D. M., Garbelotto, M., 2003. Sudden oak death: endangering California and Oregon forest ecosystems. Frontiers in Ecology and the Environment, 1(4), 197-204. https://doi.org/10.1890/1540-9295(2003)001[0197:SODECA]2.0.CO;2
Roques,A.,Auger-Rozenberg,M.A.,Blackburn,T.M.,Garnas,J.,Pyšek,P.,Rabitsch,W.,Duncan, R. P., 2016. Temporal and interspecific variation in rates of spread for insect species invading Europe during the last 200 years. Biological invasions, 18, 907-920. https://doi.org/10.1007/s10530-016-1080-y
Ruddick, J. N. R., 1986. Application of a novel strength evaluation technique during screening of wood preservatives. International Research Group on Wood Preservation, Document No. IRG/WP, 2262.
Schell, D. J., Harwood, C., 1994. Milling of lignocellulosic biomass: results of pilot-scale testing. Applied Biochemistry and biotechnology, 45, 159-168. https://doi.org/10.1007/BF02941795
Schwarze F. W. M. R., Engels J., Mattheck C. Fungal strategies of wood decay in trees. – Springer Science & Business Media, 2000.
Shu, B., Ren, Q., Hong, L., Xiao, Z., Lu, X., Wang, W., Zheng, J., 2021. Effect of steam explosion technologymainparametersonmosobambooandpoplar fiber.Journal ofRenewableMaterials, 9(3), 585-597.
Shvidenko A. Z., Shchepashchenko D. G., 2013. Klimaticheskie izmeneniya i lesnye pozhary v Rossii (Climatic changes and forest fires in Russia) //Lesovedenie [Forestry studies]. 5. pp. 5061.
Solomatnikova, O., Douville, G., Carrière, N., 2011. Profil des produits forestiers: Technologies de bioénergies abase de biomasse forestiere //Centre de recherche industriel Québec.
Tatarintsev, A. I., Aminev, P. I., Mikhaylov, P. V., Goroshko, A. A., 2021. Influence of Forest Conditions on the Spread of Scots Pine Blister Rust and Red Ring Rot in the Priangarye Pine Stands. Land, 10(6), 617.
Volney, W. J. A., 1998. Ten-year tree mortality following a jack pine budworm outbreak in Saskatchewan. Canadian journal of forest research, 28(12), 1784-1793.
Wang, X., Parisien, M. A., Flannigan, M. D., Parks, S. A., Anderson, K. R., Little, J. M., Taylor, S. W., 2014. The potential and realized spread of wildfires across Canada. Global change biology, 20(8), 2518-2530. https://doi.org/10.1111/gcb.12590
Widsten, P., Kandelbauer, A., 2008. Adhesion improvement of lignocellulosic products by enzymatic pre-treatment. Biotechnology Advances, 26(4), 379-386.
Widsten, Petri, Jaakko E., 2002. Laine, and Simo Tuominen. Radical formation on laccase treatment of wood defibrated at high temperatures: Part 1. Studies with hardwood fibers. Nordic Pulp & Paper Research Journal 17.2. 139-146.
Wilcox, W. W., 1968. Changes in wood microstructure through progressive stages of decay (Vol. 70). US Department of Agriculture, Forest Service, Forest Products Laboratory.
Wu,Z.,Tagliapietra,S.,Giraudo,A.,Martina,K.,Cravotto,G.,2019.Harnessingcavitational effects for green process intensification. Ultrasonics Sonochemistry, 52, 530-546.
Yang, H., Yan, R., Chen, H., Zheng, C., Lee, D. H., Liang, D. T., 2006. In-Depth Investigation of Biomass Pyrolysis Based on Three Major Components: Hemicellulose, Cellulose and Lignin.” Energy & Fuels 20. pp.388-393.
YuN, B., Pet’ko, V. M., Astapenko, S. A., Akulov, E. N., SA, K., 2011. Ussuriyskiy poligraf-novyy agressivnyy vreditel’pikhtovykh lesov Sibiri [Four-eyed fir bark beetle-a new aggressive pest of Siberian fir forests]. Forestry Bulletin, 4, 78-81.
ACKNOWLEDGMENT
The work was performed as part of the state assignment of the Ministry of Education and Science of Russia for the implementation of the project “Studying the patterns of biodegradation of wood from dead stands in order to develop scientifically robust approaches for obtaining new functional materials” by the team of the Biorefining of Forest Resources research laboratory (theme № FEFE2024-0032).
AUTHORS’ ADDRESSES
Vladimir Yermolin
Mikhail Bayandin
Sergey Eliseev
Sergei Kazitsin
Nikolay Smertin
Lilit Kazaryan
Tatyana Strekaleva
Reshetnev Siberian State University of Science and Technology31 KrasnoyarskyRabochy AvKrasnoyarsk 660037Russian Federation
vnermolin@yandex.ru mihailbayandin@yandex.ru s-555s@yandex.ru sergeikaz060890@yandex.ru kolya.smertin@mail.ru kazaryan.lk@ksc.krasn.ru strekaleva@mail.ru
ACTA FACULTATIS XYLOLOGIAE ZVOLEN, 67(1): 89 100, 2025
Zvolen, Technická univerzita vo Zvolene
DOI: 10.17423/afx.2025.67.1.08
DEFORMATION OF WOOD – RESIN PHASE BOUNDARY BY MOISTURE CONTENT CHANGES IN WOOD
Barbora Slováčková – Radek Kovařík
ABSTRACT
In recent years, casting epoxy resins have been on the rise among wood furniture manufacturers. Epoxy resins can be applied to wood of various qualities, including those with defects and textures. A range of problems arise during the production of wood-epoxy resinproducts. Theseproblemsstemfromthedifferentcharacteristicsandpropertiesofthese materials. The focus of this article is on studying the dimensional changes of openings in beech wood filled with casting epoxy resin during changes in wood moisture content. The stability ofthewood-epoxyresin phase boundary duringmoistureand mechanical stress was also studied. Experimental results confirmed that the dimensions of the openings in wood enlarged proportionately with wood swelling. This resulted in a disruption of the woodepoxy resin phase boundary stability. The epoxy resin separated from the sides of the openings in wood. During the shrinking process, a limited shrinkage was observed in the vicinity of the openings. This can lead to the formation of cracks in wood. Swelling of the beech wood samples resulted in a significant height difference between the beech wood and the epoxy resin. On the other hand, the shrinking of the samples showed a more tapered height difference between the beech wood and the epoxy resin. The shear strength test did not indicate an adhesive failure but rather a cohesive failure of the epoxy resin. The failure occurred in the epoxy resin, close to the wood-resin phase boundary. This finding confirmed that epoxy resin has a good adhesion to beech wood.
Keywords: epoxy resin; beech; adhesion; moisture stress; mechanical stress; phase boundary
INTRODUCTION
In comparison to other materials, wood, as a natural, organic composite material, is very specific. Wood has a wide range of positive properties, especially its mechanical properties, which determine its use in the construction and furniture industry. On the other hand, there are some negative properties of wood, such as heterogeneity, hydrophilicity, and dimensional instability during moisture content changes, to name a few. These properties pose a significant obstacle to the optimization of various technological processes, including surface treatment, gluing, and modification, among others. Therefore, modification of wood has been the focus of research for a long time to enhance some of its properties. Currently, there is a wide variety of physicochemical methods for wood modification (Hill, 2006; Reinprecht, 2016; Sandberg et al., 2021; Spear et al., 2021).
One of the first chemical modification methods is the modification of wood with resins. This method was first used in the first half of the 20th century (Stamm and Seborg, 1943, Stamm and Seborg, 1944). Pores in wood, especially lumens of cell elements, were filled out with these modifying substances. The goal of this modification was to enhance the mechanical properties of the modified wood, as well as its dimensional stability during changes in moisture content (Kurjatko et al., 1987; Liptáková et al., 1991; Deka and Saikia, 2000; Homan and Jorissen, 2004; Dieste et al., 2008). Resins are also used in the preservation of archaeological wood (Rowell and Barbour, 1990).
In recent years, the use of casting resins by small furniture enterprises has been on the rise. The manufacturers applied casting resins on solid wood with various textures and even on damaged wood (cracks, openings left after knots fall out, wood decay cavities, etc.). This method of wood modification has gradually gained traction in medium and large enterprises within the furniture industry. The furniture and items produced are mainly tabletops, decorative items, and jewellery (Pacas et al., 2023, Kovařík and Tesařová, 2022). Epoxy resins are the main resin kind used for these products. From a designer's perspective, the combination of wood and resin yields new, visually appealing, and intriguing products.
The use of casting epoxy resins in combination with wood revealed several issues arising from the distinct properties of wood and casting resins, particularly in their differing behavior under varying conditions. These problems need to be solved. The research by Kovařík and Tesařová (2022) and Kovařík et al. (2023) indicates that one of the problems is the phase boundary stability of wood and casting epoxy resins under mechanical, moisture, and heat stress. According to Guo et al. (2022), Wondmagegnehu and Legesse (2023), and Zhou et al.(2025),thephaseboundarybetweenwoodandepoxyresinisthemostsusceptible to mechanical load, moisture, and heat stress.
Epoxy resins are synthetic materials consisting of mono- or oligomers in the raw state. During the polymerization of the resin, mono- and oligomers chemically crosslink to form a three-dimensional polymer structure. Epoxy resins are widely used in adhesives, paints, coatings, medical implants, and electrical devices (Bilyeu et al., 1999, Frihart, 2005, Kumosa, 2006). Epoxy adhesives and coatings are widely used due to their excellent environmental resistance and ability to bond to a wide variety of surfaces. Properties that are important in the processing of uncured epoxy resins, such as viscosity, as well as the final properties of cured epoxies, can be optimized by the appropriate selection of the epoxy monomer and the curing agent or catalyst (Bilyeu et al., 1999). The processing of epoxy resins is simplified by their low shrinkage, good adhesion to wood, and lack of volatile byproducts (Kovařík and Tesařová, 2022). According to the last cited authors, epoxy resins exhibit greater dimensional stability than wood under varying moisture conditions. The ability of epoxy resins to absorb water is almost null (Vanlandingham et al., 1999).
As mentioned earlier, casting resins are often used to fill various cavities and openings in wood. Research by Kúdela and Dubovský (1986) concluded that an opening in wood swells and shrinks proportionally to the swelling and shrinking of solid wood. Therefore, the phase boundary of wood and resin in these products needs to be studied in detail.
The primary focus of this work was to investigate the dimensional changes of an opening in wood filled with casting resin during changes in wood moisture content. Additionally, deformations on the wood-resin phase boundary, adhesion, and overall stability of the wood–epoxy resin system were studied.
Sample material
MATERIALS AND METHODS
Beech wood (Fagus sylvatica L.) was used in the experiment; it is a wood species characterized by extensive swelling and shrinkage (Kúdela and Čunderlík, 2012). Five trunks were felled in January 2021 in the locality of Opavské vrchy (the Opava mountains, Czech Republic). The logs were cut approximately at a height of 1.3 m off the ground. The length of the logs was 2 m, and their diameters ranged from 0.4 to 0.5 meters. The logs were sawn into mid-radial and mid-tangential-plane planks. These planks were dried to a moisture content of approximately 16 %. One plank was selected from each log for the experiment. Two sets of samples, each with dimensions of 620 mm × 120 mm × 24 mm (length × width × thickness), were produced. The average density of the beech wood in oven-dried state was 673 kg×m-3 .
The casting resin used in this experiment was an epoxy bisphenol-A type resin (Epilox 19-00, Leuna-Harze, Leuna, Germany), and Itamine CA60 (DDCHEM, Oppeano, Italy) was used as the hardener. The epoxy resin was mixed according to the manufacturer’s instructions.
Sample preparation for studying dimensional changes during wood moisture content change
Two sets of samples were produced for this experiment. The first set was designed to study the swelling of wood, and the second set was created to investigate the shrinkage of wood.
The first set of samples was oven-dried and then conditioned at an air temperature (t) of 20 °C and relative air humidity (φ) of 40%. The moisture content of these samples was 6±2 %. After drying, five openings with a depth of 22 mm and a diameter of 60 mm were cut into the planks (Fig. 1). The holes were milled on a CNC machining center. The walls and the bottoms of the openings were impregnated with a two-part epoxy-based penetrating coating. According to the manufacturer, this penetrating coating is supposed to stop the resin from penetrating into the wood structure. It should also prevent the air from the wood from passing into the unpolymerized resin; thus, later-formed air bubbles are trapped inside the cured resin. Three coats of the penetrating coating were applied in 30-minute intervals, each coat being gradually applied.
Regarding the maximum thickness of one casting epoxy resin layer poured at once and the depth of the opening in the sample, the casting resin was poured in two layers. This way, any gaps between the resin and wood caused by resin contraction were eliminated. The resin was left to polymerize at a t = 20 °C and a φ = 40%. After a full epoxy resin polymerization (approximately 5 days), the planks were milled on a thickness planer on both sides. The wood on the backside of the plank was worked until the resin layer was exposed, and the opening was open on both sides of the plank. The samples were then placed in a climate chamber for 26 days at a temperature of 20 °C and a relative air humidity of 93%.
Fig. 1 On the left – sample plank with cut openings. On the right – opening after application of the penetrating coating.
The second set of samples was conditioned for 26 days at a temperature of 20 °C and a relative humidity of 93%. After conditioning, five openings were cut into these planks in the same way and with the exact dimensions as for the first set of samples (Fig. 1). The penetrating coating, resin casting, and thickness milling were performed in the same way as for the first set of samples. The resin in these samples was left to polymerize at a temperature of 20 °C and a relative humidity of 93% for 5 days. After polymerization, it was found that the epoxy resin had penetrated deeply into the wood structure. The penetration prevailed significantly in the longitudinal direction of the beech wood, approximately 20 to 30 mm deep (Fig. 2 not possible to determine whether this penetration was caused by the penetrating coating or by the epoxy resin itself
Epoxy resin poured into the opening in the beech plank and view on the sample from the
milled on a thickness planer on both sides, following the same process as the first set of samples. The wood on the backside of the plank was worked until the resin layer was exposed, and the opening was open on both sides of the plank. The samples were then oven-dried at 65 °C for 6 hours.
Studying dimensional changes of width and thickness of the samples and openings in the samples filled out with casting resin
Thedimensions (widthandthickness)oftheoven-driedsamples from thefirst set were measured at five locations on the plank, always across the opening, with an accuracy of 0.01 mm. The dimensions of the openings were also measured with the same accuracy. The measurements were repeated after the sorption process. Swelling of widths and thicknesses of the samples was calculated from the measurements according to Eq. (1):
Where: x0 is the width (thickness) measurement of the sample at 0 % moisture content 0 % moisture content, xw1 is the width (thickness) measurement of the sample at the initial moisture content and xw2 is the width (thickness) measurement of the sample after sorption.
Fig. 2
The same way of measuring dimensions was applied to the second set of samples. The measurements were taken after conditioning the samples prior to resin pouring and then afterdryingthemat65°C for6hours.Shrinkageofthewidthsandthicknessesofthesamples was calculated from the measured dimensions according to Eq. (2):
Where: xw1 is the width (thickness) of the samples after conditioning, xw2 is the width (thickness) after drying to a certain moisture content.
The swelling extent of the openings βw was calculated according to Eq. 1 and the shrinkage of the openings αw ´was calculated according to Eq. 2.
Changes in the wood-epoxy resin phase boundary after swelling and shrinking of the samples were observed on a Keyence digital microscope.
Testing of epoxy resin adhesion to wood by shear strength test
Radial plane samples with dimensions of 630 mm × 180 mm × 24 mm (length × width × thickness) were used for testing the adhesion of epoxy resin to wood. The samples were conditioned to a moisture content (MC) of 8% at a temperature (t) of 20 °C and a relative humidity (φ) of 40 ± 5%. Rectangular openings with a depth of 12 mm were cut into the planks. The epoxy resin was poured into these openings (Fig. 3) according to the procedure described in Sample preparation for studying dimensional changes during wood moisture content change
test. On the right – the shape of the shear strength sample.
One set of samples was then left to polymerize at a t = 20 °C and a relative humidity φ = 40 ± 5%, and a second set of samples was left to polymerize at a t = 20 °C and a relative humidity φ = 93 ± 5%. The resin was left to polymerize for 5 days. After the resin polymerized, the samples were conditioned again at a t = 20 °C and a relative humidity φ = 40 ± 5%. The samples were then cut on a thickness planer and sawn into samples with dimensions of 40 mm × 50 mm (width × height; radial × longitudinal wood grain direction). Parts of the epoxy resin casting were removed to achieve the final shape of samples (Fig. 3). The area of the resin casting on the wood was measured prior to the shear test. The force was applied parallel to the wood grain. The shear strength was calculated according to Eq. (3):
(3)
Where: Fmax is the maximum force needed to damage the adhesion of epoxy resin to wood, and A is the area of the epoxy resin casting and wood surface phase boundary (Fig. 3). The shear strength test was considered successful when the epoxy resin separated from the wood in one piece without shattering.
Fig. 3 On the left – sample preparation for the shear strength adhesion
RESULTS AND DISCUSSION
Dimensional changes of openings filled out with casting resin
The moisture content in the beech samples of the first set increased by 14% after the sorption. The widths and heights of the samples swelled proportionally with the change in moisture content. According to Dubovský and Kúdela (1988), the openings in the wood should swell proportionally to the swelling of solid wood. The adhesive bonds between the epoxy resin and the wood were broken; therefore, the opening swelled as if there was no epoxy resin inside it. The openings swelled on average 0.36% more than the widths of the samples. However, a linear regression statistical test revealed no significant difference betweentheswellingoftheopening andtheswellingofthewidthsofthesamples(Dubovský and Kúdela, 1988). The results of the beech wood samples swelling and shrinkage extent are presented in Tab. 1.
Tab. 1 Basic statistical characteristics of the swelling and shrinkage of the beech wood samples and the dimensional change of the openings in the samples.
Place and the anatomical direction of the dimensional change measurements
Basic statistical characteristics Swelling Shrinking
Note: The measurement of swelling was performed 20 times and the measurement of shrinking was performed 16 times.
The openings in wood were filled out with a dimensionally stable epoxy resin. Due to the swelling of the beech wood, stress developed at the wood-epoxy resin phase boundary. This stress disrupted the phase boundary stability, resulting in the separation of the epoxy resin inside the opening. The separation of epoxy resin from beech wood after swelling of the sample is presented in Fig. 4. It has a similar character to the patterns observed by Liptáková et al., (1991) in wood modified with polystyrene. However, the causes of the phase boundary disruption were different
Fig. 4 The opening in the beech wood, with the epoxy resin casting. Figures A1 and A2 show the sample prior to swelling, figures B1 and B2 show the sample after swelling. Figures C1 and C2 show the failure of adhesion.
The most striking separation of the epoxy resin from wood was observed in the cross direction of samples (Fig. 4). The widths of the gaps between the epoxy resin and the beech wood ranged from 1.5 to 3mm in the widest dimension of the opening. The examination of the gap between the epoxy resin and beech wood revealed that the failure of adhesion occurred at the phase boundary between the casting epoxy resin and the epoxy resin layer applied to the openings prior to casting (Fig. 4).
Because the adhesion between the epoxy resin and the beech wood failed, the samples were able to swell evenly throughout their whole size. The samples swelled even in the vicinity of the resin-wood phase boundary along their thickness. This swelling caused a significant height difference between the surface of the epoxy resin and the surface of the swelled beech wood (Fig. 5). This height difference between the resin and the wood was easily noticeable - it was visible to the naked eye and could be felt by touch. The height difference between the resin surface and the wood surface reached up to 1.6mm. Such height differences are significant faults of any product.
According to Zhou et al., (2025), the differences in dimensional and chemical stabilities ofwoodand epoxyresin arethecauseof stressesin thephaseboundary.This leads to a gradual disruption of the bonds between the wood and the epoxy resin.

The second set of samples, where the resin was cast into wood with a high moisture content, was dried. These samples shrunk. Since the openings were filled tightly with epoxy resin, the fully polymerized resin prevented the openings from shrinking. This caused a limited shrinkage in the vicinity of the openings. Parts of the samples (denoted with a red square in Fig. 2) developed a tension stress perpendicular to the grain. Nonetheless, these stress values did not exceed the ultimate tensile strength of beech wood perpendicular to the grain. There were no indications of failure in the beech wood parts of the samples. However, it is necessary to note that the strength in the parts of the samples was increased due to the penetration of resin into the samples.
In comparison to the first set of samples, the height difference between the resin and wood in the second set of samples was tapered (Fig. 6). This was the result of good adhesion of the epoxy resin to the beech wood and it was amplified by the compression on the phase boundary caused by shrinkage. The height profile in the second set of samples is presented in Fig. 6.
Fig. 5 Height difference between the surfaces of epoxy resin and beech wood after swelling. The red line denotes the measurement area of the height profile; the green line presents the height profile.
Fig. 6 Height difference between the thickness of epoxy resin layer and the thickness of beech wood after shrinking. The red line denotes the measurement area of the height profile; the green line presents the height profile.
The results of this experiment suggest that to ensure the high quality and longevity of wood-epoxy resin products, the dimensional stability of wood in these products needs to be improved. To avoid the above-mentioned unfavorable effects, the hydrophobicity and, ultimately, the dimensional stability of wood should be improved prior to epoxy resin application. A suitable modification is the thermal modification of wood (Sandberg et al., 2021; Lagaňa et al.,2021; Kačíková et al.,2025). Anotherpossibilityis surfacemodification of wood-epoxy resin-based products with suitable transparent coatings. These coatings also homogenize the surface and enhance the color stability of the final product (Kúdela et al., 2024, Slabejová et al., 2023).
Testing adhesion of epoxy resin to wood by shear strength test parallel to the grain
The results of the shear strength test are presented in Tab. 2. Even though the samples for the shear strength test were conditioned to an MC = 8% and the test was carried out at this MC, the sample sets displayed different shear strengths. The first set of samples, where the epoxy resin was cured at φ = 45%, showed higher shear strength values than the second set of samples, where the epoxy resin was cured at φ = 93%. In comparison to the first sample set, the shear strength of the second sample set was, on average, 23% lower.
Note: The epoxy resin was cured at φ= 45% and at φ= 93% in the first and second sample sets, respectively.
The beech wood and the epoxy resin blocks were analyzed after the shear strength test. Based on the analysis, it was found that most samples showed a cohesive type of failure. The failure occurred in the resin layer close to the phase boundary (Fig. 7). This type of failure was dominant in the second set of samples. In the first set of samples, wood fibers were present in the epoxy resin block (Fig. 8). These fibers were torn off from the beech wood during the shear strength test. The type of failure in the first set of samples was determined to be non-cohesive. This type of failure was caused by the mechanical working of the wood samples. Some fibers were partially loosened during the sample production. These fibers were then more thoroughly impregnated with the epoxy resin, which was easier to tear off during the shear strength test. According to Kúdela and Liptáková (2006), this type of failure cannot be considered as a cohesive type of failure in the substrate. A cohesive failure in the beech wood was ruled out according to the data of shear strength parallel to the grain of
Tab. 2 Results of the shear strength test.
beech wood presented by (Požgaj et al., 1997, Kúdela and Čunderlík, 2012). The aforementioned authors reported significantly higher shear strength values than those presented in this paper.

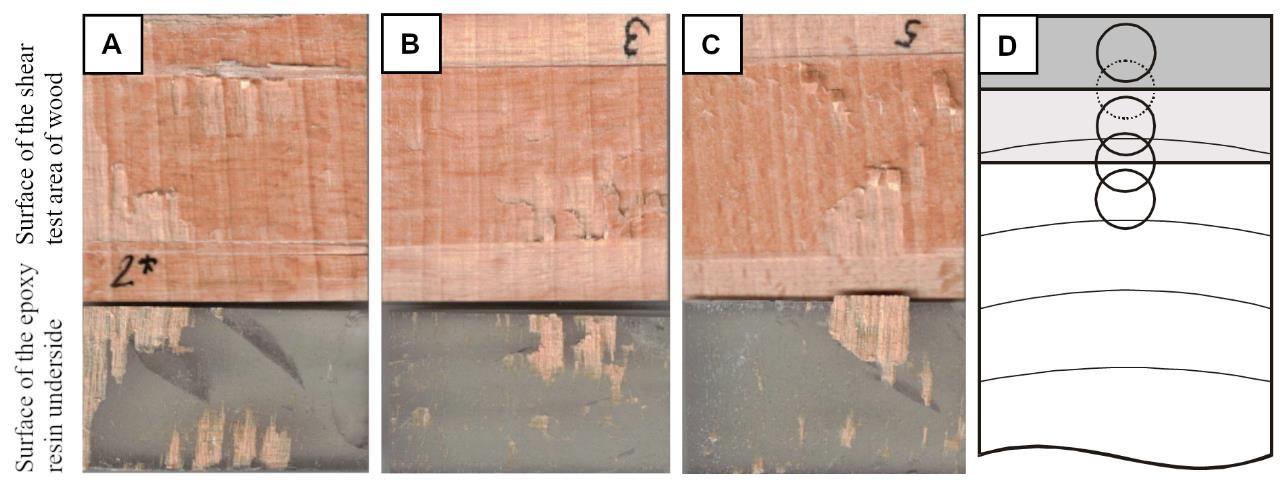
The experimental results confirmed that, in most samples, the weakest point of the wood-epoxy resin layer was the epoxy resin itself. This is illustrated by the series of circles in Fig. 7, where the lowest spot is denoted by the circle with a dotted outline. These failures are often mistaken for adhesive failures, especially during free examinations of transparent coatings. The appearance of wood fibres in the epoxy resin layer means that the weakest point was the phase boundary of the resin with the impregnated beech wood layer (Fig. 8). None of the samples in the experiment exhibited a typical adhesive failure. This confirms that the epoxy resin has a good adhesion to beech wood. Since the failure was located in the epoxy resin, the question arises as to why the shear strength was lower in the second sample set. During the curing of the second sample set, the samples were placed in a φ = 93%, and they were then conditioned back to an MC = 8% after the resin was cured. Even such a short increase in air humidity caused stresses to form at the wood–resin phase boundary; these were described in the previous chapter. These stresses caused the lower shear strength. Hydrophilicity andporosity ofwoodareimportant duringwoodmodificationby resins (Stefanowski et al., 2018). According to these authors, the type of resin has a significant influence on wood modification. Resins that react with hydroxyl groups in the wood also
Fig. 7 A – C Examples of the cohesive failure in the epoxy resin, D is the schematic illustration of the weakest spot in the wood-epoxy resin system.
Fig. 8 A – C Examples of a cohesive failure in the epoxy resin and in the resin-impregnated layer of beech wood. D is a schematic illustration of the weakest spot in the wood-epoxy resin system.
react with water. Therefore, the moisture content of wood is significant during the reaction of epoxy resin with hydroxyl groups. The moisture content of wood, together with relative airhumidity,influencethepolymerizationofepoxyresin(Bilyeu et al.,1999,Rowell,2012).
The negative results of humidity changes in the environment during the mechanical tests of wood-resin systems were also presented in the works of Kovařík and Tesařová (2022) and Kovařík et al., (2023).
CONCLUSION
Based on the results, the following conclusions can be stated.
Studying the dimensional changes of openings in wood filled with casting epoxy resin revealed that the openings swelled proportionally with the swelling of the wood. The swelling caused the epoxy resin to separate from the beech wood. The stability of the beech wood–epoxy resin phase boundary was disrupted.
A steep height difference between the epoxy resin and the thickness of the beech wood was observed after the swelling. This is considered a significant fault in a product.
During the shrinking of the beech wood samples with epoxy resin, limited shrinkage was observed in the vicinity of the openings, which may have caused cracks in the wood. The height difference between the epoxy resin and beech wood in the vicinity of the phase boundary was tapered.
The adhesion of the epoxy resin to wood was tested using a shear strength test parallel to the grain. This test demonstrated that the resin exhibited good adhesion to the beech wood. The samples did not exhibit adhesive failure; instead, cohesive failure in the epoxy resin near the phase boundary was observed.
REFERENCES
Bilyeu,B.,Brostow,W.,Menard,K.P.,1999 EpoxyThermosetsandTheirApplicationsI:Chemical Structures and Applications. Journal of Materials Education Vol. 21(5&6): 281-286.
Deka, M., Saikia, C. N., 2000. Chemical modification of wood with thermosetting resin: effect on dimensional stability and strength property. Bioresource Technology 73, 179–181.
https://doi.org/10.1016/s0960-8524(99)00167-4
Dieste, A., Krause, A., Bollmus, S., Militz, H., 2008 Physical and mechanical properties of plywood produced with 1.3-dimethylol-4.5-dihydroxyethyleneurea (DMDHEU)-modified veneers of Betula sp. and Fagus sylvatica. Holz Als Roh- Werkstoff 66, p. 281. https://doi.org/10.1007/s00107-008-0247-3
Dubovský, J., Kúdela, J., 1988 Vplyv cyklických zmien vlhkosti na rozmerové zmeny otvorov v drevea drevav okolí otvoru [Theeffect ofcyclicchangesinhumidityondimensional changes in holes in wood and the wood around the hole]. Drevo, 43, 323–325.
Frihart, C. R., 2005. Wood adhesion and adhesives. Handbook of wood chemistry and wood composites. Boca Raton, Florida: CRC Press, 2005, pp. 215-278.
Guo, D., Guo, N., Fu, F., Yang, S., Li, G., Chu, F., 2022. Preparation and mechanical failure analysis of wood–epoxy polymer composites with excellent mechanical performances. Composites Part B: Engineering, 235, 109748. https://doi.org/10.1016/j.compositesb.2022.109748
Hill, C., 2006. Wood Modification: Chemical, Thermal and Other Processes. John Wiley & Sons 2006 https://doi.org/10.1002/0470021748
Homan, W. J., Jorissen, A. J. M., 2004 Wood modification developments. Heron 49(4): 361 – 385. Kačík, F., Kúdela, J., Výbohová, E., Jurczyková, T., Čabalová, I., Adamčík, L., Kmeťová, E., Kačíková, D., 2025. Impact of Thermal Treatment and Accelerated Aging on the Chemical
Composition, Morphology, and Properties of Spruce Wood. Forests, Vol 16 (1) https://doi.org/10.3390/f16010180
Kovařík R., Tesařová D., 2022 Surface treatment of composite materials based on epoxy casting resins and solid wood. XV. Konference pigmenty a pojiva: sborník/Conference Proceedings Pardubice: Chemagazín, 2022, pp.71-79.
Kovařík, R., Tesařová, D. Kúdela J., 2023. Analysis of durability characteristics of composite material based on epoxy casting resins and solid wood with focus on surface finish. XVI. Konference pigmenty a pojiva: sborník/conference proceedings Pardubice: Chemagazín, 2023, pp 66-74.
Kúdela, J., Čunderlík, I., 2012. Bukové drevo – štruktúra, vlastnosti, použitie. Technická univerzita vo Zvolene, Zvolen [Beech wood – structure, properties, use. Technical University in Zvolen, Zvolen]
Kúdela, J., Dubovský, J., 1986 Rozmerové zmeny otvorov v dreve a dreva v okolí otvoru vplyvom zmien vlhkosti [Dimensional changes in holes in wood and the wood around the hole due to changes in humidity]. Drevo, 41, 361 – 364.
Kúdela, J., Hrčka, R., Svocák, J., Molčanová, S., 2024. Transparent Coating Systems Applied on Spruce Wood and Their Colour Stability on Exposure to an Accelerated Ageing Process. Forests, Vol. 15 (1) https://doi.org/10.3390/f15111865
Kúdela, J., Liptáková, E., 2006. Adhesion of coating materials to wood. Journal ofAdhesion Science and Technology, vol. 20,(8), pp. 875–895. https://doi.org/10.1163/156856106777638725
Kumosa, M. S., 2006 Damage Mechanisms in Polymer Matrix Composites in Extreme Environments. Key Engineering Materials Vol. 324–325, pp. 663–666. Trans Tech Publications, Ltd. https://doi.org/10.4028/0-87849-413-8.663
Kurjatko, S., Kúdela, J., Lawniczak, M., Lübke, H., 1987. Modifikácia imisného smrekového dreva metylmetakrylátom a styrénom [Modification of polluted spruce wood with methyl methacrylate and styrene] Modyfikacja drewna '87. Rydzyna, AR Poznań, pp. 156–166.
Lagaňa, R., Janeka, A., Andor, T., 2021. Selected elastic properties of thermally treated beech wood. In:9thHardwoodProceedings,Vol.9 –PTII: AnUnderutilizedResource –HardwoodOriented Research, 56 – 60.
Liptáková, E., Kúdela, J., Paprzycki, O., 1991. The adhesion of polystyrene to wood. Holz als Roh und Werkstoff, 49, vol. 1, 31–37. https://doi.org/10.1007/bf02627548
Pacas P., Tesařová D., Kovařík R., Paul D., 2023 Study of the Effect of Alternating Climatic Conditions and Mechanical Loading on the Strength Properties of Joints Between Cast Epoxy Resin and Solid Wood. XVI. Konference pigmenty a pojiva: sborník/conference proceedings Pardubice: Chemagazín, 2023, pp 66-74.
Požgaj, A., Kurjatko, S., Chovanec, D., Babiak, M., 1997 Štruktúra a vlastnosti dreva [Structure and properties of wood] Bratislava: Príroda, 487 p.
Reinprecht, L., 2016. Wood Deterioration, Protection and Maintenance. John Wiley & Sons, p. 357. Rowell, R.M., 2012. Handbook of Wood Chemistry and wood composites. 2nd Ed. CRC Press, Taylor and Francis group, Boca Raton, Florida, USA p. 703.
Rowell, R. M., Barbour, R. J., 1990. Archaeological wood: Properties, chemistry, and preservation. Washington, DC: American Chemical Society. 472 p.
Sandberg, D., Kutnar, A., Karlsson, O., Jones, D., 2021. Wood Modification Technologies: Principles, Sustainability, and the Need for Innovation, 1st ed.; CRC Press: Boca Raton, FL, USA https://doi.org/10.1201/9781351028226-1
Slabejová, G., Vidholdová, Z., Šmidriaková, M., 2023. Change in the Colour of Transparent Surface Finish on Hydrothermally Treated Wood. Acta Facultatis Xylologiae Zvolen. Vol. 65 (1), p. 45 – 56. https://doi.org/10.17423/afx.2023.65.1.04
Spear, M. J., Curling, S. F., Dimitriou, A., Ormondroyd, G. A., 2021. Review of Functional Treatments for Modified Wood. Coatings, 11, 327 https://doi.org/10.3390/coatings11030327
Stamm, A. J., Seborg, R. M., 1943. Resin treated wood (Impreg). USDA Forest Service Forest Products Laboratory Report No. 1380. Madison, WI.
Stamm, A. J., Seborg, R. M., 1944 Resin treated laminated compressed wood (Compreg). USDA Forest Serv. Forest Prod. Lab. Rep. No. 1381, Madison, WI.
Stefanowski, B., Spear, M., Pitman, A., 2018. Review of the use of PF and related resins for modification of solid wood. In: M. Spear (Ed.), Timber, pp. 165-179.
Vanlandingham, M., R., Eduljee, R., F., Gillespie, J. R., 1999. Moisture diffusion in Epoxy Systems. Journal of Applied Polymer Science 71 (5): 787 – 798, https://doi.org/10.1002/(SICI)10974628(19990131)71:5<787::AID-APP12>3.0.CO;2-A
Wondmagegnehu, B. T., Legesse, A. A., 2023. Experimental Investigation of Mechanical and Physical Properties on Epoxy Resin with Wood Timber for Furniture Application. Journal of Natural Fibers, 20(2), 2286327. https://doi.org/10.1080/15440478.2023.2286327
Zhou, A., Li, K., Yang, G., Liu, T., Qin, R., & Zou, D., 2025. Effect of temperature and humidity on the mechanical behavior of basalt FRP bonded wood under sustained load: An experimental and atomistic study. Journal of Building Engineering, 104, 112325. https://doi.org/10.1016/j.jobe.2025.112325
ACKNOWLEDGMENT
The authors would like to thank Ing. Stanislav Vágner for his help with sample production and execution of the experiments. This research was supported by the Scientific Grant Agency of the Ministry of Education, Science, Research and Sport of the Slovak Republic, VEGA contract number 1/0656/23 “Stabilizáciavlastností modifikovanýchpovrchov drevaasystému drevo –filmotvornálátka vprocesestarnutia”(Stabilizationofmodifiedwoodsurfaceproperties andthewood-coating material system in the process of aging).
AUTHORS’ ADDRESSES
Ing. Barbora Slováčková, PhD. Ing. Radek Kovařík Department of Wood Science Faculty of Wood Science and Technology Technical University in Zvolen T. G. Masaryka 24 960 01 Zvolen Slovakia xslovackova@tuzvo.sk xkovarik@is.tuzvo.sk
ACTA FACULTATIS XYLOLOGIAE ZVOLEN, 67(1): 101 107, 2025
Zvolen, Technická univerzita vo Zvolene
DOI: 10.17423/afx.2025.67.1.09
BIOMASS FROM THE WOOD PROCESSING INDUSTRY AS A SOURCE OF PHENOLIC COMPOUNDS FOR VARIOUS CHEMICAL APPLICATIONS
Martin Štosel – Aleš Ház – Richard Nadányi
ABSTRACT
European forests, which cover approximately 1,040 million hectares in Europe, are crucial sources of renewable biomass. In the Slovak Republic, where forests constitute 41.3% of the land area, broadleaf forests are the dominant type; however, the processing of coniferous wood,particularly spruce (Picea abies),is highlyprevalent.Sprucewoodis extensively used in the papermaking and construction industries due to its rapid growth and increased wood mass production. This study aims to extract phenolic compounds from spruce bark, a byproduct of the wood industry, using supercritical CO2 extraction a method known for its environmental safety and efficiency. The bark was manually collected, air-dried, and ground to a fraction size of 1-1.5 mm. To enhance the extraction of phenolic compounds, ethanol and ethyl acetate (1:1) were used as co-solvents. Design of experiment (DoE) was used to optimize the extraction conditions, varying temperatures from 40 °C to 140 °C and pressures from 80 to 480 bars. The results indicate that temperature has a significant impact on the extraction yield, with an indirectly proportional relationship observed. The optimal extraction conditions were identified at a temperature of 47.7 °C and a pressure of 80 bars, achieving the highest yield. Subsequently, an analysis was performed using gas chromatography coupled with mass spectrometry (GC-MS), which identified 27 terpenes, 11 resin acids, 4phenols, 4 phytosterols, and17othercompounds.Thetotal phenoliccontent (TPC) was determined using the Folin-Ciocalteu method as Gallic Acid Equivalent (GAE), ranging from 44.376 to 648.752 mg GAE/100 g of dry bark. The antioxidant activity was determined to be in the range from 27 269 to 284 642 mg GAE/g of sample.
Keywords: bark; extraction; phenolic compounds; supercritical extraction; industry utilization.
INTRODUCTION
Forests cover approximately 3.87 billion hectares of the Earth’s surface, with Europe accounting for more than a quarter of that, around 1.04 billionhectares. The European Union and its member states represent 5% of the global forest area, roughly 158 million hectares, which make up 37.7% of the EU’s land area. Between 1990 and 2010, the EU’s forested area grew by 11 million hectares (Nègre, 2022). A similar trend can be observed in Slovakia, where forest coverage has increased by 1% since 1990, and forests now comprise 41.3% of the country’s territory (Výročná Správa, 2021, 2022). Coniferous forests make up the largest portion of EU forests at 42%, followed by broadleaf forests at 40% and mixed forests at 18%
(Négre, 2023). In Slovakia, however, broadleaf forests dominate, covering 64.25% of the total forested area (VýročnáSpráva 2021,2022). Despitetheprevalenceofbroadleafforests, coniferous wood processing is widespread in Slovakia, particularly in industries such as paper production and construction, where coniferous wood is favored as a building material. Conifers also benefit from a faster growth rate and higher wood mass yield compared to the slower-growing hardwoods of broadleaf trees. Their rapid growth and widespread distribution across Europe make coniferous forests an excellent source of renewable raw materials.
European forests provide a significant source of renewable biomass, with nearly half of the renewable resources used for energy production coming from wood. Of the wood harvested, approximately 42% is utilized in the energy sector, 24% is used by sawmills, 17% is used in the paper industry, and 12% is allocated for the production of wooden boards (Nègre, 2022). The industrial processing of wood also produces a significant number of byproducts, including bark, leaves, needles, and fruits or cones, which are predominantly used for energy generation today.
However, numerous studies indicate that by-products from the forestry, wood, and paper industries contain valuable compounds, particularly phenolic substances. These compounds are widely recognized for their beneficial properties, including antioxidant or scavenging of free radicals, antiviral (Tirado-Kulieva et al., 2022), antibacterial, antifungal (Burčová et al., 2018), cardioprotective and neuroprotective (Freyssin et al., 2020; Rege et al., 2014), anti-inflammatory (Ali Redha, 2021; Lesjak et al., 2011), and especially anticancer (Ali Redha, 2021; Burlacu and Tanase, 2021) effects. As secondary metabolites in plants, phenolic compounds have garnered significant attention in research due to their diverse bioactive properties.
Due to their beneficial effects, these substances have a broad range of applications in industries such as pharmaceuticals, cosmetics, and food, where they are used to extend the shelf life of products (Silva et al., 2021). There is also ongoing research into incorporating phenolic compounds as additives in polymers, mainly for their antioxidant properties (Samper et al., 2013). Furthermore, these phytochemicals are utilized in agriculture for plant protection, particularly as a defense against harmful insects (Neis et al., 2019). These properties are mainly due to their chemical structure, which includes at least one benzene ring substituted with one or more hydroxyl groups. The hydrogens in the hydroxyls are easily donated in radical reactions, allowing these compounds to act as effective radical scavengers (de la Rosa et al., 2019).
Supercritical CO2 extraction is recognized as a safe and environmentally friendly alternative to traditional extraction methods, which often rely on large amounts of organic solvents. While this technique is primarily used for the isolation of lipophilic compounds, adding a cosolvent like ethanol can shift the polarity, allowing a wider range of substances to be extracted. The use of cosolvents enables this method to isolate natural phytochemicals, including phenolic compounds, which are relatively abundant in plant biomass (Bukhanko et al., 2020; Ghoreishi et al., 2016).
The aim of this study is to highlight the potential of utilizing waste biomass from the wood-processing industry, specifically bark, as a valuable source for extracting bioactive compounds and their subsequent applications across various industrial sectors.
MATERIALS AND METHODS
Spruce (Picea abies) bark was manually collected in May 2023 from four trees in western Slovakia near the city of Nitra, air-dried at laboratory temperature, and then ground
to a particle size of 1 to 1.5 mm. The prepared sample was stored in a dark, dry environment until further use.
The moisture content of the spruce bark was measured using the gravimetric method by drying the sample at 105 °C until it reached a constant weight according Tappi T201 cm03 (2003). Approximately 1 g of the sample was used for this determination, resulting in a moisture content of 9.39%.
Extraction by supercritical carbon dioxide
The extraction of natural substances from spruce bark was performed using the SFT150 SFE SYSTEM laboratory equipment from Supercritical Fluid Technology, Inc. Pure CO2 (> 99%, Messer) was used as the extraction agent, with pure ethanol (> 94%, Centralchem) and pure ethyl acetate (> 99.7%, Centralchem) serving as cosolvents in a 1:1 ratio in a batch extraction process.
Two factors and five levels design of experiment (DoE) was used to determine the dependence of extraction yield from the extraction conditions, namely temperature and pressure. The temperatures range from 40 °C to 140 °C and pressures from 80 to 480 bars. For each experiment, approximately 20 g of spruce bark was weighed and extracted. The flow rate of the extraction mixture was maintained at 2 ml/min during the discharge phase of the extraction. The extraction was carried out in dynamic mode for 60 minutes, and the collectedextractwas storedinavialwith aseptum.Thevialwascooledduringtheextraction using ice bath and stored in a freezer for further analysis.
The extracted spruce bark samples were then lyophilized for 24 hours using a Lyovac GT2 (Leybold-Heraeus) lyophilizer. The extraction yield was calculated by comparing the weight of the absolutely dry fresh sample to the weight of the extracted and lyophilized bark.
Gas chromatography
Gas chromatography and mass spectrometry (GC-MS) analysis was conducted using an Agilent 7890 GC gas chromatograph coupled with an Agilent 5975C mass detector, operating in electron ionization mode. The system utilized a capillary column (HP-5MS, 30 m × 250 μm i.d., 0.25 μm film thickness; Agilent) for the separation and analysis of the extracted compounds. The temperature program for the chromatograph oven started at 80 °C, held for 2 minutes, then increased at a rate of 10 °C/min to 260 °C, followed by heating rate of 5 °C/min to 300 °C. The final temperature was maintained for 8 minutes. The minimum concentration of the extract in the solvent was set to 10 mg/mL, and the injection volume was 1 µL.
Determination of Total Phenolic Content
Thetotal phenoliccontent (TPC)inthe sprucebarkextracts was determined using UVVis spectroscopy, which involves previous redox reactions of Folin-Ciocalteu’sreagent with phenolic compounds. To prepare the stock solution, 0.25 g of the extract was placed in a 10 mL flask, which was then filled with ethanol. The reaction mixture was prepared by combining 0.25 mL of the stock solution with 0.25mL of Folin-Ciocalteu’s reagent and 1.25 mL of a 20% Na2CO3 solution in a 10 mL volumetric flask, which was subsequently filled with distilled water. After thorough agitation, the mixture was allowed to stand for 1 hour at ambient temperature. The absorbance of the resulting solution was measured against blanks using 0.5 cm cells at a wavelength of 765 nm. The concentration of phenolic compounds was expressed as milligrams of gallic acid equivalents (GAE) per 100 g of dry bark, using a linear calibration curve. All measurements were conducted in triplicate for each individual sample (Jablonsky et al., 2020).
Determination of Antioxidant Activity
The determination of antioxidant activity (AOA) in the extracts was carried out based on the free radical scavenging ability of 2,2-diphenyl-1-picrylhydrazyl (DPPH) using a modified method from (Brand-Williams et al., 1995). Samples with a concentration of 350 µg/mL were prepared using the same solvent mixture (ethanol and ethyl acetate in a 1:1 v/v ratio) employed during the extraction process. A DPPH solution was then prepared at a concentration of 120 µg/mL. The prepared solutions were mixed in a 1:1 ratio and measured at a wavelength of 517 nm using the Epoch 2 microplate reader from BioTek USA.
RESULTS AND DISCUSSION
The DoE aimed to optimize extraction conditions, specifically temperature and pressure, to achieve the highest possible extraction yield. In total, 13 extractions were conducted over a temperature range of 40 to 140 °C and a pressure range of 80 to 480 bars. The extracts were collected in cooled vials to minimize the undesirable evaporation of volatile compounds and the solvents used (ethanol and ethyl acetate in a 1:1 v/v ratio).
Following the completion of all experiments, we assessed the optimal extraction conditions. The mathematical model developed for this work indicated that extraction temperature significantly affects yield during the supercritical extraction of spruce bark using carbon dioxide. The optimal conditions for achieving the highest extraction yield were determined to be 47.7 °C and 80 bars. These conditions will be used for further extraction to validate the results of the planned experiment. Notably, the results demonstrated an inverse relationship between temperature and extraction yield
Based on the analysis of extracts from spruce bark using GC-MS, a total of 63 compounds were identified: 27 terpenes, 11 resin acids, 4 phenolic compounds, 4 phytosterols, and 17 other substances (Tab 1). This distribution indicates that predominantly lipophilic groups of phytochemicals were extracted. This fact can be explained by the extraction with supercritical carbon dioxide, which primarily obtains non-polar and lipophilic natural molecules from plant matrices (Bukhanko et al., 2020; Ghoreishi et al., 2016). A change in polarity can be achieved by the addition of co-solvents such as ethanol and ethyl acetate, which in our case proved ineffective compared to the use of a mixture of ethanol and water. However, our extracts demonstrate higher antioxidant activity as well as total phenolic content compared to comparable extractions using 10%, 20%, and 40% ethanol as co-solvents.
Theevaluation oftotal phenoliccontentin individual extract samples from theplanned experiment was performed using the Folin-Ciocalteu method, and the results were expressed as mg GAE per 100 g of dry bark. The highest total phenolic content was 648.752 mg GAE/100 g of dry bark, corresponding to extraction conditions of 90 °C and 40 bars, while the lowest TPC value of 44.376 mg GAE/100 g of dry bark was observed at the highest temperature of 140 °C and a pressure of 80 bars.
The results of the AOA evaluation, measured as the DPPH radical scavenging ability, ranged up to 284.642 mg GAE/g of the sample under extraction conditions of 40 °C and 90 bars. In contrast, the lowest AOA value 27,269 mg GAE/g of sample was found under extraction conditions of 90 °C and 480 bars.
The results of both the TPC and AOA assessments suggest that these values are significantly influenced by pressure and increased temperature, which may cause thermal degradation of the molecules in the extract.
Tab.1 Table of identified compounds in spruce bark extracts by GC-MS.
030460-92-5
000507-70-0
6,682 Verbenyl ethyl ether (9;15)
6,889 L-α-Terpineol
010482-56-1 17 6,961 2-Pínén-10-ol
019894-97-4 18 7,156 L-Verbenone
001196-01-6 19 7,597 Coumaran (14;15)
20 8,136 Bornyl acetate
000496-16-2
000076-49-3 21 8,648 2-Methoxy-4-vinylphenol (n.i.in7;8;13)
22 9,518 Decanoicacid,ethyl ester
23 9,57 β-Elemene
24 10,822 β-Selinene
25 10,92 α-Selinene
26 11,127 γ-Cadinene (11)
27 11,731 Citronellyl valerate (7;8;9;11)
28 12,841 Benzenepropanol,4-hydroxy-3-methoxy-
29 13,749 Oplopanone
30 13,925 Coniferyl
31 15,709 Thunbergen
007786-61-0
000110-38-3
000515-13-9
017066-67-0
000473-13-2
39029-41-9
002305-13-7
001911-78-0
001898-13-1
32 15,988 Cambrene A (3;7;9;14;16) 272,25 031570-39-5
000596-84-9
33 16,345 Manoyl oxide
34 16,43 α-Pinacene (n.i.in7;8) 272,25 064363-64-0
35 16,923 Thunbergol
36 17,189 Sclareolide
37 17,475 Sclareol
38 17,695 Prasterone (3)
39 17,702 trans-β-Ionone (13)
000564-20-5
000079-77-6
40 17,708 Longifolene (11) 204,188 000475-20-7
41 17,793 Abienol (n.i.in9)
1616-86-0
42 18,221 1-Propene,1,2-bis(4-methoxyphenyl)- (n.i.in3;7;13;16) 254,131 020802-02-2
43 18,552 Copalol (n.i.in13) 290,261 021738-29-4
44 18,63 Copalicacidmethyl ester (1) 304,24 024470-48-2
013601-88-2
45 18,863 Dehydroabieticaldehyde
46 19,116 Retinoicacid
47 19,246 (3E,5E,7E)-6-Methyl-8-(2,6,6-trimethyl-1-cyclohexenyl)-3,5,7-octatrien-2-one (7;11;13) 258,198 017974-57-1
48 19,415 Methyl dehydroabietate 314,225 001235-74-1
49 19,461 Squalene (1) 410,391 111-02-4
50 19,681 Dehydroabietyl alcohol
003772-55-2
51 19,973 Retinol (1;3;11;14;16) 286,229 69-26-8
000112-88-9
52 20,492 1-Octadecene
53 20,583 Hexadecanoicacid,octyl ester (13;14;15) 368,365 16955-58-3
54 20,772 Methyl 7,13,15-abietatatrienoate
55 20,992 α-levantenolide (7;14;15;16)
54850-32-7
30987-48-5
56 21,044 15-Hydroxydehydroabieticacid,methyl ester (n.i.in14;15;16) 330,219 029461-23-2
57 22,336 Stearicacid,octyl ester (15;16) 396,396 109-36-4
58 23,153 Lignocericacid,ethyl ester (14;15) 396,396 24634-95-5
59 27,722 Campesterol (n.i.in1;13) 400,371 474-62-4
60 28,001 o-o-dimethyl-Pinoresinol (n.i.in1;8) 386,173 526-06-7
61 28,696 γ-Sitosterol 414,386 000083-47-6
62 30,377 γ-Sitostenone (n.i.in7) 412,371 84924-96-9
63 32,979 Dehydroabieticacid 300,209 001740-19-8
* (The numbers 1-13 indicate in which sample the respective molecules were identified or not identified.)
CONCLUSION
In this study, a two-factor and five level DoE was implemented to optimize the extraction conditions for supercritical carbon dioxide extraction, using ethanol and ethyl
ester as cosolvents in a 1:1 volumetric ratio. The evaluation of the results revealed that the optimal conditions for achieving the highest extraction yield were a temperature of 47 °C and a pressure of 80 bar.
The total phenolic content of the extracts was determined using the Folin-Ciocalteu method, with results ranging from 44,376 to 648,752 to mg GAE/100 g of dry spruce bark. Additionally, the antioxidant activity of the prepared extracts was assessed using the DPPH method. It was observed that the extract prepared at 40 °C and 90 bar exhibited the highest antioxidant activity (284.641 mg GAE/g of sample), whereas the lowest activity (27.269 mg GAE/g of sample) was obtained at the highest tested pressure of 480 bar combined with a temperature of 90 °C.
These results indicate that both the antioxidant activity and the total phenolic content of the extracts are significantly influenced by the extraction conditions, particularly temperature and pressure. Furthermore, elevated temperatures may lead to the thermal degradation of bioactive compounds present in the spruce bark sample.
The extracts were further evaluated through GC-MS, which identified 27 terpenes, 11 resin acids, 4 phenolic compounds, 4 phytosterols, and 17 other substances. Based on this distribution,it isclearthatthesupercritical extractionusing carbondioxideandthecosolvent ethanol and ethyl acetate in a 1:1 ratio did not succeed in increasing the polarity of the extraction medium to such an extent that the extraction of phenolic compounds would occur in larger quantities. However, looking at the total phenolic content, there appears to be a relatively high occurrence of phenolic compounds in the prepared extracts. The FolinCiocalteu method is an approximate determination of total phenolic content because the reagent reacts with hydroxyl groups. These groups may also be present in compounds such as terpenes, resin acids, and other substances, potentially skewing the results.
REFERENCES
Ali Redha, A., 2021. Review on Extraction of Phenolic Compounds from Natural Sources Using Green Deep Eutectic Solvents. Journal of Agricultural and Food Chemistry, 69(3), 878–912. https://doi.org/10.1021/ACS.JAFC.0C06641/ASSET/IMAGES/LARGE/JF0C06641_0002.JP EG
Brand-Williams, W., Cuvelier, M. E., Berset, C., 1995. Use of a free radical method to evaluate antioxidant activity. LWT - Food Science and Technology, 28(1), 25–30. https://doi.org/10.1016/S0023-6438(95)80008-5
Bukhanko, N., Attard, T., Arshadi, M., Eriksson, D., Budarin, V., Hunt, A. J., Geladi, P., Bergsten, U., Clark, J., 2020. Extraction of cones, branches, needles and bark from Norway spruce (Picea abies) by supercritical carbon dioxide and soxhlet extractions techniques. Industrial Crops and Products, 145, 112096. https://doi.org/10.1016/J.INDCROP.2020.112096
Burčová, Z., Kreps, F., Greifová, M., Jablonský, M., Ház, A., Schmidt, Š., Šurina, I., 2018. Antibacterial and antifungal activity of phytosterols and methyl dehydroabietate of Norway spruce bark extracts. Journal of Biotechnology, 282, 18–24. https://doi.org/10.1016/J.JBIOTEC.2018.06.340
Burlacu, E., Tanase, C., 2021. Anticancer Potential of Natural Bark Products A Review. Plants 2021, Vol. 10, Page 1895, 10(9), 1895. https://doi.org/10.3390/PLANTS10091895
De la Rosa, L. A., Moreno-Escamilla, J. O., Rodrigo-García, J., Alvarez-Parrilla, E., 2019. Phenolic Compounds. Postharvest Physiology and Biochemistry of Fruits and Vegetables, 253–271. https://doi.org/10.1016/B978-0-12-813278-4.00012-9
Freyssin, A., Page, G., Fauconneau, B., Rioux Bilan, A., 2020. Natural stilbenes effects in animal models of Alzheimer’s disease. Neural Regeneration Research, 15(5), 843. https://doi.org/10.4103/1673-5374.268970
Ghoreishi, S. M., Hedayati, A., Mohammadi, S., 2016. Optimization of periodic static-dynamic supercritical CO2 extraction of taxifolin from pinus nigra bark with ethanol as entrainer. The Journal of Supercritical Fluids, 113, 53–60. https://doi.org/10.1016/J.SUPFLU.2016.03.015
Jablonsky, M., Majova, V., Strizincova, P., Sima, J., Jablonsky, J., 2020. Investigation of Total Phenolic Content and Antioxidant Activities of Spruce Bark Extracts Isolated by Deep Eutectic Solvents. Crystals 2020, Vol. 10, Page 402, 10(5), 402. https://doi.org/10.3390/CRYST10050402
Lesjak,M.M.,Beara,I.N.,Orčić,D.Z.,Anačkov,G.T.,Balog,K.J.,Francišković,M.M., MimicaDukić, N. M., 2011. Juniperus sibirica Burgsdorf. as a novel source of antioxidant and antiinflammatory agents. Food Chemistry, 124(3), 850–856. https://doi.org/10.1016/J.FOODCHEM.2010.07.006
Nègre, F., 2022. The European Union And Forests. Fact Sheets on the European Union - 2023. https://www.europarl.europa.eu/ftu/pdf/en/FTU_3.2.11.pdf
Négre, F., 2023. Európska únia a lesy [The European Union and forests].
Neis, F. A., De Costa, F., De Araújo, A. T., Fett, J. P., Fett-Neto, A. G., 2019. Multiple industrial uses of non-wood pine products. https://doi.org/10.1016/j.indcrop.2018.12.088
Rege, S. D., Geetha, T., Griffin, G. D., Broderick, T. L., Babu, J. R., 2014. Neuroprotective effects of resveratrol in Alzheimer disease pathology. Frontiers in Aging Neuroscience, 6(AUG), 1–27. https://doi.org/10.3389/FNAGI.2014.00218/BIBTEX
Samper, M. D., Fages, E., Fenollar, O., Boronat, T., Balart, R., 2013. The potential of flavonoids as natural antioxidants and UV light stabilizers for polypropylene. Journal of Applied Polymer Science, 129(4), 1707–1716. https://doi.org/10.1002/APP.38871
Silva, N. C. da, Barros-Alexandrino, T. T. de, Assis, O. B. G., Martelli-Tosi, M., 2021. Extraction of phenolic compounds from acerola by-products using chitosan solution, encapsulation and application in extending the shelf-life of guava. Food Chemistry, 354, 129553. https://doi.org/10.1016/J.FOODCHEM.2021.129553
Tirado-Kulieva, V. A., Hernández-Martínez, E., Choque-Rivera, T. J., 2022. Phenolic compounds versus SARS-CoV-2: An update on the main findings against COVID-19. Heliyon, 8(9), e10702 https://doi.org/10.1016/J.HELIYON.2022.E10702
Výročná správa Slovenskej republiky 2021 [Annual Report of the Slovak Republic 2021] https://www.lesy.sk/files/lesy/o-nas/vyrocne-spravy/zoznam/2021/vyrocna-sprava2021_webova_verzia.pdf
ACKNOWLEDGMENT
This publication was supported by the Slovak Research and Development Agency under the contract No. APVV-22-0388 and VEGA 1/0743/24. Furthermore, this publication was supported by the project Extraction of natural compounds with added value from different types of biomasses (Grant STU Bratislava for young researchers).
AUTHORS’ ADDRESSES
Ing. Martin Štosel1
doc. Ing. Aleš Ház, PhD.1
Ing. Richard Nadányi, PhD.1,2
1Slovak University of Technology in Bratislava, Faculty of Chemical and Food Technology, Institute of Natural and Synthetic Polymers, Department of Wood, Pulp and Paper; Radlinského 9, 812 37 Bratislava;
2Christian Doppler Laboratory for Next-Generation Wood-Based Biocomposite, Institute of Chemical, Environmental and Bioscience Engineering (ICEBE), TU Wien, Getreidemarkt 9, 1060 Vienna, Austria martin.stosel@stuba.sk ales.haz@stuba.sk richard.nadanyi@stuba.sk; richard.nadanyi@tuwien.ac.at
ACTA FACULTATIS XYLOLOGIAE ZVOLEN, 67(1): 109 124, 2025
Zvolen, Technická univerzita vo Zvolene
DOI: 10.17423/afx.2025.67.1.10
FOUNDATION OF TIMBER STRUCTURES – CRAWL SPACE HEAT AND MOISTURE ANALYSIS WITH AIR AGE SIMULATION AND OCCURRENCE OF MICROMYCETES
Slávka Pobucká – Pavel Kučírek – Karel Šuhajda – Jan Holešovský
ABSTRACT
This study is focused on the analysis of the crawl space microclimate in timber structures in theCzechRepublic. It focusedontheconditionsin whichthetimberandfiberboardelements of the crawl space ceiling structure are located. As part of the analysis, air temperature, relative humidity, air flow within the crawl space were monitored. The average relative humidity within the crawl space reached up to 85% in summer and up to 90% in winter. The residence time of air in the crawl space was determined using air age simulation. A long residence time of air in the crawl space may pose a risk of capturing mold spores on the crawl space wall and ceiling surfaces. OpenFOAM software was used for the simulations. The analysis revealed the presence of fungal spores of the genera Penicillium, Aspergillus, and Cladosporium.
Keywords: timber structure; crawl space; micromycetes; age of the air; openFOAM.
INTRODUCTION
A crawl space is a type of building foundation prevalent in regions such as the United States and northern European countries. For instance, up to 56% of detached houses built in Sweden between 1990 and 2003 feature crawl space foundations (Burke, 2007; Lynn et al., 2011). There is no tradition of crawl spaces in the Czech Republic, but we have been encountering them more and more often recently. Numerous studies on crawl space microclimates originate from countries where crawl spaces are traditional. These include studies from Finland (Kurnitski and Matilainen, 2000; Matilainen and Kurnitski, 2003; Airaksinen et al., 2003; Laukkarinen and Vinha, 2017), Sweden (Bok et al., 2009; Airaksinen et al., 2020; Risberg and Westerlund, 2020), Denmark (Vanhoutteghem et al., 2017) and USA (Erickson and Zhai, 2008). These studies focus not only on monitoring the temperature and relative humidity in the crawl space but also on the possibility of ventilation inthespaceor theoccurrenceofmoldonthestructure'ssurfaces. Investigationsof numerical simulations in the crawl space were also conducted with the aim of predicting the temperature and humidity conditions within the crawl space (Vanhoutteghem et al., 2017). Generally, the most significant problem related to crawl spaces is high relative humidity, which can reach values up to 85% - 95%. During the summer months, water vapor can condense on the cooler surface of the structure (Kurnitski and Matilainen, 2000; Matilainen and Kurnitski, 2003). The ceiling structure or foundation walls can be damaged by persistent high humidity in the crawl space. The ceiling structure is usually made of wood
and wood-fiber material. The wooden element in the crawl space is the foundation sill of the load-bearing walls of the first floor. It can also cause deterioration of indoor air quality and may be associated with health problems. The repair needs of buildings damaged by dampness and mold are addressed in a study (Annila et al., 2018), which found that up to 85% of the surveyed crawl space buildings required repair. A study from China and Japan (Yuan et al., 2024) highlighted the problem of high humidity in buildings with walls in contact with the ground. A crawl space can also be considered a type of structure. The thermal capacity of the ground contributes to lower temperatures during spring and summer, as well as higher relative humidity. The evaporation of soil moisture from the bottom of the crawl space can be influenced by the type of covering of the crawl space itself and the intensityofairexchange in thespace(Airaksinen et al.,2003; Kurnitski, 2001).Determining the air velocity within a crawl space is a complex issue, as higher air velocity can lead to increased evaporation of moisture from the bottom of the structure (Kurnitski, 2000).
Various dirt and contaminants, such as mold spores, can enter the crawl space through the supply air and settle on the surfaces of the foundation walls or ceiling structure. The probability of spore deposition may increase if the air in the crawl space remains for moreextended periods.Spores requiresuitableconditions fortheirgrowth anddevelopment, with spore germination potentially occurring at relative humidity levels as low as 60%. However, active growth is only evident at a relative humidity of 75-85% (Balík, 2008). The study conducted by Viitenen et al. (2010) states that the critical ambient relative moisture for mold growth is 75% with a temperature range of 0-50 °C. The critical relative humidity levels are 90-95% for concrete and 75-80% for wood. Critical conditions can be understood as conditions with a risk of material degradation due to microbiological contamination. If mold growth and development occur in the crawl space, there is a risk of spore infiltration into theliving spacethroughleaks in theceilingstructure(Keskikuru et al.,2018; Airaksinen et al., 2004). If the crawl space is pressurized, the living space can draw air from the crawl space through leaks in the floor (crawl space ceiling structure). Molds can generally be divided into two categories: molds commonly found in the air and molds found on damp building materials. Cladosporium is common in the air, while Penicillium and Aspergillus are classified as soil fungi. Aspergillus versicolor is commonly found in damp buildings and can grow in materials with inferior nutrient content, such as concrete (Engelhart et al., 2002; Fog Nielsen, 2003; Jarvis and Miller, 2005). The occurrence of Penicillium in crawl spaces is reported, for example, in a study from Sweden by Bok et al. (2009).
In this study, the focus is on a comprehensive analysis of the microclimate of crawl spacein theCzechRepublic,wherethis typeof foundationis not very common. IntheCzech Republic, crawl spaces are gaining popularity in small timber structures. The conditions in which the wooden and wood-fiber elements of the ceiling structure of the crawl space were located were investigated. The microclimate behavior of crawl spaces in the Czech Republic is not well described; therefore, this research was carried out. The analysis of a family house involves continuous measurements (air temperature, relative humidity and air flow). The measured data were evaluated using statistical methods. The occurrence of mold can have a negative impact on the crawl space boundary structures, especially the wooden parts. Therefore, the crawl space of the house under study was swabbed for the presence of mold on the ceiling structure and foundation wall. Then, the crawl space was subjected to air age simulations, which can be used to estimate how long an imaginary particle remains within the crawl space. For example, an imaginary particle can be thought of as a mold spore that becomes trapped on the surfaces of a structure.
MATERIALS AND METHODS
The evaluation of the microclimate of the crawl space of a family house in the Czech Republic is divided into four basic parts. The first part is an experimental measurementofthecrawlspace.Subsequently,themeasureddatawassubjectedtostatistical analysis to determine possible temperature and humidity differences between the tracts of the crawl space structure. The third part analyzes the potential presence of microorganisms, specifically molds, on the crawl space ceiling structure and foundation wall. The last part, air age, was simulated in the crawl space. It is the residence time of the imaginary particle in the crawl space that may indicate the possible capture of, for example, spores on the crawl space boundary structures. This study is a direct follow-up to the research conducted in the crawl space in October 2022, as described in Pobucká et al. (2024). Swabs of microorganisms on the structures were conducted, andtemperature and humiditymonitoring of the space was performed.
Measurements
Thehouse is built on acrawlspace foundationwithtwo floors above ground. The floor plan of the house is rectangular with dimensions of 10.680 × 6.740 meters (Fig. 1). The foundation walls of the crawl space are constructed of concrete blocks. The height of the crawl space is 1,200 mm (from the bottom of the crawl space to the ceiling structure). Thebottomofthecrawlspaceisapproximately750mmbelowthesurroundinggroundlevel. The bottom is covered with a geotextile on which the aggregate is placed. The ceiling is made of wooden beams with fiberboard sheathing. The U-value of the ceiling structure of the crawl space is 0.115 W/(m2K). A central foundation wall divides the crawl space lengthwise,creatingtwotracts of23.6m2 (small tract)and36.4m2 (largetract),respectively. There are vents in the surrounding foundation walls to allow natural ventilation of the crawl space. The area around the house is flat.
The microclimate in the crawl space was monitored using temperature and humidity sensors (Omega PLTH). The sensors were placed on the ceiling structure of the crawl space. Hot-wire thermoanemometers (Almemo FVAD 35) were placed in two selected vents to monitor the air flow. The vents marked in red in Fig. 1 are fully open and are not covered by any net or other cover. Data was recorded at 15-minute intervals. The location of the sensors is shown in Fig. 1.
Fig. 1 The location of the sensors in the crawl space.
External climate conditions were measured using Mobile Alerts sensors located approximately 700 m from the monitored timber structure. The direction and speed of the external wind weremeasuredat aheight of4.5metersabovetheground.Measurements were taken between April 2022 and August 2023. The average values from three sensors of the
small tract and three sensors of the large tract were used in the calculations. The reason for this was to capture temperature and humidity within the entire tract.
Statistical analysis
The behavior of the small and large crawl space tracts was analyzed. Of particular interest is the conformity assessment between the series observed in small and large crawl spacetracts, as well as theidentification of anysignificant differences, especiallyconcerning possible shifts in measured quantities. This concerns both the relative humidity and the air temperature.
Let us denote Xt S and Xt L as the time series of the quantity of interest, whether it be air temperature or relative humidity, observed at small and large tracts, respectively. We may assume the following decomposition (1).
where mt S , mt L are deterministic functions of time, and Et S and Et L are zero-mean random processes. Hence, Et S and Et L represent random deviations from the means mt S and mt L at time t. If the two series Xt S and Xt L differ only by a shift in their means, we have mt S = mt L + m Nevertheless, a more general form of m is possible. Particularly, the mean difference can be time-dependent, i.e., we have mt S = mt L + mt When dealing with meteorological data, this naturally arises as the means fluctuate with annual and/or other periods. Moreover, it is typical in the Czech Republic that there are greater differences between day and night temperatures in summer than in winter periods. Similarly, this also holds for relative humidity. Significantly different observations in the large tract would then result in values of mt that significantly differ from zero. that are significantly different from zero. We are mainly interested in testing two substantially related hypotheses:
1. It is expected that the mean relative humidity in the small tract should be higher than in the large tract.
2. Similarly, we may expect that the size of the space could have a negative effect on the air temperature.
The inference about mt can be made based on the series of differences Yt = Xt S – Xt L = mt + Et, where Et is again zero-mean random noise. In the first approach, we summarize the basic characteristics of a particular series, i.e., their means, standard deviations, or maxima, observed during different year seasons. In the following, we apply techniques of time series analysis for the estimation of mt. Specifically, we consider a regression model with seasonal components of the form (2).
with regression parameters
where k is the number of periods Ti incorporated into the model. The periods can be identified using a periodogram in combination with Fisher’s test to determine their significance, see e.g. Shumway & Stoffer (2017). The estimates of parameters in the model are commonly obtained using the Ordinary Least Squares (OLS) method. Based on the covariance matrix of the estimated parameters, we can evaluate confidence intervals for mt at a given time t and decide hereby about the significance of the difference m
S - mt L. However, the covariance structure of the noise Et, particularly its serial correlation, may negatively influence the quality of the estimates. This comprises both the parameters and their variability. Here, we consider the ARMA (p, q) model for the random process Et, and apply the Cochrane-Orcutt procedure to adjust the OLS estimates above, for details see Brockwell and Davis (2016)
Microbial analysis of the ceiling structure and foundation wall
The presence of microorganisms on the ceiling structure and foundation wall was analyzed. The swab was taken in May 2023 using a 100 cm2 stencil with a wipe sponge –BIOING, SR18-10BPW-G. No sterilization methods have been carried out in the crawl space since sampling in October 2022. Nevertheless, the air age is indicative not only of assessing growth conditions for any molds already present before April 2022 but also in terms of quantifying the likelihood that any incoming organism is captured in space. The test sponge was moistened with peptone water to improve adhesion to the surface. The sampling was conducted in accordance with EN ISO 18593 (2019). The sponge was aseptically removed from its protective packaging and pressed against the wall with moderate pressure. It was then moved, both vertically and horizontally, to collect the sample. The sponge was then resealed in its protective packaging without exposure to air to prevent contamination of the sample. The sample was transported to the laboratory within 24 hours in a cool box maintained at 1-8°C (Pobucká et al., 2024). Fig. 2 shows the sampling process


Process of cultivation of isolates:
• In the laboratory, the sample was placed in 40 ml of sterile saline solution and shaken in a Stomacher homogenizer for 1 minute.
• One milliliter of the solution was inoculated onto Petri dishes (dish diameter 90 mm) with Chloramphenicol Glucose Agar for the selective detection of yeasts and molds. Furthermore, 0.1 ml of the solution was inoculated onto a Petri dish with PCA (Plate Count Agar) for the enumeration of live, culturable heterotrophic microorganisms, including bacteria, yeasts, and molds. Petri dishes were inoculated in two replicates.
• Plate Count Agar was incubated for 72 hours at 30°C.
• Chloramphenicol-glucose agar was incubated for 5 days at 25 °C.
• The number of microorganisms was expressed as colony-forming units per 100 cm2 - CFU/100 cm2 .
• The sample was further subjected to identification; therefore, morphologically distinguishable colonies of filamentous fungi were subcultured. Subculturing was performed with Chloramphenicol Glucose Agar at 25 °C.
• To investigate the microscopic morphology of the fungi, a seven-day culture grown on Malt Extract Agar (MEA, OxoidTM) in the dark at 25 °C was established. Macroscopic morphological characters were examined on seven-day-old cultures grown on Sabouraud dextrose agar (OxoidTM) at 25 °C in the dark (Pobucká et al., 2024).
Numerical simulation in crawl space
The age of the air in the crawl space was simulated for westerly and easterly air flows. The westerly direction was chosen because it corresponds to the prevailing wind direction at the site. The eastern direction was chosen because of the fence near the house, which can
a)
b)
Fig. 2 Sampling template on the a) ceiling structure and b) foundation wall.
affect theairflow withinthecrawlspace.Thefence consists ofagabion wall with awooden infill that restricts air flow. The speed, 1.0 m/s, was set at a height of 4.5 m above the ground to compare the air distribution in the two cases. The RANS (Reynolds-averaged NavierStokes) turbulent model was employed in the simulations, along with the k- ε model. Reynolds decomposition is used to derive the RANS equations (Zhang et al., 2020) of the form of the resulting equations (3), (4), (5).
Where: t denotestime, p is theinstantaneous pressure, v is thekinematicmolecularviscosity, ������ is the strain-rate tensor, c the instantaneous concentration, D the molecular diffusion coefficient and xi, ui the instantaneous position and velocity. Next, (��′���� ′) is the turbulent mass flux and (���� ′���� ′)is the Reynolds stress. The logarithmic wind law was used for the outdoor air flow, i.e., wind speed increases logarithmically with height. The difference in air pressure indicates wind speed; the greater the gradient, the faster the air flow is (Mareike et al., 2014; Solari, 2019; Zhang et al., 2020).
Where: u is the longitudinal wind speed, ��∗ is the frictional velocity, z0 is the roughness height and κ is the von Kármán constant. The terrain around the object was included in the simulation using the terrain parameter z0 (0.05 m). A simplified house model was created for the simulation and a steady-state isothermal model was established. The convergence margin was set at 10-3. The domain size was chosen to be 5H upstream, 15H downstream and 5H lateral distance. The value of H is the height of the building. The simulations were performed by OpenFOAM software. The model was validated against the measured data. (Tominaga et al., 2008; Abu-zidan et al., 2021; Pobucká et al., 2024). Subsequently, the age of the air in the crawl space was calculated as a post process of the air flow. The transport equation (7) is used to calculate the age of the air in space, (Hayashi et al., 2002; Li et al., 2003).
Where: D is the diffusion coefficient in m2/s, u is average speed in the x direction in m/s, v is average speed in the y direction in m/s, w is the average speed in the z direction in m/s and τ is age of air in seconds.
RESULTS AND DISCUSSION
Air flow
Hot-wire thermoanemometer T17 was in the vent on the east side (large tract) and hotwire thermoanemometer T18 was in the vent on the west side (small tract). The average air
flow was 0.45 m/s (sensor T17) and 0.36 m/s (sensor T18). Whereas the outdoor air flow reached up to 2.2 m/s, the air flow in the vents ranged from 0.10 to 0.75 m/s.
Air temperature
In the next step, we analyze the data from the temperature-humidity sensors placed in thecrawlspace. Fromthe 15-minuterecordswedeterminethecorresponding dailyaverages. Trajectories of daily air temperatures observed in the small and large tracts are shown in Fig. 33. The path of differences (Fig. 3) suggests overall higher temperature in the large tract. Nevertheless, the magnitude of the difference varies between year seasons, being less significant during the winter period. A summary of the fundamental characteristics of each season is provided in Table 1. There is considerable variation in the mean between winter and summer, most notable for summer 2023. Even more important are the deviations on the daily scale, as expressed by the maximum in Table 1. On a particular day in autumn 2022, the difference reached up to 0.31 °C. Notice that the standard deviations in Tab. 1 are evaluated under the assumption of constant mean in the given period, i.e., in case of significant non-stationarity of the series, are the values markable overestimated

Inference on daily differences is conducted based on a seasonal regression model with ARMA errors from Sect. Statistical analysis of the data. We consider only the presence of annual periodicity, yielding themeanoftheform
.Other harmonic components identified using a periodogram have, however, not clear meaning and their interpretation within the context of a crawl space is problematic. Namely, these correspond to periods 36, 13, 15, and 20 days. Such periodicities arise most likely because of our simplified assumption on stationarity of the random noise. Nevertheless, our computations have shown that the conclusions regarding the significance of the temperature difference remain the same even when such periodicities are incorporated into the model. As discussed in Sect. Statistical analysis of the data reveals that theOLS estimates arebiaseddueto thepresenceof serial correlation in theerrorsandrequire adjustmentusingtheCochrane-Orcutt procedure. Forthis purpose,weconsiderARMA(1,0) process for the random errors, i.e., we suppose
with white noise
Fig. 3 Daily air temperatures in the small (blue) and large (red) crawl space, outdoor air temperature (black).
Tab. 1 Overview of basic characteristics for each period.
The parameter estimates (std. error) for the simplest annual model are: β0 = -0.438 (0.0012), a1 = 0.047 (0.0022), b1 =-0.098 (0.0024), φ1 = 0.678 (0.0287) Based on the estimated covariance matrix, we evaluate for all time points t the 95% confidence interval for mt. This is illustrated in Fig. 4. The lower plot in Fig. 4 displays the variant with all incorporated harmonic components. In neither case does the confidence interval cover the zero value; hence, the difference between mean temperatures in small and large tracts is significant.
Themeanaverageairtemperaturewas11.97°C(smalltract)and12.41 °C(largetract). The air temperature in the crawl space was up to 3°C lower in summer 2022 and 3.8°C lower in summer 2023 than the outdoor air temperature.
Relative humidity
The same analysis was performed in the context of observed relative humidity. Trajectories of daily averages are shown in Fig. 5. The paths of the different series (Fig. 6) suggest that the relative humidity is overall higher in small tracts, with season-dependent deviations. However, the plot also shows some interannual progress (compare the left and right parts of Fig. 5).
Basic descriptive characteristics for particular seasons are given in Tab. 2. While relative humidity in particular tracts changes during the year, the differences between small and large tracts are quite similar in summer or winter. Nevertheless, the year-to-year fluctuations are remarkable, mostly evident for the two summer seasons. Notable are also the daily differences between tracts; its daily maximum was almost 10% in the summer of 2023 and remained relatively stable at around 8% in 2022.
Fig. 4 Differences in daily air temperature values in the small and large wings of the crawl space.
Fig. 5 Daily air relative humidity in the small (blue) and large (red) crawl space, outdoor air temperature (black).
Tab. 2 Overview of basic characteristics for each period.
For statistical inference on the mean difference mt we consider again the regression model with ARMA (1.0) errors. We base it on model (2). However, the presence of a nonseasonal systematic component requires its modification. Specifically, we can consider a trend in the form of a polynomial. Considering the annual periodic component and linear trend, we obtain the model ���� =���� +��
The estimated mean function is shown in Fig. 6, together with a 95% confidence bound evaluated at a particular time point. The parameter estimates (std. error) for the simplest annual model are: β0 = 2.818 (0.1699), β1 = 2.818 (0.1699), a1 = 0.101 (0.0880), b1 =0.699 (0.0864), φ1 = 0.686 (0.0265). Herefollowstheconclusionthattherelativehumidityinthesmalltractissignificantlyhigher over the whole monitored period.
Fig. 6 Differences in daily relative humidity values in the small and large wings of the crawl space.
The mean average relative humidity was 75.50% (small tract) and 71.60 % (large tract). The highest relative humidity values were measured during December, reaching 90.20% in the crawl space. During the summer, the average relative humidity in the crawl space ranged from 55 to 85%.
High humidity poses one of the possible risks to the structural parts of the crawl space, particularly the ceiling structure. The temperature in the crawl space during the summer months can be lower than the outside temperature. This temperature difference is due to the thermal capacity of the crawl space structure, which delays the equalization of air temperature between the outside environment and the crawl space. Consequently, this can lead to unstable and risky humidity conditions within the crawl space (Matilainen and Kurnitski, 2003; Sato and Nakajima, 2018; Airaksinen et al., 2020). Studies performed by Matilainen and Kurnitski (2003) and Vanhoutteghem et al. (2017) examine the impact of the thermal capacity of the ceiling structure on the microclimate in the crawl space. When reducing the U-value by half (from 0.4 to 0.2 W/(m2K)), the relative humidity in the crawl space was 10% higher and the air temperature was on average 2°C lower.
The conclusions drawn from this study from the Czech Republic are consistent with the results of some other foreign studies. For example, it confirms that the air temperature within the crawl space tends to be lower than the outdoor air temperature during the summer months, while the relative humidity within the crawl space remains high, typically around 80%.
Microbial analysis
Microbiological analysis of the ceiling and wall structure was carried out in May 2023. Four samples were taken on the fiberboard ceiling structure. The location of the swabs is shown in Fig. 1. For this analysis, the west wall of the crawl space was selected, where moisture was frequently observed on the surfaces. The results are presented in Tab. 3. The results were read from the colonies shown in Fig. 7.
Tab. 3 Numbers of colony forming units (CFU/100 cm2) of molds isolated, cultivated on PCA.
Marking of sampling point
cm2
A significant number of yeasts were observed on the foundation wall compared to the ceiling structure. Conversely, the highest number of molds was recorded on the ceiling structure for samples b1 and b2 (small tract of the crawl space). The high number of microorganisms at the foundation wall is attributed to the porosity of the concrete, as observed in sample c1. Fig. 7 shows isolates of microscopic fungi (molds). The isolates were cultured on a Chloramphenicol Glucose Agar medium. Inoculation of Petri dishes was done in two replicates. From the isolates in Fig. 7, it can be seen that the frequency of fungal colonies is not high, and the values in Tab. 3. correspond to this. It must also be said that the molds were present on the foundation wall in the form of spores. No visible mold growth was observed. The colonies found in Fig. 7 and Fig. 8 were cultured under ideal laboratory conditions.


To determine the fungal genera, the isolates from Fig. 7 were cultured separately as seven-day-old cultures. The isolates of microscopic fungi were subjected to identification and assigned to the genus. Penicillium, Aspergillus and Cladosporium were most abundant in the samples on both the ceiling structure and the foundation wall. Furthermore, the genera were identified Ramularia or Stereum. Tab. 4 shows the specific genera of fungi at the sampled locations in the structure.
Tab. 4 Identification of molds at sampling points in the structure.
Marking of sampling point
c1
b1
b2
b3
b4
Identification of molds
Penicillium sp., Cladosporium sp., Aspergillus sp.
Penicillium sp., Cladosporium sp.
Fusarium sp., Stereum sp.
Cladosporium sp., Ramularia sp.
Penicillium sp.
Fig. 8 shows photographs of the isolates from the front of the Petri dish, as well as their microscopic morphology. The occurrence of mold in crawl spaces has been the subject of numerous studies. The Penicillium is the dominant genus within crawl spaces. Furthermore, the genus Cladosporium and Aspergillus were identified. The dominance of the Penicillium genus is attributed to the smaller size of its spores facilitating better dispersion in the air compared to Cladosporium spores, for example (Airaksinen et al., 2004; Bok et al., 2009).
Fig. 7 Isolation of fungal community from the ceiling structure and wall, medium Chloramphenicol Glucose Agar.
Penicillium can grow on different types of material – concrete, wood, wooden panels, drywall or ceramics (Hyvärinen et al., 2002). Especially on dry summer days, airborne spores of Cladosporium appear in the air (Malíř and Ostrý, 2003).
Fig. 8 Identification of selected isolates, microscopic morphology, seven-day-old cultures.
Air age simulation
Air age simulations were performed to determine how long the air can linger in the crawl space. The outside air in the crawl space also introduces debris that can adhere to the surfaces of the structure. The longer the air stays in the crawl space the greater the potential fordebristo betrapped onthe structure. Theair age was simulatedinthemonitored crawl space. Fig. 5 shows the simulation at an air speed (velocity) of 1.0 m/s from the west and from the east, respectively, performed at the level of the ceiling structure. Due to the asymmetric arrangement of the vents, the air flow from the west and east differs. In the smaller tract, the air remained longer, both when coming from the west and when coming from the east. The maximum air age value for the air flow from the west was 477 s (7.95 minutes) and from the east 346 s (5.77 minutes). The average values are summarized in Tab. 5
Tab. 5 Average age of air in the entire crawl space in minutes.
Crawl space
Small tract
Large tract
Age of air in westerly flow in minutes (seconds)
4.4 (265.8)
2.6 (156.5)
Age of air in easterly flow in minutes (seconds)
4.2 (249.6)
2.6 (153.6)
The simulation in Fig. 9 is performed at the level of the ceiling structure. It identified potential risk points in the structure, particularly at the corners. Interestingly, a larger quantity of microorganisms was found in the small tract, where a greater age of air was also observed compared to the large tract, Tab 5.
The red spots in the simulations indicate where the air remained longest within the structure. These were mainly the corners of the structure, and these locations also contained high numbers of microorganisms, as seen in samples b1 and b4. The specific microorganism counts were 1,387 (b1) and 1,014 (b4). High counts of microorganisms were also recorded for sample b2 (1,200). This site was red in the simulations during the westerly flow. A large
a) Penicillium sp.
b) Aspergillus sp. c) Cladosporium sp.
number of microorganisms in sample b2 may be due to the prevailing westerly flow in the real structure, where the second part of the crawl space was less ventilated.
9 Simulation of air age in the crawl space at an air velocity of 1.0 m/s, a) air flow direction from the west, b) air flow direction from the east. (Arrows indicate the vents).
Simulations of the age of the air on the foundation wall are shown in Fig. 10. The average air age values for the foundation wall are shown in Tab. 6. The highest average values were found for the wall when the air flow was from the east in the large tract, namely 285.1 seconds (4.8 minutes). The location of the vents is not symmetrical in the small and large tracts. This may have caused differences in airflow in individual tracts. In the large tract, due to the location of more vents, air was able to enter the space more easily, and thus better ventilation was possible. In the small wing, the vents were located near the inner corner of the structure, causing air to be drawn out of the structure through the nearest vent and making it difficult for air to enter the crawl space.
Tab. 6 Average age of air at foundation wall crawl space in minutes.
Crawl space
Small tract
Age of air in westerly flow in minutes (seconds)
4.3 (254.5)
Age of air in easterly flow in minutes (seconds)
4.2 (249.5) Large tract 2.2 (129.8) 4.8 (285.1)
10
The age of the air reflects the air flow pattern in space (Li et al., 2003). Air age is defined as the time elapsed since the air entered space (Sandberg, 1981; Sandberg and Sjöberg, 1983). There are three methods to measure the age of air: the decay method, the source method, and the pulse method. Tracer gas methods are reliable but timeconsuming. These methods are not suitable for ventilation systems with multiple rooms and multiple ducts. Larger ventilation systems must be solved numerically using the
Fig.
Fig.
Simulation of air flow in the crawl space at an air velocity of 1.0 m/s, cross section at the location of the swab (view of the monitored wall), a) air flow direction from the west, b) air flow direction from the east.
Computational Fluid Dynamics (CFD) method. Air age simulation proved to be a valuable tool for an initial assessment of the crawl space, identifying potential problem areas within the structure.
Airflow, air temperature, and relative humidity were monitored in the study. In addition, amicrobicanalysis ofthestructurewas performed,andthestudy concludedwith simulations of air shedding. The air age simulation model was validated using airflow measurements. Relative humidity and air temperature measurements in the crawl space tract highlighted the possible different temperature and humidity behavior of the crawl space. The results of the mathematical analysis indicated higher relative humidity and lower air temperaturein thesmall tract. Theseconditions mayleadto higherwatervaporcondensation in the small tract, creating favorable conditions for mold growth. Higher numbers of microorganisms (samples b1 and b2) were found in the small tract than in the large tract. The air age simulation revealed higher air stagnation in the small tract compared to the large tract under both westerly and easterly airflow conditions.
Furthermore,thesimulationsindicatedthatthecornersofthestructure,whereaircould stay, could stay longer than in the crawl space. This was supported by the results of the microbial analysis, which showed that the numbers of microorganisms found in the corners were 1,387 (b1) and 1,014 (b4).
It is evident from the analysis that the crawl space partitioning (central foundation wall) can cause different microclimatic environments in the crawl space. Specifically, the various temperature and humidity behaviors of the crawl space tracts under study. This can be mitigated by designing, for example, center foundation piers that connect the entire crawl space. Furthermore, from the air age simulations, it was possible to observe air being exhausted through vents located near the corners. It was difficult for air to enter the crawl space. Therefore, it is not advisable to place the vents close to the corners of the structure. The standard (International Residential Code, 2018) specifies that the ventilation opening mustbelocatedaminimumof915mmfromtheinneredgeofthestructure. Beforedesigning a crawl space, it is undoubtedly advisable to know the location, such as the prevailing wind direction, the location of the fence, or the garden concept (e.g., tall shrubs, a garden house). These can all influence the airflow in the structure. It is undoubtedly advisable for the owner to check the space regularly for mold growth or to ensure the vents are fully uncovered (for example, by not placing pots in front of them).
CONCLUSION
This paper examines the analysis of the crawl space microclimate in a timber building located in the Czech Republic. The relative humidity in the cellars reached up to 85% in the summer and 90% in the winter, humidity that can lead to mold growth. High humidity can lead to structural degradation, particularly of the wooden components in the crawl space. The behavior of the microclimate in the crawl space can be influenced by the central foundation wall, which divides the crawl space into two sections. The measurements also revealed significant differences in relative humidity between the crawl space tracts, with the smallertractexhibitinghigherhumiditylevelsthanthelargertract.Thesmall tractwasfound to have higher air age values, a higher number of microorganisms, and a higher relative humidity. The results suggest that the distribution of the structure may have a significant effect on crawl space behavior.
The air age simulation identified potential risk locations in the crawl space where the air remained the longest. These were mainly the corners of the structure and the space along
the center wall (in the small tract). This method also showed how long the air could stay near the crawl space and highlighted the potential risk of trapping mold spores. An experimental analysis revealed the presence of Penicillium, Aspergillus, and Cladosporium mold spores in the crawl space. There was no visible mold growth on the structures. It is particularly important to control the wooden elements in this environment, which can be degraded by prolonged exposure to high humidity.
The crawl space system is not standard in Central Europe, yet we do encounter this type of building foundation in the Czech Republic, for example. It is essential to observe the behavior of the crawl space microclimate and identify potential risks associated with construction in these conditions so that they can be mitigated during the design phase. This approach has been guided by recommendations from abroad to date.
REFERENCES
Abu-zidan, Y., Mendis, P., Gunawardena, T., 2021. Optimising the computational domain size in CFD simulations of tall buildings. Heliyon, 7(4), e06723-e06723. https://doi.org/10.1016/j.heliyon.2021.e06723
Airaksinen, M., Kurnitski, J., Pasanen, P., Seppänen, O., 2004. Fungal spore transport through a building structure. Indoor air, 14(2), 92-104. https://doi.org/10.1046/j.1600-0668.2003.00215.x
Airaksinen, M., Olsson, L., Kurnitski, J., Hvidberg, S., 2020. Highly insulated crawl spaces with controlled minimal ventilation - Proof of concept by field measurements. E3S Web of Conferences, 172, 7004. https://doi.org/10.1051/e3sconf/202017207004
Airaksinen, M., Kurnitski, J., Seppanen, O., Airaksinen, M., 2003. On the crawl space moisture control in buildings. Proceedings of the Estonian Academy of Sciences: Engineering, 9(1), 3458. http://search.proquest.com/docview/27909883/
Annila, P., Lahdensivu, J., Suonketo, J., Pentti, M., Vinha, J., 2018. Need to repair moisture- and molddamageindifferentstructuresinfinnishpublicbuildings.Journal ofBuildingEngineering, 16, 72. https://doi.org/10.1016/j.jobe.2017.12.010
Balík, M., 2008. Odvlhčování staveb (2., přeprac. vyd),[Dehumidification of buildings (2nd, revised ed.)]. Grada.
Bok, G., Hallenberg, N., Åberg, O., 2009. Mass occurrence of Penicillium corylophilum in crawl spaces, south Sweden. Building and environment, 44(12), 2413-2417. https://doi.org/10.1016/j.buildenv.2009.04.001
Brockwell, P., Davis, R., 2016. Introduction to time series and forecasting (Third edition). Springer. Burke, S., 2007. Crawl spaces in wood framed single family dwellings in Sweden: unwanted yet popular, 10. https://doi.org/10.1108/02630800710740976
ČSN EN ISO 18593. 2019.Mikrobiologie potravinového řetězce - Horizontální metody specifikující techniky vzorkování z povrchů. Úřad pro technickou normalizaci, metrologii a státní zkušebnictví [Microbiology of the food chain - Horizontal methods specifying surface sampling techniques. Office for Technical Standardization, Metrology and State Testing]
Engelhart, S., Loock, A., Skutlarek, D., Sagunski, H., Lommel, A., Färber, H., Exner, M., 2002. Occurrence of Toxigenic Aspergillus versicolor Isolates and Sterigmatocystin in Carpet Dust from DampIndoorEnvironments.AppliedandEnvironmental Microbiology,68(8),3886-3890. https://doi.org/10.1128/AEM.68.8.3886-3890.2002
Erickson, B., Zhai, Z., 2008. Evaluation of ventilation code requirements for building crawl spaces. Building simulation, 1(4), 311-325. https://doi.org/10.1007/s12273-008-8325-3 Fog Nielsen, K., 2003. Mycotoxin production by indoor molds. Fungal Genetics and Biology, 39(2), 103-117. https://doi.org/10.1016/S1087-1845(03)00026-4
Hayashi, T., Ishizu, Y., Kato, S., Murakami, S., 2002. CFD analysis on characteristics of contaminated indoor air ventilation and its application in the evaluation of the effects of contaminant inhalation by a human occupant. Building and environment, 37(3), 219-230. https://doi.org/10.1016/S0360-1323(01)00029-4
Hyvärinen, A., Meklin, T., Vepsäläinen, A., Nevalainen, A., 2002. Fungi and actinobacteria in moisture-damaged building materials-concentrations and diversity. International biodeterioration, biodegradation 49(1), 27-37. https://doi.org/10.1016/S0964-8305(01)00103-2
International Residential Code, 2018. USA, https://codes.iccsafe.org/content/IRC2018P6
Jarvis, B., Miller, J., 2005. Mycotoxins as harmful indoor air contaminants. Applied microbiology and biotechnology, 66(4), 367-372. https://doi.org/10.1007/s00253-004-1753-9
Keskikuru, T., Salo, J., Huttunen, P., Kokotti, H., Hyttinen, M., Halonen, R., Vinha, J., 2018. Radon, fungal spores and MVOCs reduction in crawl space house: A case study and crawl space development by hygrothermal modelling. Building and environment, 138, 1-10. https://doi.org/10.1016/j.buildenv.2018.04.026
Kurnitski, J., 2000. Crawl space air change, heat and moisture behaviour. Energy and buildings, 32(1), 19-39. https://doi.org/10.1016/S0378-7788(99)00021-3
Kurnitski, J., 2001. Ground moisture evaporation in crawl spaces. Building and environment, 36(3), 359-373. https://doi.org/10.1016/S0360-1323(00)00013-5
Kurnitski, J., Matilainen, M., 2000. Moisture conditions of outdoor air-ventilated crawl spaces in apartment buildings in a cold climate. Energy and buildings, 33(1), 15-29. https://doi.org/10.1016/S0378-7788(00)00061-X
Laukkarinen,A.,Vinha,J.,2017.Temperatureandrelativehumiditymeasurementsanddataanalysis of five crawl spaces. Energy Procedia, 132, 711-716. https://doi.org/10.1016/j.egypro.2017.10.011
Li, X., Li, D., Yang, X., Yang, J., 2003. Total air age: an extension of the air age concept. Building and environment, 38(11), 1263-1269. https://doi.org/10.1016/S0360-1323(03)00133-1
Lynn, M., Overstreet, G., Brack, H., Wayne R., T., 2011. Crawl spaces as reservoirs for transmission of mold to the livable part of the home environment. Reviews on environmental health, (263, p.205-213. https://doi.org/10.1515/reveh.2011.028
Malíř, F., Ostrý, V., 2003. Vláknité mikromycety (plísně), mykotoxiny a zdraví člověka (Vyd. 1). Národní centrum ošetřovatelství a nelékařských zdravotnických oborů [Filamentous Micromycetes (Molds), Mycotoxins and Human Health (Ed. 1). National Center for Nursing and Non-Medical Health Professions]
Mareike, K., Ralf, P., Sven, P., Joachim, S., 2014. City and wind: climate as an architectural instrument. Berlin: DOM Publishers.
Matilainen, M., Kurnitski, J., 2003. Moisture conditions in highly insulated outdoor ventilated crawl spaces in cold climates. Energy and buildings, 35(2), 175-187. https://doi.org/10.1016/S03787788(02)00029-4
Pobucká, S., Kalhotka, L., Laichmanová, M., Šuhajda, K., 2024. Monitoring of Microclimatic Conditions and The Occurrence of Micromycetes in Crawl Space. Acta Facultatis Xylologiae Zvolen, (661), 15. https://doi.org/10.17423/afx.2024.66.1.05
Pobucká, S., Kučírek, P., Šuhajda, K., Vorlíčková, P., Žajdlík, T., 2024. Numerical analysis of crawl spaces airflow. Juniorstav: Proceedings 26th International Scientific Conference Of Civil Engineering (pp. 1-8). Vysoké učení technické v Brně, Fakulta stavební. https://doi.org/10.13164/juniorstav.2024.24073
Risberg, M., Westerlund, L., 2020. Experimental investigation of a crawl space located in a subarctic climate. Results in Engineering, 7, 100158. https://doi.org/10.1016/j.rineng.2020.100158
Sandberg, M., 1981. What is ventilation efficiency?. Building and environment, 16(2), 123-135. https://doi.org/10.1016/0360-1323(81)90028-7
Sandberg, M., Sjöberg, M., 1983. The use of moments for assessing air quality in ventilated rooms. Building and environment, 18(4), 181-197. https://doi.org/10.1016/0360-1323(83)90026-4
Sato, Y., Nakajima,, Y., 2018. Study on humidity control method of high humidity environment in the crawl space in floor insulated house. ournal of Environmental Engineering (Transactions of AIJ), (83), pp. 901–11. https://doi.org/10.3130/aije.83.901
Shumway, R., Stoffer, D., 2017. Time series analysis and its applications: with R examples (Fourth edition). Springer International Publishing AG.
Solari, G., 2019. Wind Science and Engineering: Origins, Developments, Fundamentals and Advancements (1st ed. 2019). Springer International Publishing AG. https://doi.org/10.1007/978-3-030-18815-3
Tominaga, Y., Mochida, A., Yoshie, R., Kataoka, H., Nozu, T., Yoshikawa, M., Shirasawa, T., 2008. AIJ guidelines for practical applications of CFD to pedestrian wind environment around buildings. Journal of wind engineering and industrial aerodynamics, 96(10), 1749-1761. https://doi.org/10.1016/j.jweia.2008.02.058
Vanhoutteghem, L., Morelli, M., Sørensen, L., 2017. Can crawl space temperature and moisture conditionsbecalculated with a whole-buildinghygrothermal simulationtool?.Energy Procedia, 132, 688-693. https://doi.org/10.1016/j.egypro.2017.10.007
Viitanen, H., Vinha, J., Salminen, K., Ojanen, T., Peuhkuri, R., Paajanen, L., Lähdesmäki, K., 2010. Moisture and Bio-deterioration Risk of Building Materials and Structures. Journal of building physics, 33(3), 201-224. https://doi.org/10.1177/1744259109343511
Yuan, L., Takada, S., Fukui, K., 2024. Study on mold and condensation risks after vacancy of residential space with walls in contact with the ground. Journal of Building Engineering, 89, 109300. https://doi.org/10.1016/j.jobe.2024.109300
Zhang, X., Weerasuriya, A., Tse, K., 2020. CFD simulation of natural ventilation of a generic building in various incident wind directions: Comparison of turbulence modelling, evaluation methods, and ventilation mechanisms. Energy and buildings, 229, 110516. https://doi.org/10.1016/j.enbuild.2020.110516
ACKNOWLEDGMENT
Acknowledgments should be simply phrased and should include only brief references to research project or funds. The research was supported by the Brno University of Technology, Faculty of Civil Engineering –Specific Research No., FAST-S-24-8620 and FAST-S-25-8727. Special thanks to Mendel University in Brno and Masaryk University in Brno for their cooperation.
AUTHORS’ ADDRESSES
Ing. Slávka Pobucká
Ing. Pavel Kučírek doc. Ing. Karel Šuhajda, Ph.D. Ing. Jan Holešovský, Ph.D. Faculty of Civil Engineering, Brno University of Technology Veveří 331/95
602 00 Brno, Czech Republic Slavka.Pobucka1@vutbr.cz Pavel.Kucirek@vut.cz karel.suhajda@vut.cz jan.holesovsky@vut.cz
ACTA FACULTATIS XYLOLOGIAE ZVOLEN, 67(1): 125 136, 2025
Zvolen, Technická univerzita vo Zvolene
DOI: 10.17423/afx.2025.67.1.11
TYPOLOGICAL – ERGONOMIC EXPERIMENT
Patrícia Pančíková – Zuzana Tončíková
ABSTRACT
This applied research, "A Typology and Ergonomic Experiment", is focused on the development of ergonomic seating solutions tailored for young people working and studying from home. With the rise of remote work and education, informal environments often fail to provide adequate support for healthy posture. Users commonly adopt non-ergonomic positions, such as sitting on sofas, beds, or floors, which can lead to significant health issues. The research is centred on analyzing and optimizing design forms that integrate both aesthetic and functional criteria. Problems associated with non-ergonomic positions are identified in thestudy,andsolutionsareproposedto supporthealthypostureduringextended periods of sitting in home environments. These findings have the potential to enhance user comfort, reduce healthrisks, andguidethe future development ofseatingdesign forinformal settings.
Keywords: design; ergonomics; experiment; innovation.
INTRODUCTION
The design of seating furniture has traditionally been shaped by established ergonomic principles andconventional typologies,particularly in officespaces, educational institutions, and domesticenvironments. Despiteadvances in materials andtechnology, standardseatingmost notably office chairs-often fails to accommodate the needs of contemporary users. Extended periods of sitting in such rigid and outdated furniture can lead to physical discomfort, back pain, andlong-term musculoskeletalissues. With theincreasing prevalence of hybrid and remote work models, users are more frequently working and studying in informalenvironmentsthatlackadequateergonomicinfrastructure.Thisdisconnectbetween evolving user behavior and static design standards highlights the urgent need for innovative seating solutions combining aesthetic appeal and functional support.
Recent studies and observational research have shown that young people, particularly those aged 20 to 35, are especially affected by non-ergonomic conditions in home-based environments. These users tend to adopt postures such as sitting on beds, sofas, or floor surfaces not designed for prolonged desk-based tasks. These informal behaviors, while reflective of lifestyle flexibility, often result in unhealthy spinal loading, forward head posture, and muscular imbalance. Although ergonomic guidelines are widely available, they
are primarily tailored to traditional office contexts and do not adequately address the spatial and behavioral complexity of modern domestic interiors. Current ergonomic research provides extensive solutions for structured workspaces; however, a critical gap remains in addressing the needs of informal, mobile, and multipurpose work settings. This study responds to that gap.
This paper aims to explore the intersection between visual identity, functional utility, and user health through a typological–ergonomic experiment focused on seating design. The experiment hypothesizes that analyzing non-ergonomic behaviours and postures adopted by users in informal settings will reveal opportunities to improve comfort, reduce health risks, and support long-term well-being. The primary objective is to develop seating that meets the physiological needs of users while contributing aesthetically to the visual language of contemporary living spaces. Unlike traditional design approaches that prioritize either form or function, this research seeks to establish a holistic model in which the two are inseparably integrated.
The proposed design process begins with the observation and evaluation of common postural patterns in informal working environments, followed by the development of a series of material and morphological experiments. These experiments are intended to test not only the physical characteristics of novel materials – such as air-filled components and advanced foams – but also their psychological and sensory impact on the user. Emphasis is placed on user-centred evaluation criteria, including postural support, visual feedback, and comfort perception over time. Each prototype is approached as both a functional product and a visual composition,reflectingadesignphilosophythatplaces equalvalueonaesthetics,interaction, and human well-being.
Historically, the field of ergonomics has evolved from practical wartime applications toasophisticatedinterdisciplinaryscienceencompassingbiomechanics,psychology,design, and engineering. The formal establishment of ergonomics as a discipline occurred in the 1940s when growing system complexity demanded more human-centered design thinking (Chapanis, 1951). In 1949, the Ergonomics Research Society was founded in the United Kingdom, formalizing thefield’sscientificlegitimacy(Singleton,1982).Today,ergonomics is no longer viewed merely as a tool for increasing productivity; it is recognized as a framework for enhancing comfort, reducing physical strain, and improving the overall quality of life across all aspects of daily function.
The Importance of Ergonomic Comfort
Ergonomics, as a scientific discipline, aims to create environments that support the physiological and psychological needs of users. In non-traditional workspaces, this goal becomes more complex due to the variability of furniture and spatial conditions. Ergonomic comfort encompasses a wide range of elements, including maintaining a correct body posture, adjusting screen and desk heights to proper levels, providing arm support, and optimizing lighting conditions. The absence of these elements can lead to musculoskeletal disorders, including lower back pain, neck tension, wrist fatigue, and general discomfort caused by prolonged incorrect sitting positions (Bridger, 2008).
A particularly relevant issue is the widespread use of non-ergonomic furniture in domestic environments, such as sofas, beds, or kitchen chairs, which are not designed for long-term desk work. These environments often lead to harmful postures such as slouching, forward head posture, lack of lumbar support, or bent wrists, which substantially increase the risk of chronic pain and spinal issues.
Although implementing ergonomic standards in such spaces may seem challenging, small interventions can significantly improve the situation. Using laptop stands, external
keyboards, adjustable chairs, or even makeshift lumbar supports (such as rolled-up towels) can help improve posture and reduce strain. Alternating between sitting and standing positions, as well as incorporating short movement breaks, can also prevent overuse injuries and fatigue. In today’s flexible working culture, non-traditional work environments, such as homeoffices, cafés, orsharedco-working spaces, havebecomeincreasinglycommon. These environments often lack proper ergonomic infrastructure, which may lead to poor posture, discomfort, and long-term musculoskeletal disorders. Young individuals, in particular, frequently engage in prolonged work or study in non-ergonomic settings using sofas, beds, or floor seating. This study addresses these shortcomings through an applied design research approach.
The design creation is primarily oriented towards young students and creative professionals who operate in informal environments, such as living rooms or hybrid homeoffice spaces. Typically, aged 20 to 35, this group combines productivity with a desire for comfort, seeking adaptable furniture that aligns with a flexible lifestyle. The proposed solution addresses their ergonomic needs while maintaining visual and functional compatibility with domestic interiors. Framed by the evolution of ergonomics as a scientific discipline, this research highlights the mismatch between informal user behavior and conventional seating design.Throughatypological–ergonomicexperiment, userpatternsare analyzed to develop design alternatives that promote postural health and integrate aesthetically into everyday living spaces.
Ergonomic Design Principles
The implementation of ergonomic principles within product design – commonly referred to as ergonomic design – plays a critical role in shaping how individuals interact with objects in their daily lives. This approach extends beyond functionality, encompassing physical, cognitive, and emotional dimensions of user experience (Dul et al., 2012). Despite its relevance, ergonomic design is often undervalued during the early stages of development due to cost constraints or limited awareness, particularly in commercial practice (Helander, 2005).
Thisstudypositionsergonomicdesignnotonlyas asetofguidelinesbut asanevolving methodology that bridges analytical research with creative intuition. It advocates for the integration of ergonomic insights into the entire design process – from user research and material selection to prototyping and performance testing. In doing so, it supports the development of design solutions that are adaptive, emotionally resonant, and embedded with user-centered intelligence.
By leveraging experimental methods, visual analysis, and interdisciplinary thinking, the present research contributes to a more nuanced understanding of what ergonomics can offer in the context of contemporary domestic life. Rather than treating comfort and aesthetics as opposingpriorities,this study embraces theirinterdependence as thefoundation for a new generation of seating design.
Experimental part:
Typological-Ergonomic Research
The primary objective of this research is to design and optimize innovative seating solutions through a typological-ergonomic experiment, addressing the ergonomic shortcomings commonly observed in informal home-based work environments. These shortcomings are particularly prevalent among the younger population, whose work habits often involve using sofas, beds, and other non-ergonomic surfaces.
The study begins by analyzing the typical positions adopted by young users during remote work or study, with a particular focus on physiologically atypical or static postures that can contributeto discomfort andhealthcomplications over time.Based onobservational data and ergonomic evaluation, model scenarios were constructed to simulate the most frequent non-ergonomic working positions. The goal is to critically assess these scenarios and extract key problem areas related to spinal loading, muscular imbalance, and posture deviation. Following this, the experiment aims to develop seating prototypes that strike a balance between aesthetic quality and functional ergonomics, with a focus on flexible use in home environments. These prototypes incorporate customizable elements such as adjustable lumbar supports and dynamic seat contours to encourage natural movement and varied sitting positions throughout the day.
Non-Ergonomic Posture and Its Consequences
Extended periods of static sitting are widely recognized as a significant risk factor for musculoskeletal disorders (MSDs), particularly when accompanied by poor posture. Although the biomechanical mechanisms are still debated, evidence suggests that low back pain (LBP), cervical stiffness, and shoulder tension are closely linked to improper sitting behaviors and prolonged static postures (Waersted et al., 2010; Lis et al., 2007).
In our previous pilot study, which involved 200 home-working students and professionals, 67% of respondents who were aware of proper posture still reported experiencing pain in the head, neck, back, or hips. This suggests a gap between theoretical knowledge and practical application.
According to the European Agency for Safety and Health at Work (EU-OSHA, 2022), the most reported contributors to MSDs include:
• Lack of sleep (85%)
• Passive load due to inactivity (70%)
• Bad posture (60%)
• Work overload (30%)
Another large-scale survey conducted in an urban academic population (N = 1,000) found that 68.7% of participants believed ergonomics is undervalued in their work settings.
Design Implications and Innovative Approaches
Recent ergonomic studies indicate that traditional static sitting positions are insufficient for modern work demands. Dynamic seating that adapts to user movement, such as supportive backrests that respond to body shifts, is now considered a best practice
Fig. 1 Percentage of respondents reporting discomfort in different body parts during work in unconventional environments.
(Steelcase, 2020; Ergonomics Society of Korea, 2021). These solutions support greater postural variation, increase blood flow, and help prevent fatigue.
While referencing contemporary ergonomic standards from South Korea, it is acknowledged that anatomical and anthropometric differences exist between Asian and European populations due to varying somatotypes influenced by genetics, diet, and lifestyle. For example, comparative anthropometric studies indicate notable differences in sitting height, limb length ratios, and pelvic inclination across regional populations, which may affect seating ergonomics and posture tendencies. Asian populations typically exhibit lower averagestature,shorterfemurlength,andreduced hipbreadthcomparedto Europeancohorts (Pheasant and Haslegrave, 2005).
Despite these differences, the selected Asian sources were primarily used in this study for their relevance to the perceptual and behavioral aspects of ergonomics, particularly dynamic posture adaptation and design-user interaction in flexible work environments. The cited research focused less on static dimensional data and more on adaptive ergonomic strategies, which are applicable across regions when interpreted in context.
To account for variability, this study emphasized qualitative evaluation methods and user-centered testing using a European sample group. This approach ensured that design conclusions were contextually relevant, even when referencing international ergonomic literature. Future research could benefit from region-specific anthropometric databases to enhance local accuracy.
Design Development as an Experimental Methodology
The design development process in this study focuses on exploring new formal solutions through an experimental approach that both complements and transcends the boundaries of traditional design methods. The primary design stream of conventional work seating serves as the starting point and structural backbone of the creative process. In contrast, theexperimental methodchallenges these conventions byexaggeratingtheirformal logic, opposing standard typologies, and introducing novel associations, references, and symbolic connections.
The primary medium of this experimental exploration is authorial drawing concept sketches, which serve not only as tools for visualization but also as a method for conceptual thinking and discovering unanticipated forms. The iterative creation of material concepts and virtual visualizations enabled a dynamic reassessment of the relationship between form, function, and user experience. These sketches and renderings represent various interpretations of seating design, with their expressive and formal diversity underlining the experimental nature of the project.
A core feature of the design experiment was the integration of inflatable (air-based) components, which offered novel ergonomic properties and high morphological adaptability. These inflatable elements enable dynamic interaction between the user and the object, forming the basis for innovative seating typologies. Throughout the design process, both inflatable and foam-based materials were examined for their formal potential, drawing inspiration from organic structures and biomorphic shapes. Their aesthetic and structural qualities reflect an ability to morph and respond to the user's immediate needs, resulting in a dynamic yet intuitive ergonomic system. One of the key outcomes of this design research is the concept of formal variability. The resulting furniture prototypes demonstrate an inherent ability to transform over time through continued use. This adaptive response signifies a fundamental shift in ergonomic thinking from rigid, static structures to living, evolving systems. Notably, the presence of physical folds and surface deformations functions not onlyas avisual aestheticbut also as afunctional indicator.Thesechanges serve
to highlight areas of most significant stress on the user's body and can intuitively prompt the user to take breaks or adjust their posture. This feature introduces a dialogue between the object and its user, reinforcing the importance of motion and variability in ergonomic comfort.
Form Exploration and Ergonomic-Aesthetic Integration
From the beginning of the design process, emphasis was placed on integrating functional and aesthetic aspects. The main challenge was to develop a solution that would support ergonomically sound seating while maintaining visual appeal.
Form Experimentation
In the initial phases, the design focused on exploring various seating forms. The goal was to identify shapes that naturally promote proper posture while allowing for dynamic position changes during extended sitting periods. This phase involved modeling different proportions and curvatures that reflect the natural lines of the human body.
Through this process, several forms were identified that enhance user comfort and reducepressureoncriticalareassuchasthespineandlowerback.Theseshapestudiesplayed a key role in establishing the design framework, offering both postural support and an aesthetic that aligns with contemporary living environments.
MATERIALS AND METHODS
Material Exploration and Methodological Approach
In the exploratory phase of the experimental design process, the creative direction focused on the formal and sensory potential of unconventional materials, particularly inflatable (aero) and foam-based media. These materials were selected for their ability to reference both highly biological forms and abstract, non-organic mass structures. Inflatable elements, in particular, areexperiencing a contemporary revival withinfurnitureand product design. Once popularized at the turn of the 21st century, their lightweight construction, color
Fig. 2 Conceptual Shape Exploration Inspired by Human Spine Morphology. The sketch illustrates the evolution of form studies based on the anatomical structure of the human spine and vertebrae. These experiments focus on achieving ergonomic seating support through biomorphic shapes that respond to the body's natural posture dynamics
variety, and visual deviation from traditional upholstery have appealed to younger generations seeking flexibility and visual novelty in their domestic interiors (Tosi, 2020).
This renewed interest in inflatables aligns with a broader return to organic aesthetics and the integration of bio-based or biodegradable plastics. The environmental impact of conventional plastics has prompted continuous research into how these materials can be modified to emulate organic properties while reducing their ecological footprint (Salvend, 2012). This has led to a shift in perception, where morphology and materiality that reference the human form, such as biomorphic shapes, asymmetry, and softness, become emotionally resonant and trustworthy for the user. By incorporating human-like characteristics such as irregularity, surface flexibility, and formal imperfection, these materials acquire a layer of authenticity. Their tactile quality and perceived "softness" support more natural interactions and enhance the design’s overall ergonomic potential. This shift allows designers to create seating that is not only functional and sustainable but also emotionally engaging and sensorially responsive (Blythe and Wright, 2003). From a material innovation standpoint, inflatable fabrics commonly used in logistics or healthcare (e.g., anti-decubitus mattresses) demonstrate considerable ergonomic benefits. These materials enable adaptive surface behavior, distributing pressure dynamically and responding to varying body weights and positions. Their integration into the seating design opens possibilities for new interactive ergonomic systems, where the material's response may guide users to shift positions or take breaks during prolonged sitting.
Additionally, the research examined memory foams and elastomeric compounds used in the footwear industry, known for their resistance to degradation and superior structural memory. Comparedto traditionalfoams usedin upholstered furniture,which often degrade under prolonged load, footwear-grade polymers offer greater resilience and deformation resistance. The experimental application of these non-standard materials in seating design remains underexplored but holds promise for enhancing durability and comfort in high-traffic environments. The simplicity of inflatable production technologies widely available in packaging and logistics makes them viable for adaptation into modular oradjustableseating.Byexposingstructural components insteadofconcealing themthrough conventionalupholstery, thedesignhighlightsthematerial'sbehavioranditsinteractionwith the user.
These material studies form a foundational component of the design experiment, highlighting new pathways for developing ergonomic seating solutions that are both functionally and aesthetically innovative.
To assess the ergonomic performance of the selected materials, a qualitative rating method was applied. Three user-centered criteria–pressure response, visual feedback, and posture support–were rated on a scale from 1 to 10, with higher values indicating greater ergonomic functionality. The evaluations were conducted by a panel of six design researchers and postgraduate students specializing in ergonomics and furniture design. Each sample was tested under controlled conditions simulating prolonged sitting, and average scores were calculated to inform the comparative analysis presented in the results.
Tab. 1 Comparison of Tested Materials by Ergonomic Criteria. These findings suggest that interactive materials with feedback capabilities can play an active role in shaping healthy postural habits, while air and soft foams remain strong candidates for immediate comfort and support. Future development could explore hybrid material compositions that combine high comfort with smart responsiveness.

Fig. 3 Performance of tested materials in ergonomic criteria. The graph illustrates the average evaluation of three types of materials – Air Cushions, Soft Foams, and Interactive Foams – based on four ergonomic parameters: Pressure Response, Visual Feedback, Comfort, and Posture Support. Ratings were given on a scale from 1 to 10, where higher values indicate better performance in a given criterion. The results reveal significant differences among the materials, with Interactive Foams achieving the highest score in Visual Feedback and demonstrating overall balanced performance across all evaluated criteria.
RESULTS AND DISCUSSION
A practical experiment was conducted to observe the behavior of the proposed seating element's materials, forms, and functional characteristics. The focus was on analyzing how the object interacts with both the user and the surrounding environment, including the appropriateness of the proposed dimensions in accommodating diverse user needs. The aim of the experiment was to develop several design variants in terms of shape, material composition, and surface transparency while emphasizing the optimization of ergonomic performance and enhancing the object’s visual identity.
Special attention was given to incorporating recognizable anthropomorphic features into the design to create a solution that is both visually appealing and functionally effective. The inclusion of human-inspired morphological elements aimed to enhance user affinity and physical comfort by aligning with the natural contours of the body.
The final design prototypes were tested in various interior settings to evaluate their practical usability, aesthetic value, and capacity to support healthy ergonomic behavior and overall user comfort. These real-world applications enabled a comprehensive evaluation of each prototype’s adaptability, especially in informal workspaces such as home offices or multipurpose living areas. The results suggest that form variants which integrate subtle anatomical references are better received in terms of intuitive use, while transparent or semitransparent materials contribute to the perceived lightness and spatial harmony of the design. These findings highlight the importance of user-centered design approaches in developing furniture solutions that are not only ergonomically valid but also capable of blending seamlessly into the visual and functional dynamics of contemporary domestic environments.
Organic Form as a Sculptural Interpretation of Comfort and Movement
The design of the seating object was guided by the intrinsic qualities of the human form, its proportions, curves, and the sculptural logic of anatomy, which served as the primary inspiration. The resulting structure reflects organic lines, soft transitions, and an
abstracted representation of bodily flow, capturing a sense of harmony and energy inherent in human physiology.
This object is not merely a passive imitation of anatomy but an active reinterpretation of its structure and function. It responds to its formal origins by transforming them into new dimensions of functionality, aesthetics, and interaction. The seating element is conceived as a medium that embodies balance between the calm visual presence it introduces into a space and the ergonomic support it offers to the user.
The result is a tangible expression of comfort that extends beyond materiality. The object subtly transforms the environment in which it is placed, creating a spatial experience wherefunctionality merges with beauty, andthephysical connectionbetweenbodyand form leads to a more profound sense of harmony.
Far beyond a conventional seating unit, the design becomes a sculpture in motion, a dynamic companion that bridges the user with space and time. Its abstract character invites exploration, its fluidity encourages awareness, and its organic essence restores a subtle sense of equilibrium in everyday life.
CONCLUSION
Contemporaryshifts in lifestyle,workhabits, andeven humanbody proportions driven by sedentary behavior and technological innovation highlight the growing disconnect between current user needs and traditional design and ergonomic standards. Despite these transformations, design practice often continues to rely on outdated methods that no longer fully reflect the demands of modern users. Furthermore, limited access to advanced tools and technologies hinders the development of more precise, adaptable design solutions.
These current design challenges underscore the need to continually seek a balance between aesthetics, functionality, and user well-being. Emphasizing ergonomics is becoming a crucial factor in creating products and spaces that respond to the dynamic nature ofcontemporarylifestyles.Analyzingtheinteractionbetweenhumansandtheirenvironment has revealed the importance of integrating physiological, psychological, and practical considerations in the design process. The aim is to create solutions that are not only visually attractive but also health-promoting.
Fig. 4 Pelvyn chair – form variants. A selection of design prototypes exploring ergonomic, sculptural, and anthropomorphic qualities. Each variant represents a different approach to supporting dynamic posture and user comfort while reflecting the anatomical inspiration of the human pelvis.
Thefindingsconfirmthatachievingharmonybetweenfunctionalvalue,visualappeal, and health-related aspects is essential for effective and sustainable design. Such solutions have the potential to significantly enhance user comfort and quality of life while shaping newstandardsforthe applicationofergonomicprinciples. This approach also opens avenues for the development of innovative and sustainable solutions applicable to various areas of everyday life.
Moreover, the integration of advanced technologies and modern methodologies is increasingly necessary to gain a deeper understanding of current ergonomic challenges. These tools and insights can significantly enhance the accuracy and effectiveness of design implementations, stimulating the development of experimental, innovative, and practical solutions. In doing so, a new chapter in design is an unfolding one that merges aesthetics with functionality and responds to the dynamically evolving needs of today’s society.
REFERENCES
Blythe, M., Wright, P., 2003. Introduction: From usability to enjoyment. In M. A. Blythe, K. Overbeeke, A. F. Monk, & P. C. Wright (Eds.), Funology: From usability to enjoyment (pp. xiii–xviii). Dordrecht: Kluwer Academic. https://doi.org/10.1007/1-4020-2967-5_21
Bridger, R. S., 2008. Introduction to ergonomics (3rd ed.). Boca Raton, FL: CRC Press. Available online: https://www.researchgate.net/publication/265730326_Introduction_to_Ergonomics _3rd_Edition_by_R_S_Bridger
Chapanis, A., 1951. Human factors in systems engineering. New York: Wiley. ISBN: 978-0- 47113782-5
Do Rosário, J. L. P., 2014. Photographic analysis of human posture: A literature review. Journal of Bodywork and Movement Therapies, 18(1), 56–61. https://doi.org/10.1016/j.jbmt.2013.05.008
Dul, J., Bruder, R., Buckle, P., Carayon, P., Falzon, P., Marras, W. S., Van Hoonhout, G., Van Der Doelen, B., 2012. A strategy for human factors/ergonomics: Developing the discipline and profession. Ergonomics, 55(4), 377–395. https://doi.org/10.1080/00140139.2012.661087
Ergonomics Society of Korea., 2021. Ergonomics in the new work environment. Seoul: ESK Publications. https://koreascience.kr/journal/OGGHBK/v29n3.do
European Agency for Safety and Health at Work., 2022. Musculoskeletal disorders and the workplace. EU-OSHA. https://osha.europa.eu
Gavriel, S. (Ed.)., 2012. Handbook of human factors and ergonomics (4th ed.). Hoboken, NJ: Wiley. ISBN 978-1-118-13135-0
Helander, M., 2005. A guide to human factors and ergonomics (2nd ed.). Boca Raton, FL: CRC Press. https://doi.org/10.1201/b12385
Hignett, S., Wilson, J. R., Morris, W., 2005. Finding ergonomic solutions participatory approaches. Occupational Medicine, 207 p. https://doi.org/10.1093/occmed/kqi084
Jacquier-Bret, J., Gorce, P., 2023. Effect of day time on smartphone use posture and related musculoskeletal disorders risk: A survey among university students. BMC Musculoskeletal Disorders, 24, 725. https://doi.org/10.1186/s12891-023-06837-5
Jeong, H., Park, W., 2021. Developing and evaluating a mixed sensor smart chair system for realtime posture classification: Combining pressure and distance sensors. IEEE Journal of Biomedical and Health Informatics, 25(5), 1805–1813. https://doi.org/10.1109/JBHI.2020.3030096
Kandasamy, G., Bettany-Saltikov, J., Van Schaik, P., 2021. Posture and back shape measurement tools: A narrative literature review. In Spinal deformities in adolescents, adults and older adults. IntechOpen. https://doi.org/10.5772/intechopen.91803
Karwowski, W. (Ed.)., 2003. International encyclopedia of ergonomics and human factors. London & Philadelphia: CRC Press. ISBN 0-415-25161-3.
Kett, A. R., Sichting, F., Milani, T. L., 2021. The effect of sitting posture and postural activity on low back muscle stiffness. Biomechanics, 1(2), 214–224. https://doi.org/ 10.3390/biomechanics1020018
Kodak’s., 2003. Ergonomic design for people at work. Rochester, NY: Eastman Kodak Company. ISBN: 9780470528389.
Kroemer, K. H. E., 2006. Extra-ordinary ergonomics: How to accommodate small and big persons, the disabled and elderly, expectant mothers, and children. Applied Ergonomics, 37(4), s. 409–418. ISBN 9780367392321.
Kurze, A., Berger, A., 2022. Playing The Ethics Card: Ethical Aspects In Design Tools For Inspiration And Education. arXiv preprint arXiv:2201.10491. https://arxiv.org/abs/2201.10491
Lee, D.-E., Seo, S.-M., Woo, H.-S., 2018. Analysis of body imbalance in various writing sitting postures using sitting pressure measurement. Journal of Physical Therapy Science, 30(3), 343–346. https://doi.org/10.1589/jpts.30.343
Lis, A. M., Black, K. M., Korn, H., Nordin, M., 2007. Association between sitting and occupational low back pain. European Spine Journal, 16(2), 283–298. https://doi.org/10.1007/s00586-006-0143-7
Markova, V., Markov, M., Petrova, Z., Filkova, S., 2024. Assessing the Impact of Prolonged Sitting and Poor Posture on Lower Back Pain: A Photogrammetric and Machine Learning Approach. Computers, 13(9), 231. https://doi.org/10.3390/computers13090231
Montuori, P., Cennamo, L. M., Sorrentino, M., Pennino, F., Ferrante, B., Nardo, A., Giovanni, M., Sebastiano, G., Marco S., Ugo, T., Maria, T., Antonio, N., 2023. Assessment on practicing correct body posture and determinant analyses in a large population of a metropolitan area. Behavioral Sciences, 13, 144. https://doi.org/10.3390/bs13020144
Norman, D. A., 2013. The design of everyday things. Cambridge, MA: MIT Press. ISBN: 9780262525671
Peteri, V., 2017. Bad Enough Ergonomics: A Case Study of an Office Chair. SAGE Open, 7(1). https://doi.org/10.1177/2158244016685135
Pheasant, S., Haslegrave, C. M., 2005. Bodyspace: Anthropometry, Ergonomics and the Design of Work. Boca Raton. CRC Press. ISBN 978-0-415-28520-9
Salvendy, G. (ED.)., 2012. Handbook of human factors and ergonomics (4th ed.). Hoboken, NJ: Wiley. https://doi.org/10.1002/9781118131350.ch44
Santa Clara University., 2025. (n.d.). What is ethics? Markkula Center for Applied Ethics. Available https://www.scu.edu/ethics/ethics-resources/ethical-decision-making/what-is-ethics/
Singleton, W. T., 1982. The body at work: Biological Ergonomics. Cambridge: Cambridge University Press. ISBN 978-0521240871
Soares, C., Shimano, S. G. N., Marcacine, P. R., Fernandes, L. F. R. M., De Castro, L. L. P. T., De Walsh, I. A. P., 2023. Ergonomic interventions for work in a sitting position: An integrative review. Revista Brasileira de Medicina do Trabalho, 21, e2023770. https://pmc.ncbi.nlm.nih.gov/articles/PMC10185389/
Steelcase., 2020. Global posture study: Supporting the changing ways we sit. Grand Rapids, MI: Steelcase Research. https://www.steelcase.com/content/uploads/2019/05/global-posturestudy.pdf
Tosi, F., 2020. Design for ergonomics. Springer International Publishing. ISBN: 978-3-030-335625.
Vachinska, S., Markova, V., Ganchev, T., 2022. A risk assessment study on musculoskeletal disorders in computer users based on a modified Nordic musculoskeletal questionnaire. In The International Symposium on Bioinformatics and Biomedicine (Vol. 374). Springer. https://doi.org/10.1007/978-3-030-96638-6_45
Waersted,M., Hanvold, T.N., Veiersted, K. B., 2010.Computer workand musculoskeletal disorders of the neck and upper extremity: A systematic review. BMC Musculoskeletal Disorders, 11, 79. https://doi.org/10.1186/1471-2474-11-79
ACKNOWLEDGMENT
This work was supported by the Slovak Research and Development Agency under the Contract no. APVV-21-0015.
AUTHORS’ ADDRESSES
Mgr. art. Patrícia Pančíková Assoc. prof. Zuzana Tončíková, ArtD. Technical University in Zvolen Faculty of Wood Sciences and Technology Department of Furniture and Interior Design T. G. Masaryka 24, 960 01 Zvolen, Slovakia patka.pancikova@gmail.com zuzana.toncikova@tuzvo.sk
ACTA FACULTATIS XYLOLOGIAE ZVOLEN, 67(1): 137 151, 2025
Zvolen, Technická univerzita vo Zvolene
DOI: 10.17423/afx.2025.67.1.12
MANAGING THE CORONAVIRUS CRISIS BY SLOVAK WOODWORKING AND FURNITURE ENTERPRISES IN THE CONTEXT OF AGILE APPROACH – CASE STUDIES
Andrea Janáková Sujová – Ľubica Simanová
ABSTRACT
The period of coronavirus pandemic has shown that the ability to implement changes and react in a timely and effective manner, which means being agile, is becoming a prerequisite for both survival and success. The aim of this paper is to highlight examples of good and bad practices among Slovak wood processing and furniture-manufacturing enterprises in overcoming the pandemic crisis through case studies, utilising semi-structured interviews within enterprises and an analysis of changes in financial indicators. The results show that enterprises taking advantage of the increased demand for wood products, as well as those that digitised and optimised their processes, achieved significantly higher sales and profits. Conversely, enterprises that merely tried to maintain revenues without optimisation and innovation worsened their financial situation. The contribution of the paper is an extension of empirical knowledge, examining the impacts of pandemics on the business operations of wood processing enterprises in the context of business agility.
Keywords: wood processing enterprises; coronavirus crisis; enterprise agility; case studies.
INTRODUCTION
The wood processing industry (WPI), encompassing the timber, pulp and paper, and furniture sectors in Slovakia, is a vibrant business that employs thousands of people. During the COVID-19 pandemic, enterprises in the WPI in Slovakia faced numerous problems, constraints, andchallenges. TheSlovakWPIexperienced ahistoricdecline in activityduring thefirst yearofthe coronaviruscrisis. Thehigh dropwas mainly dueto quarantinemeasures, as consumers were unable to access furniture-type products in a closed economy for at least a month during the pandemic crisis. The fact that industrial production in Slovakia experienced a greater decline in activity than in other countries can be attributed mainly to the specific characteristics of the Slovak economy (Plutzer, 2021). The pandemic caused significant disruption in supply chains, leading to shortages of raw materials and increased prices of materials. Many companies experienced a decrease in demand for their products, which had a negative impact on their sales and financial stability. Additionally, some enterprises had to reduce staff or temporarily halt production due to restrictions and quarantine measures. Despite these challenges, some companies have managed to adapt to the new conditions by increasing production efficiency or diversifying their portfolio (Bečka, 2020).
Companies with foreign capital in both the wood processing and furniture manufacturing industries have the largest share in the recovery of production in Slovakia. They benefit from a sufficient raw material base and the advantage of a high-quality and, above all, inexpensive labour force. A better financial background and higher-quality knowhow favour their position and competitiveness in the Slovak market. Overall, the WPI recorded higher net profits in the three years before the pandemic than in the past. In 2017, it was €14 million; in 2018, it was €5 million more; and in 2019, they ended up in the black by €23 million. This is also reflected in the total turnover for the segment, which rose by €18 million year-on-year to €692 million. Zemaník (2020) states that the profit could have been even higher if the markets had not reacted to the surplus of timber in the European Union and worldwide with a sharp decline in prices for sawn timber and finished products.
According to data from the Statistical Office of the Slovak Republic (www.datacube.statistics.sk), during the coronavirus crisis, the sectors of the Slovak WPI gradually declined in the number of enterprises and the number of employees, with a rate of decline of up to 10%, and even in 2023 they did not reach the pre-pandemic status. On the other hand, however, average monthly wages grew. A declining trend was observed in output, which decreased by 14.21% to 22.5%. Additionally, there was a decline in sales of own products and services, ranging from 12.16% to 22.50%. The development of valueadded showed an upward trend, with a decrease in 2023 compared to 2022, resulting in a 17.00% decrease across the WPI. In the woodworking and paper product industries, the development of economic results had a downward trend of 17.06 on average. A significant reduction in the economicresult was observed in enterprises of the furniture industry in 2020 and 2021; in 2023, it decreased by up to 1605.56% compared to 2022.
Many authors have examined the impacts of the COVID-19 pandemic on various aspects of economic life in their studies. Belanová (2022), Cepel et al. (2020), Tomková et al. (2024), and Mura et al. (2022) evaluated measures to help SMEs in the Slovak Republic by comparing them with selected EU countries, the added value of the Slovak Republic, the sustainability of jobs and business risks in the SME segment. Studies by the Sovak Business Agency (SBA, 2021) and Belas et al. (2021) addressed reduced consumption, an economic slump, and a decline in Slovak GDP. The issue of business closures, the negative impact of the pandemic on the labour market, increased unemployment not only in Slovakia but also in the EU countries were discussed in the studies by Bauer and Weber (2020), Hlawiczka and Kollar (2021), Lambovska et al. (2021) and Kramárová et al. (2022). The areas of ICT technologies, online services and their growth in the wake of the pandemic, e-commerce, onlinebanking, teleworkingas a form oftelecommuting, andtheuseofmoderntechnologies providing flexibility for employees during the pandemic were the content of studies by Sánchez-Torres (2019), Como et al. (2021), and Svábová et al. (2021). The growth of ecommerce and changes in consumer behaviour due to the coronavirus crisis was the focus of studies by Sonawane (2020) and Štalmachová and Strenitzerová (2021).
The effects of the pandemic and their impact on wood product production were the content of the studies by Kuzman et al. (2022) and Putra Kristianto et al. (2021). Pirc Barčić et al. (2021) and Chen Yang (2021) attempted to understand the impact of the COVID-19 pandemicon consumerpreferences for wooden furniturein theirstudies. Jelačić et al.(2021) highlighted the changes in managers' mindsets resulting from the impact of COVID-19 on SMEs in the wood processing industry.
Thecoronavirus crisis brought unprecedented challenges and also accelerated theneed forthe adoptionof agile approaches in business. Enterprises havebeen compelledto respond promptly to changes, whether it is migrating to digital platforms, reorganising work processes, or adapting to shifting market conditions (Wang et al., 2024; Plater et al., 2022).
Experience with the application of agility during the crisis showed that companies that used agile management methods were able to react more flexibly, innovate faster and thus minimise the negative impacts of the crisis (Rofiaty et al., 2022; Ludviga and Kalvina, 2024).
Business agility is broadly defined as an organisation ability to swiftly and effectively adapt its business and processes to unpredictable internal and external changes. All definitions of agility include and combine concepts such as permanent change, flexibility, adaptation, innovation, and resilience (Walter, 2021). The importance of agility lies in enabling businesses to respond effectively to market changes, enhance the quality of their products and processes, and simultaneously become more competitive (Clauss et al., 2021). Fundamental foundations for proper agility functionality are agile principles, which include adaptability and flexibility, speed and agility, high customer orientation, teamwork, innovation, and learning (Wade et al., 2021). The principles of agility are applied within the individual elements of agility. The publication by Brosseau et al. (2019) defines and describes eight key elements on which an agile organisation should be built. The dimensions of agility encompass key areas of the enterprise that enable organisations to respond quickly and effectively to change, thereby improving collaboration, innovation, and customer satisfaction (Gagnon and Hadaya, 2018). The Agile Maturity Model, which shows the completeness of enterprise agility, serves as the basic framework of agility, encompassing agility levels within the dimensions and elements of agility. The progress achieved by the maturity model can be observed and managed by defining individual levels of agility that assess the completeness of agility in the context of the level achieved by the enterprise (Wendler, 2014).
The study of literature helped to uncover knowledge gaps that became the main reasons for the focus of our study. The analysis of coronavirus crisis management by WPI enterprises has received little attention in the literature. Also, the use of the case study approach in examining the issue is low in the existing literature, and this approach does not appear in publications concerning the impact of the pandemic on Slovak enterprises. The experience of Slovak enterprises with an agile approach in the context of coping with the impact of the coronavirus crisis is also absent. The pandemic period brought unforeseen changes in the business environment and unexpected government measures. This situation forced businesses to react immediately and act in an agile manner. The coronavirus crisis literally tested the ability of businesses to be agile and apply agile principles. These gaps can be filled through a study examining the reactions of wood processing enterprises in the Slovak Republic during the pandemic.
The aim of this paper is to highlight examples of good and bad practices in woodworking and furniture enterprises in the Slovak Republic during the pandemic crisis, as observed through case studies based on guided interviews with company managers and their financial indicator development during the pandemic period.
Research question: Did the agile approach help wood processing enterprises in the Slovak Republic successfully cope with the coronavirus crisis?
MATERIALS AND METHODS
The intention of the research, the results of which are presented in this paper, was to determine the extent to which WPI SR enterprises were able to adapt to the changes caused by the COVID-19 pandemic. All changes during the pandemic period were unexpected, and
enterprises had to react quickly to survive, implementing unplanned changes and measures, which is typical of an agile approach.
By conducting primary research in the form of guided interviews linked to changes in financial performance and by creating case studies, the best and bad practices of representative WPI companies were identified. Therefore, a structure of guided interviews with owners and managers of representative manufacturing enterprises in the wood and furniture sectors was designed, and a total of 11 interviews were conducted.
Businesses were selected as representatives based on their length of time on the market, size, ownership, and level of financial performance relative to the industry as a whole. More precise criteria for selecting companies for the research sample were established based on changes in economic indicators for the entire sector so that aboveaverage (2), average (1-2), and below-average (2) companies, compared to the industry were represented. Another criterion was the inclusion of companies from each size category existing in the wood and furniture industry in Slovakia.
The content of the interviews was constructed based on insights from the literature review on business agility as well as the impact of the pandemic on business operations. The semi-structured interviews were chosen to facilitate open-ended responses and allow for follow-up questions on thetopic. Theinterviewswereconductedin person at theendof2023 when the effects of the pandemic had largely subsided. The guided interviews included the following questions:
1. What obstacles and challenges did the coronavirus crisis bring to your company?
2. Which areas in your company were most affected by the coronavirus crisis and antipandemic measures?
3. Did opportunities and innovations arise as a result of the coronavirus crisis in your company?
4. What financial and non-financial measures did you take to maintain the continuity of your during the coronavirus crisis?
5. What impact did the coronavirus crisis and the measures taken in your company have on your financial situation and profitability?
6. How did you try to maintain and strengthen relationships with customers and business partners during the coronavirus crisis?
7. How did you communicate the unplanned changes you implemented with your employees, and how did you motivate and support them in the process?
8. What successes and benefits did the unplanned changes and measures implemented bring to your company?
9. In your opinion, which decisions and measures were wrong or not taken in time and worsened the situation of your company?
10. What other changes, besides financial, occurred in your company during and after the coronavirus crisis?
Thesecond partoftheresearchinvolvedanalysing changes in thefinancialindicators of the analysed enterprises during the pandemic, specifically examining data from 2019 to 2022, including sales and profit. The data source was the financial statements database FINSTAT (www.finstat.sk), which compiles all financial information of active enterprises in the Slovak Republic, as required by law. For our analysis, year-on-year indices of change in sales and profit, which were calculated using the following formula were used:
(1)
Where: X refers to a financial indicator (sales or profit)
Toincreasevalidity,secondarydatafromthefinancialdatabasewereconsulted,along withprimarydata,as ameansofrefiningthefindings(Gerbl et al., 2015;Yin,2018).Sources of secondary data included enterprise financial statements, annual reports, and data archived on the websites of the surveyed enterprises. All data from primary and secondary sources using the procedure outlined by Tellis (1997) were triangulated
The results of the interviews and secondary data analysis were compiled into case studies. Case studies are particularly suited for a comprehensive examination of an event to test a theoretical concept; in our research, this involved testing the agility of SR enterprises during a coronavirus crisis. To ensure reliability, a formal, uniform case study protocol was designed. In the last stage, enterprises with significant improvements in business performance during the pandemic as best practice cases and enterprises whose situation was most worsened by the pandemic as examples of bad practice were identified
RESULTS AND DISCUSSION
The case studies show that during the pandemic, all WPI enterprises in Slovakia had to overcome the following obstacles:
- increased safety and hygiene measures and the associated increased costs,
- staff absenteeism due to sick leave and compulsory quarantine,
- supply shortages of input materials,
- increase in the prices of input materials and energy. On the other hand, WPI businesses faced challenges as they were:
- providing online tools and platforms and training staff to work online,
- increase in meetings dealing with customer requirements and demand for WPI products.
Table 1a presents the results of the content analysis of the guided interviews with enterprise managers. From the content analysis of the guided interviews, it is clear that enterprises, divided by size, ownership, and length of time in the market, addressed various specific obstacles while trying to implement measures during the coronavirus crisis according to their capabilities in order to achieve the best possible results. The enterprises made changes during and after the coronavirus crisis, primarily to adapt to shifts in customer needs and demands, as reported by all the surveyed enterprises. In the guided interviews, seven enterprises reported changes in the amount of work in progress and the decrease in inventory, as well as changes in the form of sales and communication to the online space. Supplier relationships and supplier selection improved for 6 of the businesses interviewed. Five enterprises reorganised processes and workflows, and in four enterprises, there was a change in the attitude of management and employees towards wastage. The measures implemented mainly concerned process optimisation, ensuring stable prices for input materials and energy by contracting for more extended periods, as well as innovating or diversifying the production programme according to changes in customer requirements, and introducing digital and online platforms for communication and sales.
Changes in the company during and after the pandemic
Achieved results
Measures implemented during a coronavirus crisis
1 a Content analysis of the guided interviews . Enterprise number Characteristics of the enterprise: industry (SK NACE), size, ownership, length of presence Specific problems/challenges addressed
Tab.
Customer needs and requirements
Increase in sales and profit
Increased flexibility in production and delivery
Increase in stock of materials
Introduction of online communication and sales
Reorganisation of processes
Increased efficiency More efficient use of material stocks
Entering new markets, acquiring new customers
Use of the bridging loan Investing in new technologies and digitisation Use of financial reserves and state aid Optimisation and digitalisation of processes
Low liquidity Significant increase in costs Sustaining production
Longterm contracts for the supply of both inputs and outputs
Customer needs and requirements
Increase in stock of products
Introduction of online communication
Improving the social environment
Stabilisation and improvement of cash flow
Changing distribution channels Disposal of material stocks Involving employees in the change process Use of State aid
Lack of input resources and capacity Lack of cash flow Increase in stocks of finished products without export possibility
Customer needs and requirements Decrease in inventories
Reorganisation of processes and workflows
Introduction of online communication and sales
Customer needs and requirements
Increase in inventories
Changes in the selection of suppliers
Introduction of online communication and sales
Stabilization of sales Influx of new customers
Transition to homeoffice Increased requirements for office furniture Stop production for 1 week Preparation and launch of a new production programme (homeoffice furniture) New investments in technology Use of State aid
Increase in sales Increase in indebtedness
Liquidity reduction Loss of key employees
Acquiring new customers
Striving to meet contracts and prices M ore expensive raw materials at the expense of margin Investment in a new production hall and CNC equipment Increase in material stocks Diversification of markets
Lack of disinfecting and protective aids Lack of staff Extension of production and distribution time
Furniture industry (C 31 )
Mediumsized enterprise: 68 employees Domestic ownership Age of the company: 12 years
1.
Furniture industry (C 31)
Microsized enterprise: 10 employees Combined ownership Age of the company: 13 years
2.
3. Furniture industry (C 31 )
Mediumsized enterprise: 130 employees Combined ownership Age of the company: 33 years
Mediumsized enterprise: 80 employees Domestic ownership Age of the company: 34 years
4. Furniture industry (C 31)
Changes in the company during and after the pandemic
Achieved results
Measures implemented during a coronavirus crisis
Characteristics of the enterprise: industry (SK NACE), size, ownership, length of presence Specific problems/challenges addressed
1 b Content analysis of the guided interviews –continue . Enterprise number
Tab.
Customer needs and requirements
Introduction of online communication and sales
Increase in turnover An influx of new customers
Customer needs and requirements
Decrease in inventories
Reorganisation of processes and workflows
Customer needs and requirements
Decrease in inventories
Improved attitudes towards waste
Reorganisation of processes and workflows
Customer needs and requirements
Decrease in inventories
Management and employee attitudes towards waste have improved
Customer needs and requirements
Introduction of online communication and sales
Furniture industry (C 31 )
Use of State aid Innovation of the offer
Lack of protective Sustaining production
Mediumsized enterprise: 60 employees Domestic ownership Age of the company: 32 years
5.
Stabilization of sales
Ensuring production continuity
Identification of opportunities to expand the production programme
Product innovation (application of new materialsmetal, stainless steel and glass) Use of reserves Disposal of assets Reduction in staff Reduction of prices and profit margin
Decline in interest in wood products Downward pressure on price Loss of key staff Increase in receivables
Timber industry (C16) Small enterprise: 20 employees
6.
Domestic ownership Age of the company: 32 years
Maintaining the viability of the company
Expansion of the production programme with a new product range
Diversification of the production programme Use of stocks and reserves Increased moral and financial reward for work performance
Decrease in demand Decrease in performance
Lack of funding Lack of feedstock
Timber industry (C16) Small enterprise: 15 employees Domestic ownership Age of the company: 28 years
7.
Adaptability to customer requirements
Retaining key staff Cost reduction
Tracking sales and orders Use of State aid Cost optimisation in processes
Decrease in demand Decline in performance and financial losses
Timber industry (C16) Small enterprise: 44 employees Domestic ownership Age of the company: 29 years
8.
Digitisation of processes
Increase skills with online technologies
Acquiring new market segments in the online space
Finding new customers new forms of online sales
Reduction of operating costs Investing in new technologies and digitalisation Use of State aid
Lack of input materials Lack of information Significant drop in orders and sales
Timber industry (C16) Micro enterprise: 8 employees
Domestic ownership Age of the company: 34 years
9.
Tab. 1 c Content analysis of the guided interviews –continue .
Changes in the company during and after the pandemic
Achieved results
Measures implemented during a coronavirus crisis
Enterprise number Characteristics of the enterprise: industry (SK NACE), size, ownership, length of presence Specific problems/challenges addressed
Improved management and employee attitudes towards waste Reorganisation of processes and workflows
Savings on travel costs More flexible decisionmaking
Innovations in approval proceduresonline mode Digitisation of processes Utilisation of stocks of materials and finished products
Transition to homeoffice Setting off site accesses
10. Timber industry (C16) Large enterprise 250+ employees Combined ownership Age of the company: 21 years
Customer needs and requirements
Introduction of online communication and sales
Improving flexibility and adaptability to rapidly changing conditions
Changes in supplier relationships and supplier selection Reorganisation of processes and workflows
Strengthening teamwork Developing digital infrastructure
Increase process efficiency
Flexible responses to supply and logistics challenges Budget, cost and liquidity reviews Introducing flexible working patterns Strengthening internal communication channels Adapting marketing and sales strategies to the online environment
Closure of showrooms Disruption of supply chains Staff shortages and staff cover Postponement of planned investments
11. Timber industry (C16) Small enterprise 22 employees Domestic ownership Age of the company: 27 years
Source: own research
Table 2 shows the indices of the change in revenue and profit of the analysed WPI companies in % year-on-year comparison from 2019 to 2022.
Tab. 2 Changes in sales and profits of the analysed WPI enterprises in %.
Source: own elaboration according to data of www.finstat.sk
As shown in Table 2, the highest increase in revenue was recorded by wood processing enterprise No. 8, up 159.62% compared to 2021/2022. The most significant decrease in revenue occurred in 2020 compared to 2019, by 37.84%, a paradoxical trend also observed in woodworking enterprise No. 8. A substantial drop in profit was noted in wood processing enterprise No. 6, with a decrease of 514.29% between 2021 and 2020. The maximumincreaseinprofitamongthestudied enterpriseswas805.88%forwoodprocessing enterprise No. 10 in 2021 compared to 2020. After the decline in sales in the first year of the pandemic, 2/3 of the studied enterprises managed to increase sales by 30% – 226% over the entire pandemic period, with only enterprise 3 achieving sales at the original pre-pandemic level. In terms of profits, 7 out of 11 enterprises (2/3 of the enterprises) experienced an increase in profits during the pandemic period, ranging from 40% – 724%.
Discussion
Businesses that were agile and implemented changes during the pandemic were able to improve their financial performance, in terms of both sales and profits, despite the period of restrictions and constraints. These enterprises leveraged the pandemic as a business opportunity to their advantage, serving as best practice cases. Of the enterprises surveyed, four were classified as best practice cases under the WPI, comprising three wood processing enterprises (C16) and one furniture manufacturing enterprise (C31). These are micro and small enterprises, and the measures they implemented had a significantly positive impact on sales and profits. These enterprises increased their sales by 10% – 70% per year during the pandemic, and the increase in profits ranged from 76% to 241% per year.
In guided interviews with business managers, it was found that businesses adapted quicklytothenewconditionsandmodifiedtheirofferingstomeetproductsinhigherdemand as a result of the pandemic while also increasing the digitisation of their processes. The best practices of the companies interviewed can be considered as follows:
• Product mix innovation: reorientation of production towards modified products for which demand increased. These mainly were office furniture products and innovations in the materials used. In this way, the companies took advantage of a new market opportunity;
• Entry into new markets and market segments: In the event of disrupted customer relationships and customer loss, companies focus on finding new customers and markets whose needs they can satisfy with their offerings;
• Maintaining an affordable price for customers: avoiding cost increases by entering into longer-term contracts for the supply of energy and materials, with increased costs partially offset by a reduction in profit margin;
• Digitisation and automation: digitisation of processes, switching to online forms of communication and commerce and increasing the robotisation of production processes to acquire new suppliers and customers through the online space;
• Production optimisation: the introduction of methods to eliminate waste, increase the efficiency of production facilities and labour productivity, and the introduction of flexible planning has enabled companies to reduce production costs, which has been reflected in improved profitability;
• Retaining key and skilled employees: regular communication, transparent information, removing administrative burdens, increasing benefits;
• Utilisation of inventories and financial reserves to ensure liquidity and continuity of production, including the sale of unnecessary assets and inventory;
• Rapid response and implementation of unplanned changes: The success of the measures taken depended to a large extent on their correctness and timeliness, as well as the provision of sufficient information and staff training. By reacting quickly, companies were able to take advantage of the market opportunities created by the pandemic over a more extended period.
The above measures had a significant positive impact on the analysed companies, not only in terms of financial results but also in the form of improved production flexibility and process efficiency. During the pandemic period, the enterprises were in better financial and operational condition than they were before the pandemic.
During the coronavirus crisis in Slovakia, manufacturers were compelled to lower prices and offer substantial discounts to customers, regardless of age, gender, or educational background. In contrast, a survey conducted in Croatia by Pirc Barčić et al. (2021) revealed differences among various age groups, genders, and academic levels. Buying furniture at a lower price or discounted products was not that important. Positive preferences in purchases were directed towards functionality, quality and design. Plater et al. (2022) also found that, during the coronavirus crisis, employers introduced systems to support digitisation and process automation, enabling employees to work remotely and take on additional responsibilities.Theyfurtherstatedthatpeopleand technology helpedreducecostsbytaking the initiative and proactively preventing problems through automation. According to research (Rasskazova et al., 2019), HR departments play a crucial role in digitisation and optimisation, becoming more strategic in embracing new opportunities through technology and supporting organisations in achieving their goals and objectives. The advantage of increased business efficiency is provided to organisations by top management, which, as respondents from Slovak enterprises also stated, jointly engage in strategic workforce planning, including digital transformation and workforce transformation. This approach helps companies manage change and increase performance and productivity. Timber extraction and wooden furniture manufacturer maintained employment and production, with only minor disruptions in Slovenia, Croatia, Serbia and Bosnia and Herzegovina, according
to Kuzman et al. (2022). Furniture manufacture operated at full capacity as demand for furniture continued to increase. Many people were unable to travel for the holidays because borders were closed, so they spent their holiday budgets on renovating and refurbishing their homes and apartments. The findings of Ludvig and Kalvin (2024) also suggest that the perceived strategic agility of an organisation has a significant positive impact on employee engagement and, therefore, on well-being. Organisational learning, leadership, and clarity of objectives are factors that contribute positively to an organisation strategic agility.
Businesses that were not agile in adapting to change or making incorrect decisions during the pandemic struggled to improve their financial performance, particularly in terms of sales and profits. This was particularly the case for businesses that focused solely on maintaining sales, made poor investment timing decisions, and overextended their credit, which primarily contributed to the decline in the profit ratio. These enterprises can be classified as exhibiting bad practices, and within this category, three medium-sized enterprises are identified: one from the timber sector (C16) and two from the furniture sector (C31). Although these enterprises achieved a 7%-36% increase in sales per year due to increased demand during the pandemic, they experienced a 65%-230% year-on-year decline in the bottom line and went from profit to loss. These manufacturing enterprises were not flexible enough to innovate and adapt to market changes, and as a result, they struggled to cope with the coronavirus crisis. The main bad practices are:
• Inability to take advantage of changes in demand and to innovate the product range promptly: striving primarily to maintain production, not responding to changed market needs, inability to be flexible in production;
• Production curtailment and closure: failure to address staff shortages and inadequate health and safety measures for employees led to reduced production and interrupted deliveries, resulting in the loss of customers.
• Redundancies: a drop or complete failure of orders meant that production had to be curtailed, reducing the need for staff and consequently creating a problem in rehiring the necessary staff after the pandemic had passed;
• Slow and late reactions and actions: unpreparedness for the security measures resulting from the COVID-19 pandemic, delayed search for alternative suppliers after a supply failure, slow response to changed customer demands, implementation of only necessary measures without process adjustments;
• Making costly investments: new, unexpected health expenditures and input price increases, increased investment spending, resulting in the need to seek savings in other areas or leading to business insolvency;
• Full pass-through of cost increases to sales price increases: significant input price increases passed on to customers in a period of uncertainty led to a reduction in demand and even a complete loss of customers.
The above reactions by businesses resulted in deteriorating financial results, increased business continuity problems, the breakdown of customer markets and difficulty in recruiting skilled staff once the pandemic is over and economic activity recovered. Four of the companies surveyed managed to stabilise their financial situation during the pandemic by entering new markets, using their stocks and reserves, and only slightly increasing prices at the expense of margins.
Kuzman et al. (2022) concluded that, similarly to Slovakia, the COVID-19 pandemic severely affected the supply chain in Slovenia, Croatia, Serbia and Bosnia and Herzegovina.Themostcriticalproblemsincludedincreasedpricesofallmaterials,increased transport costs, extended delivery times, limited quantities of all materials and complete disruption of supply chains. Walter (2021) notes that, in response to slow and late changes by companies, management should observe and monitor market developments, assess and distinguish between risk and uncertainty, and respond proactively to identified trends by implementing appropriate agile measures. The results of Wang et al.'s (2024) research suggest that supply chain agility should also include the ability to solve problems in supplier selection as a key criterion following the COVID-19 pandemic. Measuring supply chain agility can also be considered a crucial way to manage supply chain risks and uncertainties following the COVID-19 pandemic. Rofiaty et al. (2022) state that the courage to take business risks needs to be encouraged, even during the COVID-19 pandemic, which was marked by uncertainty in an ever-changing business environment.
From the above results, it follows that the answer to our research question: “Did the agile approach help the wood processing enterprises of the Slovak Republic to cope with the coronavirus crisis successfully?” is: Yes, it did.
This statement is also supported by Pirc Barčić et al. (2021), who stated that the agility of companies enables them to take bold and decisive steps. It gives them the freedom and flexibility to seek unconventional solutions and to create offerings that differ significantly from those of their competitors. Similar views are shared by Clauss et al. (2021), who argued that to survive, companies should prioritise a strategy of exploring innovative processes to generate radically new insights, products, and services or combine a strategy of exploitation with strategic agility. Ludviga and Kalvina (2024) concluded that if employees are supported by leaders who perceive change, make timely decisions, and act agilely; they will experience higher job engagement during a crisis, which will positively contribute to their well-being and the organisation performance. Rofiaty et al. (2022) noted that owners and managers of small and medium-sized enterprises can enhance their performance by increasing their entrepreneurial orientation and strengthening their strategic agility. They must also continuously improve their proactive approach as part of their entrepreneurial orientation to further improve their performance.
CONCLUSION
The pandemic period, which brought about unexpected changes, forced companies to adapt quickly and find new ways to stay in business. Some businesses were able to react early to the new conditions and capitalise on the crisis, while others are still struggling to recover from the pandemic's effects.
This study highlightedcases ofgoodandbadpractices among Slovak woodprocessing and furniture manufacturing enterprises, which were identified by comparing the reactions and implementedchanges withintheenterprises with thechanges in financial indicators.The results showed that enterprises that reacted quickly to the changed market conditions took advantage of the increased demand by fast deliveries or adjusted the production programme to meet the changed customer requirements, as well as enterprises that digitised and optimised processes achieved significantly better results in terms of sales and profit and profitability and were in a better financial condition than in the period before the pandemic. The most inappropriate responses of businesses can be considered to be late or incorrect
responses to change, which business representatives identified as reasons for failure to meet customer demands and maintain market position and financial stability. The worst impacts were observed in enterprises that took no action at all.
The main contribution of the paper is to extend empirical knowledge by examining the impacts of pandemics on the business of wood processing enterprises in the context of business agility. The coronavirus crisis tested the level of flexibility and the ability to apply agile principles also in wood processing enterprises. It can be concluded that agility, i.e. the ability to react quickly and effectively to change, had a key influence on the behaviour of woodworking and furniture enterprises during the coronavirus crisis and on its successful management.
The limitation of this study is the use of a smaller sample for analysis, which does not correspondtoastatisticallyrepresentativesampleofwoodprocessingcompaniesinSlovakia necessary to generalise the results to the entire set of WPI enterprises in Slovakia. Another limitation is the higher degree of subjectivity due to the use of qualitative research methods. On the other hand, it is essential to note that qualitative research enables more detailed and accurate results, which are necessary to identify examples of good and bad practices in companies.
Further research will focus on examining attitudes towards agility, the ability and willingness to build agility in wood processing enterprises. It will also be necessary to explore the barriers and capabilities of wood processing enterprises in implementing agile management principles. In the next phase, we will focus on developing a methodology for determining the achievable and assessing the level of agility reached in WPI enterprises.
REFERENCES
Bauer, A., Weber, E., 2020. COVID-19: How much unemployment was caused by the shutdown in Germany? Applied Economics Letters, 28(12), 1053-1058. https://doi.org/10.1080/13504851.2020.1789544
Bečka, M., 2020. Impact of the current global SARS-CoV-2 pandemic on employment in the Slovak economy. Ekonomické rozhľady: scientific journal of the University of Economics in Bratislava. Bratislava: University of Economics in Bratislava, 49(2), 188-214. ISSN 0323262X.
Belanová, K., 2021. Support measures for small and medium-sized enterprises in Slovakia in response to COVID-19. Economy at the crossroads of time. Collection of Scientific Articles. European Scientific e-Journal, 4(10), 17-27. https://doi.org/10.47451/ecn2021-02-001.
Belas, J., Gavurová, B., Dvorský, J., Cepel, M., Durana, P., 2021. The impact of the COVID-19 pandemic on selected areas of a management system in SMEs. Ekonomska Istraživanja / Economic Research, 35(1), 1-24. https://doi.org/10.1080/1331677X.2021.2004187
Brosseau, D., Ebrahim, S., Handscomb, C., Thaker, S., 2019. The journey to an agile organization. McKinsey & Company, May, 10, 14-27.
Cepel, M., Gavurova, B., Dvorsky, J., Belas, J., 2020. The impact of the COVID-19 crisis on the perception of business risk in the SME segment. Journal of International Studies, 13(3), 248263.https://doi.org/10.14254/2071-8330.2020/13-3/16
Clauss, T., Kraus, S., Kallinger, F. L., Bican, P. M., Brem, A., Kailer, N., 2021. Organizational ambidexterity and competitive advantage: The role of strategic agility in the explorationexploitation paradox. Journal of Innovation & Knowledge, 6(4), 203-213. https://doi.org/10.1016/j.jik.2020.07.003
Como, R., Hambley, L., Domene, J., 2021. An exploration of work-life wellness and remote work during and beyond COVID-19. Canadian Journal of Career Development, 20(1), 46-56. Retrieved from https://cjcd-rcdc.ceric.ca/index.php/cjcd/article/view/92 Finstat, 2024. Database of Slovak enterprises and organizations. [Online]. Available at: https://finstat.sk/databaza-firiem-organizacii. [Accessed: 2024-12-10].
Gagnon, B., Hadaya,P., 2018. Thefour dimensionsofBusiness Agility. BernardGagnon and Pierre Hadaya.
Gerbl, M., McIvor, R., Loane, S., Humphreys, P., 2015. A multi-theory approach to understanding the business process outsourcing decision. Journal of World Business, 50(3), 505-518. https://doi.org/10.1016/j.jwb.2014.08.009
Hlawiczka, R., Kollar, B., 2021. Globalization andits impact on Slovak economyduring coronavirus crisis. SHS Web of Conferences, 92, 01014. https://doi.org/10.1051/shsconf/20219201014.
Chen, J., Yang, C.-C., 2021. The impact of the COVID-19 pandemic on consumers' preferences for wood furniture: An accounting perspective. Forests, 12, 1637. doi:10.3390/f1212163.
Jelačić, D., Pirc Barčić, A., Oblak, L., Motik, D., Grošelj, P., Jošt, M., 2021. Sustainable production management model for small and medium enterprises in some south-central EU countries. Sustainability, 13(11), 6220. https://doi.org/10.3390/su13116220.
Kramarova,K.,Švábová,L.,Gabrikova,B.,2022.ImpactsoftheCOVID-19crisisonunemployment in Slovakia: A statistically created counterfactual approach using the time series analysis. Equilibrium. https://doi.org/10.24136/eq.2022.012
Kuzman,M.,Oblak,L.,Glavonjic,B.,PircBarcic,A.,Obućina,M.,Haviarova,E.,Grošelj,P.,2022. Impact of COVID-19 on wood-based products industry: An exploratory study in Slovenia, Croatia, Serbia, and BiH. Wood Material Science & Engineering, 18(1), 1-12. https://doi.org/10.1080/17480272.2022.2109210.
Lambovska, M., Sardinha, B., Belas, J., 2021. Impact of COVID-19 pandemic on youth unemployment in the European Union. Ekonomicko-manazerske spektrum, 15(1), 55-63. https://doi.org/10.26552/ems.2021.1.55-63
Ludviga, I., Kalvina, A., 2024. Organizational agility during crisis: do employees' perceptions of public sector organizations' strategic agility foster employees' work engagement and well-being? Employee Responsibilities and Rights Journal, 36(2), 209-229. https://doi.org/10.1007/s10672023-09442-9
Mura, L., Fóthy, N., Pásztóová, V., 2022. State support for small and medium-sized enterprises in pandemic period: Evidence from Slovakia. Vadyba / Journal of Management, 38(1), 37-44. https://doi.org/10.38104/vadyba.2022.1.04
Pirc Barčić, A., Kitek Kuzman, M., Vergot, T. Goršelj, P. 2021. Monitoring consumer purchasing behaviour for wood furniture before and during the COVID-19 pandemic. Forests, 12, 873. https://doi.org/10.3390/f12070873
Plater,Q.,Frazier,M.,Talbert,P.,Davis,V.,Talbert,P.,2022.HumanResourcesStrategies&Lessons Learned During the COVID-19 Pandemic: A Literature Review. Management Dynamics in the Knowledge Economy, 10, 330 - 342. https://doi.org/10.2478/mdke-2022-0021
Plutzer, V., 2021. Industry in the time of the crown. The impact of the first wave of the coronavirus crisis on industrial activity in Slovakia. Commentary 2021/3. MF SR. https://www.mfsr.sk/files/archiv/94/Komentar_priem_2020_ pdf
Putra Kristianto, F., Fariz, N., Saputra, D., Islami Athirah, S., 2021. Framework for Furniture and Wood Processing IndustryPolytechnicin Era of Disruption of Covid-19. International Research Journal of Business Studies. 14(2), 107-117. https://doi.org/10.21632/irjbs.14.2.107-117.
Rasskazova, A., Koroleva, E., Rasskazov, S., 2019. Digital transformation: statistical evaluation of success factors of an ICO-campaign. IOP conference series: Materials science and engineering (Vol. 497, No. 1, p. 012087). IOP Publishing. https://iopscience.iop.org/article/10.1088/1757899X/497/1/012087/
Rofiaty, R., Chong, D., Nusron, A., Yulianti, N. A., Sunaryo, S., 2022. Entrepreneurship orientation and performance of green economy SMEs during COVID-19 pandemic: The mediation of strategic agility. Journal of Economics, Business, & Accountancy Ventura, 25(1), 48-60. https://doi.org/10.14414/jebav.v25i1.3001
Sánchez-Torres, J., 2019. Moderating effect of the digital divide of e-commerce. International Journal of Social Economics, 46, 1387-1400. https://doi.org/10.1108/IJSE-11-2018-0622
SBA., 2021. Adverse impact of the coronavirus pandemic on the corporate economy of the Slovak Republic. Retrieved from http://monitoringmsp.sk/wpcontent/uploads/2020/06/Preh%C4%BEad-a-porovnanie-opatren%C3%AD-
prijat%C3%BDch-pre-MSP-v-d%C3%B4sledku-pand%C3%A9mie-COVID-19-v-SR-a-vosvete.pdf
Sonawane, M. K., 2020. An impact of e-commerce (business organization). UGC Care Journal, 40(64), 82 – 89. Retrieved from https://www.researchgate.net/publication/346218448_An_ Impact_of_ECommerce_Business_Organization
Statistical Office of the Slovak Republic, DATAcube database., 2024. Retrieved from https://datacube.statistics.sk/
Svabova, L., Tesarova, E. N., Durica, M., Strakova, L., 2021. Evaluation of the impacts of the COVID-19 pandemic on the development of the unemployment rate in Slovakia. Equilibrium. Quarterly Journal of Economics and Economic Policy, 16(2), 261-284. https://doi.org/10.24136/eq.2021.010
Štalmachova, K., Strenitzerová, M., 2021. The intensity of e-commerce use in pandemic times. Post, Telecommunications and Electronic Commerce, 16, 84-90. https://doi.org/10.26552/pte.C.2021.2.13.
Tellis, W., 1997. Introduction to Case Study. The Qualitative Report, 3 (2), 1-19. 11. Tomková, A., Gonos, J., Čulková, K., Rovňák, M., 2024. The impact of the COVID-19 pandemic on the economy of the Slovak Republic. Economies, 12, 27. https://doi.org/10.3390/economies12020027
Wade, M., Teracino, E., 2021. reprint HBR 6 Principles to Build Your Company's Strategic Agility. Harward Business Review. Retrieved May 15, 2024, from https://hbr.org/2021/09/6-principlesto-build-your-companys-strategic-agility
Walter, A.T., 2021. Organizational agility: ill-defined and somewhat confusing? A systematic literature review and conceptualization. Management Review Quarterly, 71: 343–391. https://doi.org/10.1007/s11301-020-00186-6
Wang, M., JIE, F., Frederico, G., F., 2024. Measuring supply chain agility during the COVID-19 pandemic: empirical evidence from the firms in the UAE. International Journal of Agile Systems and Management, 17(1), 1-14. https://doi.org/10.1504/IJASM.2024.135371
Wendler, R., 2014. Development of the organizational agility maturity model, 2014 Federated Conference on Computer Science and Information Systems (FedCSIS), IEEE, Warsaw, Poland, pp. 1197-1206. https://doi.org/10.15439/2014F79
Yin, R. K., 2018. Case Study Research and Applications: Design and Methods (6th ed.). Thousand Oaks, CA: Sage.
Zemaník, P., 2020. Wood processing sector in Slovakia. Drevársky magazin, 11/2020. Issue. Trednwood-twd, s.r.o., ISSN 1338-3701.
ACKNOWLEDGMENT
The authors are grateful for the support of the Slovak VEGA Agency, the paper is a partial result of the grant scientific project VEGA 1/0204/25 Building and managing enterprise agility in the context of sustainable competitiveness.
AUTHORS’ ADDRESSES
Andrea Janáková Sujová
Ľubica Simanová
Department of Economics, Management and Business Faculty of Wood Sciences and Technology Technical University in Zvolen
T. G. Masaryka 24, 960 01 Zvolen, Slovak Republic andrea.sujova@tuzvo.sk lubica.simanova@tuzvo.sk
ACTA FACULTATIS XYLOLOGIAE ZVOLEN, 67(1): 153 164, 2025
Zvolen, Technická univerzita vo Zvolene
DOI: 10.17423/afx.2025.67.1.13
USING ARTIFICIAL INTELLIGENCE IN THE DEVELOPMENT OF MARKETING COMMUNICATION TOOLS FOR A SPECIFIC FURNITURE PRODUCT
Erika Loučanová – Martina Nosáľová
ABSTRACT
Artificial intelligence is transforming various industries, including the furniture sector, by enhancing efficiency and innovation. attitudes toward AI-driven marketing communication tools in the wood processing industry are evaluated in this paper. An experiment focused on using artificial intelligence to create communication tools for a specific furniture product, namely a selected kitchen unit from a Slovak furniture manufacturing company and subsequently evaluated the perception of AI-generated suggestions in comparison to humangenerated ones. The attitudes observed in the experiment were determined through a questionnaire and evaluated using descriptive statistics. AI-generated ideas were rated as more original and attractive than those from human participants and professional designers; however, they face challenges such as incomprehensibility and credibility issues. The results of the experiment align with theoretical knowledge and other research, indicating that AIgenerated ideas are original, innovative, and appealing to customers; however, the human factor remains very important and necessary. Maintaining a professional approach is essentialwhen creatingselectedmarketingcommunicationtoolstoensuretheireffectiveness and proper targeting.
Keywords: artificial intelligence; marketing communication; innovation; wood product.
INTRODUCTION
New technologies are transforming life to enhance well-being and simplify tasks. Artificial Intelligence (AI) simulates the human brain to perform various tasks. Thanks to advancements in information systems, AI is now prevalent in many sectors, facilitating innovation and progress (Zahra, 2023). Its impact spans numerous fields (Li et al., 2024). In creativeindustries,AIistransforminghowwecreate,produce,andmarketideas,particularly in photography, writing, composition, and fashion. AI not only automates activities but also enriches creativity, enabling new forms of artistic expression (Wang et al., 2024). AI has opened new possibilities in trends, design, furniture, and visual arts (Li et al., 2024).
Authors Karíž et al. (2024) highlight that AI adoption in the economy is closely tied to digitalization. They view AI as a key driver of digital transformation in the wood processing industry, offering solutions to enhance various processes. As with robotics and AI technology, the furniture sector is a prime example of innovation and change (Brunello et al., 2025). The progression of furniture design from intelligent to smart, and ultimately to AI-driven furniture, was emphasized by Aboushall and Jalagat (2024). Although every
technology has its pros and cons, smart furniture has evolved to include AI-enabled furniture. By utilizing AI management systems and expert systems, this change enhances the utilization of technology, thereby improving production efficiency and product quality in the furniture manufacturing industry (Aboushall and Jalagat, 2024). Artificial intelligence is revolutionizing the furniture sector by promoting innovation, simplifying design, streamlining supply chains, and improving quality control. Additionally, it enhances the whole experience by enhancing client involvement through augmented reality. Cost and accessibility, however, are still essential for broad adoption. Experts anticipate significant advancements in AI as its power increases with the reduction of computer prices and an increase in investments (Henshall, 2023; Karíž et al., 2024). Furniture design requires inquiry, refining, and testing across disciplines to succeed. This intricacy requires designers to consider many options. Complex system engineering influences modern furniture design, which integrates multiple technologies (Zahra, 2023).
AI is revolutionizing furniture design and manufacturing, enabling more creative, personalized, and sustainable solutions throughout the entire production process, from concept to final product (Wang et al., 2024). The furniture industry must embrace digital trends while staying ahead of technological advancements to sustain growth and remain relevant. Innovation and adaptability are crucial for creating value, driving creativity, and meeting consumers' evolving needs. Digitalization is not just a phase but a new reality, and companies that understand its importance will set the standards for quality, sustainability, and customer satisfaction. By doing so, the industry can shape a future that is digital, innovative, and inclusive (Rame et al., 2023).
Current research underscores that while AIis capable of generating ideas, human input remains vital. AI excels in specific tasks, such as image classification and visual reasoning, but struggles with more complex challenges, including advanced mathematics, visual commonsense reasoning, and strategic planning (Maslej et al., 2024). Moreover, Chong (2024) highlights that despite advancements in language comprehension and coding, AI continues to face hurdles in complex reasoning and planning tasks that require context, common sense, and advanced cognitive abilities. This shortcoming is particularly evident in natural language understanding, where AI systems often struggle to grasp the nuances and subtleties of human language.
A survey of furniture designers (Zahra, 2023) revealed that 89.4% believe AI excels at generating initial ideas, while 87.2% feel AI alone is insufficient without designer input. 72.3% view AI as a valuable tool for enhancing interactive and virtual design, but 78.7% fear it may diminish the uniqueness of designers' identities. A study from Stanford University (Si et al., 2024) found that AI-generated ideas were rated as newer than those from human experts; however, they often faced issues such as a lack of implementation details, incorrect use of datasets, and unrealistic assumptions. This research suggests that while AI-generated ideas can be innovative, they often require human revision and adaptation to achieve practical feasibility.
Authors Ashkinaze et al. (2024) argue that AI alters ideas rather than enhances them, with no significant effects resulting from disclosure. Their findings indicate that AIgenerated ideas can enhance collective diversity but not individual creativity. The Stanford report(Maslej et al., 2024)statesthatanalyzingextremeAIrisksiscomplex,sparkingdebate among experts on prioritizing immediate risks, such as algorithmic bias, versus long-term existential threats. This makes it difficult to distinguish between scientifically supported claims and those that influence policymaking. The challenge increases with the gap between tangible short-term risks and theoretical threats. Additionally, AI-related incidents increased to 123 in 2023, representing a 32.3% rise from 2022 and more than twentyfold since 2013
(Maslej et al., 2024). Thus, while AI aids innovation and idea generation, human intervention is crucial for practical application, ethical oversight, and quality control.
The success of AI proposal adoption relies on various complex conditions, as explored in several studies (Tursunbayeva et al., 2024; Kelly et al., 2023; Oliveira et al., 2024). The topic is influenced by numerous technological and human-centred variables. Key factors include the perceived utility of AI systems (Rane et al., 2024). Oliveira et al. (2024) emphasize the importance of comprehensive plans that consider both technological and human elements for balanced AI adoption. Norton (2023) notes that while AI evolves rapidly, it cannot replace human intelligence; it automates tasks and enhances decisionmaking but lacks emotional understanding, reasoning, and empathy.
The above facts inspired us to conduct an experiment focused on the application of artificial intelligence in the development of communication tools for a specific furniture product, specifically a selected kitchen unit from a Slovak furniture company. The aim of this experiment is to evaluate and compare attitudes towards the use of artificial intelligence in the development of marketing communication tools for a selected kitchen unit, with a focus on the customer.
MATERIALS AND METHODS
The experimental research method is the primary research approach applied in this paper. The following were the objects of the experiment:
- Product name for a selected furniture product,
- Sklik advertising in the form of short text belonging to the chosen furniture product, which is a tool to display text and banner ads in search results (Netmarketer, 2025),
- Visual display of the product by a picture.
For the purposes of the experiment, the Decodom kitchen unit was selected as the examined furniture product. The main characteristics of the product are shown in Fig. 1:
Name: Kitchen unit SMILE 150 X 300 B (DECODOM company)
Sklik advertising text: “Clean lines, simplicity, and timeless design are the main features of our new sector kitchen Smile In addition to being aesthetically pleasing, it is also practical and carefully designed to fulfil your daily requirements “.
In order to carry out the experiment, the research group consisted of the following individuals as participants:
Fig. 1 Selected kitchen unit for an experiment (Decodom, 2024).
- Professional advertisement designers represented by Slovak furniture company Decodom (2024),
- Graduates of Innovation management and marketing as the experts due to the actual educational base according to the analyzed issue,
- Artificial intelligence – AI – Deeply.cz. Deeply.cz was selected for research in artificial intelligence due to its specialization in marketing content generation and visual design tools tailored for commercial use.
In the experiment, each participant was given the task of proposing, based on the kitchen unit that was displayed by picture, the following:
- the product name under which the kitchen unit should be sold,
- and a short Sklik advertising text for the kitchen unit.
Except for the product name and Sklik advertising text, the professional proposal of Decodom also included a picture of the monitored kitchen unit. Following that, we developed a concept using AI, where the AI created a picture of the kitchen unit based on the product name and a Sklik text. In this manner, we gathered research materials for the actual experiment: two pictures, ten name options, and ten Sklik advertising texts. Afterwards, we created a questionnaire using our collected data, including Sklik advertising texts and name recommendations. The questions in the questionnaire were designed to allow participants to rate the parameters that we tracked using a Likert scale (ranging from 1 to 5, where 1 indicated an agreeable attitude or suitability and 5 indicated a disagreeable attitude or unsuitability of the studied parameter for the kitchen unit).
Subsequently, a laboratory experiment was carried out in the laboratory of simulated market testing of the Department of Marketing, Trade and World Forestry at the Technical University of Zvolen, where artificial conditions were created for a product test of selected furniture products from the perspective of using human, professional and artificial intelligence for the creation of selected innovative elements of marketing communication. This article presents only the results of the experiment for the kitchen unit, which is the object of research.
The participants ranked the individual names, Sklik texts and pictures (research objects) of the selected kitchen unit and rated them on a Likert scale according to their parameters:
• Ranking
• Attractiveness
• Comprehensibility
• Originality
• Emotional impact
• Trustworthiness and credibility
• Memorability
• Relevance to the promoted product
The examined parameters represent a modified CRUSH model (Bergh, Behrer, 2012; Aaker 2003).
Respondents were also presented with pictures of the selected product: one created initially as a professional Decodom design and one made by AI. Based on the simulated
situation created, the subjects had the opportunity to equally evaluate these pictures on a Likert scale from the perspective of the above-mentioned parameters.
Students of innovation and marketing management were chosen as the target group for the actual laboratory experiment because they were both potential customers of Generation Z and possible implementers of innovative marketing communication elements. This sample of 15 participants was selected for the study due to their expertise in marketing management and innovation, as well as their status as the first generation to have grown up with everyday access to portable digital devices and the internet (Strauss, 2019).
Using fundamental statistical indicators, such as the arithmetic average, median, and mode, descriptive statistics have been employed to assess the participants' identified attitudes. The arithmetic average is defined as the sum of the measured values divided by their number n. The median divides an ordered set of values of a statistical characteristic into two equal parts, i.e. each of them contains 50% of the statistical units. The mode of a data set is any value whose frequency of occurrence is greater than one and is equal to or greater than the frequency of occurrence of any other value (Ostertagová, 2015).
The following research question was set as part of the research: Does the use of artificial intelligence in the development of marketing communication tools for a selected kitchen unit impact customers? and hypothesis:
There is a statistical relationship between the use of artificial intelligence in the development of marketing communication tools for a selected kitchen unit and its impact on customers.
To verify the statistical significance of the hypothesis, we first calculated the F-test value, which allows us to examine the equality of dispersion among indicators within the two-factor analysis of the individual factors. Based on the results of the F-test, we proceeded to test the hypotheses using a t-test for equality, specifically for the dispersion inequality of the examined data. We determined the significance of the hypotheses using the correlation coefficient, which ranges from -1 to 1. The sign of the correlation coefficient indicates whether the correlation is positive or negative. A coefficient close to zero suggests a weaker relationship between the examined variables, while a value closer to 1 or -1 indicates a stronger relationship (Hanák, 2016). The interpretation of the correlation coefficient follows Cohen´s guidelines (1988): 0.0 - 0.1 indicates a trivial correlation, 0.1 - 0.3 indicates a slight correlation, 0.3 - 0.5 indicates a medium correlation, 0.5 - 0.7 indicates a significant correlation,0.7 -0.9indicatesaconsiderable correlation, 0.9 -1.0indicatesanalmost perfect correlation.
RESULTS AND DISCUSSION
The collected data were processed into a database, where the fundamental statistical indicators of the research were assessed. This analysis shows that, in terms of ranking, professional name suggestions are most positively perceived from the perspective of the average, with the most frequently occurring value of name suitability identified among experts.
Even though attractiveness also achieved highly favourable values among experts (median = 1, mode = 1), professional proposals were the most popular regarding the evaluated attractiveness of the product name proposals (lowest average value = 1.8, mode =
1). Similar opinions can be observed in other factors that have been studied, such as the impact of emotions, credibility and trustworthiness, memorability, and relevance to the product being advertised. There is a notable difference, primarily in originality, where AI generated the most creative name idea for the product offered, as seen in the basic statistical data. However, from the perspective of the most commonly occurring value of the positive evaluation of the suggested names, these are among the experts. From the perspective of the lowest average, the name suggestions are also evaluated very positively in terms of the examinedparameters, suchas emotionalimpact, credibility, believability,andmemorability.
In the case of Sklik texts, the evaluation of the data points in favour of a professional proposal and partly artificial intelligence. The most appealing, comprehensible, unique, reliable, and credible Sklik texts are unquestionably professional proposals, as is the one with the strongest connection to the advertised product. From the standpoint of the best average, respondents findartificialintelligenceappealingwhenconsidering order,emotional impact, memorability, and relevance to the promoted product. However, when considering other fundamental statistical indicators, these values are not evident.
When creating a promotional picture for a kitchen unit, a professional photographer's image was edited and modified to meet the product's promotional requirements. However, when the artificial intelligence-generated image was compared, it was rated higher.
Tab. 1 Results . PRODUCT NAME
SKLIK TEXTS
For the statistical evaluation of the established research hypothesis, we used the Ftest to assess the normality of variables and conducted a t-test to examine the difference in variances, as shown in Table 2. The hypothesis under investigation - There is a statistical relationship between the use of artificial intelligence in the development of marketing communication tools for a selected kitchen unit and its impact on customers - was accepted based on these evaluations. The normality of the data distribution was confirmed, and the ttest revealed a statistically significant relationship between the analyzed variables. The t-stat value (1.37794) falls within the evaluation range, indicating that the t-stat test statistic lies in the area of acceptance of the null hypothesis, which is defined by the interval -1.999085 to 1.999085. Furthermore, the strength of the relationship between the examined variables is very strong and positive (0.850075).
Tab. 2 Results of statistical hypothesis testing.
Research Objective
To evaluate and compare attitudes towards the use of artificial intelligence in the development of marketing communication tools with the customer for a selected kitchen unit
Research Question Does the use of artificial intelligence in the development of marketing communication tools for a selected kitchen unit have an impact on customers?
Hypothesis
There is a statistical relationship between the use of artificial intelligence in the development of marketing communication tools for a selected kitchen unit and its impact on customers.
F-test 1 3389 F critical 1.704465
Assessing the Normality of Variables with the F-Test
Hypothesis Testing t-Test for Difference of Variances
We accept the hypothesis of equality of variances
The test for equality of variances applies Minus Area -1 99085
Hypothesis Testing t-Test for Equality of Variances The hypothesis is accepted
Pearson Correlation Coefficient 0 850075
Strength of Relationship - Pearson
Correlation Coefficient Very strong positive
Our findings are also supported by a study by Si et al. (2024), which claims AI is a valuable tool for improving interactive and virtual design (the best score was obtained by AI in creating a kitchen unit visual display by picture), while simultaneously AI can reduce the uniqueness ofdesigners' identities. Similarly,AI-generatedideas wererated as moreoriginal and attractive than those of human participants, but they face problems such as incomprehensibility and credibility issues. This suggests that although AI-generated ideas can be innovative, human evaluation and modification are necessary to make them feasible in practice (Si et al., 2024; Zahra, 2023; Ashkinaze et al., 2024). AI-generated ideas increase diversity, but they do not necessarily support individual creativity, are not always understandable to customers, and are not always adaptable to the products they relate to, which is also indicated by the study by Ashkinaze et al. (2024). From this context, it can be concluded (Tursunbayeva et al., 2024; Kelly et al., 2023; Oliveira et al., 2024) that AI can contribute to innovation and idea generation; however, human intervention is necessary for their practical application, ethical control, and quality assurance. The perception of the
usefulness of AI is crucial for developing comprehensive plans based on a deep understanding of both technological capabilities and human elements, as AI cannot replace human intelligence (Norton, 2023; Rane et al., 2024). Although it automates tasks and generates inspiring ideas, it lacks the understanding, reasoning, and empathy that humans possess. In addition, AI is also associated with certain risks and long-term existential threats and challenges (Maslej et al., 2024), which need to be increased in guiding the creation of AI use.
It is clear from the above that the furniture industry should adopt digital trends while staying ahead of technological advancements to sustain its growth. Innovation and adaptability to market trends are crucial for creating value, fostering creativity, and meeting evolving customer needs. For generations that did not know life before the internet and had access to portable digital technologies from an early age, the use of AI as a recent digitalization is not a new reality in a society that recognizes its importance and sets standards for quality, sustainability, and customer satisfaction (Rame et al., 2023).
This research underlines that while AI can generate ideas, human input remains vital, particularly highlighting the importance of a professional approach. Artificial intelligence excels in specific tasks, but it still surpasses the professionalism of the human factor.
CONCLUSION
The research confirmed the existing relationship between the use of artificial intelligencein thedevelopment ofmarketingcommunicationtools foraselectedkitchenunit and its impact on customers. Moreover, the research indicates a highly positive relationship. Based on the experiment performed, we can draw the following conclusions: The designs created by artificial intelligence are original and attractive to customers, indicating its potential to create visually appealing concepts. Artificial intelligence has also proven to be a valuable tool in improving interactive and virtual design, suggesting its relevance in modern creative processes. Therefore, the furniture industry should embrace digital trends and actively incorporate the use of artificial intelligence.
On the other hand, customers often struggle to understand and associate the generated designs with the specific product, which may reduce their credibility. While artificial intelligence is capable of developing innovative ideas, the human factor remains irreplaceable – especially in terms of context, emotional impact and authenticity. Furthermore, maintaining a professional approach is essential when creating selected marketing communication tools to ensure their effectiveness and proper targeting.
A limitation of the study is that the attractiveness and understandability of AIgenerated designs were rated by respondents, which is a subjective assessment that may vary according to individual preferences. Also, the research focused on a specific single kitchen set, which may limit the generalizability of the conclusions to other types of furniture or products. Based on these findings, the research can be applied in the future to other selected products,offeringvaluableinsightsintotheuseofartificialintelligenceinbroadermarketing contexts.
REFERENCES
Aaker, David A., 2003. Brand building: budování obchodní značky. Přeložil Vilém JUNGMANN. Brno: Computer Press, 2003. ISBN 80-7226-885-6
Aboushall, D., Jalagat, R., 2024. Artificial intelligence's contribution to the furniture design process development. International Journal of Humanities and Educational Research, 6(3), 1-15. https://www.ijherjournal.com
Ashkinaze, J., Mendelsohn, J., Qiwei, L., Budak, C., Gilbert, E., 2024. How AI Ideas Affect the Creativity, Diversity, and Evolution of Human Ideas: Evidence From a Large, Dynamic Experiment. ArXiv. https://arxiv.org/abs/2401.13481
Bergh, J. A Behrer, M., 2012. Jak cool značky zůstávají hot: marketing zaměřený na mladou "generaci Y" [How cool brands stay hot: marketing aimed at the young "Generation Y".]1. vyd. Brno: BizBooks, 248 p. ISBN 978-80-265-0002-5.
Brunello, A., Fabris, G., Gasparetto, A., Montanari, A., Saccomanno, N., Scalera, N., 2025. A survey on recent trends in robotics and artificial intelligence in the furniture industry. Robotics and Computer-Integrated Manufacturing, 93, 102920. https://doi.org/10.1016/j.rcim.2024.102920 Decodom , 2024. Kuchyňa SMILE [SMILE kitchen]: https://www.decodom.sk/skupiny/kuchynasmile-180x300-rohova-b-1/dub-arlington-biela-arctic-matna Chong, S. T., 2024. AIin2024: Surpassing human capabilities, revolutionizingindustries, andfacing keychallenges.[WWWDocument].UnitedNationsUniversity.URLhttps://c3.unu.edu/blog/aiin-2024-surpassing-human-capabilities-revolutionizing-industries-and-facing-keychallenges?utm_source=chatgpt.com
Cohen, J., 1988. Statistical Power Analysis for the Behavioral Sciences. 2nd. Lawrence Erlbaum. Hanák, R., 2016. Dátová analýza pre sociálne vedy [Data analysis for social sciences].1. st ed. Bratislava: Ekonóm, 2016. 148 p. Kariž, M., Kitek-Kuzman, M., Kropivšek, J., 2024. Possibilities of using artificial intelligence in furniture/woodworking industry. Drvna Industrija, 75(3), 371-380. https://doi.org/10.5552/drvind.2024.0169
Kelly, S., Kaye, S.-A., Oviedo-Trespalacios, O., 2023. What factors contribute to the acceptance of artificial intelligence? A systematic review. Telematics and Informatics, 77, 101925. https://doi.org/10.1016/j.tele.2022.101925
Li, Z., Sayuti, N. A. A., Wang, J., 2024. Exploring the application of artificial intelligence-generated content (AIGC) in modern furniture design innovation. Pak. J. Life Soc. Sci., 22(1), 4191-4199. https://doi.org/10.57239/PJLSS-2024-22.1.00307
Maslej, N., Fattorini,L., Perrault, R., Parli, V., Reuel, A., Brynjolfsson, E., Etchemendy, J., Ligett K., Lyons, T., Manyika, J., Niebles, J.C., Shoham, Y., Wald, R., Clark, J., 2024. The AI Index 2024 Annual Report, AI Index Steering Committee, Institute for Human-Centered AI, Stanford University, Stanford, CA, April 2024.
Netmarketer , 2025. Sklik advertising. [WWW Document]. URL https://www.netmarketer.sk/reklama-sklik. Norton, C., 2023. Combining AI and Human Intelligence: Adding Value in the Age of Automation and AI. [WWW Document]. URL: https://www.velosio.com/blog/combining-ai-and-humanintelligence-adding-value-in-the-age-of-automation-and-ai/ Oliveira, J., Murphy, T., Vaughn, G., Elfahim, S., Carpenter, R. E., 2024. Exploring the Adoption Phenomenon of Artificial Intelligence by Doctoral Students Within Doctoral Education. New Horizons in Adult Education and Human Resource Development, 36(4), 248-262. https://doi.org/10.1177/19394225241287032
Ostertagová, E., 2015. Aplikovaná štatistika v počítačovom prostredí MATLABu [Applied statistics in the MATLAB computer environment]. Equilibria, Košice. 175 p. ISBN 978-80-553-2089-2. Rame, R., Purwanto, P., Sudarno, S., 2023. Transforming the furniture industry in the digital age. Jurnal Riset Teknologi Pencegahan Pencemaran Industri, 14, 53-69. https://doi.org/10.21771/jrtppi.2023.v14.no3.p53-69
Rane,N.,Choudhary,S.,Rane,J.,2024.Acceptanceofartificialintelligence:keyfactors,challenges, and implementation strategies [WWW Document]. URL https://ssrn.com/abstract=4842167 or http://dx.doi.org/10.2139/ssrn.4842167
Si, C., Yang, D., Hashimoto, T., 2024. Can LLMs Generate Novel Research Ideas? A Large-Scale Human Study with 100+ NLP Researchers. [WWW Document]. ArXiv. URL https://arxiv.org/abs/2409.04109
Strauss, V., 2019. Today's kids might be digital natives but a new study shows they aren't close to being computer literate. [WWW Document]. The Washington Post. URL www.washingtonpost.com/education/2019/11/16/todays-kids-may-be-digital-natives-newstudy-shows-they-arent-close-being-computer-literate/ Tursunbayeva,A.,Chalutz-BenGal,H.,2024.Adoptionofartificialintelligence: ATOPframeworkbased checklist for digital leaders. Business Horizons, 67(4), 357-368. https://doi.org/10.1016/j.bushor.2024.04.006
Wang, J., Sayuti, N. A. A., Li, Z., 2024. Artificial intelligence innovation method for bamboo furniture based on user perception. Pak. J. Life Soc. Sci., 22(1), 4065-4076. https://doi.org/10.57239/PJLSS-2024-22.1.00297
Zahra, N., 2023. Role of artificial intelligence technology in the development of furniture design process. International Design Journal, 13(6), 503-520.
ACKNOWLEDGMENT
This paper was supported by the Ministry of Education, Research, Development and Youth of the Slovakand processed within grants VEGA 1/0513/25,KEGA 016TU Z-4/2025 and APVV-23-0022.
AUTHORS’ ADDRESSES
Assoc. prof. Ing. Erika Loučanová, PhD. Ing. Martina Nosáľová, PhD. Technical University in Zvolen Faculty of Wood Sciences and Technology Department of Marketing, Trade and World Forestry
T. G. Masaryka 24, 960 01 Zvolen, Slovakia loucanova@tuzvo.sk nosalova@tuzvo.sk