34
Blue Skies, Blue Seas
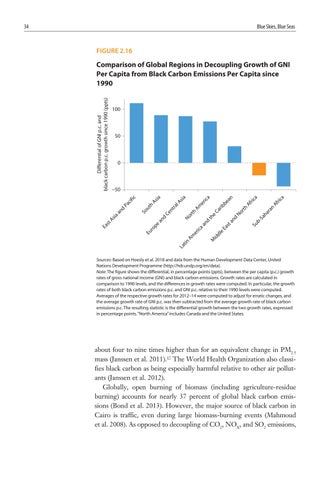
FIGURE 2.16
Differential of GNI p.c. and black carbon p.c. growth since 1990 (ppts)
Comparison of Global Regions in Decoupling Growth of GNI Per Capita from Black Carbon Emissions Per Capita since 1990
100
50
0
a ric
a
Af n
Af ha Sa b-
e
Su
st Ea
ra
rth an
d
th d an ica M
id
dl
er Am La
tin
No
Ca e
rth No
ro Eu
ric
an rib
Am
er
be
ica
sia ra nt Ce
d pe
an
As st Ea
lA
As h ut So
ia
an
d
Pa
cif
ic
ia
−50
Sources: Based on Hoesly et al. 2018 and data from the Human Development Data Center, United Nations Development Programme (http://hdr.undp.org/en/data). Note: The figure shows the differential, in percentage points (ppts), between the per capita (p.c.) growth rates of gross national income (GNI) and black carbon emissions. Growth rates are calculated in comparison to 1990 levels, and the differences in growth rates were computed. In particular, the growth rates of both black carbon emissions p.c. and GNI p.c. relative to their 1990 levels were computed. Averages of the respective growth rates for 2012–14 were computed to adjust for erratic changes, and the average growth rate of GNI p.c. was then subtracted from the average growth rate of black carbon emissions p.c. The resulting statistic is the differential growth between the two growth rates, expressed in percentage points. “North America” includes Canada and the United States.
about four to nine times higher than for an equivalent change in PM2.5 mass (Janssen et al. 2011).17 The World Health Organization also classifies black carbon as being especially harmful relative to other air pollutants (Janssen et al. 2012). Globally, open burning of biomass (including agriculture-residue burning) accounts for nearly 37 percent of global black carbon emissions (Bond et al. 2013). However, the major source of black carbon in Cairo is traffic, even during large biomass-burning events (Mahmoud et al. 2008). As opposed to decoupling of CO2, NOX, and SO2 emissions,


