340
Blue Skies, Blue Seas
BOX 5.9
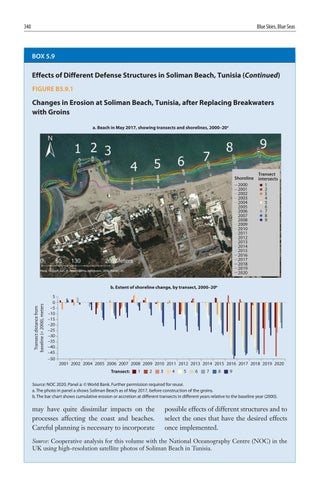
Effects of Different Defense Structures in Soliman Beach, Tunisia (Continued) FIGURE B5.9.1
Changes in Erosion at Soliman Beach, Tunisia, after Replacing Breakwaters with Groins a. Beach in May 2017, showing transects and shorelines, 2000–20a
Transect Shoreline intersects 2000 1 2001 2 2002 3 2003 4 2004 5 2005 6 2006 7 2007 8 2008 9 2009 2010 2011 2012 2013 2014 2015 2016 2017 2018 2019 2020
Transect distance from baseline (= 2000), meters
b. Extent of shoreline change, by transect, 2000–20b 5 0 –5 –10 –15 –20 –25 –30 –35 –40 –45 –50
2001 2002 2004 2005 2006 2007 2008 2009 2010 2011 2012 2013 2014 2015 2016 2017 2018 2019 2020 Transect:
1
2
3
4
5
6
7
8
9
Source: NOC 2020. Panel a: © World Bank. Further permission required for reuse. a. The photo in panel a shows Soliman Beach as of May 2017, before construction of the groins. b. The bar chart shows cumulative erosion or accretion at different transects in different years relative to the baseline year (2000).
may have quite dissimilar impacts on the processes affecting the coast and beaches. Careful planning is necessary to incorporate
possible effects of different structures and to select the ones that have the desired effects once implemented.
Source: Cooperative analysis for this volume with the National Oceanography Centre (NOC) in the UK using high-resolution satellite photos of Soliman Beach in Tunisia.


