302
Blue Skies, Blue Seas
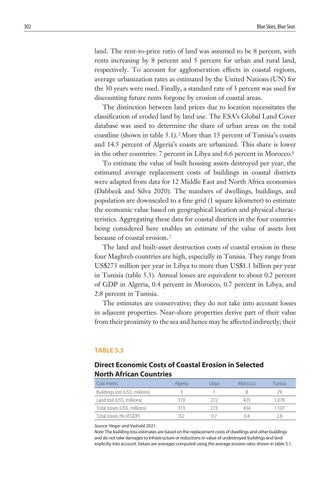
land. The rent-to-price ratio of land was assumed to be 8 percent, with rents increasing by 8 percent and 5 percent for urban and rural land, respectively. To account for agglomeration effects in coastal regions, average urbanization rates as estimated by the United Nations (UN) for the 30 years were used. Finally, a standard rate of 3 percent was used for discounting future rents forgone by erosion of coastal areas. The distinction between land prices due to location necessitates the classification of eroded land by land use. The ESA’s Global Land Cover database was used to determine the share of urban areas on the total coastline (shown in table 5.1). 5 More than 15 percent of Tunisia’s coasts and 14.5 percent of Algeria’s coasts are urbanized. This share is lower in the other countries: 7 percent in Libya and 6.6 percent in Morocco.6 To estimate the value of built housing assets destroyed per year, the estimated average replacement costs of buildings in coastal districts were adapted from data for 12 Middle East and North Africa economies (Dabbeek and Silva 2020). The numbers of dwellings, buildings, and population are downscaled to a fine grid (1 square kilometer) to estimate the economic value based on geographical location and physical characteristics. Aggregating these data for coastal districts in the four countries being considered here enables an estimate of the value of assets lost because of coastal erosion. 7 The land and built-asset destruction costs of coastal erosion in these four Maghreb countries are high, especially in Tunisia. They range from US$273 million per year in Libya to more than US$1.1 billion per year in Tunisia (table 5.3). Annual losses are equivalent to about 0.2 percent of GDP in Algeria, 0.4 percent in Morocco, 0.7 percent in Libya, and 2.8 percent in Tunisia. The estimates are conservative; they do not take into account losses in adjacent properties. Near-shore properties derive part of their value from their proximity to the sea and hence may be affected indirectly; their
TABLE 5.3
Direct Economic Costs of Coastal Erosion in Selected North African Countries Cost metric Buildings lost (US$, millions) Land lost (US$, millions) Total losses (US$, millions) Total losses (% of GDP)
Algeria
Libya
Morocco
Tunisia
3 310 313 0.2
1 272 273 0.7
8 425 434 0.4
29 1,078 1,107 2.8
Source: Heger and Vashold 2021. Note: The building-loss estimates are based on the replacement costs of dwellings and other buildings and do not take damages to infrastructure or reductions in value of undestroyed buildings and land explicitly into account. Values are averages computed using the average erosion rates shown in table 5.1.


