190
Blue Skies, Blue Seas
FIGURE 4.5
0.3
0.2
0.1
Sa h Af aran ric a
bSu
So
ut
h
As
ia
pe
W
es
te
rth
rn
Am
Eu
er
ro
ica
eq hr M
hr ag M
as No
st Ea
eb
0
As ia Pa an cif d ic E Ce uro nt pe ra an lA d Gu sia lf Co op e Co rati un on La cil tin th Am e er Ca ic rib a a be nd an
Average daily plastic waste generation (kg per capita)
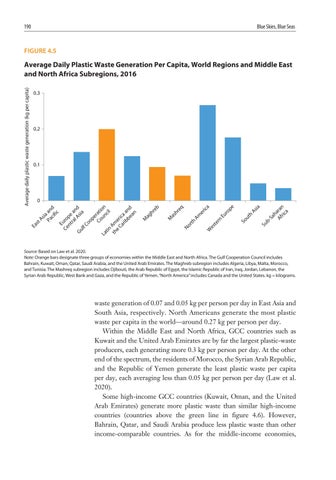
Average Daily Plastic Waste Generation Per Capita, World Regions and Middle East and North Africa Subregions, 2016
Source: Based on Law et al. 2020. Note: Orange bars designate three groups of economies within the Middle East and North Africa. The Gulf Cooperation Council includes Bahrain, Kuwait, Oman, Qatar, Saudi Arabia, and the United Arab Emirates. The Maghreb subregion includes Algeria, Libya, Malta, Morocco, and Tunisia. The Mashreq subregion includes Djibouti, the Arab Republic of Egypt, the Islamic Republic of Iran, Iraq, Jordan, Lebanon, the Syrian Arab Republic, West Bank and Gaza, and the Republic of Yemen. “North America” includes Canada and the United States. kg = kilograms.
waste generation of 0.07 and 0.05 kg per person per day in East Asia and South Asia, respectively. North Americans generate the most plastic waste per capita in the world—around 0.27 kg per person per day. Within the Middle East and North Africa, GCC countries such as Kuwait and the United Arab Emirates are by far the largest plastic-waste producers, each generating more 0.3 kg per person per day. At the other end of the spectrum, the residents of Morocco, the Syrian Arab Republic, and the Republic of Yemen generate the least plastic waste per capita per day, each averaging less than 0.05 kg per person per day (Law et al. 2020). Some high-income GCC countries (Kuwait, Oman, and the United Arab Emirates) generate more plastic waste than similar high-income countries (countries above the green line in figure 4.6). However, Bahrain, Qatar, and Saudi Arabia produce less plastic waste than other income-comparable countries. As for the middle-income economies,


