Blue Skies for Healthy and Prosperous Cities
121
BOX 3.8
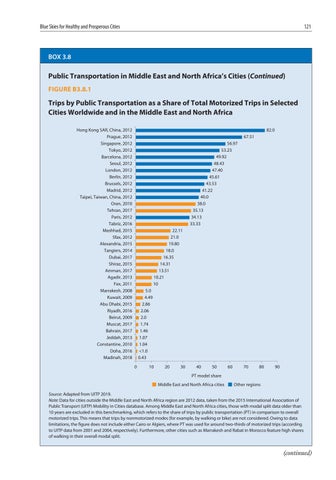
Public Transportation in Middle East and North Africa’s Cities (Continued) FIGURE B3.8.1
Trips by Public Transportation as a Share of Total Motorized Trips in Selected Cities Worldwide and in the Middle East and North Africa Hong Kong SAR, China, 2012 Prague, 2012 Singapore, 2012 Tokyo, 2012 Barcelona, 2012 Seoul, 2012 London, 2012 Berlin, 2012 Brussels, 2012 Madrid, 2012 Taipei, Taiwan, China, 2012 Oran, 2010 Tehran, 2017 Paris, 2012 Tabriz, 2016 Mashhad, 2015 Sfax, 2012 Alexandria, 2015 Tangiers, 2014 Dubai, 2017 Shiraz, 2015 Amman, 2017 Agadir, 2013 Fex, 2011 Marrakesh, 2008 Kuwait, 2009 Abu Dhabi, 2015 Riyadh, 2016 Beirut, 2009 Muscat, 2017 Bahrain, 2017 Jeddah, 2013 Constantine, 2010 Doha, 2016 Madinah, 2018
82.0 67.51 56.97 53.23 49.92 48.43 47.40 45.61 43.53 41.22 40.0 38.0 35.13 34.13 33.33 22.11 21.0 19.80 18.0 16.35 14.31 13.51 10.21 10 5.0 4.49 2.86 2.06 2.0 1.74 1.46 1.07 1.04 <1.0 0.43 0
10
20
30
40
50
60
70
80
90
PT model share Middle East and North Africa cities
Other regions
Source: Adapted from UITP 2019. Note: Data for cities outside the Middle East and North Africa region are 2012 data, taken from the 2015 International Association of Public Transport (UITP) Mobility in Cities database. Among Middle East and North Africa cities, those with modal split data older than 10 years are excluded in this benchmarking, which refers to the share of trips by public transportation (PT) in comparison to overall motorized trips. This means that trips by nonmotorized modes (for example, by walking or bike) are not considered. Owing to data limitations, the figure does not include either Cairo or Algiers, where PT was used for around two-thirds of motorized trips (according to UITP data from 2001 and 2004, respectively). Furthermore, other cities such as Marrakesh and Rabat in Morocco feature high shares of walking in their overall modal split.
(continued)


