Blue Skies, Blue Seas

Page 135

Blue Skies for Healthy and Prosperous Cities

89

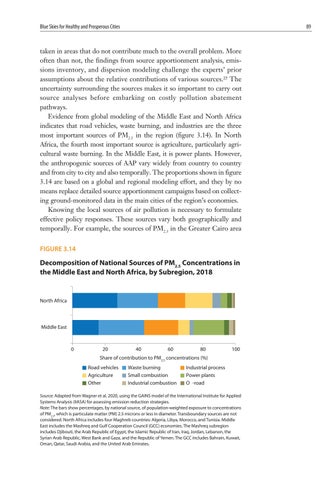
taken in areas that do not contribute much to the overall problem. More often than not, the findings from source apportionment analysis, emissions inventory, and dispersion modeling challenge the experts’ prior assumptions about the relative contributions of various sources.19 The uncertainty surrounding the sources makes it so important to carry out source analyses before embarking on costly pollution abatement pathways. Evidence from global modeling of the Middle East and North Africa indicates that road vehicles, waste burning, and industries are the three most important sources of PM2.5 in the region (figure 3.14). In North Africa, the fourth most important source is agriculture, particularly agricultural waste burning. In the Middle East, it is power plants. However, the anthropogenic sources of AAP vary widely from country to country and from city to city and also temporally. The proportions shown in figure 3.14 are based on a global and regional modeling effort, and they by no means replace detailed source apportionment campaigns based on collecting ground-monitored data in the main cities of the region’s economies. Knowing the local sources of air pollution is necessary to formulate effective policy responses. These sources vary both geographically and temporally. For example, the sources of PM2.5 in the Greater Cairo area FIGURE 3.14

Decomposition of National Sources of PM2.5 Concentrations in the Middle East and North Africa, by Subregion, 2018

North Africa

Middle East

0

20

40

60

80

100

Share of contribution to PM2.5 concentrations (%) Road vehicles Agriculture Other

Waste burning Small combustion Industrial combustion

Industrial process Power plants O -road

Source: Adapted from Wagner et al. 2020, using the GAINS model of the International Institute for Applied Systems Analysis (IIASA) for assessing emission reduction strategies. Note: The bars show percentages, by national source, of population-weighted exposure to concentrations of PM2.5, which is particulate matter (PM) 2.5 microns or less in diameter. Transboundary sources are not considered. North Africa includes four Maghreb countries: Algeria, Libya, Morocco, and Tunisia. Middle East includes the Mashreq and Gulf Cooperation Council (GCC) economies. The Mashreq subregion includes Djibouti, the Arab Republic of Egypt, the Islamic Republic of Iran, Iraq, Jordan, Lebanon, the Syrian Arab Republic, West Bank and Gaza, and the Republic of Yemen. The GCC includes Bahrain, Kuwait, Oman, Qatar, Saudi Arabia, and the United Arab Emirates.


Turn static files into dynamic content formats.

Create a flipbook

Articles inside

References

20min
pages 394-405

Notes

2min
page 393

B5.9.1 Changes in Erosion at Soliman Beach, Tunisia, after Replacing Breakwaters with Groins

14min
pages 386-392

5.8 General Overview of Hard-Defense Options

2min
page 379

Combating Coastal Erosion

6min
pages 376-378

in Morocco

4min
pages 372-373

Coast and Nile Delta Regions, the Arab Republic of Egypt

2min
page 374

Eliminate Coastal Erosion

2min
page 368

West Africa

2min
page 367

Solutions to Fight Coastal Erosion

6min
pages 369-371

Coastal Erosion

11min
pages 361-366

Mitigate Coastal-Erosion Effects

8min
pages 356-360

Policy Review: How to Combat Coastal Erosion

1min
page 355

Countries, 2020

1min
page 347

Djerba Island, Tunisia, 1992–2019

2min
pages 353-354

Unwillingness to Return

3min
pages 351-352

North African Countries

6min
pages 348-350

African Countries

1min
page 346

Systems: Examples from Latin America

18min
pages 307-315

Financially Sustainable

7min
pages 303-306

References

22min
pages 318-330

Impact of COVID-19

4min
pages 336-337

El Heri, Lebanon, 1962–2007

2min
pages 341-342

Overview

3min
pages 331-332

How Eroded Is the Coast?

6min
pages 333-335

Notes

4min
pages 316-317

4.9 The EU Plan to Reduce SUP

19min
pages 292-300

Malaysia, the Philippines, and Thailand

3min
pages 301-302

Countries, 2018

2min
page 291

North Africa

4min
pages 289-290

4.6 Morocco: Implementing an Ecotax on Plastic Production

2min
page 283

B4.7.1 PET Waste Exports in Tunisia, 2000–18

7min
pages 285-288

4.5 Eliminating SUPs in the United Arab Emirates

2min
page 282

4.7 Tunisia: The ECOLEF Program to Increase Recycling

1min
page 284

Middle East and North Africa

10min
pages 277-281

4.3 Green Bond Financing for SWM Systems

6min
pages 273-275

Policy Review: How to Get Clear, Blue, Plastic-Free Seas

5min
pages 248-250

in the Middle East and North Africa, by Economy and Subregion, 2016

1min
page 267

Economy, 2016

3min
pages 269-270

4.10 A Circular Economy for Plastics

7min
pages 261-264

Morocco’s Coasts

7min
pages 257-260

The Environmental, Public Health, and Economic Impacts of Plastic-Polluted Seas

11min
pages 242-247

World Regions and Middle East and North Africa Subregions, 2016

1min
page 236

and 2025

2min
pages 233-234

Overview

3min
pages 227-228

Policy Agenda

2min
page 230

The State of Plastic Pollution in the Seas

1min
page 229

Notes

7min
pages 209-211

3.17 Green Space in Cairo, the Arab Republic of Egypt

4min
pages 206-207

References

31min
pages 212-226

by World Region, 2014

3min
pages 183-184

3.11 California’s Emissions Trading System

2min
page 181

Happy Seeder

4min
pages 199-200

and North Africa, by Economy, 2010

3min
pages 194-195

Middle East and North Africa

10min
pages 201-205

Greater Cairo

2min
page 197

3.12 Saudi Arabia’s Efforts to Increase Energy Efficiency

6min
pages 185-187

and North Africa, by Economy, 2018

1min
page 196

East and North Africa

4min
pages 179-180

3.9 Place-Based Policies and Their Effects on Air Pollution

6min
pages 170-172

the Middle East and North Africa

5min
pages 167-169

North Africa

2min
page 160

Cities

2min
page 166

Global Region B3.8.1 Trips by Public Transportation as a Share of Total Motorized Trips in Selected Cities Worldwide and in

3min
pages 164-165

Middle East and North Africa

8min
pages 156-159

Africa, by Economy, 2020

3min
pages 161-162

3.5 Environmental Fiscal Reform: International Experiences

6min
pages 153-155

Oil Prices Reduces Public Discontent

6min
pages 150-152

Summer and Fall 2010

3min
pages 136-137

Experience

3min
pages 148-149

and North Africa, by Economy, 2016 and 2018

1min
page 145

East and North Africa, by Economy, 2016 and 2018 B3.7.1 Diesel Sulfur Limits in the Middle East and North

3min
pages 146-147

Arab Emirates

9min
pages 139-143

by Subregion, 2018

1min
page 135

PM10 and PM2.5

1min
page 134

Policy Review: How to Get Clear Blue Skies

15min
pages 126-133

Pollution, by Region, 2019

5min
pages 121-123

Overview

3min
pages 103-104

Africa, by Subregion and Economy, 2019

1min
page 117

How Polluted Are the Cities’ Skies?

4min
pages 105-106

Selected Middle East and North Africa Countries, 2018

1min
page 109

North Africa, by Economy, 2019

1min
page 116

The Health and Economic Impacts of Dirty Skies

2min
page 111

References

14min
pages 95-102

by Multilateral Organizations

6min
pages 83-85

Capita since 1990

3min
pages 80-81

Overview

1min
page 47

Its Potential Pitfalls

2min
page 89

Notes

7min
pages 92-94

Conclusion

4min
pages 90-91

Overview

3min
pages 53-54

2.2 Job Creation from Green Growth Strategies

6min
pages 86-88
Issuu converts static files into: digital portfolios, online yearbooks, online catalogs, digital photo albums and more. Sign up and create your flipbook.
Blue Skies, Blue Seas by World Bank Publications - Issuu