Blue Skies for Healthy and Prosperous Cities
75
increase substantially the number of hospitalizations (as a measure of morbidity). AAP is a major source of many potentially fatal diseases (as shown in figure 3.7) and increases the frequency of hospital stays or days staying home from work. Common pollutants such as CO, NO2, and PM have been found to increase hospital admissions for cardiovascular and all cardiac diseases, cardiac failure, ischemic heart disease, and myocardial infarction.10 Short-term exposure to higher PM2.5 levels in particular increases the risk of hospital admissions for cardiovascular and respiratory diseases (Dominici et al. 2006).
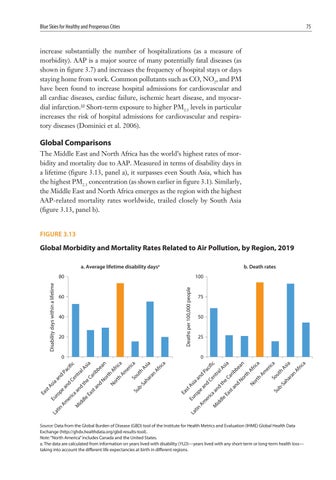
Global Comparisons The Middle East and North Africa has the world’s highest rates of morbidity and mortality due to AAP. Measured in terms of disability days in a lifetime (figure 3.13, panel a), it surpasses even South Asia, which has the highest PM2.5 concentration (as shown earlier in figure 3.1). Similarly, the Middle East and North Africa emerges as the region with the highest AAP-related mortality rates worldwide, trailed closely by South Asia (figure 3.13, panel b). FIGURE 3.13
Global Morbidity and Mortality Rates Related to Air Pollution, by Region, 2019 a. Average lifetime disability daysa
b. Death rates 100 Deaths per 100,000 people
60
40
20
75
50
25
a ric Af
Su
b-
Sa
ha
ra
n
As ia
a So
ut h
er ic
a ric Af No
rth
Am
an nd
No
rth
rib
Ca e
th
ta
M
id
dl
e
Ea s
aa
nd
d an
e Am
La
tin
be
sia
c nt
ra
Pa c d
Ce
an As ia st
op
Ea
lA
ifi
a ric Af
As ia
n
ha Sa
bSu
a
ica
ut h
So
er
ric Af
rth
No
rth
Am
be No
ra
Eu r
e
Ea s
ta
nd
th
e
Ca
ra M
id
dl
an
nd
d aa
er ic
pe Am
tin La
rib
ic
lA
cif Pa
Ce nt
d an ia As ro
st Ea
Eu
an
0
sia
0
er ic
Disability days within a lifetime
80
Source: Data from the Global Burden of Disease (GBD) tool of the Institute for Health Metrics and Evaluation (IHME) Global Health Data Exchange (http://ghdx.healthdata.org/gbd-results-tool). Note: “North America” includes Canada and the United States. a. The data are calculated from information on years lived with disability (YLD)—years lived with any short-term or long-term health loss— taking into account the different life expectancies at birth in different regions.


