
Hymans Robertson LLP is authorised and regulated by the Financial Conduct Authority Report on the actuarial valuation at 31 March 2022 31 March 2023 For and on behalf of Hymans Robertson LLP Wiltshire Pension Fund Catherine McFadyen FFA Barry Dodds FFA

2 VALUATION RESULTS FINAL COMMENTS APPENDICES RATES & ADJUSTMENTS CERTIFICATE SECTION 13 DASHBOARD SENSITIVITY & RISK ANALYSIS APPROACH TO VALUATION EXECUTIVE SUMMARY Contents In this report: Page Executive summary 3 Approach to valuation 4 Valuation results 8 Sensitivity & risk analysis 15 Final comments 19 Appendices 21 Rates & Adjustments certificate 32 Section 13 dashboard 44
Executive Summary
We have been commissioned by Wiltshire Council (the AdministeringAuthority) to carry out a valuation of the Wiltshire Pension Fund (the Fund) as at 31 March 2022. This fulfils Regulation 62 of the Local Government Pension Scheme Regulations 2013. This report is a summary of the valuation.
Contribution rates
The contribution rates for individual employers set at this valuation can be found in the Rates & Adjustments certificate. Table 1 shows the combined individual employer rates set at this valuation and the last valuation (31 March 2019).
Table 1: Whole fund contribution rates compared with the previous valuation
Funding position
At 31 March 2022, the past service funding position has improved from the last valuation at 31 March 2019. Table 2 shows the reported funding position at the current and previous valuation.
Table 2: Single reported funding position at 31 March 2022 compared with 31 March 2019
• The Primary rate has increased mainly due to higher inflation.
• The Secondary rate has decreased due to good investment performance since the last valuation.
The required investment return to be 100% funded is now 4.0% pa (the same as at 2019). The likelihood of the Fund’s investment strategy achieving the required return is 77% (71% at 2019).
3 VALUATION RESULTS FINAL COMMENTS APPENDICES RATES & ADJUSTMENTS CERTIFICATE SECTION 13 DASHBOARD SENSITIVITY & RISK ANALYSIS APPROACH TO VALUATION EXECUTIVE SUMMARY
Valuation Date 31 March 2022 31 March 2019 Past Service Liabilities (£m) (£m) Employees 953 777 Deferred Pensioners 805 688 Pensioners 1,391 1,215 Total Liabilities 3,149 2,680 Assets 3,230 2,589 Surplus/(Deficit) 81 (92) Funding Level 103% 97%
This valuation 31 March 2022 Last valuation 31 March 2019
Secondary Rate 2023/2024 £5,147,000 2020/2021 £10,973,000 2024/2025 £3,818,000 2021/2022 £11,079,000 2025/2026 £5,851,000 2022/2023 £10,844,000
Primary Rate 22.2% of pay 22.0% of pay
Approach to valuation

Valuation Purpose
The triennial actuarial valuation is an important part of the Fund’s risk management framework. Its main purpose is to ensure the Fund continues to have a contribution plan and investment strategy that will achieve the objectives set out in the Funding Strategy Statement.
We have been commissioned by Wiltshire Council (the AdministeringAuthority) to carry out a valuation of the Wiltshire Pension Fund (the Fund) as at 31 March 2022. This fulfils Regulation 62 of the Local Government Pension Scheme Regulations 2013. This report marks the culmination of the valuation process and contains its two key outcomes:
1 2
Employer contribution rates for the period 1 April 2023 to 31 March 2026.
The funding level of the Fund at 31 March 2022.
Further information on the valuation process, methodology and strategy is set out in the publicly available Funding Strategy Statement, Investment Strategy Statement and published papers and minutes of the Fund’s Pensions Committee.Additional material is also contained in Hymans Robertson’s LGPS 2022 valuation toolkit1 .
5 VALUATION RESULTS FINAL COMMENTS APPENDICES RATES & ADJUSTMENTS CERTIFICATE SECTION 13 DASHBOARD SENSITIVITY & RISK ANALYSIS APPROACH TO VALUATION EXECUTIVE SUMMARY
1 www.hymans.co.uk/media/uploads/LGPS_2022_Valuation_Toolkit.pdf
Setting employer contribution rates
Employer contributions need to be set at a level which ensures the Fund has a reasonable likelihood of having enough money to pay members’ benefits. Identifying the amount of benefits that may be paid is complex as those earned today might only start being paid in 50 years’ time. Over that time period, there is significant uncertainty over factors which affect the cost of benefits, e.g. inflation, investment returns. These uncertainties are allowed for by taking a risk-based approach to setting employer contribution rates. This approach is built around three key funding decisions set by the Fund and asset-liability modelling.
Key funding decisions
For each employer, the Fund determines the most appropriate choice for the following three funding decisions. Further detail is set out in the Funding Strategy Statement.
What is the funding target for each employer?
Will the employer remain in the Fund for the long-term or exit at some point
Modelling approach
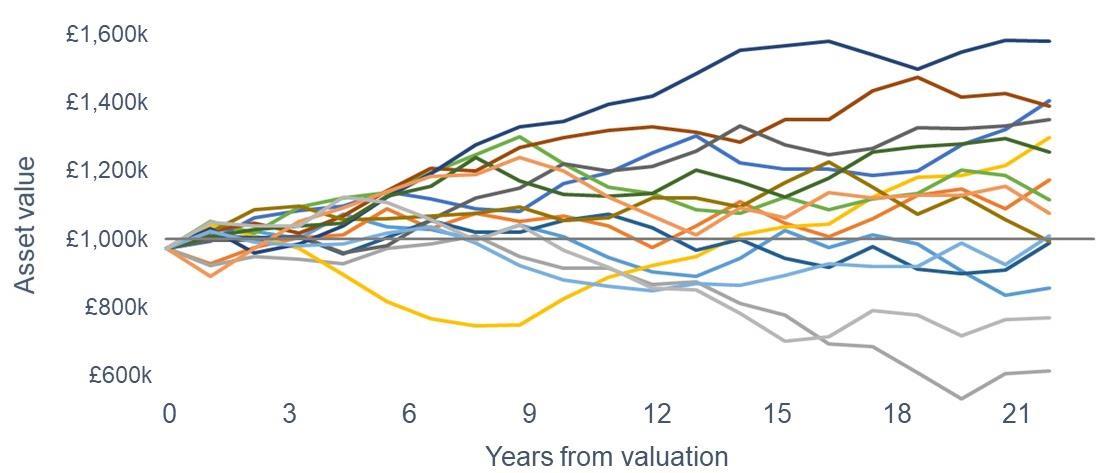
Asset-liability modelling is used to project each employer’s assets and benefit payments into the future using 5,000 different economic scenarios. The economic scenarios are generated using Hymans Robertson’s Economic Scenario Service (ESS) (further information in Appendix 2).
Picture 1: sample progression of employer asset values under different economic scenarios
What is the funding time horizon?
How long will the employer participate in the Fund
What is the required likelihood?
How much funding risk can the employer’s covenant support
6 VALUATION RESULTS FINAL COMMENTS APPENDICES RATES & ADJUSTMENTS CERTIFICATE SECTION 13 DASHBOARD SENSITIVITY & RISK ANALYSIS APPROACH TO VALUATION EXECUTIVE SUMMARY
Measuring the funding level
The past service funding level is measured at the valuation. Whilst it is limited in providing insight into a funding plan, it is a useful high-level summary statistic. To measure the funding level, a market-related approach is taken to calculating both the assets and the liabilities (so they are consistent with each other).
• The market value of the Fund’s assets at the valuation date have been used.
• The liabilities have been valued using assumptions based on market indicators at the valuation date (these assumptions are detailed in Appendix 2).
Further detail on the liabilities
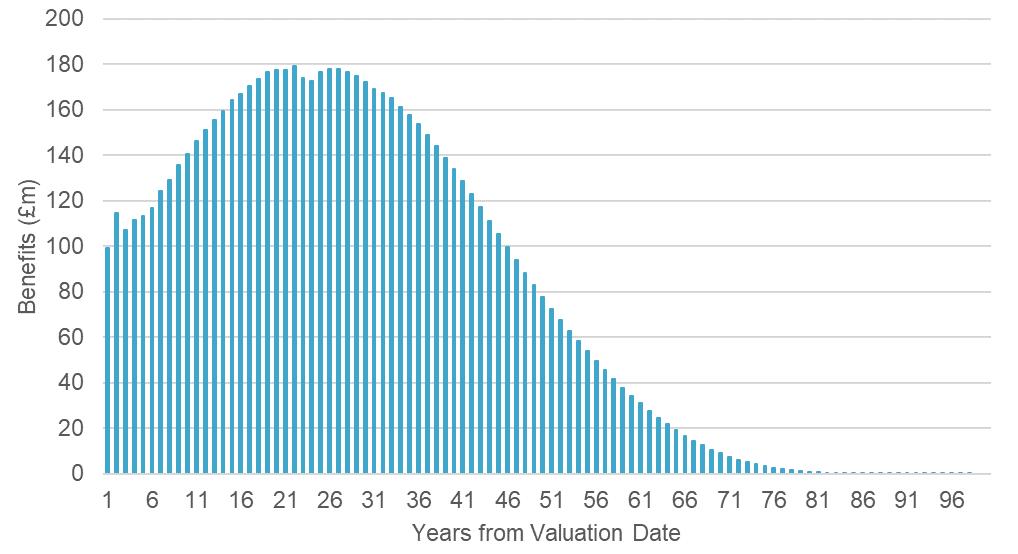
The liabilities are the value of all future payments to members based on all benefits earned up to the valuation date, expressed in today’s money.
Chart 1 shows the projected payments for all members in the Fund at the valuation date. The projections are based on the membership data provided for the valuation (Appendix 1), the assumptions (Appendix 2) and our understanding of the LGPS benefit structure as at 31 March 2022 (details at www.lgpsregs.org).
To express the future payments in today’s money, the projections are discounted with an assumed future investment return on the Fund’s assets (the discount rate).
7 VALUATION RESULTS FINAL COMMENTS APPENDICES RATES & ADJUSTMENTS CERTIFICATE SECTION 13 DASHBOARD SENSITIVITY & RISK ANALYSIS APPROACH TO VALUATION EXECUTIVE SUMMARY
Chart 1: projected benefit payments for all service earned up to 31 March 2022
Valuation results
Employer contribution rates
The primary objective of the Fund is to set employer contribution rates that will adequately cover the cost of benefits which will accrue in the future and any costs related to benefits already earned. A secondary objective is to ensure the rates are as stable as possible. The risk-based approach detailed earlier is used to meet both these objectives.
The employer contribution rate is made up of two components.
1. A primary rate: the level sufficient to cover all new benefits.
2. A secondary rate: the costs associated with sufficiently funding benefits accrued up to the valuation date.
Each employer has a contribution rate which is appropriate to their circumstances and these can be found in the Rates & Adjustments Certificate. Broadly speaking:
• Primary rates have increased since the last valuation due to rising inflation.
• Secondary rates have decreased due to strong investment performance since the previous valuation.
However all employers will be different and the contribution rate will reflect the membership and experiences of each employer.
Table 3 shows the total of all employer contribution rates to be paid into the Fund over the period 1 April 2023 to 31 March 2026.
Table 3: Whole-fund contribution rate, compared with the previous valuation
The primary rate includes an allowance of 0.7% of pensionable pay for the Fund’s expenses.
Employees pay a contribution to the Fund in addition to these rates. These rates are set by the LGPS Regulations. The average employee contribution rate at 31 March 2022 is 6.3% of pay (6.1% at 31 March 2019).
9 VALUATION RESULTS FINAL COMMENTS APPENDICES RATES & ADJUSTMENTS CERTIFICATE SECTION 13 DASHBOARD SENSITIVITY & RISK ANALYSIS APPROACH TO VALUATION EXECUTIVE SUMMARY
This valuation 31 March 2022 Last valuation 31 March 2019 Secondary Rate 2023/2024 £5,147,000 2020/2021 £10,973,000 2024/2025 £3,818,000 2021/2022 £11,079,000 2025/2026 £5,851,000 2022/2023 £10,844,000 Primary Rate 22.2% of pay
of pay
22.0%
Funding level
The funding level is the ratio of assets to liabilities. The market value of the assets at the valuation date are known. The value of the liabilities is uncertain given that the level of future investment returns are unknown.
Therefore, the liabilities and funding level have been calculated across a range of different investment returns (the discount rate).
To help better understand funding risk, the likelihood of the Fund’s investment strategy (detailed in Appendix 1) achieving certain levels of return has also been calculated.
Chart 2 shows how the funding level varies with future investment return assumptions at 31 March 2022 (blue line). The green line shows the same analysis at 31 March 2019.

• The funding position at 2022 is stronger than 2019.
• The funding level is 100% if future investment returns are c.4.0% pa. The likelihood of the Fund’s assets yielding at least this return is around 77%.
• The comparator at 2019 was a return of 4.0% pa which had a likelihood of 71%.
• There is a 50% likelihood of an investment return of 6.1% pa. So the best-estimate funding level is 147% at 31 March 2022 (130% at 2019).
Figures on each line show the likelihood of the Fund’s assets exceeding that level of return over the next 20 years
10 VALUATION RESULTS FINAL COMMENTS APPENDICES RATES & ADJUSTMENTS CERTIFICATE SECTION 13 DASHBOARD SENSITIVITY & RISK ANALYSIS APPROACH TO VALUATION EXECUTIVE SUMMARY
Chart 2: funding level across a range of future investment returns
Reported funding level as at 31 March 2022
Whilst the chart on the previous page provides a better understanding of the past service funding position, there is still a requirement to report a single funding level at 31 March 2022.
To report a single funding level and funding surplus/deficit for the 2022 valuation, a discount rate of 4.1% pa has been used. There is a 75% likelihood associated with a future investment return of 4.1% pa.
Table 4 details the liabilities, split by member status and the market value of assets at the valuation date. The results at the 2019 formal valuation are shown for comparison.
The funding level and surplus/deficit figures provide a high-level snapshot of the funding position of the Fund as at 31 March 2022, however there are limitations:
• The liabilities are calculated using a single set of assumptions about the future and so are very sensitive to the choice of assumptions.
• The market value of assets held by the Fund will change on a daily basis.
The future progression of the funding position is uncertain. If the financial and demographic assumptions made at this valuation actually occur, employers pay contributions in line with the R&A certificate and there are no other changes in the financial or demographic environment, we project that the funding level at the next valuation (31 March 2025) will be approximately 102%.
Important: the reported funding level does not directly drive the contribution rates for employers. The contribution rates consider how assets and liabilities will evolve over time in different economic scenarios and also reflect each employer’s funding profile and covenant.
11 VALUATION RESULTS FINAL COMMENTS APPENDICES RATES & ADJUSTMENTS CERTIFICATE SECTION 13 DASHBOARD SENSITIVITY & RISK ANALYSIS APPROACH TO VALUATION EXECUTIVE SUMMARY
Valuation Date 31 March 2022 31 March 2019 Past Service Liabilities (£m) (£m) Employees 953 777 Deferred Pensioners 805 688 Pensioners 1,391 1,215 Total Liabilities 3,149 2,680 Assets 3,230 2,589 Surplus/(Deficit) 81 (92) Funding Level 103% 97%
Table 4: single reported funding level
Changes since the last valuation
The most significant external event to occur since the last valuation has been the Covid-19 pandemic. The experience analysis below shows that the impact on the funding position has been small. This is likely due to the age profile of the excess deaths and the level of pension.
Other significant factors occurring which affect the funding strategy of the Fund have been the better than expected investment returns. This has had a material positive impact on the funding position and employers’ secondary contribution rates.
12 VALUATION RESULTS FINAL COMMENTS APPENDICES RATES & ADJUSTMENTS CERTIFICATE SECTION 13 DASHBOARD SENSITIVITY & RISK ANALYSIS APPROACH TO VALUATION EXECUTIVE SUMMARY
Membership Expected Actual Difference Impact on funding position 3 year period 11.8% 21.5% 9.7% +£262m Annual 3.8% pa 6.7% pa 2.9% pa Expected Actual Difference Impact on funding position Early leavers 9,730 9,422 -308 <£1m Ill-health retirements 114 191 77 -£4m Salary increases 3.4% pa 4.1% pa 0.7% pa -£9m Benefit increases 2.3% pa 1.8% pa -0.6% pa +£41m Pension ceasing £6.1m £6.1m £0.0m +£1m Events
between 2019 and 2022
Table 5: analysis of financial experience between 2019 and 2022 valuations
Financial
Table 6: analysis of membership experience between 2019 and 2022 valuations
Changes since the last valuation
Future outlook
Expectations about the future, which inform the assumptions used to value the liabilities, have changed since the last valuation. The most significant changes are:
• Future inflation: this is expected to be on average higher than at 2019 due to the current level of high inflation.
• Investment returns: due to changes in financial markets, future investment returns are now expected to be higher than at the last valuation.
Table 7: summary of change in future outlook
Factor What does it affect?
Future investment returns
The rate at which future benefit payments are discounted back, ie the discount rate assumption
What's changed?
Future investment returns slightly higher at 2022 than at 2019. The assumed return is now 4.1% pa vs. 3.8% pa at 2019.
Impact on liabilities
Decrease of £177m
Inflation
The rate at which pensions in payment and deferment and CARE pots increase
Significant increase in short-term future inflation expectations.
Increase of £227m
Salary increases
The rate at which future salaries increase. This affects benefits that are still linked to final salary, ie accrued before 1 April 2014
No material change since last valuation given competing factors e.g. tighter budgetary conditions vs. strong job market and pressure from National Living Wage increases.
Increase of £2m
Current life expectancy
How long we expect people to live for based on today’s current observed mortality rates.
Slight reduction in life expectancy based on current observed data (not allowing for Covid-related excess deaths)
Decrease of £5m
Future improvements in life expectancy
How we expect life expectancies to change (increase) in the future.
Uncertainty about effectiveness of mitigations against life expectancy increases in the LGPS i.e. State Pension Age increases and Cost Cap. Need to better reflect wider pension and insurance industry long-term expectations.
Increase of £20m
13 VALUATION RESULTS FINAL COMMENTS APPENDICES RATES & ADJUSTMENTS CERTIFICATE SECTION 13 DASHBOARD SENSITIVITY & RISK ANALYSIS APPROACH TO VALUATION EXECUTIVE SUMMARY
Reconciling the overall change in funding position
The tables below provide insight into the funding position change between 31 March 2019 and 31 March 2022. Firstly, the changes we expect to happen (Table 8), which relate mostly to items on the asset side. Then the impact of actual experience (Table 9), which mainly affects the liabilities.
Impact of actual events
Numbers may not sum due to rounding
14 VALUATION RESULTS FINAL COMMENTS APPENDICES RATES & ADJUSTMENTS CERTIFICATE SECTION 13 DASHBOARD SENSITIVITY & RISK ANALYSIS APPROACH TO VALUATION EXECUTIVE SUMMARY
Table 8: expected development of funding position between 2019 and 2022 valuations
Expected development Change in the surplus/deficit position Surplus / Deficit £m Last valuation at 31 March 2019 (92) Cashflows Employer contributions paid in 285 Employee contributions paid in 72 Other cashflows (e.g. Fund expenses) (6) Expected changes Expected investment returns 322 Interest on benefits already accrued (320) Accrual of new benefits (356) Expected position at 31 March 2022 (95)
in the surplus/deficit position Surplus / Deficit £m Expected position at 31 March 2022 (95) Events between 2019 and 2022 Salary increases greater than expected (9) Benefit increases lower than expected 41 Early retirement strain (and contributions) (2) Ill health retirement strain (4) Early leavers less than expected 0 Commutation less than expected (10) Pensions ceasing more than expected 1 McCloud remedy (3) Other membership experience (14) Higher than expected investment returns 262 Changes in future expectations Investment returns 177 Inflation (227) Salary increases (2) Longevity (15) Other demographic assumptions (19) Actual position at 31 March 2022 81
Table 9: impact of actual events on the funding position at 31 March 2022
Change
Sensitivity & risk analysis
Sensitivity and risk analysis: assumptions
There is risk and uncertainty inherent with funding benefit payments that will be paid out many years in the future. The Fund is aware of these and has in place a risk register which is regularly reviewed. Additionally, as part of the valuation, the Fund reviews sources of risk that may impact its funding position and the contribution rates payable by employers.
This section discusses some of the most significant sources of funding risk (assumptions, regulatory, administration and governance and climate change). Further information of the Fund’s approach to funding risk management, including monitoring, mitigation and management, is set out in the Funding Strategy Statement.
The valuation results depend on the actuarial assumptions made about the future. By their nature, these assumptions are uncertain which means its important to understand their sensitivity and risk levels.
Contribution rates
The risk-based approach to setting employer contribution rates mitigates the limitation of relying on one set of assumptions. Therefore, there is no need to carry out additional analysis of the sensitivity of contribution rates to changes in financial assumptions. The contribution rates are sensitive to changes in demographic assumptions. The results in this section in relation to the funding position can be broadly applied to the contribution rates.
Funding level
Financial assumptions
On page 10, we have already set out how the results vary with the assumed future investment return. The table below considers inflation.
Demographic assumptions
The main area of demographic risk is if people live longer than expected. The table below shows the impact of longer term longevity rates improving at a faster rate (1.75% pa vs 1.5% pa used in the results)
16 VALUATION RESULTS FINAL COMMENTS APPENDICES RATES & ADJUSTMENTS CERTIFICATE SECTION 13 DASHBOARD SENSITIVITY & RISK ANALYSIS APPROACH TO VALUATION EXECUTIVE SUMMARY
CPI Assumption Surplus/ (Deficit) Funding Level % pa (£m) % 2.5% 183 106% 2.7% 81 103% 2.9% (25) 99% Long term rate of improvement Surplus/ (Deficit) Funding Level % pa (£m) % 1.5% 81 103% 1.75% 47 101%
Table 10: sensitivity of funding position to inflation assumption
Table 11: sensitivity of funding position to longevity assumption
Sensitivity and risk analysis: other risks
Regulatory, Administration and Governance risks
Potential risks in this area include change in central government legislation which changes the future cost of the LGPS and failures in administration processes leading to incorrect data and inaccuracies in actuarial calculations. At this valuation, specific risks include:
• McCloud: the remedy to resolve the McCloud case is yet to be formalised in regulations. However, an allowance has been included for this expected benefit change at the 2022 valuation as directed by the Department of Levelling Up, Housing and Communities in their letter dated March 20221 .
• Goodwin: the remedy to this issue is still uncertain, it is difficult to identify who it would apply to and its impact is estimated to be very small for a LGPS fund (0.1-0.2% of liabilities). Therefore, no allowance has been made for this case at the 2022 valuation.
• Cost Cap: a legal challenge is ongoing in relation to the 2016 cost cap valuation and no information is known about the outcome of the 2020 cost cap valuation. At this valuation, no allowance has been made for any changes to the benefit structure that may occur as a result of a cost cap valuation.
• GMP indexation: it is assumed that all increases on GMPs for members reaching State PensionAge after 6 April 2016 will be paid for by LGPS employers. This is the same approach that was taken for the 2019 valuation.
Post valuation events
Since 31 March 2022, there has been significant volatility in the financial markets, short-term inflation expectations and rises in interest rates by central banks. These events affect the value of the Fund’s assets and liabilities.
• The Fund’s investment return between 31 March 2022 and 28 February 2023 is estimated to be somewhere between -5% and -10%.
• Liability valuations are likely to be lower at 28 February 2023 than at 31 March 2022 due to rises in expected future investment returns more than offsetting the higher than expected (10.1%) pension increase at April 2023.
As an open scheme, with a strong covenant, the Fund takes a long-term view when considering the funding impact of such events. For employers who have a very short time horizon, recent volatility may be more immediately impactful, and the Fund has engaged with these employers as appropriate.
No explicit allowance has been made for this volatility in the valuation results or contribution rates detailed in the Rates & Adjustments Certificate. The Fund will continue to monitor changes in the financial and demographic environment as part of its ongoing risk management approach.
17 VALUATION RESULTS FINAL COMMENTS APPENDICES RATES & ADJUSTMENTS CERTIFICATE SECTION 13 DASHBOARD SENSITIVITY & RISK ANALYSIS APPROACH TO VALUATION EXECUTIVE SUMMARY
1 www.lgpslibrary.org/assets/bulletins/2022/222AppA.pdf
Sensitivity and risk analysis: climate change
Background
Climate change is a major source of uncertainty which could affect future investment returns, inflation and life expectancies. Therefore, the Fund has explicitly explored the resilience of its funding and investment strategy to future potential climate change outcomes.
It is impossible to confidently quantify the effect of climate risk given the significant uncertainty over the impact of different possible climate outcomes. Instead, three different climate change scenarios have been considered as a stress-test (instead of trying to predict how climate change affects the funding level in the future).
All the scenarios assume that there will be a period of disruption linked either to the response to climate risk (transition risks) or the effect of it (physical risks). This disruption will lead to high volatility in financial markets, and the later the disruption, the more pronounced it will be.
Further detail on the scenarios is shown on the next page and in our guide 10 of Hymans Robertson’s LGPS 2022 valuation toolkit1
Outcome of analysis
The Fund has set its funding and investment strategy using asset-liability modelling and considering two main risk metrics:
• Likelihood of success – the chance of being fully funded in 20 years’ time
• Downside risk – the average worst 5% of funding levels in 20 years’ time
When exploring the potential impact of climate change, the Fund has compared how these risk metrics change under each climate change scenario (against the ‘Core’ model used when setting the funding and investment strategy). The stress test results for the Fund are shown in Table 12 below.
The results are worse in the climate scenarios. This is to be expected given that they are purposefully stress-tests and all the scenarios are bad outcomes. The stress tests illustrated that across a broad range of scenarios the funding strategy was shown to be robust. This analysis does not represent the worst impacts that the Fund may suffer as a result of climate risk. The Fund will continue to monitor this risk as more information emerges and climate change modelling techniques evolve.
18 VALUATION RESULTS FINAL COMMENTS APPENDICES RATES & ADJUSTMENTS CERTIFICATE SECTION 13 DASHBOARD SENSITIVITY & RISK ANALYSIS APPROACH TO VALUATION EXECUTIVE SUMMARY
Scenario Likelihood of success Downside risk Core 80% 50% Green Revolution 77% 45% Delayed Transition 76% 50% Head in the Sand 77% 52%
Table 12: sensitivity of funding position to climate change
1 www.hymans.co.uk/media/uploads/LGPS_2022_Valuation_Toolkit.pdf
Final comments
Final comments
The Fund’s valuation operates within a broader framework, and this document should be considered alongside the following:
• The Funding Strategy Statement, which in particular highlights how different types of employer in different circumstances have their contributions calculated
• The Investment Strategy Statement, which sets out the investment strategy for the Fund
• The general governance of the Fund, such as meetings of the Pensions Committee and Local Pensions Board, decisions delegated to officers, the Fund’s business plan, etc
• The Fund’s risk register New employers joining the Fund
Any new employers or admission bodies joining the Fund should be referred to the Fund Actuary to assess the required level of contribution. Depending on the number of transferring members the ceding employer’s rate may also need to be reviewed.
Cessations and bulk transfers
Any employer who ceases to participate in the Fund should be referred to the Fund Actuary in accordance with Regulation 64 of the LGPS regulations.
Any bulk movement of scheme members:
• involving 10 or more scheme members being transferred from or to another LGPS fund
• involving 2 or more scheme members being transferred from or to a nonLGPS pension arrangement
should be referred to the Fund Actuary to consider the impact on the Fund.
Valuation frequency
Under the LGPS regulations, the next formal valuation of the Fund is due to be carried out as at 31 March 2025 where contribution rates payable from 1 April 2026 will be set.
Barry Dodds FFA
31 March 2023
For and on behalf of Hymans Robertson LLP
 Catherine McFadyen FFA

20 VALUATION RESULTS FINAL COMMENTS APPENDICES RATES & ADJUSTMENTS CERTIFICATE SECTION 13 DASHBOARD SENSITIVITY & RISK ANALYSIS APPROACH TO VALUATION EXECUTIVE SUMMARY
Appendices
APPENDIX 1
Data
Membership data
A summary of the membership data provided by the Fund for the 2022 valuation is set out in Table 13. The corresponding membership data from the previous valuation is also shown for reference.
The results of the valuation are dependent on the quality of the data used. We have carried out a series of validation checks on the data supplied to us by the AdministeringAuthority to ensure that it is fit for purpose.
Asset data
To check the membership data and derive employer asset values, we have used asset and accounting data and employer level cashflow data provided by the Fund.
22 VALUATION RESULTS FINAL COMMENTS APPENDICES RATES & ADJUSTMENTS CERTIFICATE SECTION 13 DASHBOARD SENSITIVITY & RISK ANALYSIS
APPROACH TO VALUATION EXECUTIVE SUMMARY
Whole Fund Membership Data This Valuation 31 March 2022 Last Valuation 31 March 2019 Employee members Number 23,219 21,912 Total actual pay (£000) 384,253 330,746 Total accrued pension (£000) 57,404 47,772 Average age (liability weighted) 52.1 51.8 Future working lifetime (years) 5.6 6.5 Deferred pensioners (including undecideds) Number 40,620 37,689 Total accrued pension (£000) 44,848 38,649 Average age (liability weighted) 52.4 51.6 Pensioners and dependants Number 20,363 17,288 Total pensions in payment (£000) 86,930 75,500 Average age (liability weighted) 69.2 68.7
Table 13: Whole fund membership data as at 31 March 2022 and 31 March 2019
APPENDIX 1
APPROACH TO VALUATION EXECUTIVE SUMMARY
DataInvestment strategy
A summary of the investment strategy allocation used for the calculation of employer contribution rates and to derive the future assumed investment return is set out in Table 14.
This information is as advised by the Fund’s investment consultant.
23 VALUATION RESULTS FINAL COMMENTS APPENDICES RATES & ADJUSTMENTS CERTIFICATE SECTION 13 DASHBOARD SENSITIVITY & RISK ANALYSIS
Table 14: Investment strategy used for the 2022 valuation Asset class Allocation Global equities 22.0% Private equity 7.5% Emerging markets (equity and debt) 10.0% Multi Asset Credit 5.0% Private debt 7.5% Core Infrastructure 8.0% Renewable Infrastructure 5.0% Secured income 8.0% Affordable housing 5.0% Core property 15.0% Index linked gilts (>5 years) 7.0% Total 100.0%
APPENDIX 2
Assumptions
To set and agree assumptions for the valuation, the Fund carried out in-depth analysis and review in March 2022 with the methodology agreed by the Pensions Committee on 5 April 2022.
Financial assumptions
Setting employer contribution rates
An asset-liability model is used to set employer contributions at the 2022 valuation. This model relies on Hymans Robertson’s proprietary economic model, the Economic Scenario Service (ESS). The ESS reflects the uncertainty associated with future levels of inflation and asset returns and the interactions and correlations between different asset classes and wider economic variables. In the short term (first few years), the models are fitted with current financial market expectations. Over the longer term, models are built around views of fundamental economic parameters, for example equity risk premium, credit spreads and long term inflation. The table below shows the calibration of the ESS at 31 March 2022. Further information on the assumptions used for contribution rate setting is included in the Funding Strategy Statement.
Table
24 VALUATION RESULTS FINAL COMMENTS APPENDICES RATES & ADJUSTMENTS CERTIFICATE SECTION 13 DASHBOARD SENSITIVITY & RISK ANALYSIS APPROACH TO VALUATION EXECUTIVE SUMMARY
Annualised total returns Cash Index Linked Gilts (medium) Developed World ex UK Equity Private Equity Property Emerging Market Debt (hard currency) Emerging Market Debt (local currency) Emerging Markets Equity Unlisted Infrastruct ure Equity Developed World Equity Multi Asset Credit (sub inv grade) Senior Loans (sub inv grade) Inflation (RPI) 17 year real yield (RPI) Inflation (CPI) 17 year real yield (CPI) 17 year yield 10 years 16th %'ile 0.8% -1.9% -0.7% -1.2% -0.6% -0.1% -1.5% -2.5% 0.7% -0.6% 1.7% 1.1% 2.4% -1.7% 1.6% -1.7% 1.1% 50th %'ile 1.8% 0.2% 5.6% 9.4% 4.4% 2.1% 3.4% 5.8% 5.9% 5.6% 3.5% 3.5% 4.1% -0.5% 3.3% -0.5% 2.5% 84th %'ile 2.9% 2.4% 11.7% 20.1% 9.5% 4.1% 8.6% 14.4% 11.2% 11.6% 5.2% 5.6% 5.7% 0.7% 4.9% 0.7% 4.3% 20 years 16th %'ile 1.0% -1.5% 1.5% 2.4% 1.4% 1.4% 0.5% 0.1% 2.6% 1.6% 2.8% 2.6% 1.6% -0.7% 1.2% -0.7% 1.3% 50th %'ile 2.4% 0.1% 6.1% 10.0% 5.0% 2.9% 4.2% 6.3% 6.5% 6.1% 4.4% 4.3% 3.1% 1.0% 2.7% 1.1% 3.2% 84th %'ile 4.0% 1.9% 10.8% 17.6% 8.9% 4.2% 8.1% 12.8% 10.6% 10.8% 6.0% 6.0% 4.7% 2.7% 4.3% 2.7% 5.7% 40 years 16th %'ile 1.2% -0.3% 3.1% 4.7% 2.6% 2.5% 1.9% 2.1% 3.9% 3.2% 3.6% 3.5% 1.1% -0.6% 0.9% -0.6% 1.1% 50th %'ile 2.9% 1.2% 6.5% 10.3% 5.5% 3.8% 5.0% 6.8% 7.0% 6.6% 5.3% 5.2% 2.4% 1.3% 2.2% 1.3% 3.3% 84th %'ile 4.9% 3.1% 10.2% 16.1% 8.8% 5.3% 8.2% 11.7% 10.3% 10.2% 7.1% 7.0% 3.9% 3.2% 3.7% 3.2% 6.1% Volatility (Disp) (5 yr) 2% 7% 19% 30% 15% 7% 15% 26% 15% 18% 6% 7% 3% 3%
15: ESS individual asset class return distributions at 31 March 2022
Assumptions
Financial assumptions
Calculating the funding level
The table below summarises the assumptions used to calculate the funding level at 31 March 2022, along with a comparison at the last valuation.
Table 16: Summary of assumptions used for measuring the funding level, compared to last valuation on 31 March 2019
Allowing for the McCloud remedy
Allowance has been included for this expected benefit change at the 2022 valuation as directed by the Department of Levelling Up, Housing and Communities in their letter dated March 20221. Further technical detail about this assumption is set out in guide 13 of Hymans Robertson’s LGPS 2022 valuation toolkit2
25 VALUATION RESULTS FINAL COMMENTS APPENDICES RATES & ADJUSTMENTS CERTIFICATE SECTION 13 DASHBOARD SENSITIVITY & RISK ANALYSIS APPROACH TO VALUATION EXECUTIVE SUMMARY
Discount rate 4.1% pa To place
value on
Fund’s assets are estimated to
75%
of
discount rate. 3.8% pa Benefit increases/CARE revaluation 2.7% pa To determine the size of future benefit payments. 2.3% pa Salary increases 3.2% pa To determine the size of future final-salary
benefit payments. 2.7% pa APPENDIX 2
Assumption 31 March 2022 Required for 31 March 2019
a present
all the benefits promised to scheme members at the valuation date. The
have a
likelihood
returning above the
linked
1 www.lgpslibrary.org/assets/bulletins/2022/222AppA.pdf 2 www.hymans.co.uk/media/uploads/LGPS_2022_Valuation_Toolkit.pdf
APPROACH TO VALUATION EXECUTIVE SUMMARY
APPENDIX
Assumptions
Demographic assumptions
The same demographic assumptions are used in setting contribution rates and assessing the current funding level.
Longevity
Table 17: Summary of longevity assumptions
Baseline assumption
VitaCurves based on memberlevel lifestyle factors
VitaCurves based on memberlevel lifestyle factors
Other demographic assumptions
Table 18: Summary of other demographic assumptions
Death in service
Retirements in ill health
Withdrawals
Promotional salary increases
Commutation
See sample rates in Tables 19 & 20
See sample rates in Tables 19 & 20
See sample rates in Tables 19 & 20
See sample rates in Tables 19 & 20
50% of future retirements elect to exchange pension for additional tax free cash up to HMRC limits
Future improvements
CMI 2021 model
Initial addition = 0.25% (both Female and Male)
Smoothing factor = 7.0
1.5% pa long-term rate of improvement
CMI 2018 model
Initial addition = 0.25% (Female), 0.5% (Male)
Smoothing factor = 7.0
1.25% pa long-term rate of improvement
Further information on these assumptions can be provided upon request. Sample rates are included on the next page.
50:50 option
Retirement age
1.0% of members (uniformly distributed across the age, service and salary range) will choose the 50:50 option
The earliest age at which a member can retire with their benefits unreduced
Family details
A varying proportion of members are assumed to have a dependant at retirement or on earlier death. For example, at age 60 this is assumed to be 90% for males and 85% for females. The dependant of a male member is assumed to be 3 years younger than him and the dependent of a female member is assumed to be 3 years older than her.
26 VALUATION RESULTS FINAL COMMENTS APPENDICES RATES & ADJUSTMENTS CERTIFICATE SECTION 13 DASHBOARD SENSITIVITY & RISK ANALYSIS
2
This valuation 31 March 2022 Last valuation 31 March 2019
Assumptions
Sample rates for demographic assumptions
Table 19: Sample rates of male demographic assumptions
Table 20: Sample rates of female demographic assumptions
Figures are incidence rates per 1,000 members except salary scale. FT and PT denoted full-time and part-time members respectively.
27 VALUATION RESULTS FINAL COMMENTS APPENDICES RATES & ADJUSTMENTS CERTIFICATE SECTION 13 DASHBOARD SENSITIVITY
& RISK ANALYSIS APPROACH TO VALUATION EXECUTIVE SUMMARY
2 Males
Age Salary Scale Death Before Retirement Withdrawals Ill Health Tier 1 Ill Health Tier 2
APPENDIX
Females
FT & PT FT PT FT PT FT PT 20 105 0.17 485.17 813.01 0.00 0.00 0.00 0.00 25 117 0.17 320.47 537.03 0.00 0.00 0.00 0.00 30 131 0.20 227.38 380.97 0.00 0.00 0.00 0.00 35 144 0.24 177.66 297.63 0.10 0.07 0.02 0.01 40 150 0.41 143.04 239.55 0.16 0.12 0.03 0.02 45 157 0.68 134.35 224.96 0.35 0.27 0.07 0.05 50 162 1.09 110.75 185.23 0.90 0.68 0.23 0.17 55 162 1.70 87.21 145.94 3.54 2.65 0.51 0.38 60 162 3.06 77.73 130.02 6.23 4.67 0.44 0.33 65 162 5.10 0.00 0.00 11.83 8.87 0.00 0.00 Age Salary Scale Death Before Retirement Withdrawals Ill Health Tier 1 Ill Health Tier 2 FT & PT FT PT FT PT FT PT 20 105 0.10 458.15 467.37 0.00 0.00 0.00 0.00 25 117 0.10 308.28 314.44 0.10 0.07 0.02 0.01 30 131 0.14 258.41 263.54 0.13 0.10 0.03 0.02 35 144 0.24 223.04 227.38 0.26 0.19 0.05 0.04 40 150 0.38 185.63 189.18 0.39 0.29 0.08 0.06 45 157 0.62 173.23 176.51 0.52 0.39 0.10 0.08 50 162 0.90 146.05 148.65 0.97 0.73 0.24 0.18 55 162 1.19 108.97 111.03 3.59 2.69 0.52 0.39 60 162 1.52 87.82 89.37 5.71 4.28 0.54 0.40 65 162 1.95 0.00 0.00 10.26 7.69 0.00 0.00
APPENDIX 3
Reliances and limitations
We have been commissioned by Wiltshire Council (“the Administering Authority”) to carry out a full actuarial valuation of the Wiltshire Pension Fund (“the Fund”) as at 31 March 2022 as required under Regulation 62 of the Local Government Pension Scheme Regulations 2013 (“the Regulations”).
This report is addressed to the Administering Authority. It has been prepared by us as actuaries to the Fund and is solely for the purpose of summarising the main outcomes of the 2022 actuarial valuation. It has not been prepared for any other third party or for any other purpose. We make no representation or warranties to any third party as to the accuracy or completeness of this report, no reliance should be placed on this report by any third party and we accept no responsibility or liability to any third party in respect of it.
Hymans Robertson LLP is the owner of all intellectual property rights in this report. All such rights are reserved.
This summary report is the culmination of other communications in relation to the valuation, in particular:
• Our 2022 valuation toolkit which sets out the methodology used when reviewing funding plans
• Our paper to the Fund’s officers dated 23 June 2022 which discusses the funding strategy for the Fund’s councils
• Our paper to the Fund’s Pension Committee dated 25 March 2022 which discusses the valuation assumptions
• Our initial results report dated 10 October 2022 which outlines the whole fund results and inter-valuation experience
• Our data report dated March 2023 which summarises the data used for the valuation, the approach to ensuring it is fit for purpose and any adjustments made to it during the course of the valuation
• The Funding Strategy Statement which details the approach taken to adequately fund the current and future benefits due to members
The totality of our advice complies with the Regulations as they relate to actuarial valuations.
The following Technical Actuarial Standards apply to this advice, and have been complied with where material and to a proportionate degree. They are:
• TAS100 – Principles for technical actuarial work
• TAS300 – Pensions
Hymans Robertson LLP is a limited liability partnership registered in England and Wales with registered number OC310282.
A list of members of Hymans Robertson LLP is available for inspection at One London Wall, London EC2Y 5EA, the firm’s registered office. Authorised and regulated by the Financial Conduct Authority and licensed by the Institute and Faculty of Actuaries for a range of investment business activities. Hymans Robertson is a registered trademark of Hymans Robertson LLP.
28 VALUATION RESULTS FINAL COMMENTS APPENDICES RATES & ADJUSTMENTS CERTIFICATE SECTION 13 DASHBOARD SENSITIVITY & RISK ANALYSIS APPROACH TO VALUATION EXECUTIVE SUMMARY
© Hymans Robertson LLP March 2023
APPENDIX 4
Glossary
Term Explanation
50:50 option An option for LGPS members to pay half contributions and earn half the retirement benefit (pre-retirement protection benefits are unreduced).
Asset-liability modelling
An approach to modelling and understanding risk for a pension fund. The assets and liabilities are projected forward into the future under many different future scenarios of inflation, investment returns and interest rates. The future scenarios are then analysed to understand the risk associated with a particular combination of contribution rates and investment strategy. Different combinations of contribution rates and/or investment strategies may be tested.
Baseline longevity
The rates of death (by age and sex) in a given group of people based on current observed data.
Club Vita A firm of longevity experts we partner with for longevity analysis. They combine data from thousands of pension schemes and use it to create detailed baseline longevity assumptions at member-level, as well as insight on general longevity trends and future improvements.
Commutation
The option for members to exchange part of their annual pension for a one-off lump sum at retirement. In the LGPS, every £1 of pension exchanged gives the member £12 of lump sum. The amounts that members commute is heavily influenced by tax rules which set an upper limit on how much lump sum can be taken tax-free.
CPI inflation
The annual rate of change of the Consumer Prices Index (CPI). The CPI is the UK government’s preferred measure of inflation and is the measure used to increase LGPS (and all other public sector pension scheme) benefits each year.
Deferred pensioners
Demographic assumptions
A former employee who has left employment (or opted out of the pension fund) but is not yet in receipt of their benefits from the fund.
Assumptions concerned with member and employer choices rather than macroeconomic or financial factors. For example, retirement age or promotional salary scales. Demographic assumptions typically determine the timing of benefit payments.
29 VALUATION RESULTS FINAL COMMENTS APPENDICES RATES & ADJUSTMENTS CERTIFICATE SECTION 13 DASHBOARD SENSITIVITY & RISK ANALYSIS
EXECUTIVE
APPROACH TO VALUATION
SUMMARY
Glossary
Term Explanation
Discount rate
A number used to place a single value on a stream of future payments, allowing for expected future investment returns.
Employee members
Members who are currently employed by employers who participate in the fund and paying contributions into the fund.
ESS Economic Scenario Service - Hymans Robertson’s proprietary economic scenario generator used to create thousands of simulations of future inflation, asset class returns and interest rates.
Funding position
The extent to which the assets held by the fund at 31 March 2022 cover the accrued benefits ie the liabilities. The two measures of the funding position are:
• the funding level - the ratio of assets to liabilities; and
• the funding surplus/deficit - the difference between the asset and liabilities values.
Inflation Prices tend to increase over time, which is called inflation. Inflation is measured in different ways, using a different ‘basket’ of goods and mathematical formulas.
Liabilities
An employer’s liability value is the single value at a given point in time of all the benefit payments expected to be made in future to all members. Benefit payments are projected using demographic and financial assumptions and the liability is calculated using a discount rate.
Longevity improvements
Pensioners
An assumption about how rates of death will change in future. Typically we assume that death rates will fall and life expectancies will improve over time, continuing the long-running trend.
A former employee who is in receipt of their benefits from the fund. This category includes eligible dependants of the former employee.
30 VALUATION RESULTS FINAL COMMENTS APPENDICES RATES & ADJUSTMENTS CERTIFICATE SECTION 13 DASHBOARD SENSITIVITY & RISK ANALYSIS
TO
EXECUTIVE
APPROACH
VALUATION
SUMMARY
4
APPENDIX
APPENDIX 4
Glossary
Term Explanation
Primary rate
The estimated cost of future benefits, expressed in percentage of pay terms. The primary rate will include an allowance to cover the fund’s expenses.
Prudence
To be prudent means to err on the side of caution in the overall set of assumptions. We build prudence into the choice of discount rate by choosing an assumption with a prudence Level of more than 50%. All other assumptions aim to be best estimate.
Prudence
Level
Secondary rate
A percentage indicating the likelihood that a discount rate assumption will be achieved in practice, based on the ESS model. The higher the prudence level, the more prudent the discount rate is.
An adjustment to the primary rate, generally to reflect costs associated with benefits that have already been earned up to the valuation date. This may be expressed as a percentage of pay and/or monetary amount.
Withdrawal Refers to members leaving the scheme before retirement. These members retain an entitlement to an LGPS pension when they retire, but are no longer earning new benefits.
31 VALUATION RESULTS FINAL COMMENTS APPENDICES RATES & ADJUSTMENTS CERTIFICATE SECTION 13 DASHBOARD SENSITIVITY & RISK ANALYSIS
EXECUTIVE
APPROACH TO VALUATION
SUMMARY
Rates &Adjustments certificate
Rates andAdjustments Certificate
In accordance with Regulation 62 of the LGPS regulations, we have assessed the contributions that should be paid into the Wiltshire Pension Fund (the Fund) by participating employers for the period 1 April 2023 to 31 March 2026 in order to maintain the solvency of the Fund.
The method and assumptions used to calculate the contributions set out in this Rates and Adjustments certificate are detailed in the Funding Strategy Statement dated 12 January 2023 and in Appendix 2 of the report on the actuarial valuation dated 31 March 2023. These assumptions underpin our estimate of the number of members who will become entitled to a payment of pensions under the provisions of the LGPS and the amount of liabilities arising in respect of such members.
The table below summarises the whole fund primary and secondary contribution rates for the period 1 April 2023 to 31 March 2026. The primary rate is the payroll weighted average of the underlying individual employer primary rates and the secondary rate is the total of the underlying individual employer secondary rates, calculated in accordance with the LGPS regulations and CIPFA guidance. The secondary rate has been shown both as a monetary amount and an equivalent percentage of the projected pensionable pay.
The required minimum contribution rates for each employer in the Fund are set out in the remained of this certificate.
33 VALUATION RESULTS FINAL COMMENTS APPENDICES RATES & ADJUSTMENTS CERTIFICATE SECTION 13 DASHBOARD SENSITIVITY & RISK ANALYSIS APPROACH TO VALUATION EXECUTIVE SUMMARY
This valuation 31 March 2022 Primary rate 22.2% Secondary rate Monetary amount Equivalent to % of payroll 2023/24 £5,147,000 1.3% 2024/25 £3,818,000 0.9% 2025/26 £5,851,000 1.3%
34
FINAL
RATES & ADJUSTMENTS CERTIFICATE SECTION 13 DASHBOARD SENSITIVITY & RISK
VALUATION RESULTS
COMMENTS APPENDICES
ANALYSIS
Employer code Employer name Primary rate (% of pay) Secondary rate (% of pay plus monetary amount) Total contributions (primary rate plus secondary rate) Notes 2023/24 2024/25 2025/26 2023/24 2024/25 2025/26 Wiltshire Council and associated Admission bodies Wiltshire Council Pool (non-schools) 20.7% 0.3% + £4,829,000 0.3% + £3,851,000 0.3% + £5,143,000 21.0% plus £4,829,000 21.0% plus £3,851,000 21.0% plus £5,143,000 1 Wiltshire Council Pool (schools) 20.7% 4.1% 3.1% 4.1% 24.8% 23.8% 24.8% 314 Oxford Health NHS 22.3% 2.4% 2.4% 2.4% 24.7% 24.7% 24.7% 320 Atkins Global 21.4% 4.6% 4.6% 4.6% 26.0% 26.0% 26.0% 339 Idverde 25.9% -10.0% -10.0% -10.0% 15.9% 15.9% 15.9% 357 Mears Care Ltd East 2 21.4% 21.4% 21.4% 21.4% 182 SWLEP 27.1% -6.1% -6.1% -6.1% 21.0% 21.0% 21.0% 351 Ringway 29.4% -8.7% -8.7% -8.7% 20.7% 20.7% 20.7% 410 The Hills 25.8% -5.1% -5.1% -5.1% 20.7% 20.7% 20.7% Somerset Care 22.4% -22.4% -22.4% -22.4% 0.0% 0.0% 0.0% Swindon Borough Council and associated Admission Bodies Swindon BC Pool (non-schools) 20.5% 0.9% + £1,944,000 0.9% + £1,263,000 0.9% + £2,071,000 21.4% plus £1,944,000 21.4% plus £1,263,000 21.4% plus £2,071,000 Swindon BC Pool (schools) 20.5% 4.0% 3.0% 4.0% 24.5% 23.5% 24.5% 78 Capita 28.1% 28.1% 28.1% 28.1% 98 Agincare 29.1% -9.7% -9.7% -9.7% 19.4% 19.4% 19.4% 372 Great Western Hospital 38.5% -5.8% -5.8% -5.8% 32.7% 32.7% 32.7% 159 Public Power Solutions 22.3% 22.3% 22.3% 22.3% Salisbury City Council 86 Salisbury City Council 20.7% -7.0% -7.0% -7.0% 13.7% 13.7% 13.7%
APPROACH TO VALUATION EXECUTIVE SUMMARY
APPROACH TO VALUATION EXECUTIVE SUMMARY
35
FINAL
RATES &
SECTION 13 DASHBOARD
VALUATION RESULTS
COMMENTS APPENDICES
ADJUSTMENTS CERTIFICATE
SENSITIVITY & RISK ANALYSIS
Employer code Employer name Primary rate (% of pay) Secondary rate (% of pay plus monetary amount) Total contributions (primary rate plus secondary rate) Notes 2023/24 2024/25 2025/26 2023/24 2024/25 2025/26 Other tax raising associated bodies 57 Dorset and Wiltshire Fire Authority 20.6% 0.9% 0.9% 0.9% 21.5% 21.5% 21.5% Wiltshire Police 20.5% -4.1% -4.1% -4.1% 16.4% 16.4% 16.4% Town and Parish Councils 7 Westbury Town Council 20.8% -1.1% -1.1% -1.1% 19.7% 19.7% 19.7% 8 Trowbridge Town Council 20.8% -1.1% -1.1% -1.1% 19.7% 19.7% 19.7% 9 Wilton Town Council 20.8% -1.1% -1.1% -1.1% 19.7% 19.7% 19.7% 10 Devizes Town Council 20.8% -1.1% -1.1% -1.1% 19.7% 19.7% 19.7% 11 Downton P C 20.8% -1.1% -1.1% -1.1% 19.7% 19.7% 19.7% 12 Marlborough Town Council 20.8% -1.1% -1.1% -1.1% 19.7% 19.7% 19.7% 13 Calne Town Council 20.8% -1.1% -1.1% -1.1% 19.7% 19.7% 19.7% 15 Amesbury Parish Council 20.8% -1.1% -1.1% -1.1% 19.7% 19.7% 19.7% 17 Durrington Town Council 20.8% -1.1% -1.1% -1.1% 19.7% 19.7% 19.7% 18 Stratton St Margaret Parish Council 20.8% -1.1% -1.1% -1.1% 19.7% 19.7% 19.7% 20 Royal Wootton Bassett Parish Council 20.8% -1.1% -1.1% -1.1% 19.7% 19.7% 19.7% 33 Melksham Town Council 20.8% -1.1% -1.1% -1.1% 19.7% 19.7% 19.7% 34 Malmesbury Town Council 20.8% -1.1% -1.1% -1.1% 19.7% 19.7% 19.7% 35 Chippenham Town Council 20.8% -1.1% -1.1% -1.1% 19.7% 19.7% 19.7% 37 Cricklade Town Council 20.8% -1.1% -1.1% -1.1% 19.7% 19.7% 19.7% 40 Highworth Town Council 20.8% -1.1% -1.1% -1.1% 19.7% 19.7% 19.7% 44 Haydon Wick Parish Council 20.8% -1.1% -1.1% -1.1% 19.7% 19.7% 19.7% 46 Purton Parish Council 20.8% -1.1% -1.1% -1.1% 19.7% 19.7% 19.7%
36
RATES &
SECTION 13 DASHBOARD
VALUATION RESULTS FINAL COMMENTS APPENDICES
ADJUSTMENTS CERTIFICATE
SENSITIVITY & RISK ANALYSIS
Employer code Employer name Primary rate (% of pay) Secondary rate (% of pay plus monetary amount) Total contributions (primary rate plus secondary rate) Notes 2023/24 2024/25 2025/26 2023/24 2024/25 2025/26 Town and Parish Councils (continued) 48 Corsham Town Council 20.8% -1.1% -1.1% -1.1% 19.7% 19.7% 19.7% 50 Warminster Town Council 20.8% -1.1% -1.1% -1.1% 19.7% 19.7% 19.7% 58 Mere Parish Council 20.8% -1.1% -1.1% -1.1% 19.7% 19.7% 19.7% 59 Melksham Without Parish Council 20.8% -1.1% -1.1% -1.1% 19.7% 19.7% 19.7% 62 Bradford-on-Avon Town Council 20.8% -1.1% -1.1% -1.1% 19.7% 19.7% 19.7% 66 Blunsdon St Andrew Parish Council 20.8% -1.1% -1.1% -1.1% 19.7% 19.7% 19.7% 71 Wroughton Parish Council 20.8% -1.1% -1.1% -1.1% 19.7% 19.7% 19.7% 73 Wanborough Parish Council 20.8% -1.1% -1.1% -1.1% 19.7% 19.7% 19.7% 349 Hullavington Parish Council 20.8% -1.1% -1.1% -1.1% 19.7% 19.7% 19.7% 350 Tidworth Town Council 20.8% -1.1% -1.1% -1.1% 19.7% 19.7% 19.7% 356 Ludgershall Town Council 20.8% -1.1% -1.1% -1.1% 19.7% 19.7% 19.7% 365 Idmiston Parish Council 20.8% -1.1% -1.1% -1.1% 19.7% 19.7% 19.7% 402 Redlynch Parish Council 20.8% -1.1% -1.1% -1.1% 19.7% 19.7% 19.7% 403 Central Swindon South PC 20.8% -1.1% -1.1% -1.1% 19.7% 19.7% 19.7% 404 St Andrews Parish Council Swindon 20.8% -1.1% -1.1% -1.1% 19.7% 19.7% 19.7% 409 Central Swindon North PC 20.8% -1.1% -1.1% -1.1% 19.7% 19.7% 19.7% 413 Whiteparish Parish Council 20.8% -1.1% -1.1% -1.1% 19.7% 19.7% 19.7% 435 Calne Without Parish Council 20.8% -1.1% -1.1% -1.1% 19.7% 19.7% 19.7% 496 West Swindon Parish Council 20.8% -1.1% -1.1% -1.1% 19.7% 19.7% 19.7%
APPROACH TO VALUATION EXECUTIVE SUMMARY
APPROACH TO VALUATION EXECUTIVE SUMMARY
37
RATES &
SECTION
DASHBOARD
VALUATION RESULTS FINAL COMMENTS APPENDICES
ADJUSTMENTS CERTIFICATE
13
SENSITIVITY & RISK ANALYSIS
Employer code Employer name Primary rate (% of pay) Secondary rate (% of pay plus monetary amount) Total contributions (primary rate plus secondary rate) Notes 2023/24 2024/25 2025/26 2023/24 2024/25 2025/26 Further Education Colleges New College 25.8% -4.1% -4.1% -4.1% 21.7% 21.7% 21.7% Wiltshire College 25.6% -1.4% -1.4% -1.4% 24.2% 24.2% 24.2% Academies Acorn Education Trust 25.6% -4.0% -4.0% -4.0% 21.6% 21.6% 21.6% Activate Learning Trust 26.4% 2.2% 2.2% 2.2% 28.6% 28.6% 28.6% Althestan Trust 26.3% 26.3% 26.3% 26.3% Ascend Learning Trust 25.9% -1.6% -1.6% -1.6% 24.3% 24.3% 24.3% Blue Kite Academy 25.9% 0.5% 0.5% 0.5% 26.4% 26.4% 26.4% Brunel SEN MAT 25.6% 0.4% 0.4% 0.4% 26.0% 26.0% 26.0% Diocese of Bristol 26.0% -0.4% -0.4% -0.4% 25.6% 25.6% 25.6% EQUA MAT 26.4% -0.3% -0.3% -0.3% 26.1% 26.1% 26.1% Grove Learning Trust 26.7% 1.7% 1.7% 1.7% 28.4% 28.4% 28.4% Highworth Warneford School 26.0% -2.5% -2.5% -2.5% 23.5% 23.5% 23.5% John of Gaunt School 26.4% -2.1% -2.1% -2.1% 24.3% 24.3% 24.3% King William Street School 27.2% -2.8% -2.8% -2.8% 24.4% 24.4% 24.4% MAGNA 26.1% -1.0% -1.0% -1.0% 25.1% 25.1% 25.1% Malmesbury Primary School 26.7% -1.8% -1.8% -1.8% 24.9% 24.9% 24.9% Pickwick Academy Trust 26.7% 0.0% 0.0% 0.0% 26.7% 26.7% 26.7% Reach South Academy Trust 25.9% -0.8% -0.8% -0.8% 25.1% 25.1% 25.1% River Learning Trust 25.8% -2.3% -2.3% -2.3% 23.5% 23.5% 23.5%
APPROACH TO VALUATION EXECUTIVE SUMMARY
38
RATES &
SECTION 13 DASHBOARD
VALUATION RESULTS FINAL COMMENTS APPENDICES
ADJUSTMENTS CERTIFICATE
SENSITIVITY & RISK ANALYSIS
Employer code Employer name Primary rate (% of pay) Secondary rate (% of pay plus monetary amount) Total contributions (primary rate plus secondary rate) Notes 2023/24 2024/25 2025/26 2023/24 2024/25 2025/26
Somerset Road Educational Trust 26.2% -1.1% -1.1% -1.1% 25.1% 25.1% 25.1% St Augustines school 26.7% -1.6% -1.6% -1.6% 25.1% 25.1% 25.1% ULT 25.2% -5.9% -5.9% -5.9% 19.3% 19.3% 19.3% White Horse Federation 25.8% 0.9% 0.9% 0.9% 26.7% 26.7% 26.7% 91 Goddards Park Academy, Swindon 25.0% -0.2% -0.2% -0.2% 24.8% 24.8% 24.8% 93 Hardenhuish School Ltd 26.3% -1.9% -1.9% -1.9% 24.4% 24.4% 24.4% 95 Bishop Wordsworth Academy 26.9% -0.5% -0.5% -0.5% 26.4% 26.4% 26.4% 96 South Wilts Grammar Academy 26.4% -1.1% -1.1% -1.1% 25.3% 25.3% 25.3% 201 Corsham Secondary Academy 26.1% 1.6% 1.6% 1.6% 27.7% 27.7% 27.7% 202 Sheldon Academy 26.5% -2.3% -2.3% -2.3% 24.2% 24.2% 24.2% 205 Pewsey Vale Academy 25.9% -0.4% -0.4% -0.4% 25.5% 25.5% 25.5% 207 Commonweal Academy, Swindon 26.6% -0.6% -0.6% -0.6% 26.0% 26.0% 26.0% 208 Holy Rood Primary 27.2% 0.8% 0.8% 0.8% 28.0% 28.0% 28.0% 209 Holy Cross Academy 26.2% -0.9% -0.9% -0.9% 25.3% 25.3% 25.3% 211 The Park Academies Trust 25.7% -1.2% -1.2% -1.2% 24.5% 24.5% 24.5% 213 St Joseph's (Swindon) Academy 25.2% -1.5% -1.5% -1.5% 23.7% 23.7% 23.7% 214 St Mary's Academy, Swindon 25.8% -1.8% -1.8% -1.8% 24.0% 24.0% 24.0% 216 St Laurence Academy 26.2% -0.8% -0.8% -0.8% 25.4% 25.4% 25.4% 220 Holy Trinity (Great Cheverell) Academy 27.9% -1.0% -1.0% -1.0% 26.9% 26.9% 26.9% 224 St Edmunds Academy (Calne) 26.4% 2.6% 2.6% 2.6% 29.0% 29.0% 29.0% 226 St Joseph's (Devizes) Academy 26.3% -3.2% -3.2% -3.2% 23.1% 23.1% 23.1%
Academies (Continued)
APPROACH TO VALUATION EXECUTIVE SUMMARY
39
RATES &
SECTION 13 DASHBOARD
VALUATION RESULTS FINAL COMMENTS APPENDICES
ADJUSTMENTS CERTIFICATE
SENSITIVITY & RISK ANALYSIS
Employer code Employer name Primary rate (% of pay) Secondary rate (% of pay plus monetary amount) Total contributions (primary rate plus secondary rate) Notes 2023/24 2024/25 2025/26 2023/24 2024/25 2025/26
231 Dorcan Technology Academy, Swindon 25.9% -4.7% -4.7% -4.7% 21.2% 21.2% 21.2% 232 Woodford Valley Academy 26.8% -2.4% -2.4% -2.4% 24.4% 24.4% 24.4% 236 Bybrook Valley Academy 27.1% -1.0% -1.0% -1.0% 26.1% 26.1% 26.1% 237 Mead Academy, The 25.9% -2.2% -2.2% -2.2% 23.7% 23.7% 23.7% 238 Holy Trinity (Calne) Academy 25.7% -1.8% -1.8% -1.8% 23.9% 23.9% 23.9% 241 Excalibur Academy 26.2% 0.5% 0.5% 0.5% 26.7% 26.7% 26.7% 244 Holy Family Academy 26.7% -0.7% -0.7% -0.7% 26.0% 26.0% 26.0% 245 St Catherines Academy 26.9% -3.6% -3.6% -3.6% 23.3% 23.3% 23.3% 249 Oasis Community Learning 25.7% -1.3% -1.3% -1.3% 24.4% 24.4% 24.4% 252 Hazelwood Academy 26.0% -1.3% -1.3% -1.3% 24.7% 24.7% 24.7% 254 Morgan Vale and Woodfalls 26.4% -0.2% -0.2% -0.2% 26.2% 26.2% 26.2% 255 Millbrook Academy 25.7% 2.2% 2.2% 2.2% 27.9% 27.9% 27.9% 256 Shaw Ridge Academy 26.2% -0.8% -0.8% -0.8% 25.4% 25.4% 25.4% 257 Peatmoor Academy 27.4% -0.6% -0.6% -0.6% 26.8% 26.8% 26.8% 258 Westlea (Swindon) Academy 26.0% -1.1% -1.1% -1.1% 24.9% 24.9% 24.9% 259 Diocese of Salisbury Academy 26.2% 0.1% 0.1% 0.1% 26.3% 26.3% 26.3% 261 King Alfred Academy 26.2% 1.0% 1.0% 1.0% 27.2% 27.2% 27.2% 270 Great Western Academy 25.5% -0.3% -0.3% -0.3% 25.2% 25.2% 25.2% 303 Collaborative Schools Ltd 25.5% -2.8% -2.8% -2.8% 22.7% 22.7% 22.7% 379 Brunel Education 26.1% 26.1% 26.1% 26.1% 707 Palladian MAT - Fitzmaurice School 26.9% 1.1% 1.1% 1.1% 28.0% 28.0% 28.0%
Academies (Continued)
40
RATES &
SECTION 13 DASHBOARD
VALUATION RESULTS FINAL COMMENTS APPENDICES
ADJUSTMENTS CERTIFICATE
SENSITIVITY & RISK ANALYSIS
Employer code Employer name Primary rate (% of pay) Secondary rate (% of pay plus monetary amount) Total contributions (primary rate plus secondary rate) Notes 2023/24 2024/25 2025/26 2023/24 2024/25 2025/26 Community Admission Bodies 61 Order of St John 29.8% -29.8% -29.8% -29.8% 0.0% 0.0% 0.0% 74 Swindon Dance 30.4% -30.4% -30.4% -30.4% 0.0% 0.0% 0.0% 313 WASP (Wiltshire & Swindon Sports Partnership) 26.2% -26.2% -26.2% -26.2% 0.0% 0.0% 0.0% Admitted Bodies Aster Pool 55.4% -24.0% -24.0% plus £435,000 -24.0% plus £435,000 31.4% 31.4% plus £435,000 31.4% plus £435,000 51 Selwood Housing (West Wilts) 42.2% -16.5% -16.5% plus £343,000 -16.5% plus £343,000 25.7% 25.7% plus £343,000 25.7% plus £343,000 160 Caterlink 4 40.3% -6.6% -6.6% -6.6% 33.7% 33.7% 33.7% 181 Aspens - Lethbridge 27.8% 27.8% 27.8% 27.8% 331 Churchill Contract Services 1 40.9% -6.9% -6.9% -6.9% 34.0% 34.0% 34.0% 335 GLL (Part 2) 40.7% 40.7% 40.7% 40.7% 354 Spurgeons 43.3% -22.9% -22.9% -22.9% 20.4% 20.4% 20.4% 359 First City Nursing 45.0% -45.0% -45.0% -45.0% 0.0% 0.0% 0.0% 360 NHS South Central and West Commissioning Support Unit 37.6% 12.1% 12.1% 12.1% 49.7% 49.7% 49.7% 361 Sodexo-DBAT (Diocese of Bristol Academy) 28.3% -2.7% -2.7% -2.7% 25.6% 25.6% 25.6% 371 Brunel Pensions Partnership 21.2% 1.5% 1.5% 1.5% 22.7% 22.7% 22.7% 377 Community Golf and Leisure 28.4% -28.4% -28.4% -28.4% 0.0% 0.0% 0.0% 383 Imperial Cleaning - Highworth Warneford 22.2% 1.3% 1.3% 1.3% 23.5% 23.5% 23.5% 384 Supreme Contract Services 43.9% £1,000 £1,000 £1,000 43.9% plus £1,000 43.9% plus £1,000 43.9% plus £1,000
APPROACH TO VALUATION EXECUTIVE SUMMARY
41
FINAL
RATES & ADJUSTMENTS
SECTION 13 DASHBOARD
VALUATION RESULTS
COMMENTS APPENDICES
CERTIFICATE
SENSITIVITY & RISK ANALYSIS
Employer code Employer name Primary rate (% of pay) Secondary rate (% of pay plus monetary amount) Total contributions (primary rate plus secondary rate) Notes 2023/24 2024/25 2025/26 2023/24 2024/25 2025/26 Admitted Bodies (continued) 385 Cleverchefs Ltd 36.4% -0.2% -0.2% -0.2% 36.2% 36.2% 36.2% 389 Imperial Cleaning (King William Street Academy) 21.1% 3.3% 3.3% 3.3% 24.4% 24.4% 24.4% 406 Direct Cleaning (Westbury) 47.2% 47.2% 47.2% 47.2% 411 Thera South West 42.7% -10.8% -10.8% -10.8% 31.9% 31.9% 31.9% 414 Lex Leisure 27.1% -12.3% -12.3% -12.3% 14.8% 14.8% 14.8% 415 ABM (JOG) 32.5% 32.5% 32.5% 32.5% 417 Aspens (St Augustines) 33.1% -8.0% -8.0% -8.0% 25.1% 25.1% 25.1% 420 Caterlink (Melksham Oak) 43.1% £13,000 43.1% plus £13,000 43.1% 43.1% 422 Classes Abroad 33.7% -0.5% -0.5% -0.5% 33.2% 33.2% 33.2% 425 Sansum Cleaning Solutions Ltd 35.0% £1,000 £1,000 £1,000 35.0% plus £1,000 35.0% plus £1,000 35.0% plus £1,000 433 Direct Janitorial Supplies Ltd 30.4% -5.3% -5.3% -5.3% 25.1% 25.1% 25.1% 434 Imperial Cleaning (Greentrees) 28.0% -1.3% -1.3% -1.3% 26.7% 26.7% 26.7% 436 Direct Cleaning (Netheravon) 36.3% -14.7% -14.7% -14.7% 21.6% 21.6% 21.6% 437 Direct Cleaning (Bulford) 17.5% 4.1% 4.1% 4.1% 21.6% 21.6% 21.6% 495 Braybourne Facilities Ltd 41.8% 41.8% 41.8% 41.8% 498 Adoption West 22.2% 1.2% 1.2% 1.2% 23.4% 23.4% 23.4% 500 Alina Homecare 41.7% £17,000 £17,000 £17,000 41.7% plus £17,000 41.7% plus £17,000 41.7% plus £17,000 501 Innovate Services 2 42.1% 42.1% 42.1% 42.1% 430 Caterlink - Devizes 41.3% £27,000 41.3% plus £27,000 41.3% 41.3% Caterlink Ltd 40.3% -17.6% -17.6% -17.6% 22.7% 22.7% 22.7%
APPROACH TO VALUATION EXECUTIVE SUMMARY
Notes to the Rates andAdjustments Certificate
1. This employer has elected to pre-pay elements of their contributions set out in this Rates and Adjustments Certificate. A discount has been applied to the pre-payment amount to reflect the early payment of contributions. The table below sets out more details relating to the pre-payment amount.
Employer Wiltshire Council (non-schools)
Pre-payment amount £27.322m
Date payment to be made by 30 April 2023
Amount payable in respect of - 2023/24 £27.877m
Rate of discount 4.1% pa
Revised contributions due* - 2023/24 - 2024/25 - 2025/26
0% 21.0% plus £3.851m 21.0% plus £5.143m
*in addition to the pre-payment amount
42 VALUATION RESULTS FINAL COMMENTS APPENDICES RATES & ADJUSTMENTS CERTIFICATE SECTION 13 DASHBOARD SENSITIVITY & RISK ANALYSIS APPROACH TO VALUATION EXECUTIVE SUMMARY
Further comments to the Rates andAdjustments Certificate
• Contributions expressed as a percentage of payroll should be paid into the Fund at a frequency in accordance with the requirements of the Regulations
• Further sums should be paid to the Fund to meet the costs of any early retirements and/or augmentations using methods and factors issued by us from time to time or as otherwise agreed.
• The certified contribution rates represent the minimum level of contributions to be paid. Employing authorities may pay further amounts at any time and future periodic contributions may be adjusted on a basis approved by the Fund Actuary.
• The monetary contributions set out in the certificate above can be prepaid in advance with appropriate adjustments for interest as and when agreed with the AdministeringAuthority. Under these circumstances a revised Rates and Adjustments certificate may be issued reflecting any advance payments.
Barry Dodds FFA
31 March 2023
For and on behalf of Hymans Robertson LLP
Catherine McFadyen FFA
43 VALUATION RESULTS FINAL COMMENTS APPENDICES RATES & ADJUSTMENTS CERTIFICATE SECTION 13 DASHBOARD SENSITIVITY & RISK ANALYSIS APPROACH TO VALUATION EXECUTIVE SUMMARY
Section 13 Dashboard
Section 13 dashboard
Method of derivation of discount rate, plus any changes since previous valuation
Past service and future service are consistently valued with the same underlying assumptions, methodologies and models regarding future expected levels of inflation, interest rates and investment returns.
There is a 75% likelihood that the Fund's assets will return at least 4.1% pa over the 20 years following the 2022 valuation date. This is the same methodology and likelihood used for the 2019 valuation.
45 VALUATION RESULTS FINAL COMMENTS APPENDICES RATES & ADJUSTMENTS CERTIFICATE SECTION 13 DASHBOARD SENSITIVITY & RISK ANALYSIS
EXECUTIVE
APPROACH TO VALUATION
SUMMARY
Metric Unit 2022 valuation 2022 funding position – local funding basis Funding level (assets/liabilities) % 103% Funding level (change since previous valuation) % 6% Asset value used at the valuation £m 3,230 Value of liabilities (including McCloud liability) £m 3,149 Surplus (deficit) £m 81 Discount rate – past service % pa 4.1% Discount rate – future service % pa
Assumed pension increase (CPI) % pa 2.7%
Section 13 dashboard
Past service funding position – SAB basis (for comparison purposes only)
46 VALUATION RESULTS FINAL COMMENTS APPENDICES RATES & ADJUSTMENTS CERTIFICATE SECTION 13 DASHBOARD SENSITIVITY & RISK
EXECUTIVE
ANALYSIS APPROACH TO VALUATION
SUMMARY
Metric Unit 2022 valuation Assumed life expectancy at age 65 Life expectancy for current pensioners – men age 65 years 21.9 Life expectancy for current pensioners – women age 65 years 24.6 Life expectancy for future pensioners – men age 45 years 22.7 Life expectancy for future pensioners – women age 45 years 26.1
Market value of assets £m 3,230 Value of liabilities £m 2,802 Funding level on SAB basis (assets/liabilities) % 115% Funding level on SAB basis (change since last valuation) % 3%
Section 13 dashboard
47
FINAL COMMENTS APPENDICES RATES & ADJUSTMENTS CERTIFICATE SECTION 13 DASHBOARD SENSITIVITY
EXECUTIVE
VALUATION RESULTS
& RISK ANALYSIS APPROACH TO VALUATION
SUMMARY
Metric Unit 2022 valuation 2019 valuation Contribution rates payable Primary contribution rate % of pay 22.2% 22.0% Secondary contribution rate (cash amounts in each year in line with CIPFA guidance) 1st year of rates and adjustments certificate £m 5.147 10.973 2nd year of rates and adjustments certificate £m 3.818 11.079 3rd year of rates and adjustments certificate £m 5.851 10.844 Giving total expected contributions 1st year of rates and adjustments certificate (£ figure based on assumed payroll) £m 95.794 85.784 2nd year of rates and adjustments certificate (£ figure based on assumed payroll) £m 97.387 87.931 3rd year of rates and adjustments certificate (£ figure based on assumed payroll) £m 102.436 89.792 Assumed payroll (cash amounts in each year) 1st year of rates and adjustments certificate £m 408.236 339.767 2nd year of rates and adjustments certificate £m 421.396 349.034 3rd year of rates and adjustments certificate £m 434.980 358.554 3 year average total employer contribution rate % of pay 23.4% 25.1% Average employee contribution % of pay 6.3% 6.1% Employee contribution rate (£ figure based on assumed payroll of £413m) £m pa 25.793 20.748
Section 13 dashboard
Metric
Deficit recovery and surplus spreading plan
Latest deficit recovery period end date, where this methodology is used by the fund’s actuarial advisor
48 VALUATION RESULTS FINAL COMMENTS APPENDICES RATES & ADJUSTMENTS CERTIFICATE SECTION 13 DASHBOARD SENSITIVITY & RISK
EXECUTIVE
ANALYSIS APPROACH TO VALUATION
SUMMARY
Unit 2022 valuation 2019 valuation
Year Methodology not used Methodology not used
Year Methodology not used Methodology not used The
actuarial advisor Year 2042 2039 The
actuarial advisor % 79% 78% Percentage of liabilities relating to employers with deficit recovery periods of longer than 20 years % 0% 0% Additional information Percentage of total liabilities that are in respect of Tier 3 employers % 10% Included climate change analysis/comments in the 2022 valuation report Yes Value of McCloud liability in the 2022 valuation report (on local funding basis) £m 3
Earliest surplus spreading period end date, where this methodology is used by the fund’s actuarial advisor
time horizon end date, where this methodology is used by the fund’s
funding plan’s likelihood of success, where this methodology is used by the fund’s