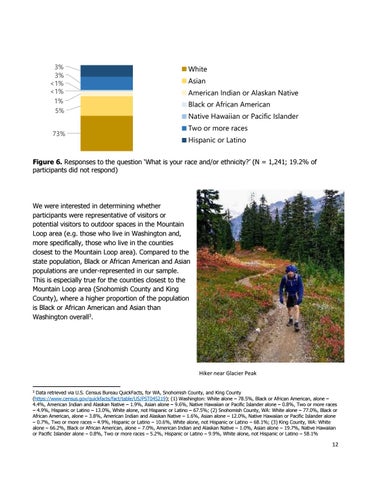
3% 3% <1% <1% 1% 5% 73%
White Asian American Indian or Alaskan Native Black or African American
Native Hawaiian or Pacific Islander Two or more races Hispanic or Latino
Figure 6. Responses to the question ‘What is your race and/or ethnicity?’ (N = 1,241; 19.2% of participants did not respond)
We were interested in determining whether participants were representative of visitors or potential visitors to outdoor spaces in the Mountain Loop area (e.g. those who live in Washington and, more specifically, those who live in the counties closest to the Mountain Loop area). Compared to the state population, Black or African American and Asian populations are under-represented in our sample. This is especially true for the counties closest to the Mountain Loop area (Snohomish County and King County), where a higher proportion of the population is Black or African American and Asian than Washington overall3.
Hiker near Glacier Peak 3
Data retrieved via U.S. Census Bureau QuickFacts, for WA, Snohomish County, and King County (https://www.census.gov/quickfacts/fact/table/US/PST045219); (1) Washington: White alone – 78.5%, Black or African American, alone – 4.4%, American Indian and Alaskan Native – 1.9%, Asian alone – 9.6%, Native Hawaiian or Pacific Islander alone – 0.8%, Two or more races – 4.9%, Hispanic or Latino – 13.0%, White alone, not Hispanic or Latino – 67.5%; (2) Snohomish County, WA: White alone – 77.0%, Black or African American, alone – 3.8%, American Indian and Alaskan Native – 1.6%, Asian alone – 12.0%, Native Hawaiian or Pacific Islander alone – 0.7%, Two or more races – 4.9%, Hispanic or Latino – 10.6%, White alone, not Hispanic or Latino – 68.1%; (3) King County, WA: White alone – 66.2%, Black or African American, alone – 7.0%, American Indian and Alaskan Native – 1.0%, Asian alone – 19.7%, Native Hawaiian or Pacific Islander alone – 0.8%, Two or more races – 5.2%, Hispanic or Latino – 9.9%, White alone, not Hispanic or Latino – 58.1%
12


