4 minute read
Figure 6. Responses to the question ‘What is your race and/or ethnicity?’


3% 3% <1% <1% 1% 5%
73% White Asian American Indian or Alaskan Native Black or African American Native Hawaiian or Pacific Islander Two or more races Hispanic or Latino
Advertisement
Figure 6. Responses to the question ‘What is your race and/or ethnicity?’ (N = 1,241; 19.2% of participants did not respond)
We were interested in determining whether participants were representative of visitors or potential visitors to outdoor spaces in the Mountain Loop area (e.g. those who live in Washington and, more specifically, those who live in the counties closest to the Mountain Loop area). Compared to the state population, Black or African American and Asian populations are under-represented in our sample. This is especially true for the counties closest to the Mountain Loop area (Snohomish County and King County), where a higher proportion of the population is Black or African American and Asian than Washington overall3 .
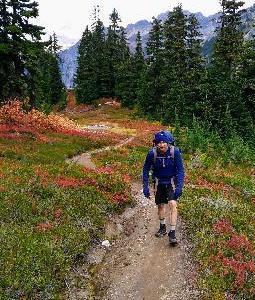
Hiker near Glacier Peak
3 Data retrieved via U.S. Census Bureau QuickFacts, for WA, Snohomish County, and King County (https://www.census.gov/quickfacts/fact/table/US/PST045219); (1) Washington: White alone – 78.5%, Black or African American, alone –4.4%, American Indian and Alaskan Native – 1.9%, Asian alone – 9.6%, Native Hawaiian or Pacific Islander alone – 0.8%, Two or more races – 4.9%, Hispanic or Latino – 13.0%, White alone, not Hispanic or Latino – 67.5%; (2) Snohomish County, WA: White alone – 77.0%, Black or African American, alone – 3.8%, American Indian and Alaskan Native – 1.6%, Asian alone – 12.0%, Native Hawaiian or Pacific Islander alone – 0.7%, Two or more races – 4.9%, Hispanic or Latino – 10.6%, White alone, not Hispanic or Latino – 68.1%; (3) King County, WA: White alone – 66.2%, Black or African American, alone – 7.0%, American Indian and Alaskan Native – 1.0%, Asian alone – 19.7%, Native Hawaiian or Pacific Islander alone – 0.8%, Two or more races – 5.2%, Hispanic or Latino – 9.9%, White alone, not Hispanic or Latino – 58.1%
The survey respondents, on average, are more educated than King County, Snohomish County, and Washington overall, where the percentage of people over 25 with a bachelor’s degree is 52.5%, 32.8%, and 36.0%, respectively4. While it’s difficult to directly compare reported income, because respondents selected the income range that best represented their household income, about 57 percent of respondents reported an income higher than the median WA household income (about $73,775), and 20 percent of respondents reported an income of $150,000 or higher. The median income is higher in King County and Snohomish County ($94,974 and $86,694, respectively).
It also is useful to compare our respondents with recreation visitors to the MBS NF, as measured by the National Visitor Use Monitoring (NVUM) data (2015). 5 Compared to MBS NF visitors, our sample had a slightly higher proportion of women, lower proportion of visitors with a household income of $100,0006 and lower proportion of visitors who are white. 7 We do not have information about educational attainment in the NVUM data to compare.
Considerations
While our sample was reflective of the demographics of typical MBS NF visitors, it does not reflect the demographics of Snohomish or King Counties whose residents use the area. In future outreach, extra steps to reach under-represented groups (including Black and Asian populations, those with lower household incomes, and those with lower educational attainment) will provide a more complete picture of the priorities and concerns of current and future MLH visitors. In addition, future work may target potential MLH visitors to identify barriers, preferences, and perceptions about visiting outdoor spaces to generate information that will help to ensure that these public spaces feel accessible to all.
4 Data retrieved via U.S. Census Bureau QuickFacts, for WA, Snohomish County, and King County (https://www.census.gov/quickfacts/fact/table/US/PST045219); Race and Hispanic Origin – 2019, U.S. Census Bureau, Population Estimates Program (PEP). Updated annually; Education – (2015 – 2019), U.S. Census Bureau, American Community Survey (ACS). Updated annually; Income – (2015 – 2019) U.S. Census Bureau, American Community Survey (ACS). Updated annually. 5 Data retrieved via National Resource Manager National Visitor Use Monitoring (NRM NVUM) Results for Mt. Baker-Snoqualmie NF, 2015: https://apps.fs.usda.gov/nvum/results/A06005.aspx/FY2015 6 52% of MBS NF visitors make more than $100,000 (compared to 42% of MLH respondents). 7 94% of MBS NF visitors identify as White, compared to 73% of MLH respondents; 7% of MBS NF visitors identify as Asian, compared to 5% of MLH respondents; 0.9% of MBS NF visitors identify as Black, compared to 0.1% of MLH respondents; 2% of MBS NF visitors identify as American Indian or Alaskan Native, compared to 1.1% of MLH respondents; 3.7% of MBS NF visitors identify as Hispanic or Latino, compared to 3% of MLH respondents; 1.7% of MBS NF visitors are Native Hawaiian or Pacific Islander, compared to 0.1% of MLH respondents.