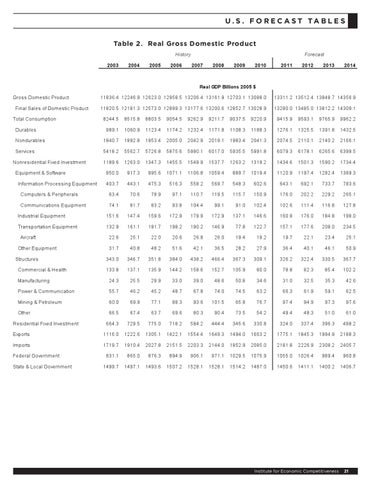
U . S . F o r eca s t Tab l e s Table 2. Real Gross Domestic Product
Table 2. Real Gross Domestic Product History 2003
2004
2005
2006
Forecast 2007
2008
2009
2010
2011
2012
2013
2014
Real GDP Billions 2005 $ Gross Domestic Product Final Sales of Domestic Product Total Consumption
11836.4 12246.9 12623.0 12958.5 13206.4 13161.9 12703.1 13088.0
13311.2 13512.4 13848.7 14356.9
11820.5 12181.3 12573.0 12899.3 13177.6 13200.6 12852.7 13028.9
13280.0 13485.0 13812.2 14309.1
8244.5
8515.8
8803.5
9054.5
9262.9
9211.7
9037.5
9220.9
9415.9
9593.1
9765.9
9962.2
989.1
1060.9
1123.4
1174.2
1232.4
1171.8
1108.3
1188.3
1276.1
1325.5
1391.8
1432.5
Nondurables
1840.7
1892.8
1953.4
2005.0
2042.9
2019.1
1983.4
2041.3
2074.5
2110.1
2140.2
2166.1
Services
5418.2
5562.7
5726.8
5875.6
5990.1
6017.0
5935.5
5991.8
6079.3
6178.1
6265.6
6399.5
1189.6
1263.0
1347.3
1455.5
1549.9
1537.7
1263.2
1319.2
1434.6
1501.3
1590.2
1734.4
850.0
917.3
995.6
1071.1
1106.8
1059.4
889.7
1019.4
1120.9
1197.4
1282.4
1389.3
403.7
443.1
475.3
516.3
558.2
569.7
548.3
602.6
643.1
692.1
733.7
783.6
Computers & Peripherals
63.4
70.6
78.9
97.1
110.7
119.5
115.7
150.9
176.0
202.2
229.2
265.1
Communications Equipment
74.1
81.7
83.2
93.8
104.4
99.1
91.0
102.4
102.6
111.4
116.8
127.8
Industrial Equipment
151.6
147.4
159.6
172.9
179.9
172.9
137.1
146.6
160.9
176.0
184.8
198.0
Transportation Equipment
132.9
161.1
181.7
198.2
190.2
146.9
77.8
122.7
157.1
177.6
208.0
234.5
22.6
25.1
22.0
20.6
26.8
26.0
19.4
19.2
19.7
22.1
23.4
25.1
31.7
40.8
48.2
51.6
42.1
36.5
28.2
27.9
36.4
40.1
46.1
50.9
343.0
346.7
351.8
384.0
438.2
466.4
367.3
309.1
326.2
322.4
330.5
367.7
133.8
137.1
135.9
144.2
158.6
152.7
105.9
80.0
78.8
82.3
85.4
102.2
Manufacturing
24.3
25.5
29.9
33.0
39.0
48.6
50.8
34.6
31.0
32.5
35.3
42.6
Power & Communication
55.7
46.2
45.2
48.7
67.8
74.0
74.5
63.2
66.3
61.9
59.1
62.5
Mining & Petroleum
60.0
69.9
77.1
88.3
93.6
101.5
65.8
76.7
97.4
94.9
97.3
97.6
Other
66.5
67.4
63.7
69.6
80.3
90.4
73.5
54.2
49.4
48.3
51.0
61.0
664.3
729.5
775.0
718.2
584.2
444.4
345.6
330.8
324.0
337.4
396.3
498.2
Exports
1116.0
1222.6
1305.1
1422.1
1554.4
1649.3
1494.0
1663.2
1775.1
1845.3
1994.9
2188.3
Imports
1719.7
1910.4
2027.8
2151.5
2203.3
2144.0
1852.9
2085.0
2181.8
2226.9
2308.2
2405.7
831.1
865.0
876.3
894.9
906.1
971.1
1029.5
1075.9
1055.0
1026.4
989.4
960.8
1499.7
1497.1
1493.6
1507.2
1528.1
1528.1
1514.2
1487.0
1450.6
1411.1
1400.2
1406.7
Durables
Nonresidential Fixed Investment Equipment & Software Information Processing Equipment
Aircraft Other Equipment Structures Commercial & Health
Residential Fixed Investment
Federal Government State & Local Government
Institute for Economic Competitiveness
21
