Florida.
DOGE has created a frenetic pace of changes to the business as usual in Washington, DC. $36.5 trillion in debt, with over a trillion dollars going to simply paying the interest rate each year on that debt, necessitated a dramatic shake-up to the status quo that has persisted for decades in our nation’s capital.
Will it be successful? In the short term we have already seen $170 billion in spending cuts, but with a deficit that is currently $2 trillion these cuts are insufficient to fix the budget. Longer and lasting changes will require legislation from Congress that entrenches austerity in law.
In addition to the DOGE firestorm, we have been enjoined in the latest dance craze – the Tariff Tango. Tariffs being threatened but not imposed, tariffs being imposed but then delayed, tariffs generally being used as a lever to achieve other policy objectives that are unrelated to international trade (border control, drug flows). It may not be as fun as doing the Macarena, but eventually the music will stop, and the economy will adjust to whatever the final version of these policies may be. In the meantime, you should probably dance by your 401k statement and not open it, financial markets do not respond well to uncertainty.
The atmosphere in DC seems to have drifted down to Tallahassee. Governor DeSantis has advocated for several policy changes that
mirror what is transpiring in our nation’s capital. He has called for a state-level version of DOGE for Florida’s government and public universities and colleges, and he has supported the end of property taxes and has signed immigration laws that aim to advance enforcement in the state.
I can’t seem to get this lyric from Bob Dylan’s1 song Tangled Up in Blue out of my head:
“There was music in the cafes at night and revolution in the air.”
I don’t think we would have seen this flurry of activity coming out of Tallahassee if it were not for the happenings in Washington, DC. I’m also not sure that in the long run these laws and initiatives will ultimately have a dramatic impact in Florida.
State and local governments in Florida must operate in a manner that results in balanced budgets. There is no running up debt in the manner that has driven our national debt to $36.5 trillion, and as a result there is unlikely to be the level of fraud and waste that is being revealed by DOGE taking place in Florida. DOGE in our state is simply budgetary oversight which must be in place when governments are required to balance budgets. 1
The end of property taxes sounds great initially, nobody likes paying taxes, and the notion that something you worked your whole life to purchase could be taken away because of an inability to pay property taxes – particularly when property assessments continue to rise alongside housing prices is problematic. However, local governments, school districts, first responder and other locally funded operations will have to be paid for somehow and when that reality of how they would be funded in lieu of a property tax becomes part of the discussion the support for such a move may make it difficult to meet the 60% approval necessary for a constitutional amendment.
Lastly, on the immigration front the main issue in Florida and at the national level is the ability to enforce these laws and the resources required to do so, particularly given the large number of illegal immigrants in both the nation and in Florida. Deportations will by necessity be focused on those who commit additional crimes when in the State.
Despite the head-spinning activity of the past two months, I am still not sure if there is revolution in the air or just sound and fury.
FLORIDA’S HOUSING MARKET
Inventories Rising, Sales Up and Prices up Slightly
The January 2024 single-family home report released by Florida Realtors shows a market for existing housing with a rising level of inventories, but still a small shortage—a shortage that was responsible for sparking rapid price appreciation during 2021-2023. The median price has been pushed to $152,200 above the peak price of the housing bubble in June 2006. The median sales price for single-family homes increased by $5,000
from January 2023, year-over-year, and now stands at $410,000—a year-over-year price appreciation of 1.2%. Price depreciation in the townhome/ condominium market has set in, at least for the moment, with a decrease in the median sales price of $7,500 year-over-year, registering at $312,500 in January of this year. This price change represents a 2.3% decrease in median prices year-over-year.
Inventories of single-family homes in January are up from 3.8 months of supply a year ago to 5.1 months of supply this year. This indicates an inventory balance that is still slightly skewed in favor of the sellers in the single-family market, according to the Florida Realtors report. 2 From January 2024 to January 2025, inventories of condominiums rose from 5.8 months to 9.1 months, indicating that the condo market has fully shifted from a seller’s market to a buyer’s market. There remain shortages in the existing singlefamily homes market, but condo markets have now fully swung in favor of buyers.
Distressed sales of single-family homes in the form of short sales remain at extremely low levels showing little impact of higher mortgage rates, prices, and homeowners insurance costs. They have increased from 25 in January 2024 to 28 in January 2025, an increase of 12.0% year-over-year but at still historically low levels. Foreclosure/ REO sales have also increased year-over-year by 26.7% versus January 2024, increasing from 131 to 166 in January of this year, but levels remain quite low. Traditional sales are up 3.4% year-over-year versus January 2024, as continued appreciation and homeowners’ insurance rates propagate affordability challenges that are partially offset by growing levels of inventories and by lower mortgage rates.
Distressed sales of condos in the form of short sales are still at very low levels, just 11, in January
2 According to Florida Realtors, the benchmark for a balanced market (favoring neither buyer nor seller) is 5.5 months of inventory. Numbers above that indicate a buyers’ market, numbers below a sellers’ market. Other real estate economists suggest a 6-to-9month inventory as being a balanced market.
2024. Foreclosure/REO sales are up 20.0% from January 2024 but remain at low levels of just 36. Traditional sales of condos are down 4.0% in January 2025 when compared to January 2024.
In January 2025, the percentage of closed sales of singlefamily homes that were cash transactions stood at 33.1%. For condos, that figure is much higher, as 54.3% of all closings were cash transactions. The condo market’s share of cash transactions decreased by 1.6 percentage points year-over-year, while the single-family home market share of cash transactions has increased by 0.6 percentage points. This is occurring amidst a still-tight market for mortgages. 3
Source:FloridaRealtors
Figure 1 depicts the monthly realtor sales of existing single-family homes, as well as the 12-month moving average of these sales. The smoother moving average line evens out the seasonality and other statistical noise inherent in monthly housing market data. Sales had been on a strong upward path over the past post-pandemic, and the 12-month moving average and monthly sales vastly exceeded their peak value during the housing bubble. Over the past two years the 12-month moving average has sharply declined, but in recent months, it has started to flatten out. This reflects affordability issues easing in the face of slower price appreciation over the past year; a rising inventory of houses for sale; slight easing in mortgage credit markets; stabilizing homeowners insurance premiums; and lower mortgage rates for
3 The Mortgage Credit Availability Index (MCAI), put out by the Mortgage Bankers Association, increased by 2.5% to 99.0 in January from December 2024. The increase in the index in November from October indicates that mortgage lending standards loosened. The index is benchmarked to 100 in March 2012. Relative to that month, mortgages in January 2025 were 1.0% less available. In 2006, the value of this same index approached 900 and at the start of 2020, the index was near 185. Despite lower mortgage rates, financing is not available to all comers.
those able to get loans. The short-lived COVID-19 plunge in sales during January and May pulled down the moving average in 2020, but the immediate post-shutdown rebound was strong, fueled by pent-up demand and then record-low mortgage rates.
The housing market in Florida is still challenged by the burden of high prices and higher insurance premiums despite somewhat lower mortgage rates. Economic and job growth in Florida are forecasted to slow as the U.S. economy decelerates. More baby boomers continue to reach the end of their working lives, and this bodes well for continued population growth via the immigration of retirees, as well as job seekers to Florida. We expect sales to remain under some pressure, as increases in the supply of new housing will help keep price appreciation contained in an environment with continuing strength in the demographic drivers of housing demand. Housing demand had some relief from higher mortgage rates that had hit 8.0% at their recent peak, with the possibility of the Federal Reserve Bank continuing interest rate cuts in the year ahead. Also, continued relief from recent surges in homeowners’ insurance rates will help support this demand.
Figure 1.
$100,000
$50,000
$0
Source:FloridaRealtors
Figure 2 displays median sales prices for existing single-family homes. Median sales prices have continued to climb since bottoming out in 2011. The double-digit pace of price increases in 2016 and 2017, which eased in 2018 and 2019, resumed in 2020. Over the past year, the 12-month moving average of median sales prices has risen by more than $6,772.
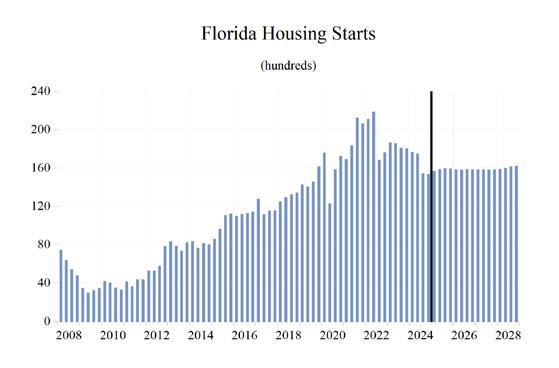
Low inventories of existing homes for sale and lagging housing starts growth since 2016 contributed to the environment where home prices rose at a rapid pace. But others who have refinanced mortgages at sub-3.0% levels have been hesitant to sell when current rates are near 7.0%. However, the slowing of housing demand will result in a slowdown in housing starts. Some tightness in the housing market will be a persistent feature of Florida’s economy for several years to come.
This period of unsustainable multi-year price appreciation has ended. The possibility of recession or economic slowdown, coupled with relatively higher mortgage rates, has dampened rising prices. The economic conditions may lead to some price depreciation, but not anything like the 2008-09 collapse in prices.
Housing starts in 2028 are expected to increase to slightly over 161,000, falling from 183,675 in
2023 to 158,756 in 2027. Lower interest rates should support this sector of the economy after higher rates had a chilling effect on home construction activity.
GROSS STATE PRODUCT
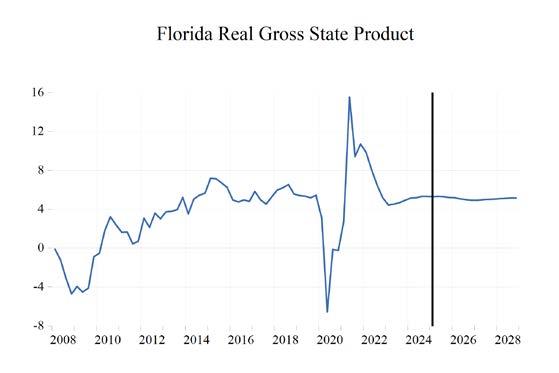
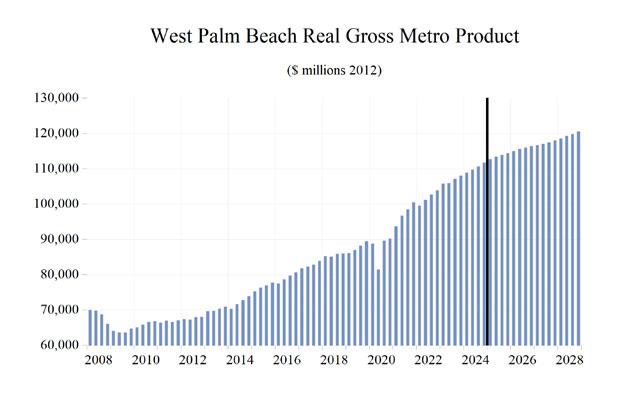
Lockdowns caused a contraction in real Gross State Product (GSP) in 2020 of 1.4% year-over-year. This decline was smaller than both annual declines that occurred during the Great Recession (3.9% in 2008 and 5.5% in 2009). However, the second quarter’s year-overyear decline in 2020 was steeper than any quarter during the Great Recession. Fortunately, the COVID-19 recession, while much deeper than the previous recessions, was also very short-lived at just two months. Florida’s decision to avoid heavyhanded and lengthy restrictions on the economy allowed the state to come roaring back in 2021 when growth hit 9.4%.
During 2025-2028, Florida’s real GSP is expected to grow an average of 2.2% annually. This growth will include a 2025 deceleration to 2.5% from 3.6% in 2024. The 2.2% average growth from 2025 through 2028 will be a slower pace for growth compared to the prior four years (when growth averaged 5.8%), and this is due to an anticipated slowdown in the U.S. economy. This projected average rate of growth for Florida’s economy over the 2025-2028 period is higher than the average of our forecasted real GDP growth for the U.S. economy (1.8%) over the same time frame.
Housing prices have soared from the bottom of the housing crisis. During the crisis, median existing-home prices fell to a low of $122,200 but now stand at $410,000. This price appreciation improved household balance sheets in Florida.
With the price appreciation to date, Florida has long since recovered the aggregate housing value lost during the housing market collapse and soared past the lofty levels at the peak of the housing bubble, but higher mortgage rates and a slowing economy may lead to some declines in prices. Fortunately for homeowners, but not for potential buyers, any price declines that do occur will not be anything like the price collapse of 2008-09.
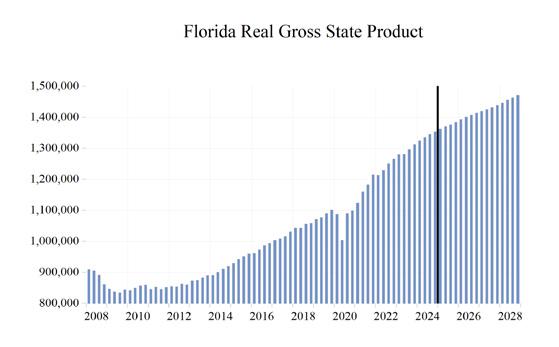
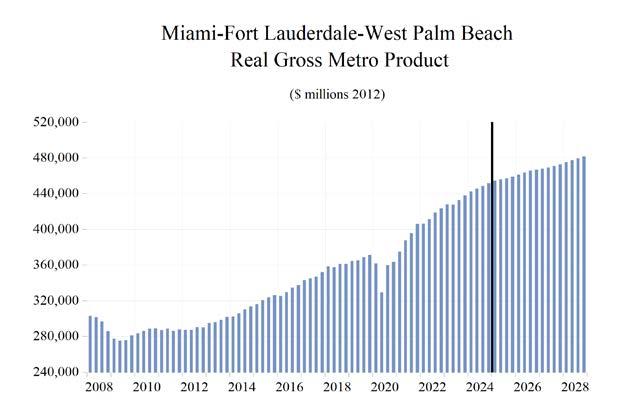
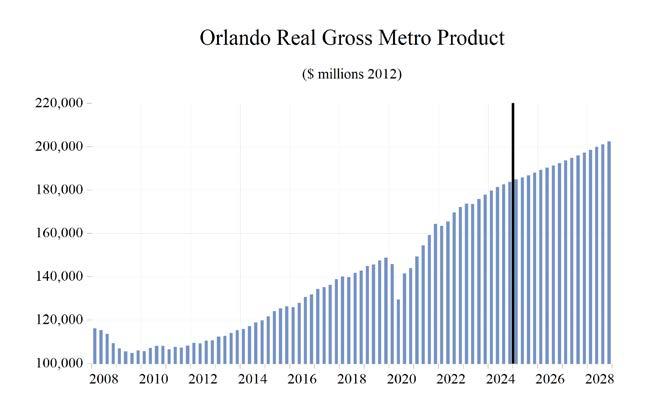
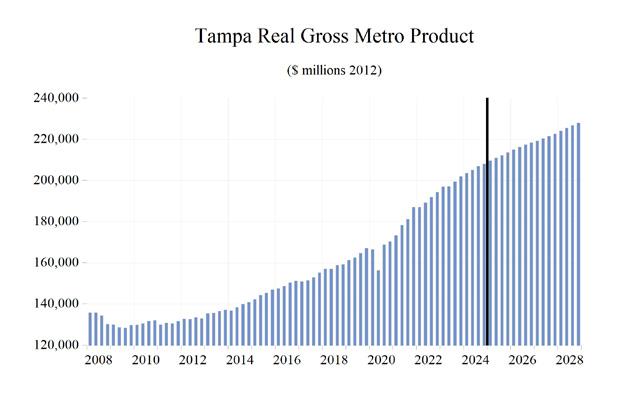
In 2017, Florida’s economy broke the $1-trillion threshold with a nominal (not adjusted for inflation) Gross State Product (GSP) of $1.003 trillion, which increased to $1.29 trillion in 2021. GSP reached $1.47 trillion in 2022 and GSP hit $1.60 trillion in 2023. We expect GSP to rise to $1.80 trillion in 2025, $1.90 trillion in 2026, $1.98 trillion in 2027 and $2.07 trillion in 2028.
Real GSP (adjusted for inflation) exceeded $1.1 trillion in 2021 and will climb to nearly $1.46 trillion in 2028.
PERSONAL INCOME, RETAIL SALES, AND AUTO SALES
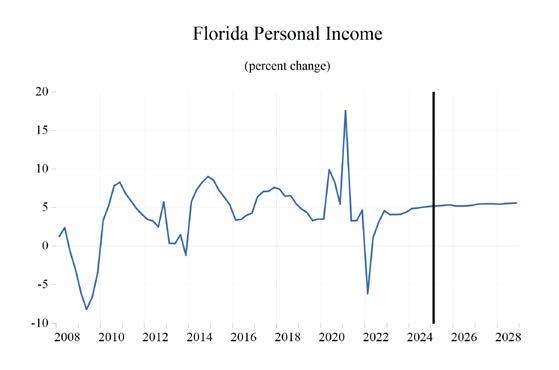
Nominal personal income growth surged to 6.5% (thanks to COVID stimulus and bonus unemployment payments) in 2020 and 11.3% in 2021, amid further federal stimulus spending and tax credits. Nominal personal income will be slightly above $2.0 trillion in 2028, marking an increase in personal income of over $1.0 trillion from its Great Recession low point in 2009.
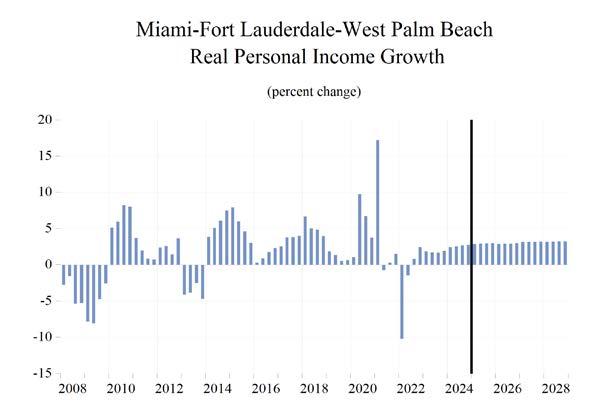
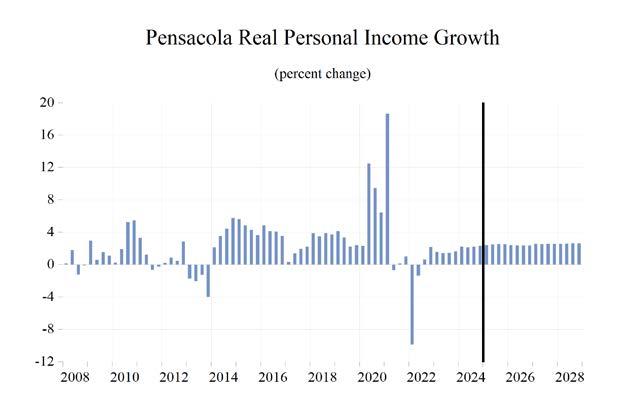
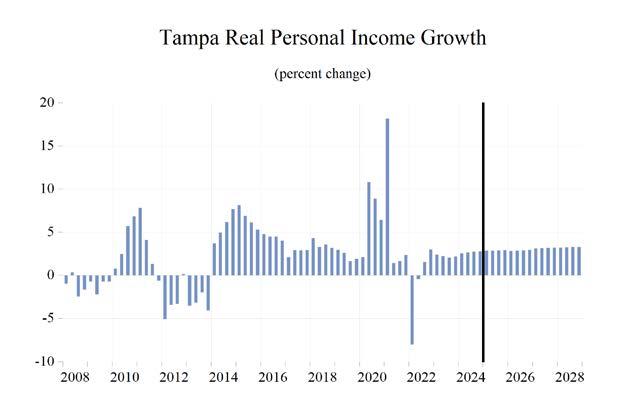
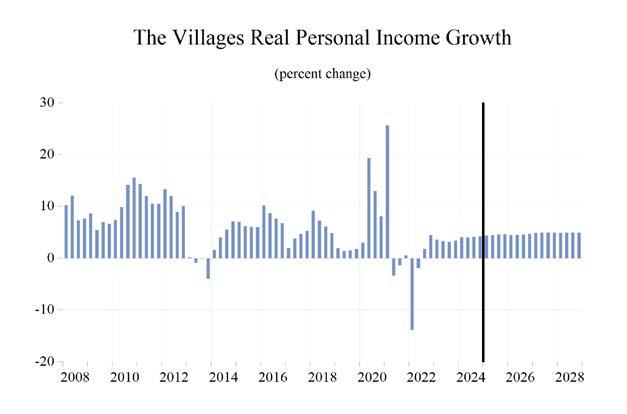
Thanks to rising inflation, real personal income contracted by 1.7% in 2022 but rose by 3.0% in 2023. Growth was 3.3% in 2024 and is expected to be 2.5% in 2025, 3.2% in 2026, 3.6% in 2027, and 3.5% in 2028. Real personal income growth during 2025-2028 will average 3.2% in Florida, weighed down a bit by slower growth and some persistent inflation in the near term, but still 0.5 percentage points higher than our forecast for the U.S.
Real disposable income growth, because of surging inflation, turned negative at -3.8% in 2022. Average growth in Florida during 2025-2028 will be 3.5% with inflation steadily declining, accompanied by still-solid wage and salary growth supported by Florida’s sturdy labor market.
Financial markets experienced a strong rebound from the COVID-19 induced financial downturn, thanks in large part to the Federal Reserve Bank’s resumption of the financial crisis zero-interest-rate policy, quantitative easing, and the other federal stimulus programs. The Dow Jones Industrial Average fell to 18,214 in March 2020 but then surged to a then new record high of 36,953 in January 2022. The market declined as the Fed commenced its fight against inflation, causing financial markets to decline from those highs to the Dow falling under 34,000. Recently with the Fed starting to cut interest rates, the market hit a new all-time high above 45,000 but has declined significantly in the past two months with DOGE and tariff uncertainty spooking financial markets.
Home equity in Florida did not recover as rapidly as financial asset wealth following the Great Recession, but housing prices have been climbing over the past five years and current median prices have greatly exceeded the once heady highs seen during the housing bubble. The housing market did not suffer the pandemic pain that financial markets experienced during the COVID-19 recession, nor will it during any economic slowing in the next few years. Home prices could fall slightly if this slowdown is worse than anticipated, but to date, price declines have not materialized in a housing market where inventories are rising with the Fed putting interest rate cuts on hold for now.
Housing may not be as large a driver in the economy over the next few years as housing starts have dipped from their post-pandemic highs. However, housing will still be an important economic factor as builders work to replenish,
albeit at this diminished pace, depleted inventories as Florida’s population continues to grow, thus driving housing demand.
Retail spending was hurt in the short run by the public health shutdowns and the effective collapse of the tourism industry in Florida from the pandemic response. Retail spending in the first quarter of 2020 contracted by 11.8% at an annual rate followed by a 9.3% contraction for the second quarter. Spending levels exploded after the short, deep recession and a series of economic lockdowns, fully countering the first half of the year’s plunge, and driving full-year growth into positive territory for the year. In 2021, retail sales grew robustly compared to 2020, rising 18.9% year over year. Sales came back down to Earth from the postlockdown growth, and after a few quarters of weak growth from an erosion of consumers’ purchasing power and a slowing economy, growth will average 4.7% during 2025-2028, hitting 3.9% in the final year of our forecast.
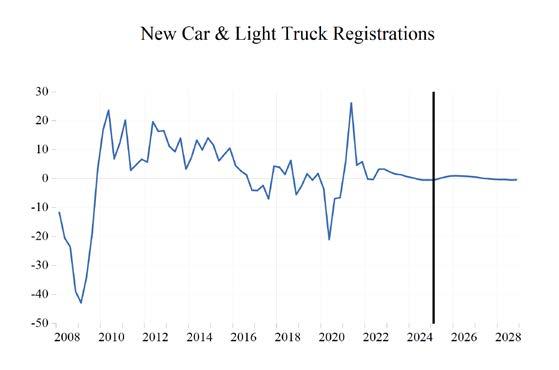
Consumers began to purchase light vehicles at a faster pace after the Great Recession ended, releasing several years of pent-up demand, and continued to do so through 2016, though at a considerably slower pace. The 2020 COVID recession once again caused a contraction of new passenger car and truck registrations of 5.1% year-over-year in the fourth quarter of 2020, versus the fourth quarter of 2019. This contraction was not as sharp or as persistent as the one that took place during the Great Recession. Supply chain disruptions injected chaos into light vehicle markets, and prices for both new and used vehicles soared in the wake of these problems. New cars were selling for thousands above sticker price and used vehicle inflation at one point hit 40% yearover-year. The rate of vehicle inflation has declined significantly, but prices remain still elevated above pre-pandemic levels and interest rates on auto loans remain high for now.
Pent-up demand and the economic recovery boosted registrations coming out of the COVID
recession, and vehicle registration growth in Florida surged in 2021, rising to 11.6%. Registration growth in Florida during 2025-2028 will average 1.3%. Over this period, high interest rates on auto loans and high auto prices potentially further impacted by tariffs, will decelerate the growth in the number of new registrations in 2024 to 1.4%. In 2028, Florida’s new passenger car and truck registrations will be slightly under 1.47 million.
EMPLOYMENT
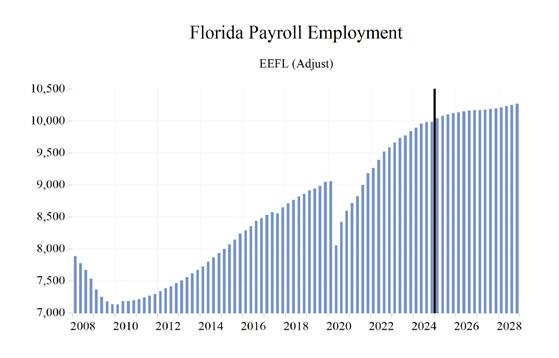
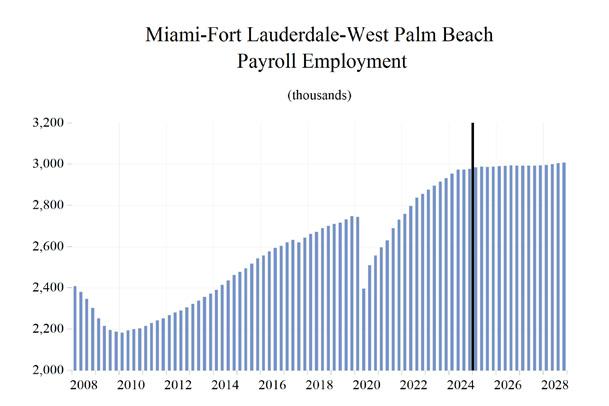
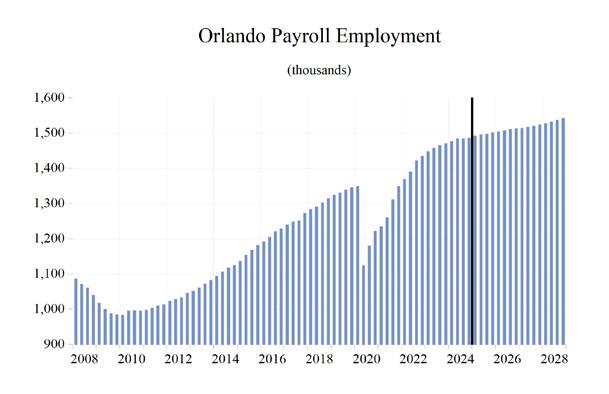
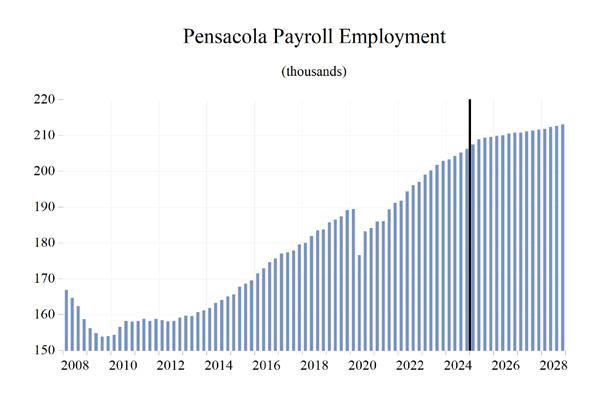
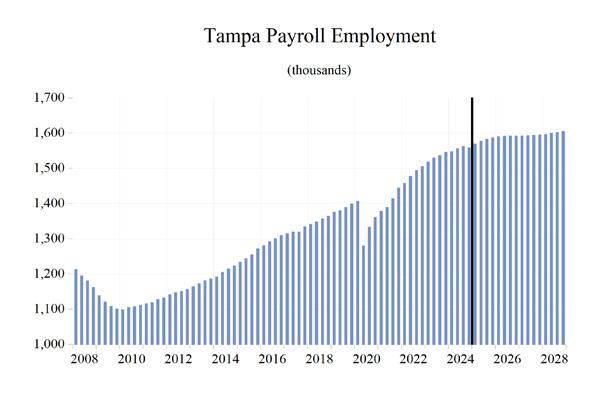
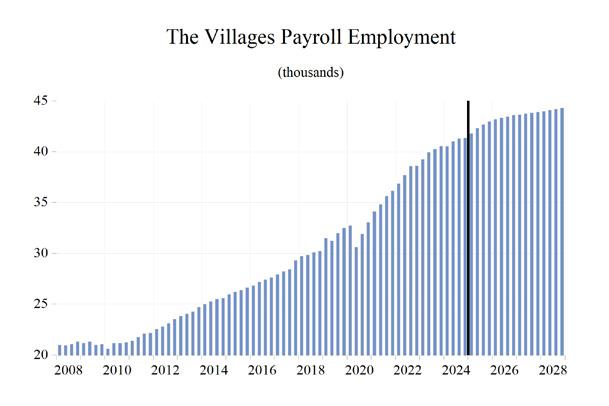
Business payrolls were devastated by the COVID-19 lockdowns, as layoffs happened in a massive, but thankfully short-lived, wave. In Florida, total business payrolls surpassed their pre-pandemic levels late in 2021 as Florida ended ill-advised lockdowns much sooner than most other states. Since then, the pace of Florida’s labor market recovery has exceeded the recovery of the national job market, and it will continue to do so throughout the remainder of our forecast horizon in 2028.
The COVID-19 lockdowns, closures, and travel restrictions, were followed by aggressive federal spending and monetary policies to counter the devastating effects of shutting down the economy. Job growth plummeted in March and April, contributing to a 4.9% year-over-year contraction in 2020, but Florida’s decision to open the economy and avoid further lockdowns caused job growth to roar back to 4.6% in 2021, accelerating to 5.7% in 2022.
In 2024, the effects of the slowing economy impacted job growth. Total payroll jobs rose by 3.3% in 2023 and then decelerated to 2.1% growth in 2024. The deceleration will continue to 1.3% in 2025, 0.7% in 2026, 0.3% in 2027 before ticking up 0.6% in 2028. Florida’s labor market will continue to outperform the national economy each year through 2028.
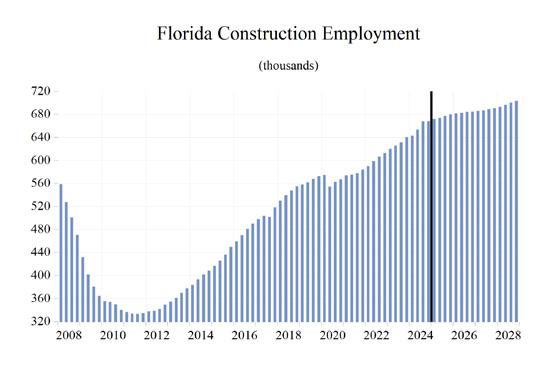
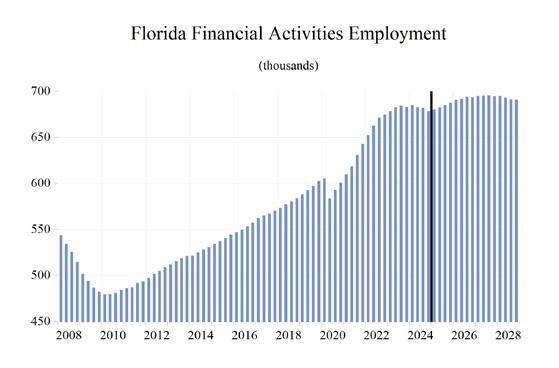
Construction job growth turned slightly negative in 2020 but increased in 2021, with housing starts rising amid depleted inventories and as large-scale public works projects that carried on uninterrupted by COVID. Construction job growth of 4.2% in 2019 fell to -0.1% in 2020 and then recovered to 2.3% in 2021. Job growth rose to 4.2% in 2022 and grew by 4.5% in 2023, and by 4.9% in 2024. Job growth will slow to 2.7% in 2025, 1.1% in 2026, and 0.7% in 2027 then rise to 1.5% in 2028. Average annual job growth during 2025-2028 will be 1.5%. Construction employment will average 698,588 in 2028.
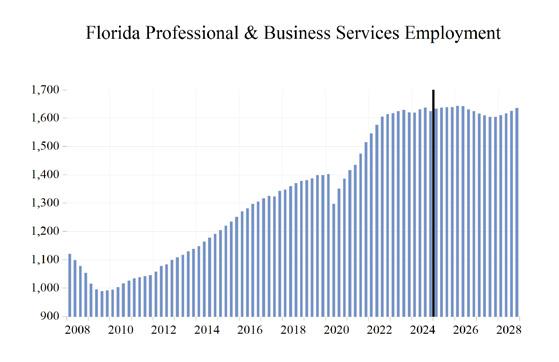
The Professional and Business Services sector, one of the fastest-growing sectors coming out of the COVID recession, is in for a deceleration as the economic slowdown develops. Job growth in this sector is expected to average -0.1% during 2025-2028. Growth in this sector fell to -2.3% in 2020 due to the pandemic and lockdowns. Growth surged to 7.4% in 2021 and then to 8.6% in 2022. It slowed to 2.4% in 2023 and continued to trend lower at 0.3% in 2024. In 2025, growth should be 0.5%, then after a couple of years of mild job losses of 0.1% and 1.6% in 2026 and 2027, growth resumes at 0.8% in 2028.
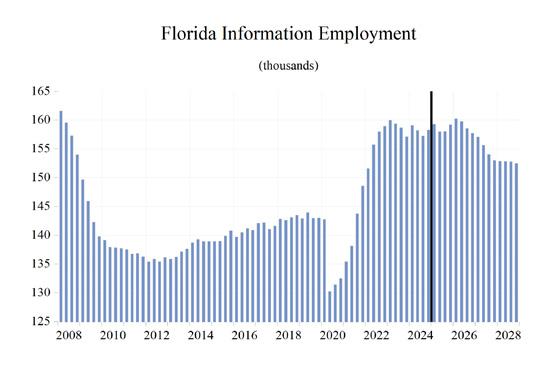
The Information sector is a mix of high-tech ventures, including computer programming and software development, but job growth in this sector has long been weighed down by the unraveling of the traditional print media. Structural and technological changes in the gathering and dissemination of information decimated the print industry. Sources of growth within the information sector in Florida such as software development, data processing and hosting, wireless telecommunications, and content creation and they have offset the loss of jobs in traditional print media and publishing. Job growth dropped to -6.2% in 2020, recovered to 5.4% in 2021, and hit 10.3% in 2022—boosted by the roll-out of 5G wireless services. Job growth slowed to 1.7% in 2023 before it slid to -0.4% in 2024. Growth should come in at 0.3% in 2025 and
2026 and then contract by 2.6% in 2027 and 1.4% in 2028. The projected growth rate will average -0.9% during 2025-2028.
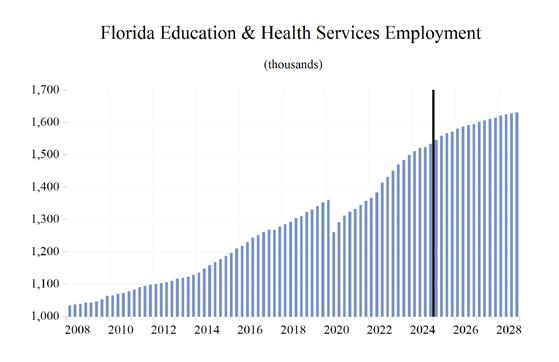
The Education and Health Services sector in Florida has grown consistently, even during the worst part of the 2007-2009 Great Recession. However, the pandemic hit this sector hard, as schools closed and most elective procedures, screenings, and wellness checks were postponed; employment contracted by 2.3% in 2020. The state’s growing population, with a larger share of older residents with a higher demand for health services, has supported growth in this sector and will continue to do so. Job growth will continue, though at a decelerated pace, through the next several years. During 2025-2028, employment in this sector is expected to continue to expand at an average rate of 1.4%.
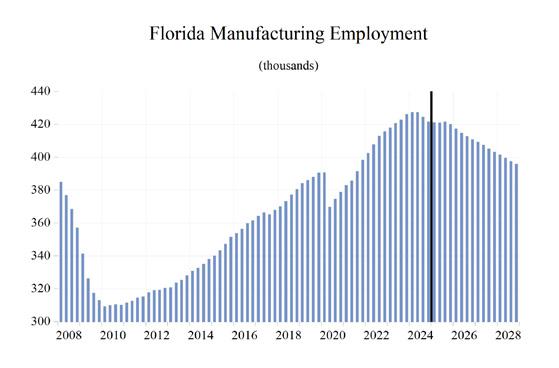
During 2016-2019, Manufacturing job growth averaged 2.9% in Florida, as trade policies helped level the playing field for U.S. manufacturers. The economic environment for the manufacturing sector is increasingly uncertain as slower economic growth looms over the U.S. and the “Tariff Tango” is in full swing. After job losses of 2.2% in manufacturing in 2020, the economy and manufacturing in Florida came back to life. Job growth accelerated to 2.9% in 2021 and rose by 5.2% in 2022. After that year’s burst, job growth decelerated to 2.9% in 2023 and then slowed to 0.8% in 2024; the sector will once again lose jobs from 2025 through 2028. Average job growth during 2025-2028 will be -1.6%.
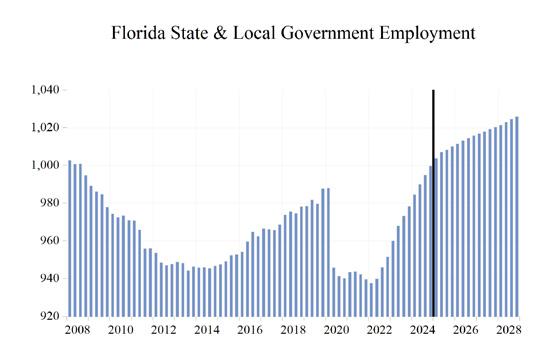
The State and Local Government sector in Florida is enjoying higher revenues from increased property values and state sales tax revenues that continue to exceed forecasts. As housing prices soared during 2020-22, property tax revenues rose as well. Though housing price growth has slowed, there will not be a repeat of the local government budget shortfalls after the housing market crashed which led to job losses in this sector that persisted for six years from 2009 through 2014.
As Florida’s population and economy continue to grow, the demand for state and local government services continues to rise as well. To meet this demand, growth in state and local government employment will be necessary despite DOGE arriving in Tallahassee, but not to the levels seen during the housing boom. Average job growth in State and Local Government during 2025-2028 will be 0.8%, after annual growth hitting 2.8% in 2023 and slowing to 2.3% in 2024. The slowing economy may eventually put some pressure on both sales and property tax revenue growth (assuming the latter isn’t overturned), but this should not result in any severe budgetary issues or layoffs in the sector.
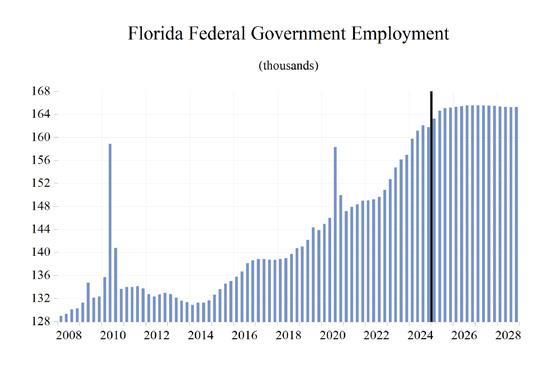
Federal Government employment growth boosted by the decennial census hiring turned negative in 2021 after the temporary hiring surge during the 2020 census year ended. However, historic deficits, a national debt of over $36.5 trillion, and an increasing debt service burden along with DOGE being in full swing will become considerable factors going forward. Job growth in the Federal Government sector in Florida will average 0.6% during 2025-2028.
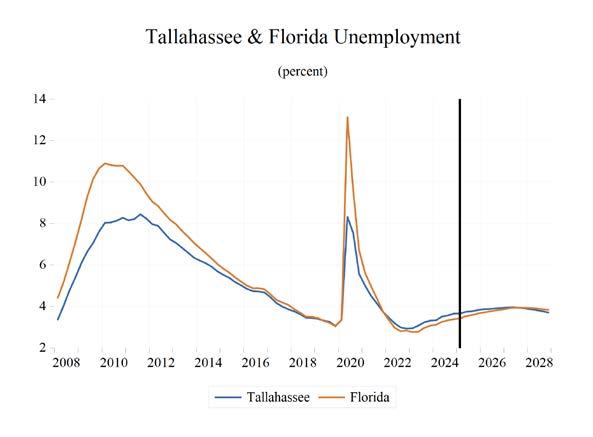
UNEMPLOYMENT
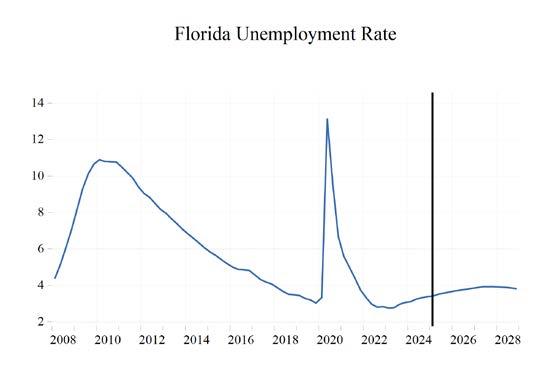
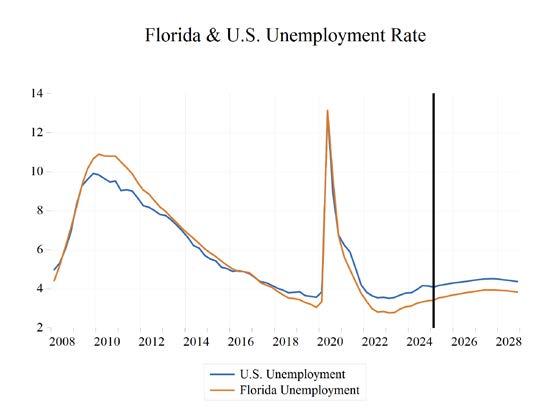
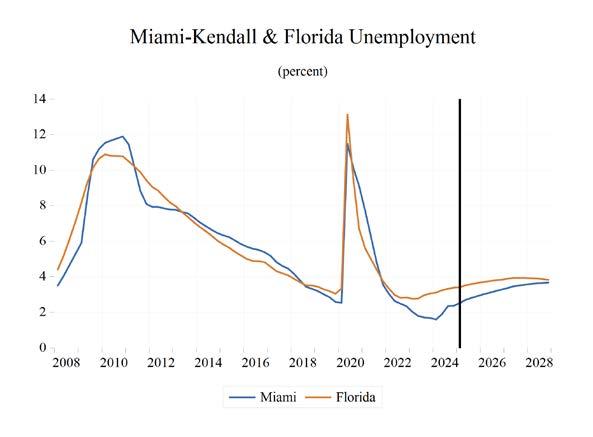
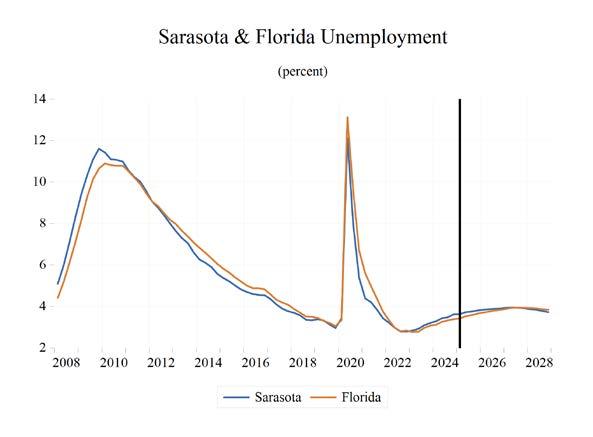
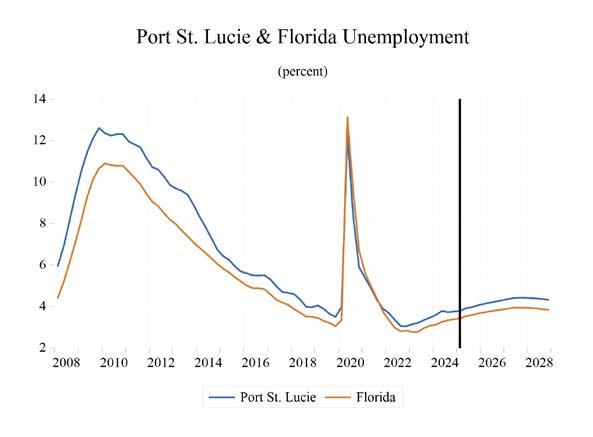
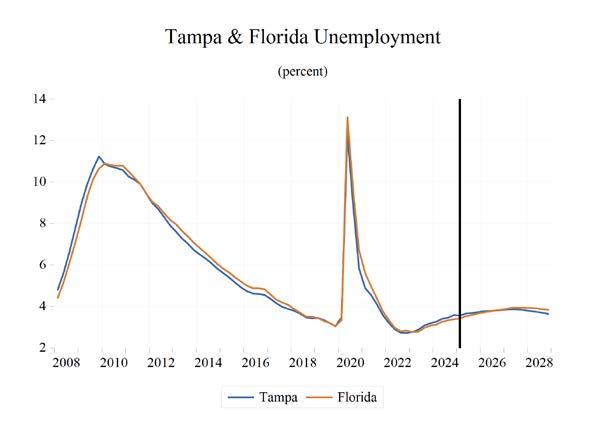
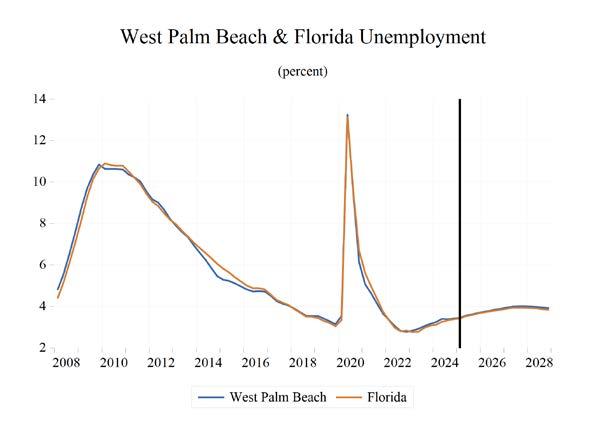
The unemployment rate in Florida has fallen from its May 2020 peak of 14.2% and stands at 3.4% as of December 2024. When unemployment spiked to 14.2% in May 2020, it was 2.9 percentage points higher than the peak level of unemployment from the Great Recession. This unprecedented spike in unemployment transpired over just three months, while it took two-anda-half years for the unemployment rate to peak in the Great Recession. The December 2024 unemployment rate is up 0.3 percentage points from a year ago and is 0.7 percentage points lower than the U.S. unemployment rate.
Both nationally and in Florida, the number of workers who are working part-time, but not by choice, and workers marginally attached to
the labor force—defined as workers who are not currently employed or seeking employment but express a desire to work, are available for a job, and have searched for work within the past 12 months —spiked during the public health shutdowns. When adding these groups with discouraged workers—defined as workers who are currently not working and did not look for a job in the four weeks preceding the Bureau of Labor Statistics’ monthly survey of households—to the headline unemployment figure, U-3, we get the broadest measure of unemployment estimated by the BLS, known as U-6.
Looking at U-6, we see a labor market in Florida that remains the strongest in several decades. U-6 in Florida averaged 6.6% during 2024. Meanwhile, the national rate of U-6 averaged 7.5% during the same period. U-6 unemployment in Florida during 2024 was 5.5 percentage points below the U-6 rate in 2014, 9.4 percentage points lower than the 16% rate in 2012, and down 12.7 percentage points from its peak average rate of 19.3% in 2010 (the nation’s U-6 averaged 16.7% in 2010). As the national economy continues to slow, these numbers will begin drifting slightly higher in Florida in the face of a slowing national economy.
Analysis of how U-6 behaves relative to the headline unemployment rate (U-3) continues to provide valuable information necessary to fully comprehend the health of the labor market. The gap between these two measures continues to narrow. The average spread between U-6 and U-3 during 2024 was hovering at 3.5% at the national level. That gap was the same for 2024 in Florida.
Table 1. Annual Summary of the University of Central Florida's Forecast for Florida 202020212022202320242025202620272028
Personal Income and GSP
PersonalIncome(Bil.$)1220.81358.81436.11553.41645.41729.21833.61939.42046.3
Florida.(%ChYearago)6.511.35.78.25.95.16.05.85.5
U.S.(%ChYearago)6.89.23.15.95.55.15.75.14.9
PersonalIncome(Bil.2012$)1159.61230.31209.41246.21286.71318.91361.01409.61459.3
Florida.(%ChYearago)4.46.1-1.73.03.32.53.23.63.5
U.S.(%ChYearago)5.74.9-3.32.12.92.32.82.92.9
Disp.Income(Bil.2012$)1032.41083.41042.21105.91141.61176.71221.01265.41310.4
Florida.(%ChYearago)4.04.9-3.86.13.23.13.83.63.6
U.S.(%ChYearago)6.33.5-5.65.12.92.83.43.02.9
GSP(Bil.$)1142.01298.61465.31600.81705.41802.41900.41979.72067.8 (%ChYearago)0.713.712.89.26.55.75.44.24.5
GSP(Bil.2012$)1069.81170.51239.91292.81339.61373.31404.01428.91459.1 (%ChYearago)-1.49.45.94.33.62.52.21.82.1
Employment and Labor Force (Household Survey % Change Year Ago)
Employment-4.94.65.73.32.11.30.70.30.6
LaborForce-1.82.53.62.80.70.50.60.50.5
FLUnemploymentRate(%)8.24.73.02.93.33.53.83.93.9 U.S.UnemploymentRate(%)8.15.43.63.64.04.24.44.54.4
Nonfarm Employment (Payroll Survey % Change Year Ago)
TotalNonfarm
U.S.-5.82.94.32.21.31.10.40.00.1 Florida-4.94.65.73.32.11.30.70.30.6 Mining-3.7-0.92.83.93.6-1.50.32.10.3 Construction-0.12.34.24.54.62.71.10.71.5 Manufacturing-2.22.95.22.90.8-1.0-1.7-1.8-1.9 NondurableGoods-3.32.65.12.73.5-0.9-2.2-1.1-0.8 DurableGoods-1.73.15.23.1-0.5-1.0-1.4-2.2-2.4
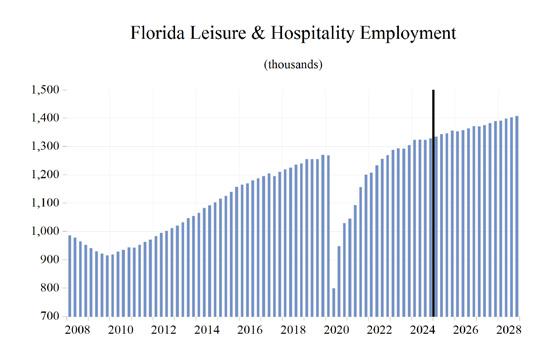
Trans.Warehs.&Utility-3.25.25.22.32.20.9-0.10.3-0.3 WholesaleTrade-2.82.85.73.73.41.30.41.0-0.5 RetailTrade-4.74.14.01.91.70.4-0.9-0.1-0.2 FinancialActivities0.15.06.32.50.00.31.30.4-0.4 Prof.andBusinessServices-2.37.48.62.40.30.5-0.1-1.60.8 Edu&HealthServices-2.32.64.45.53.12.51.81.21.1 Leisure&Hospitality-19.711.210.54.32.31.51.31.31.5 Information-6.25.410.31.7-0.40.30.3-2.6-1.4 FederalGov't.4.9-1.11.13.63.92.10.60.0-0.1 State&LocalGov't.-2.9-1.20.22.82.31.50.60.50.5
Population and Migration
Population(ths)21614.021901.922447.322963.723409.023650.423789.923945.224109.9 (%ChYearago)1.11.32.52.31.91.00.60.70.7
NetMigration(ths)60.0109.5148.4122.8102.142.438.542.445.5 (%ChYearago)6.182.535.5-17.3-16.9-58.4-9.210.27.3
HousingStartsTot.Private(ths)157.8193.1193.8183.7165.1158.9158.8158.8161.1
HousingStartsSingleFamily(ths)111.6144.1133.8127.1125.8121.0115.3111.4108.2
HousingStartsMulti-Family(ths)46.149.060.056.539.337.943.547.352.9
Consumer Prices
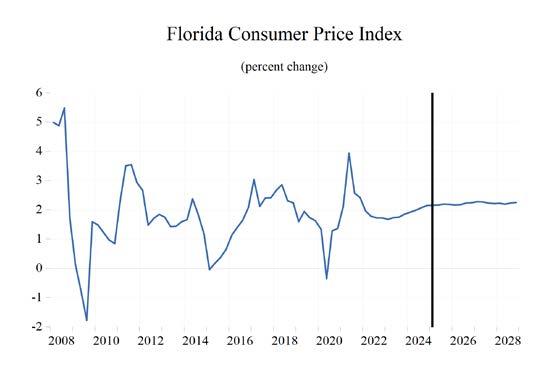
(%ChYearago)1.25.49.66.12.92.93.02.42.0
Table 2. Quarterly Summary of the University of Central Florida's Forecast for Florida*
2024Q42025Q12025Q22025Q32025Q42026Q12026Q22026Q32026Q42027Q12027Q22027Q32027Q4
Personal Income and GSP
PersonalIncome(Bil.$)1670.11691.11713.71743.41768.81797.11822.61845.31869.51899.61926.71953.11978.4
Florida.(%ChYearago)1.21.31.31.71.51.61.41.21.31.61.41.41.3
U.S.(%ChYearago)1.31.31.31.61.41.61.31.11.21.51.21.21.1
PersonalIncome(Bil.2012$)1297.31303.61312.01325.01335.11346.21356.61365.71375.51389.71403.61416.81428.5
Florida.(%ChYearago)0.70.50.61.00.80.80.80.70.71.01.00.90.8
U.S.(%ChYearago)0.70.50.50.80.70.80.70.50.60.90.80.70.7
Disp.Income(Bil.2012$)1150.71156.41163.91188.81197.61207.61216.91225.31234.31247.41259.91271.91282.4
Florida.(%ChYearago)0.70.50.62.10.70.80.80.70.71.11.00.90.8
U.S.(%ChYearago)0.70.50.61.80.70.80.70.50.60.90.80.80.7
GSP(Bil.$)1738.11765.01789.81814.21840.81869.51890.11910.81931.01949.81969.51988.92010.5
(%ChYearago)1.21.51.41.41.51.61.11.11.11.01.01.01.1
GSP(Bil.2012$)1353.51362.61370.41376.21384.11392.81400.91408.21414.21419.21425.31431.91439.3
(%ChYearago)0.60.70.60.40.60.60.60.50.40.40.40.50.5
Employment and Labor Force (Household Survey % Change Year Ago)
Employment0.10.50.40.20.20.10.10.10.00.00.10.10.1
LaborForce-0.30.50.40.10.10.20.10.10.10.10.10.10.1
FLUnemploymentRate(%)3.43.43.53.63.73.73.83.83.83.93.93.93.9
U.S.UnemploymentRate(%)4.24.14.24.24.34.34.34.44.44.54.54.54.5
Nonfarm Employment (Payroll Survey % Change Year Ago)
TotalNonfarm
U.S.0.30.40.30.20.10.10.10.00.00.00.00.00.0
Florida0.10.50.40.20.20.10.10.10.00.00.10.10.1
Mining-1.3-0.2-0.1-0.1-0.3-0.20.40.60.50.60.70.20.1
Construction0.10.60.30.50.40.20.20.20.10.20.10.30.3
Manufacturing-0.7-0.1-0.10.1-0.3-0.7-0.6-0.5-0.5-0.3-0.5-0.6-0.5 NondurableGoods-1.30.10.0-0.7-0.6-0.7-0.6-0.5-0.3-0.2-0.2-0.3-0.3
DurableGoods-0.4-0.2-0.10.5-0.2-0.6-0.7-0.5-0.6-0.4-0.6-0.7-0.6 Trans.Warehs.&Utility-0.10.60.3-0.2-0.1-0.30.10.4-0.10.00.20.1-0.1 WholesaleTrade0.90.30.1-0.1-0.30.30.20.50.20.50.2-0.1-0.1 RetailTrade-0.50.70.4-0.2-0.2-0.70.00.2-0.3-0.20.20.2-0.2
FinancialActivities-0.50.30.30.30.40.40.20.3-0.10.20.00.0-0.1
Prof.andBusinessServices-0.70.50.20.10.00.3-0.1-0.7-0.4-0.5-0.4-0.30.0 Edu&HealthServices0.70.80.80.50.40.50.40.40.20.40.30.30.2 Leisure&Hospitality0.30.60.60.20.7-0.10.20.50.6-0.10.40.50.5
Information0.70.6-0.80.00.70.6-0.3-0.7-0.5-0.4-0.9-1.0-0.7
FederalGov't.-0.20.90.90.20.10.10.10.10.00.00.00.00.0 State&LocalGov't.0.50.40.30.10.20.10.20.10.10.10.10.10.1
Population and Migration
Population(ths)23,540.923,597.523,634.723,668.123,701.423,735.423,770.723,807.423,845.923,885.523,925.223,965.024,005.2
(%ChYearago)0.30.20.20.10.10.10.10.20.20.20.20.20.2
NetMigration(ths)76.158.939.635.635.636.337.639.141.042.142.442.442.8 (%ChYearago)-21.4-22.5-32.8-10.20.02.23.54.04.82.90.60.10.9
HousingStartsTot.Private(ths)153.8157.0159.0160.1159.6158.8158.5159.2158.9158.9158.7158.4158.9
HousingStartsSingleFamily(ths)118.4121.8121.8121.1119.4117.3115.7114.5113.6112.7111.7111.0110.2
HousingStartsMulti-Family(ths)35.435.237.238.940.341.542.744.645.346.247.047.548.7
Housing Consumer Prices
(%ChYearago)0.80.90.70.70.70.90.80.70.80.70.40.40.5
*Quarterlyatanannualrate
Table 3. Employment Quarterly*
2024Q42025Q12025Q22025Q32025Q42026Q12026Q22026Q32026Q42027Q12027Q22027Q32027Q4
Florida Payroll Employment (Thousands)
TotalNonfarm9,986.110,041.010,080.710,100.110,120.810,135.010,149.110,161.910,166.210,168.310,177.310,186.910,196.5 Manufacturing421.6421.3421.0421.6420.1417.4414.7412.8410.8409.4407.5405.2403.3
DurableGoods285.7285.3285.0286.5285.9284.1282.1280.9279.2278.1276.4274.5272.9 WoodProducts14.915.115.315.515.515.415.315.515.615.715.916.016.1
Computer&Electronics45.845.545.345.245.145.045.045.145.145.045.044.844.7 TransportationEquipment55.755.555.857.157.657.957.757.657.256.856.155.454.8 Nondurables135.9136.0136.0135.1134.3133.4132.6131.9131.5131.3131.1130.7130.4 Foods38.938.938.938.738.538.338.138.038.038.138.138.238.2 Non-Manufacturing9,564.59,619.79,659.79,678.69,700.69,717.69,734.49,749.19,755.49,758.99,769.89,781.79,793.3 Mining5.95.95.95.95.95.95.95.96.06.06.06.16.1
Construction668.4672.1674.2677.6680.2681.8682.9684.3685.0686.4687.1688.8691.1 Trans.Warehs.&Utility2,016.42,028.12,034.42,031.42,028.52,022.82,024.92,032.12,031.02,031.92,035.22,036.82,034.3 WholesaleTrade408.8410.1410.4409.9408.7409.8410.5412.4413.3415.3416.2415.9415.5 RetailTrade1,164.11,171.91,176.51,173.61,171.01,162.61,162.41,165.31,161.81,159.61,161.71,163.91,161.8 Information158.3159.3158.0158.1159.2160.2159.8158.6157.8157.1155.7154.1153.0 Prof.&Bus.Services1,625.41,634.21,636.71,639.01,638.61,644.21,643.31,631.51,624.91,616.61,610.11,605.01,605.4 Admin.&Support741.8748.0751.7750.7747.6745.8742.1727.9726.5724.0721.3720.1718.8 Prof.Sci&Tech130.8131.3131.2131.3131.3131.4131.7131.9131.9132.0131.8131.5131.3 Mgmt.ofCo.752.7754.9753.8757.0759.7766.9769.5771.7766.6760.7756.9753.4755.3 FinancialActivities678.6680.5682.9685.0687.6690.7691.8694.1693.7695.1695.4695.6694.7 RealEstate&Rent464.0465.0466.1468.5471.4474.4475.7478.2478.0479.1479.3479.7479.1 Fin.&Insurance214.6215.5216.8216.5216.2216.3216.0215.9215.7216.0216.1215.9215.7 Edu.&HealthService1,533.61,545.81,558.41,566.21,571.81,580.31,586.11,591.71,594.71,601.01,606.21,610.71,613.8 EducationServices208.1208.4209.1208.8209.4210.8211.2211.3211.5212.8214.1215.4217.0 HealthServices1,325.51,337.41,349.31,357.41,362.41,369.51,374.91,380.41,383.21,388.21,392.11,395.41,396.8 Leisure&Hospitality1,328.11,335.51,343.61,346.31,355.61,354.11,357.51,364.61,372.21,370.71,376.21,382.81,389.5 OtherServices388.4391.3393.8395.8397.9400.8403.6406.2408.7411.6414.4417.0419.7 Government1,161.41,167.01,171.71,173.31,175.21,176.91,178.61,180.01,181.51,182.41,183.61,184.71,185.7 FederalGov't.161.8163.3164.7165.1165.2165.3165.4165.6165.6165.6165.6165.5165.5 State&LocalGov't999.71,003.81,007.01,008.21,010.11,011.51,013.11,014.41,015.91,016.81,018.01,019.21,020.3
*Quarterlyatanannualrate
202020212022202320242025202620272028
Florida Payroll Employment (Thousands)
TotalNonfarm8,534.48,930.79,440.99754.119,954.410,085.710,153.010,182.310,241.7
Manufacturing378.6389.7409.9421.9425.2421.0413.9406.3398.7
DurableGoods259.4267.5281.4290.0288.6285.7281.6275.5268.9
WoodProducts14.014.315.215.215.015.415.515.916.3
Computer&Electronics44.344.345.547.046.645.345.044.944.2 TransportationEquipment48.350.754.057.156.456.557.655.853.2
Nondurables119.2122.2128.5131.9136.6135.4132.3130.9129.8 Foods33.634.235.737.339.238.738.138.238.4
Non-Manufacturing8,155.88,541.09,031.19,332.29,529.29,664.69,739.19,775.99,843.0 Mining5.55.45.65.86.05.95.96.06.1
Construction564.7577.9602.4629.3658.3676.0683.5688.3698.6 Trans.Warehs.&Utility1,740.31,831.11,925.71,970.02,013.22,030.62,027.72,034.62,028.9 WholesaleTrade347.0356.7377.0391.0404.4409.8411.5415.8413.6 RetailTrade1,042.71,085.01,128.31,149.41,168.91,173.21,163.01,161.81,159.2 Information134.3141.5156.1158.8158.2158.7159.1155.0152.8
Prof.&Bus.Services1,359.51,460.61,586.01,623.61,628.71,637.21,636.01,609.31,622.8 Admin.&Support602.5651.1710.4739.4746.0749.5735.6721.0716.6
Prof.Sci&Tech111.8115.6125.9134.5132.9131.3131.8131.7130.8 Mgmt.ofCo.645.1693.9749.8749.7749.8756.4768.7756.6775.4
FinancialActivities595.9625.8665.5682.4682.2684.0692.6695.2692.6
RealEstate&Rent408.2429.2454.3464.5464.6467.7476.6479.3477.5
Fin.&Insurance187.7196.6211.2217.8217.6216.3216.0215.9215.1
Edu.&HealthService1,305.71,339.71,398.71,475.71,522.21,560.61,588.21,607.91,625.8 EducationServices168.4178.1191.8202.0205.7208.9211.2214.8220.8
HealthServices1,137.31,161.61,206.91,273.71,316.51,351.61,377.01,393.11,404.9
Leisure&Hospitality1,011.51,124.31,242.11,295.01,325.21,345.21,362.11,379.81,400.3
OtherServices334.9344.2355.6366.5381.8394.7404.8415.7426.2 Government1,103.61,090.41,093.51,125.11,153.51,171.81,179.21,184.11,189.0
FederalGov't.149.8148.1149.7155.2161.2164.6165.5165.5165.3
State&LocalGov't953.8942.3943.8969.9992.31,007.31,013.71,018.61,023.6
2024Q42025Q12025Q22025Q32025Q42026Q12026Q22026Q32026Q42027Q12027Q22027Q32027Q4
Billions Current Dollars
PersonalIncome1670.11691.11713.71743.41768.81797.11822.61845.31869.51899.61926.71953.11978.4
Wages&Salaries743.1753.6764.1777.8792.0806.5818.2826.4834.7843.7853.8863.8873.7
OtherLaborIncome149.4151.5153.7156.5159.1161.9163.8165.1166.5168.4169.8171.3173.1
Nonfarm87.788.690.090.590.991.892.996.298.7100.5101.8103.4104.9
Farm0.91.01.11.11.31.41.51.51.61.61.71.71.7
PropertyIncome465.6468.7474.5485.0491.0495.7503.3509.8517.8528.2539.0548.3556.9
TransferPayments334.7340.3344.1348.0351.8359.4363.8367.9372.5380.7385.3389.7394.4
SocialInsurance115.5117.1118.2119.8121.5123.8125.2126.1126.8128.0129.1129.7130.9
Billions 2012 $
PersonalIncome1297.31303.61312.01325.01335.11346.21356.61365.71375.51389.71403.61416.81428.5
Wages&Salaries577.2580.9585.0591.1597.8604.1609.0611.7614.2617.2622.0626.7630.9
OtherLaborIncome116.0116.8117.7119.0120.1121.3121.9122.2122.5123.2123.7124.3125.0
Nonfarm68.168.368.968.868.668.869.171.272.673.574.175.075.7 Farm0.70.80.80.90.91.01.11.11.21.21.21.21.2
PropertyIncome361.6361.3363.3368.6370.6371.3374.6377.3381.0386.4392.7397.7402.1
TransferPayments259.9262.4263.4264.5265.5269.2270.8272.3274.1278.5280.7282.7284.8
SocialInsurance89.790.290.591.191.792.793.293.393.393.794.094.194.5
NewPassengerCar&TruckRegistrations1497.71428.21434.91438.81449.41442.21446.01451.41456.71457.51458.21462.31461.5
RetailSales(Billions$)528.8537.0543.1550.3557.3565.0571.2578.1584.2589.7595.7601.5607.5
RealRetailSales(Billions2012$)410.8414.0415.8418.2420.6423.2425.2427.8429.9431.4434.0436.4438.7
*Quarterlyatanannualrate
202020212022202320242025202620272028
Billions Current Dollars
PersonalIncome1220.81358.81436.11553.41645.41729.21833.61939.42046.3
Wages&Salaries512.1578.0641.5688.0731.6771.9821.5858.8900.5
OtherLaborIncome105.8114.7122.6137.0146.6155.2164.3170.6178.2 Nonfarm65.678.076.682.386.790.094.9102.6108.2
Farm0.80.91.11.10.81.11.51.71.7
PropertyIncome339.6359.0399.1444.1462.4479.8506.7543.1578.0
Billions 2012 $
PersonalIncome1159.61230.31209.41246.21286.71318.91361.01409.61459.3
FLORIDA NEWS SUMMARIES
USTA Florida Unveils Inaugural Economic Impact Report Showing $145.9 Million Return on Tournaments & Events
• The Oxford Economics company Tourism Economics conducted an Economic Impact Report on behalf of USTA Florida that highlighted the large impact of tennis tournaments and events in Florida in 2023. They found an economic impact of $145.9 million.
• They found that the events attracted 92,456 participants and 160,325 spectators which generated direct spending of $81.8 million. The total impact supported 1,007 full and part-time jobs which contributed to $11.4 million in state and local taxes.
• They found that each dollar spent by USTA Florida generated $12.84 in visitor spending, $6.95 in total income, and $1.80 in state and local taxes. They found that the events brought lots of tourists, and non-local attendees accounted for 112,838 participants and spectators.
Source: USTA Florida, December 5, 2024
State reports record-breaking $131 billion spent by tourists in 2023
• F lorida saw a record number of tourists in 2023, with nearly 157 million out-of-state visitors which is a 1.4% increase from 2022. The report came from Rockport Analytics and was commissioned by Visit Florida.
• They found that visitors spent $131 billion in Florida, an increase of 4.9% compared to 2022. Of that, $38 billion was spent on lodging and $33.5 billion was spent on food and beverages. Visitors generated $36.9 billion in federal, state, and local taxes. It claims that every Florida household received $1,910 in tax savings due to the tourism activity.
• The report also found that Florida is outpacing the country in its Covid-19 recovery. It states, “While both Florida and the U.S. have not fully rebounded in international visitor spending, Florida has moved beyond pre-pandemic benchmarks in tourism GDP, employment, and domestic visitor spending –areas where the U.S. has only recently caught up. Florida’s recovery momentum continues to outpace the national average since the 2020 downturn.”
Source: Florida Phoenix, December 10, 2025
Economic Forecast 2025: Tampa Bay’s Industry Trends to Watch
• Tampa Bay seems to have a strong trajectory with industries like technology, real estate, and tourism setting the stage for significant economic development.
• Tampa Bay’s technology sector is anticipating significant developments in 2025. Over the past 5 years, the area saw a 30% increase in IT job growth and is expected to add more than 3,700 jobs by 2027. Initiatives such as CyperTechIX Accelerator at the Tampa Bay Wave, along with Embarc Collective have fostered over 500 startups focused on cutting-edge cyber products.
• Some big projects include a $6.5 billion Historic Gas District Redevelopment and a 50-acre mixed-use development Ybor City’s Gas Worx. The redevelopment also features a $1.3 billion stadium for the Tampa Bay Rays, with an anticipated opening of 2028.
Source: TTBW, January 15, 2025
South Florida’s foreclosure rate among highest in the nation, report says
• Property data company Attom released a report stating that South Florida had the 14th highest foreclosure rate in the nation in 2024. In the Miami-Fort Lauderdale-West Palm Beach metro area, one in every 247 housing units and properties were under foreclosure, a 4.14% increase compared to 2023. 8,603 of the 10,696 foreclosures were foreclosure starts.
• The report found that the entire state of Florida tied with New Jersey for the highest foreclosure rate in 2024, with one out of every 267 housing units having foreclosure filings in 2024.
• In South Florida, home and rental prices soared during the Covid-19 pandemic due to highincome households moving to the area to avoid state income taxes and Covid-19 restrictions. Housing prices are increasing at a slower rate compared to prior years, whereas sale volumes have been going down. In the U.S. foreclosure filings went down 10% year-over-year.
Source: South Florida Business Journal, January 24, 2025
What’s at risk for Florida in the US-Canada trade tensions? Citrus and sightseers
• F lorida is getting caught up in the trade disputes between the U.S. and Canada, despite the agreed pause on the tariffs. With the threat of trade tensions, Florida’s orange juice will be more expensive in Canada as Prime Minister Justin Trudeau warned grocery shoppers they might have to “forego Florida’s orange juice altogether.”
• 60% of American orange juice exported to Canada comes from Florida, and Canada accounts for most of Florida’s orange and tangerine exports according to the USDA. Outside of trade, tourism could also be negatively affected.
• In 2023, Canadians were the top international tourists to Florida and spent $700 million in just Broward County. Compared to 2022, 20% more Canadian tourists visited in 2023. Prime Minister Justin Trudeau warned Canadians to consider changing their vacation plans before agreeing to the 30-day pause on tariffs.
Source: WLRN, February 3, 2025
Nearly 80% of Tampa Bay architects say hurricanes hurting business
• The Tampa Bay chapter of the American Institute of Architects (AIA) annual survey of 96 architects found that 65.6% of architects expect more work in 2025, a steep decline from the 85% in 2022. A suspected factor for this decline is the uncertainty surrounding development following hurricanes Helene and Milton.
• The survey found that 77.3% of architects expect project costs to rise. The AIA claims that the survey is useful in predicting real estate development in the Tampa Bay area. Other notable findings are that 60.4% of architects have cut costs due to higher interest rates and only 41% are optimistic about the national economy.
• “ Back-to-back hurricanes have introduced new challenges, from rising project costs to the need to rebuild damaged structures in a manner that matches the latest codes,” said Jody Beck, the chapter president of Traction Architecture.
Source: Business Observer Florida, February 24, 2025
PROFILES
The Cape Coral MSA is comprised of Lee County, located on the southwest coast of Florida. Known for its extensive canal system, Cape Coral boasts over 400 miles of canals, the most of any city in the world. It is also recognized as the largest master-planned community in the U.S.
QUICK FACTS
• Metro population estimate of 834,573 as of 2023 (ACS 5-Year Estimate) (U.S. Census Bureau).
• L ee County population estimate of 834,753 as of 2023 (ACS 5-Year Estimate).
• Civilian labor force of 376,970 in December 2024 (FRED, U.S. Bureau of Labor Statistics).
• A n unemployment rate of 3.1% as of December 2024, not seasonally adjusted. This amounts to 11,769 unemployed people (FRED, U.S. Bureau of Labor Statistics).
OUTLOOK SUMMARIES
The studied economic indicators are predicted to show strong levels of growth in the Cape Coral Metropolitan Statistical Area (MSA). Gross Metro Product for the MSA will come in at $43,310.7 million. Real per-capita income is expected to average $56,900, the 9th highest, and the MSA is ranked 4th in personal income growth at 6.5 percent. The average annual wage will grow at an annual rate of 4.4 percent to $75,900. Cape Coral’s population will grow at the 2nd highest rate, at an annual rate of 2.4 percent. Employment growth is expected to average 1.5 percent, and Cape Coral will experience a relatively average unemployment rate in the state at 3.7 percent. The Other Services sector will lead the MSA in average annual growth at 4.7 percent. The Leisure sector will follow at 2.9 percent. The Information sector and Manufacturing sector will see contractions in growth of -1.2 and -1.0 percent respectively.
METRO NEWS SUMMARIES
Developer pays record $100 million for 1,745 acres of raw land in Cape Coral
• The 1,745-acre Hudson Creek property in Cape Coral sold for a record $100 million, marking the largest unimproved land transaction in Lee County’s history. It is already approved for a large-scale mixed-use development, including up to 3,500 homes and 425,000 square feet of commercial space.
• The site will feature residential, commercial, and recreational spaces, with approvals for 150,000 square feet of office space, an 800bed assisted living center, and a 500-room hotel. Additionally, a 3,000-student university is planned, significantly boosting the area’s growth.
Source: News Press, December 13, 2024
City eyes another land buy for Bimini Basin East project
• The Cape Coral City Council is advancing the $40 million Bimini Basin East project, which includes acquiring 43 parcels (18.73 acres) for development in the downtown entertainment district. The city has already purchased these parcels for $40 million, and a $1.8 million demolition contract has been awarded to Honc Destruction, Inc. for site preparation.
• The city is proposing changes to its land development code through Ordinance 79-24, which would introduce technical requirements for plat vacations and impose a one-time payment into the city’s tree fund for certain land-use applications, aiming to ensure public interests are maintained when private land rights are relinquished.
• The Cape Coral City Council is pushing for state and federal legislative support on various infrastructure and environmental projects, including the widening of State Road 78/Pine Island Road and a new I-75 interchange.
• The Council is exploring grants for strengthening commercial property resilience against disasters, aiming to enhance the local economy’s ability to recover after events like wind, flooding, and power outages.
Source: Cape Coral Breeze, December 3, 2024
Cape Coral Expands with Development The Cove at 47th
• The Cove at 47th is set to become South Cape Coral’s first mixed-use development, blending residential units with commercial spaces. The development includes a parking garage for both residents and the public, aimed at alleviating South Cape Coral’s current parking and traffic issues.
• Cape Coral’s population is projected to grow to 375,000 by 2050, creating a need for more mixed-use developments like The Cove to accommodate the growing demand for both housing and business spaces.
Source: WINK, January 10, 2025
Demolition Begins on Bimini East Initiative to Revitalize South Cape
• Demolition began on a 19-acre site east of Bimini Basin on January 21, 2024, marking the start of the Bimini East revitalization project. The site will pave the way for new development, including housing, commercial spaces, and public amenities.
• In August 2024, the City of Cape Coral’s Community Redevelopment Agency (CRA) purchased nearly 19 acres of land for $40 million to jumpstart the redevelopment of a blighted area south of Cape Coral Parkway, aiming to address long-standing challenges from Hurricane Ian’s devastation.
• The project encompasses 43 parcels and is part of a larger strategy to revitalize South Cape Coral, targeting economic growth and community renewal through the creation
of mixed-use spaces that will attract both residents and businesses.
Source: Cape Coral.Gov, January 21, 2025
Ambitious redevelopment plans in the works for former News-Press site in Fort Myers
• The Fort Myers City Council is considering the sale of the 9.8-acre former News-Press building site to Catalyst Community Development for $11.5 million. The deal will also carve out 2+ acres for a new 170,000-square-foot police headquarters.
• The proposed redevelopment includes 600 multifamily homes, 50,000 square feet of retail space, a grocery store, up to 160 hotel rooms, 150,000 square feet of office space, and two parking garages. A portion of the residential units will be designated as workforce housing, targeting households making up to $88,000 annually.
Source: News Press, February 10, 2025
Fort Myers riverfront condo One breaks ground
• One, a 21-story riverfront condominium development in Fort Myers officially broke ground on February 7. The $40 million project will feature 34 luxury units, with prices ranging from $1.25 million to $5.5 million for a penthouse suite.
• With 30% of the units already sold, the project is attracting significant attention. The real estate market in Fort Myers has surged, driven by a migration to the region following the COVID-19 pandemic, as well as relatively affordable pricing compared to markets like Naples and Miami.
• At approximately $850 per square foot, one offers luxury at a fraction of the price seen in other high-end markets.
Source: Gulfshore Business, February 10, 2025
Long Term Outlook for Cape Coral-Fort Myers, FL
March 2025 Forecast
Personal Income (Billions $)
202020212022202320242025202620272028
TotalPersonalIncome44.948.550.655.058.562.066.470.875.4
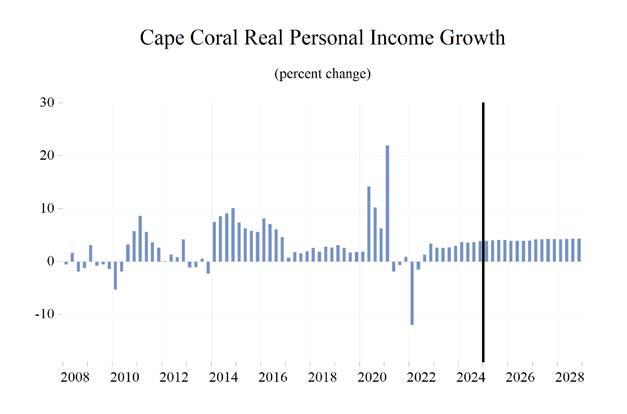
PctChgYearAgo8.38.04.48.76.46.07.06.66.5
WagesandSalaries14.616.518.620.021.222.523.925.226.7
NonwageIncome30.332.032.035.037.339.642.545.648.7
RealPersonalIncome(12$)43.744.542.844.546.147.749.751.954.2
PctChgYearAgo6.81.8-3.94.03.73.44.14.44.5
PerCapitaIncome(Ths)58.561.061.064.967.871.074.978.682.6
RealPerCapitaIncome(12$)57.056.051.652.553.554.656.157.659.4
AverageAnnualWage(Ths)54.457.862.165.067.970.674.677.680.7
PctChgYearAgo7.76.37.44.74.53.95.74.04.0
Establishment Employment (Place of Work, Thousands, SA)
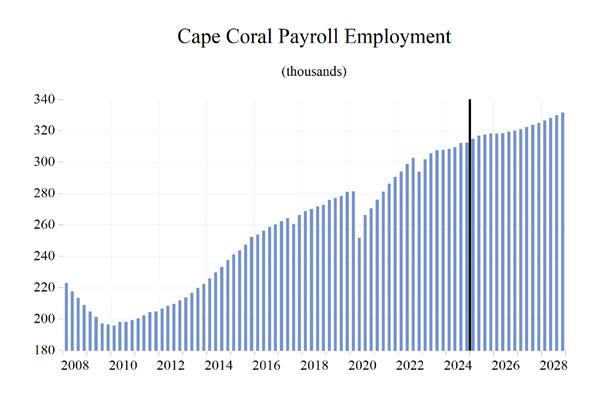
TotalEmployment267.6283.7297.4305.9310.7317.0319.2323.2329.2
PctChgYearAgo-3.86.04.82.81.62.00.71.21.9
Manufacturing6.57.27.98.28.08.18.07.97.7 PctChgYearAgo-0.811.210.63.3-2.00.4-1.4-1.3-1.4 Nonmanufacturing261.1276.5289.5297.7302.7308.9311.2315.3321.4 PctChgYearAgo-3.95.94.72.81.72.10.71.31.9 Construction&Mining32.834.536.841.143.344.344.745.346.6 PctChgYearAgo0.55.36.611.75.42.30.81.52.8 Trade,Trans,&Utilities53.556.158.359.860.561.561.762.663.2 PctChgYearAgo-2.35.04.02.61.11.70.31.41.0 WholesaleTrade7.98.38.58.89.19.49.59.79.9 RetailTrade39.541.542.943.843.944.444.344.644.9 Trans,Wrhsng,&Util6.16.36.97.37.57.77.98.28.4 Information2.93.13.33.63.63.63.53.53.4 PctChgYearAgo0.87.68.77.10.8-1.5-0.4-1.9-0.8 FinancialActivities13.514.315.515.615.415.415.816.216.6 PctChgYearAgo-3.35.97.81.0-1.30.22.02.72.5 Prof&BusinessServices36.740.543.844.945.044.844.243.444.0 PctChgYearAgo-2.410.38.22.50.1-0.3-1.5-1.61.4 Educ&HealthServices30.632.133.334.234.435.236.036.737.4
PctChgYearAgo-2.44.73.92.60.52.32.22.11.8
Leisure&Hospitality37.141.342.640.941.042.943.644.645.9
PctChgYearAgo-14.911.33.1-4.00.44.51.62.52.8 OtherServices10.711.111.411.812.112.713.213.814.5
PctChgYearAgo-7.24.32.43.12.55.04.54.64.8 FederalGovernment2.62.42.42.52.62.62.62.62.6
PctChgYearAgo8.0-7.11.53.91.22.3-0.80.10.8 State&LocalGovernment40.841.142.043.344.946.046.146.547.2
PctChgYearAgo-0.70.72.23.23.62.50.30.91.4
Other Economic Indicators
Population(Ths)767.2795.3828.6847.6862.9873.9886.1899.8912.9
PctChgYearAgo2.23.74.22.31.81.31.41.51.5
LaborForce(Ths)344.4358.4371.4379.3379.2384.7389.6393.9398.4 PercentChange,YearAgo-0.44.13.72.10.01.41.31.11.1
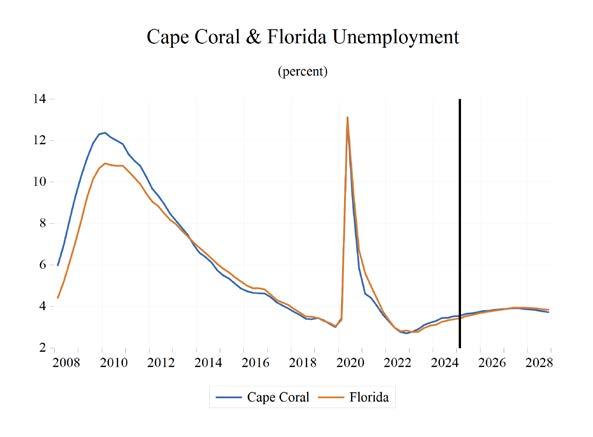
UnemploymentRate(%)7.84.22.93.03.43.63.83.93.8
TotalHousingStarts11009.912107.211759.712696.514619.913480.811160.610727.610950.5
Single-Family6617.210682.59099.08547.110738.19656.77438.66824.76591.5
Multifamily4392.71424.62660.74149.43881.83824.13722.03903.04359.0
Short Term Outlook for Cape Coral-Fort Myers, FL
March 2025 Forecast
Personal Income (Billions $)
2024:42025:12025:22025:32025:42026:12026:22026:32026:42027:12027:22027:32027:4
TotalPersonalIncome59.660.561.462.663.664.866.066.967.869.170.271.372.4
PctChgYearAgo6.35.15.86.56.77.07.47.06.76.66.46.66.7
WagesandSalaries21.621.922.322.723.123.523.824.124.424.725.025.425.7
NonwageIncome38.038.639.239.940.541.342.242.943.544.445.245.946.7
RealPersonalIncome(12$)46.747.147.448.048.449.049.550.050.351.051.652.252.7
PctChgYearAgo4.02.83.43.73.74.04.54.24.04.14.14.44.7
PerCapitaIncome(Ths)68.769.570.471.572.573.674.675.476.177.278.279.180.0
RealPerCapitaIncome(12$)53.854.154.354.855.255.656.056.356.557.057.457.958.3
AverageAnnualWage(Ths)68.769.369.971.072.273.474.475.075.876.577.278.078.8
PctChgYearAgo4.12.33.84.65.16.06.45.65.04.23.94.04.0
Establishment Employment (Place of Work, Thousands, SA)
TotalEmployment312.5315.0317.0317.6318.3318.3318.6319.6320.3321.2322.5323.8325.2
PctChgYearAgo1.52.12.41.71.91.00.50.60.60.91.21.31.5
Manufacturing8.08.18.18.18.18.08.07.97.97.97.97.87.8
PctChgYearAgo-1.20.30.40.80.1-1.1-1.3-1.6-1.7-1.4-1.2-1.4-1.4
Nonmanufacturing304.5306.9309.0309.5310.3310.3310.6311.6312.3313.3314.6316.0317.4
PctChgYearAgo1.52.22.41.71.91.10.50.70.71.01.31.41.6
Construction&Mining43.644.044.244.544.644.644.644.744.745.045.245.445.7
PctChgYearAgo2.93.62.60.62.31.40.90.50.30.81.31.62.1
Trade,Trans,&Utilities60.461.061.761.861.661.461.561.962.062.262.562.862.9
PctChgYearAgo0.11.01.71.92.10.6-0.30.20.61.31.61.41.4 WholesaleTrade9.19.29.49.49.49.49.59.59.69.79.79.89.8 RetailTrade43.744.144.644.644.444.144.244.444.444.444.644.844.8 Trans,Wrhsng,&Util7.57.67.77.77.87.87.98.08.08.18.28.28.3 Information3.63.63.63.53.53.63.53.53.53.53.53.53.4
PctChgYearAgo0.1-0.2-2.6-0.9-2.4-1.3-0.20.5-0.7-1.5-1.8-2.0-2.3 FinancialActivities15.115.215.415.515.615.715.715.815.916.016.116.216.3
PctChgYearAgo-3.7-3.0-0.41.32.92.71.81.91.82.22.72.83.1 Prof&BusinessServices44.945.144.944.744.644.544.344.043.743.643.443.443.4
PctChgYearAgo0.80.40.1-1.0-0.8-1.2-1.3-1.6-1.8-2.2-2.0-1.4-0.7 Educ&HealthServices34.734.835.135.335.535.735.836.136.336.536.736.837.0
PctChgYearAgo1.42.42.22.32.42.42.12.32.22.22.32.11.9
Leisure&Hospitality41.942.442.942.943.243.243.343.744.044.144.544.845.2
PctChgYearAgo2.14.36.04.63.01.71.01.81.92.22.62.62.6
OtherServices12.212.412.612.812.913.013.213.313.413.613.813.914.1
PctChgYearAgo2.64.34.65.06.15.44.44.34.14.24.54.74.9
FederalGovernment2.62.62.62.62.62.62.62.62.62.62.62.62.6
PctChgYearAgo2.73.63.40.71.7-0.2-1.2-1.0-0.7-0.40.10.20.5
State&LocalGovernment45.545.846.046.046.146.146.146.146.246.346.446.646.8
PctChgYearAgo4.03.53.11.91.40.60.10.20.10.50.81.11.3
Other Economic Indicators
Population(Ths)867.7870.7872.8874.7877.2880.5884.2887.9891.6895.0898.2901.3904.5
PctChgYearAgo1.61.51.31.21.11.11.31.51.61.61.61.51.4
LaborForce(Ths)378.7381.8384.3385.7386.9388.1389.1390.1391.1392.2393.3394.5395.6
PctChgYearAgo-0.60.41.51.72.21.71.31.11.11.11.11.11.1
UnemploymentRate(%)3.53.53.63.73.73.83.83.83.93.93.93.93.9
TotalHousingStarts15770.515077.614042.812865.411937.311613.811295.810932.510800.110751.310718.910703.810736.5
Single-Family11138.710971.810120.59154.58380.07972.97583.77180.47017.46928.26846.16787.96736.5
Multifamily4631.84105.93922.33710.93557.33640.83712.13752.23782.73823.23872.83915.84000.1
PROFILES
The Crestview MSA is comprised of Okaloosa and Walton counties and is located in the northwest corner of the state. Crestview is known as the “Hub City” because of the convergence of Interstate 10, State Road 85, U.S. Highway 90, the Florida Gulf & Atlantic Railroad and the Yellow River and Shoal River in or near the city.
QUICK FACTS
• Metro population estimate of 304,418 as of 2023 (ACS 5-Year Estimate) (U.S. Census Bureau).
• Okaloosa County population estimate of 218,464 as of 2023 (ACS 5-Year Estimate).
• Walton County population estimate of 86,354 as of 2023 (ACS 5-Year Estimate).
• Civilian labor force of 139,464 in December 2024 (FRED, U.S. Bureau of Labor Statistics).
• A n unemployment rate of 2.9% as of December 2024, not seasonally adjusted. This amounts to 3,986 unemployed people (FRED, U.S. Bureau of Labor Statistics).
OUTLOOK SUMMARIES
The studied economic indicators are predicted to show average levels of growth in the Crestview Metropolitan Statistical Area (MSA). Gross Metro Product for the MSA will come in at $21,207.8 million. The MSA will experience slightly aboveaverage personal income growth of 6.2 percent, and real per capita income will be $59,100. The average annual wage will grow at an annual rate of 4.8 percent (ranked 2nd in the state) to $76,900. Crestview’s population will grow at an annual rate of 0.9 percent.
Employment growth is expected to average 1.0 percent, and Crestview will experience an unemployment rate of 3.4 percent.
The Other Services sector will lead the MSA in average annual growth at 3.6 percent. The Financial sector will follow at 2.8 percent. The Construction and Mining sector and the Manufacturing sector will see contractions in growth of -0.5 percent and -1.1 percent respectively.
METRO NEWS SUMMARIES
Structural work to begin at Crestview Elementary
• Structural work on the elementary grade portion of the new PreK-12 campus at Crestview is set to begin this week, with the campus expected to be operational by the next school year. The new athletic facility is also progressing smoothly.
• The district is starting contract negotiations with the teaching union ahead of the certified union contract’s expiration in August 2025, aiming to address needs and ensure fair treatment.
• The board authorized the superintendent and district treasurer to sign a mineral right lease agreement with Hilcorp International, L.P. for 1.45 acres for five years.
Source: Morning Journal, December 24, 2024
FPL awards $50K to local nonprofits in Northwest Florida
• F lorida Power & Light (FPL) awarded $50,000 in grant funding to local nonprofits in Okaloosa, Walton, and Bay counties, focusing on education, food insecurity, senior citizen support, and child advocacy.
• Notable grant recipients include the Emerald Coast Theatre Company, A Bed 4 Me Foundation, Okaloosa Public Schools Foundation, Mattie Kelly Arts Foundation, Able Trust Florida Endowment for Vocational Rehabilitation, and St. Andrews Christian Care Center Inc.
• A n additional $19,000 was awarded to several nonprofits in Escambia County, supporting various community initiatives.
Source: NWF Daily News, December 10, 2024
Local business awarded $509K grant in Fort Walton Beach, Precision Measurement Inc to bring new jobs to Okaloosa County
• Precision Measurement Inc. (PMI), a veteranowned business in Fort Walton Beach, announced a five-year growth strategy to expand services and create jobs in Okaloosa County, supported by a $509,000 grant from the University of West Florida’s Industry Resilience and Diversification Fund.
• PMI provides calibration and testing services and has seen an average annual growth of 20% since 2005. The expansion will initially create four full-time positions with average salaries of $60,000 and may require larger facilities in the future.
• The company is also expanding its services to include FAA-mandated certifications for aircraft avionics and hospital medical equipment servicing, addressing a critical need for local law enforcement calibration services.
Source: Northwest Florida Daily News, December 14, 2024
Charlotte County’s Mid-County Regional Library to reopen in 2026
• The Mid-County Regional Library in Port Charlotte, which was severely damaged by Hurricane Ian in September 2022, is expected to reopen in 2026 after approximately $6.9 million in repairs and renovations.
• Originally a Kash n’ Karry convenience store, the building was purchased by the county in 2002, renovated, and opened as a library in 2005.
• W harton-Smith Inc. was contracted as the construction manager for the project, with a Guaranteed Maximum Price of $6,914,843, excluding pre-construction services fees.
Source: Gulfshore Business, January 14, 2025
Long Term Outlook for Crestview-Fort Walton Beach-Destin, FL
March 2025 Forecast
Personal Income (Billions $)
202020212022202320242025202620272028
TotalPersonalIncome17.019.219.921.322.624.025.827.228.7
PctChgYearAgo6.713.53.47.15.96.47.25.75.5
WagesandSalaries7.88.79.49.810.511.212.012.513.0
NonwageIncome9.210.510.511.512.112.913.814.715.7
RealPersonalIncome(12$)17.118.317.518.118.619.320.220.921.6
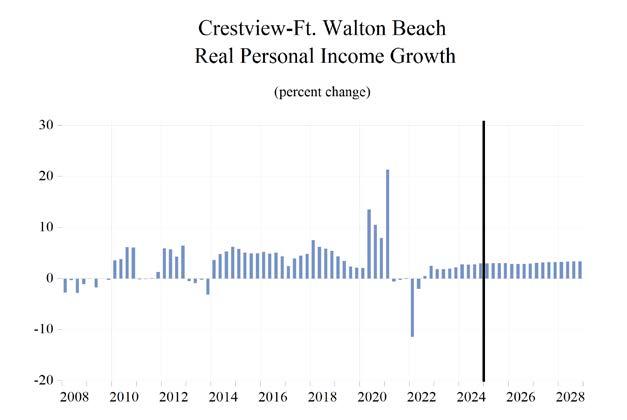
PctChgYearAgo6.66.9-4.13.13.23.84.33.53.5
PerCapitaIncome(Ths.)58.865.465.868.971.675.280.084.088.1
RealPerCapitaIncome(12$)59.262.057.958.359.160.662.764.566.3
AverageAnnualWage(Ths)57.861.664.165.368.371.175.478.882.4
PctChgYearAgo8.16.74.11.94.54.16.14.54.5
Establishment Employment (Place of Work, Thousands, SA)
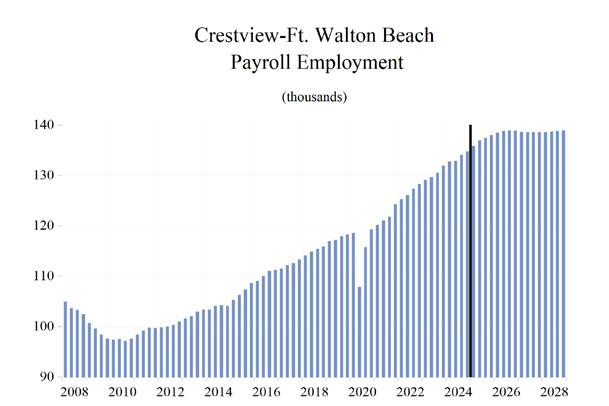
TotalEmployment115.4121.9126.8130.3133.6137.1138.8138.6138.8
PctChgYearAgo-1.95.64.02.82.52.61.2-0.10.1 Manufacturing3.43.43.63.43.43.43.33.33.3
PctChgYearAgo8.6-0.94.7-3.5-0.8-0.5-1.0-1.5-1.3
Nonmanufacturing112.0118.5123.2126.9130.2133.7135.5135.3135.5
PctChgYearAgo-2.25.84.03.02.62.71.3-0.10.2
Construction&Mining7.07.37.88.18.68.88.88.68.5 PctChgYearAgo1.54.47.53.85.82.6-0.4-2.3-1.7 Trade,Trans,&Utilities20.421.522.423.023.724.424.624.724.7 PctChgYearAgo-3.45.24.03.02.83.00.90.40.0 WholesaleTrade1.71.92.02.12.12.22.32.32.3 RetailTrade16.417.117.718.318.919.519.619.619.5 Trans,Wrhsng,&Util2.32.52.72.72.62.72.72.82.8 Information1.31.41.61.61.61.61.61.61.6 PctChgYearAgo-0.76.614.82.7-0.10.51.1-2.2-0.9
FinancialActivities7.07.67.97.97.88.28.58.78.7
PctChgYearAgo-2.18.54.10.0-0.64.44.11.90.6 Prof&BusinessServices18.420.722.323.524.424.624.724.124.2
PctChgYearAgo2.912.08.15.43.51.00.2-2.30.3 Educ&HealthServices12.212.412.813.213.714.014.214.214.3
PctChgYearAgo-1.71.73.52.73.92.01.60.30.4
Leisure&Hospitality20.722.523.223.824.225.225.725.725.7
PctChgYearAgo-8.68.73.42.51.94.01.80.3-0.2
OtherServices4.24.34.24.34.44.64.95.05.1
PctChgYearAgo-2.41.9-2.73.72.55.04.72.92.4
FederalGovernment9.29.39.19.29.29.59.69.79.7
PctChgYearAgo3.40.8-1.61.00.22.31.21.00.7
State&LocalGovernment11.611.711.912.212.612.813.013.013.1
PctChgYearAgo-2.40.52.02.42.82.21.20.30.3
Other Economic Indicators
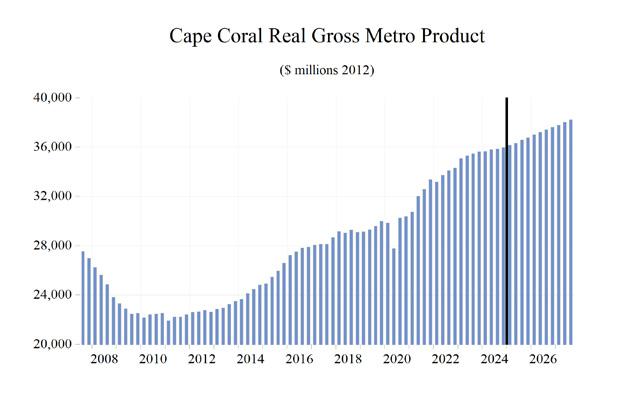
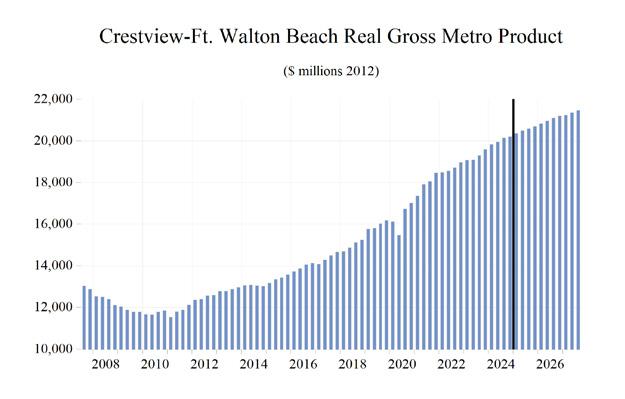
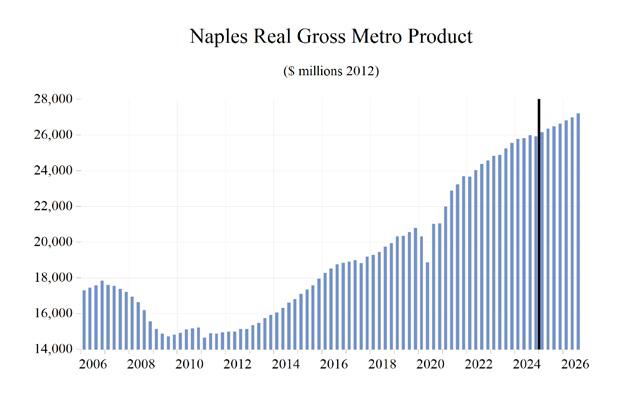
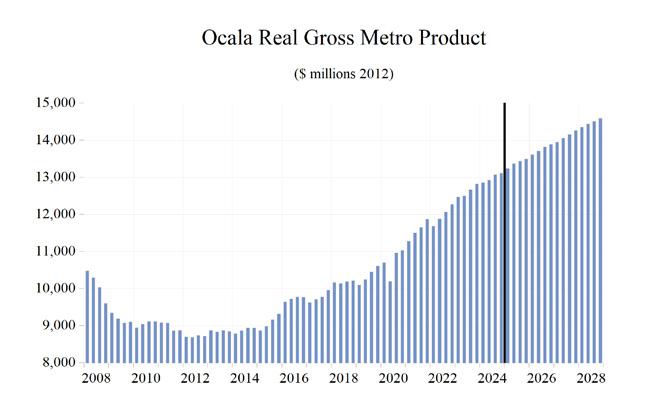
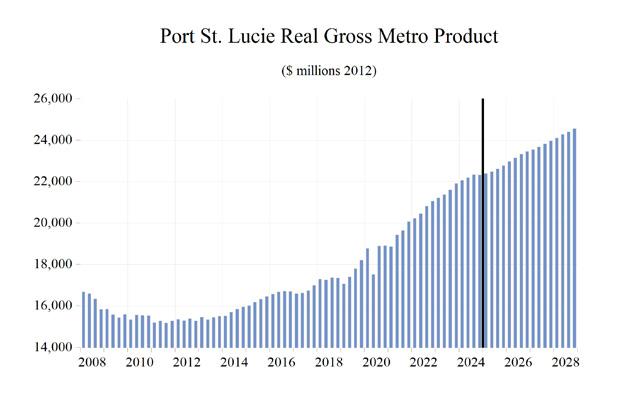
RrealGrossMetroProduct(Billio16343.417949.218686.219265.120036.520536.621024.521416.621853.5
Population(Ths)288.5294.6302.6309.5315.2319.2321.8324.0325.9
PctChgYearAgo1.52.12.72.31.91.30.80.70.6
LaborForce(Ths)127.3133.5136.4139.9141.6142.2142.1141.9141.7
PercentChange,YearAgo-0.34.82.22.61.20.40.0-0.2-0.1
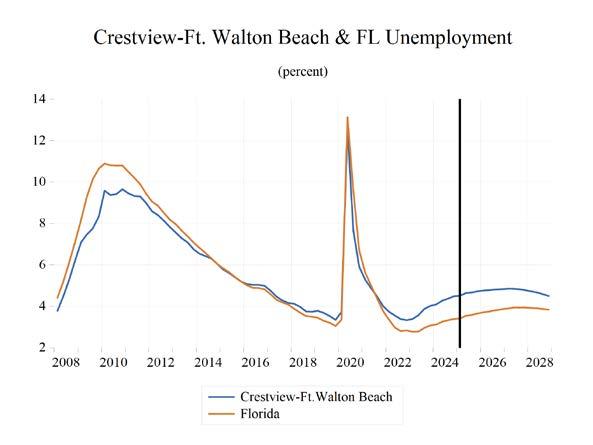
UnemploymentRate(%)5.93.52.62.73.03.33.43.43.3
TotalHousingStarts2967.83495.93702.85030.83894.93046.72942.53030.83079.7
Single-Family2409.13217.92751.32796.62667.52550.42252.52109.22013.6
Multifamily558.7277.9951.52234.21227.4496.2690.0921.61066.1
Short Term Outlook for Crestview-Fort Walton Beach-Destin, FL March 2025 Forecast
Personal Income (Billions $)
2024:42025:12025:22025:32025:42026:12026:22026:32026:42027:12027:22027:32027:4
TotalPersonalIncome23.023.423.824.324.725.225.626.026.226.727.027.427.8
PctChgYearAgo5.34.76.27.27.57.87.86.96.35.95.65.65.7
WagesandSalaries10.710.811.011.311.511.711.912.012.212.312.412.512.7
NonwageIncome12.312.512.713.013.213.513.713.914.114.414.614.915.1
RealPersonalIncome(12$)18.819.019.219.519.719.920.120.320.420.620.821.021.2
PctChgYearAgo3.02.53.84.44.54.74.84.13.63.43.33.53.8
PerCapitaIncome(Ths)72.473.574.575.977.178.479.780.681.482.583.584.585.5
RealPerCapitaIncome(12$)59.459.860.260.961.462.062.663.063.263.764.264.865.2
AverageAnnualWage(Ths)69.069.770.471.672.874.175.175.876.677.578.479.380.2
PctChgYearAgo3.72.43.94.65.66.46.86.05.34.54.34.64.6
Establishment Employment (Place of Work, Thousands, SA)
TotalEmployment134.8135.9137.0137.5138.0138.5138.9139.0138.9138.7138.6138.6138.6
PctChgYearAgo2.12.43.12.62.41.91.41.10.60.1-0.2-0.3-0.2
Manufacturing3.43.43.43.43.43.43.43.33.33.33.33.33.3
PctChgYearAgo-0.2-0.3-1.6-0.90.7-0.1-0.6-1.4-1.8-1.6-1.5-1.5-1.3
Nonmanufacturing131.4132.6133.6134.1134.7135.1135.5135.6135.6135.4135.3135.3135.3
PctChgYearAgo2.22.43.22.72.41.91.41.10.70.2-0.1-0.2-0.2
Construction&Mining8.88.88.88.88.88.88.88.88.78.78.68.68.5
PctChgYearAgo6.65.64.00.50.60.5-0.1-0.7-1.4-2.0-2.4-2.5-2.2
Trade,Trans,&Utilities23.824.124.524.524.524.524.624.724.724.724.724.824.7
PctChgYearAgo2.43.03.62.52.91.60.60.80.50.60.50.30.3 WholesaleTrade2.22.22.22.32.32.32.32.32.32.32.42.32.3 RetailTrade19.019.319.619.619.619.519.619.619.619.519.619.619.6 Trans,Wrhsng,&Util2.62.62.72.72.72.72.72.72.82.82.82.82.8 Information1.61.61.61.61.61.61.61.61.61.61.61.61.6
PctChgYearAgo-0.21.1-0.40.01.41.32.11.3-0.2-1.7-2.4-2.4-2.5 FinancialActivities7.98.08.18.28.38.48.58.58.68.68.78.78.7
PctChgYearAgo-0.20.45.76.25.25.24.23.83.12.52.31.61.3 Prof&BusinessServices24.324.524.624.724.724.824.824.624.424.324.124.024.0
PctChgYearAgo1.81.31.10.11.61.20.9-0.3-1.0-2.3-2.8-2.3-1.8 Educ&HealthServices13.813.814.014.014.014.114.214.214.214.214.214.214.2
PctChgYearAgo3.33.52.10.62.02.11.71.51.10.60.30.20.4 Leisure&Hospitality24.825.025.125.325.525.525.625.725.925.725.725.725.8
PctChgYearAgo1.71.65.46.52.52.01.71.81.50.90.60.1-0.4 OtherServices4.54.54.64.74.74.84.84.94.95.05.05.05.1
PctChgYearAgo3.74.24.75.75.45.74.94.43.73.22.92.82.7 FederalGovernment9.29.39.59.59.59.59.69.69.69.69.79.79.7
PctChgYearAgo-0.91.52.32.43.01.81.01.01.11.21.00.80.8 State&LocalGovernment12.712.812.812.912.912.913.013.013.013.013.013.013.0
PctChgYearAgo3.33.51.91.61.71.51.31.10.80.50.20.20.3
Other Economic Indicators
Population(Ths)317.1318.1318.9319.6320.3321.0321.6322.1322.6323.2323.7324.2324.7
PctChgYearAgo1.71.61.41.21.00.90.80.80.70.70.70.70.7
LaborForce(Ths)141.1141.8142.3142.3142.3142.3142.2142.1142.0141.9141.9141.8141.8
PctChgYearAgo-0.4-0.70.11.40.90.3-0.1-0.2-0.2-0.2-0.2-0.2-0.2
UnemploymentRate(%)3.23.23.33.33.33.43.43.43.43.43.43.43.4
TotalHousingStarts2919.23055.13080.93052.02998.72962.32882.72898.23026.73014.53019.23025.23064.4
Single-Family2484.72593.42594.02553.02461.42363.62252.42209.52184.62150.02118.82094.92073.0
Multifamily434.5461.6486.9499.1537.3598.7630.3688.7842.1864.5900.4930.3991.4
PROFILES
The Deltona–Daytona–Ormond Beach MSA is comprised of Volusia and Flagler Counties. It is located on the east coast of Florida and is notable for special events that occur throughout the year such as Bike Week. It is home to NASCAR headquarters and the Daytona International Speedway, which hosts popular races such as the Daytona 500.
QUICK FACTS
• Metro population estimate of 721,796 as of 2023 (ACS 5-Year Estimate) (U.S. Census Bureau).
• Volusia County population estimate of 721,796 as of 2023 (ACS 5-Year Estimate).
• Civilian labor force of 319,155 in December 2024 (FRED, U.S. Bureau of Labor Statistics).
• A n unemployment rate of 3.5% as of December 2024, not seasonally adjusted. This amounts to 11,260 unemployed people (FRED, U.S. Bureau of Labor Statistics).
OUTLOOK SUMMARIES
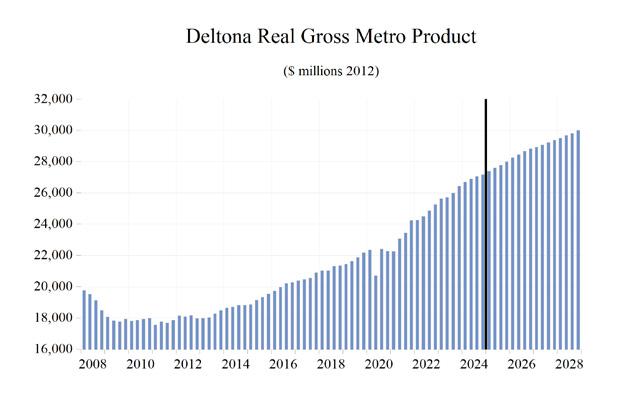
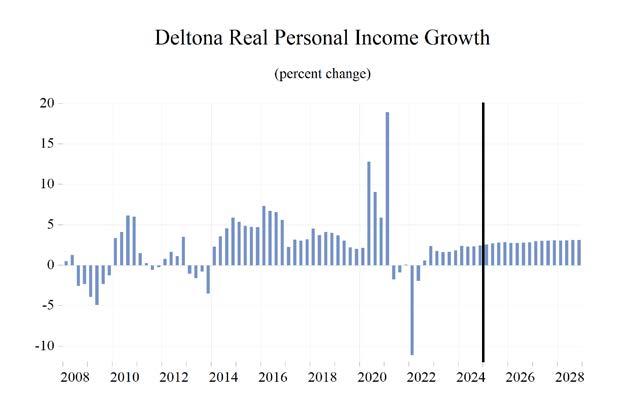
Growth in the economic indicators studied in this forecast is expected to be moderate for the Deltona –Daytona – Ormond Beach Metropolitan Statistical Area (MSA). Gross Metro Product in the Deltona MSA will be $28,379.33 million, placing it 12th in the state for metro output. Average annual wage will grow at a rate of 4.5 percent, driving the average annual real wage to increase to $65,800 which is the ranked 22nd in the state. Per capita income levels will come in at $50,800, with average per personal income growth of 5.8 percent annually. We expect population growth of 1.0 percent per year.
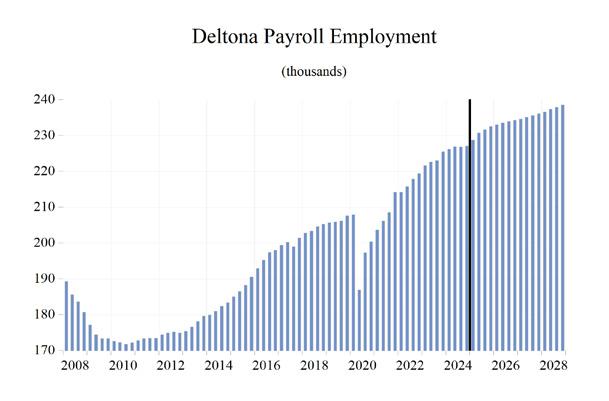
The Deltona – Daytona – Ormond Beach MSA labor market will experience an average employment growth of 1.2 percent, with an unemployment rate of 4.2 percent.
The Other Services sector will experience the fastest growth rate in this MSA with an annual growth rate of 4.4 percent. The Construction and Mining sector will follow at 1.6 percent. Deltona will see the largest contraction in growth in the Manufacturing sector at -0.9 percent.
METRO NEWS SUMMARIES
Commercial-Plus Project Pending for NW Deltona
• A developer plans to transform 36.5 acres in northwest Deltona into a mixed-use district with retail, offices, and apartments.
• The project is expected to generate millions in new tax revenue, while reducing residents’ reliance on Orlando for jobs.
• The Deltona City Commission tabled a request to rezone almost 36.5 vacant acres adjacent to the newer of the Amazon fulfillment centers.
Source: West Volusion Beacon, November 27, 2024
Seminole Towne Center set for transformation in new mixed-use development deal
• A mazon’s fulfillment center is adding 200 new warehouse and logistics jobs in early 2025.
• The expansion includes a high-tech automation system, increasing efficiency and boosting productivity.
• Deltona leaders say the facility is becoming a key driver of job growth in west Volusia County.
Source: Daytona Beach News-Journal, January 10, 2025
Deltona mayor faces scrutiny over use of tax dollars
• Deltona Mayor Santiago Avila Jr. faces scrutiny over the use of taxpayer funds to attend former President Donald Trump’s inauguration, raising concerns about the allocation of public money.
• The controversy has sparked debate over government transparency and accountability in local budgeting practices.
• Accusations about improper spending could impact public trust and future funding decisions for Deltona’s city projects and initiatives.
Source: Fox 35 Orlando, February 17, 2025
Deltona -Daytona Beach - Ormond Beach MSA
Long Term Outlook for Deltona-Daytona Beach-Ormond Beach, FL
March 2025 Forecast
Personal Income (Billions $)
202020212022202320242025202620272028
TotalPersonalIncome32.436.437.941.343.846.349.252.055.0
PctChgYearAgo5.212.14.39.06.05.76.25.75.7
WagesandSalaries9.510.711.712.613.414.215.215.916.8
NonwageIncome22.925.726.228.830.432.134.036.138.2
RealPersonalIncome(12$)32.134.133.134.735.937.038.239.641.1
PctChgYearAgo3.06.5-3.25.13.33.13.33.53.7
PerCapitaIncome(Ths)48.252.753.256.458.661.264.567.570.6
RealPerCapitaIncome(12$)47.649.546.447.448.048.950.251.452.8
AverageAnnualWage(Ths)47.751.053.856.158.861.264.667.270.1
PctChgYearAgo6.96.85.54.24.94.15.54.04.3
Establishment Employment (Place of Work, Thousands, SA)
TotalEmployment198.1208.1216.8223.2226.7230.9233.7235.3237.6
PctChgYearAgo-4.05.14.22.91.61.81.20.70.9 Manufacturing10.711.512.513.012.612.612.512.312.2
PctChgYearAgo-6.27.88.34.0-2.4-0.4-1.0-1.2-1.2 Nonmanufacturing187.4196.6204.4210.2214.1218.3221.2223.0225.4
PctChgYearAgo-3.94.93.92.91.82.01.30.81.1 Construction&Mining14.114.314.714.815.315.716.016.116.3 PctChgYearAgo-0.92.02.40.93.22.91.70.51.2 Trade,Trans,&Utilities38.942.543.844.445.045.946.146.646.9 PctChgYearAgo-1.59.43.11.41.22.10.51.00.6 WholesaleTrade4.95.25.75.85.96.26.36.46.5 RetailTrade30.231.832.733.333.634.234.234.434.7 Trans,Wrhsng,&Util3.75.65.55.45.55.55.75.75.7 Information2.01.81.91.91.91.92.02.02.0 PctChgYearAgo-16.0-9.01.01.70.20.33.8-1.30.0 FinancialActivities9.09.79.910.09.79.810.110.210.2 PctChgYearAgo4.46.92.60.7-3.01.42.60.90.3 Prof&BusinessServices23.023.425.125.926.026.827.026.526.6 PctChgYearAgo-1.71.47.33.20.63.10.6-1.90.4 Educ&HealthServices39.440.542.243.945.846.146.847.548.4
PctChgYearAgo-2.32.94.14.14.30.51.61.61.7
Leisure&Hospitality27.831.033.734.935.235.836.436.837.4
PctChgYearAgo-15.311.58.73.40.91.91.51.31.4 OtherServices8.07.97.77.98.18.69.09.39.7
PctChgYearAgo-8.6-0.7-2.72.43.45.15.23.83.5 FederalGovernment1.61.51.51.51.61.71.71.71.7
PctChgYearAgo5.3-5.70.00.14.85.91.7-0.8-1.0
State&LocalGovernment23.623.923.925.025.525.926.226.326.4
PctChgYearAgo1.01.4-0.34.91.91.70.90.50.4
Other Economic Indicators
Population(Ths)673.0690.1713.2733.2748.0756.5762.3770.0778.2
PctChgYearAgo1.62.53.32.82.01.10.81.01.1
LaborForce(Ths)295.1304.1313.8322.5324.0325.1327.1328.5330.0
PercentChange,YearAgo-1.43.13.22.80.40.30.60.40.5
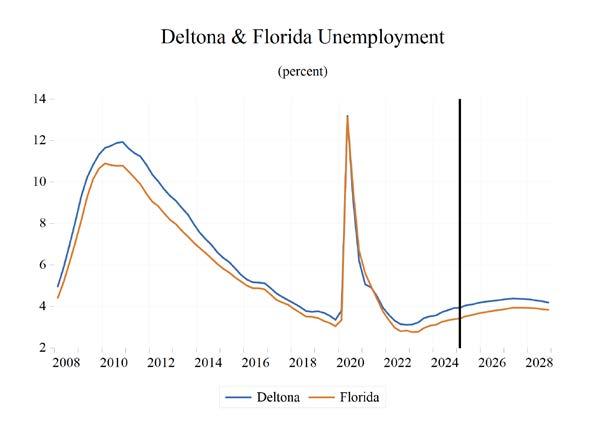
UnemploymentRate(%)8.14.63.33.33.84.14.34.44.3
TotalHousingStarts5943.07127.68066.96878.95896.75567.76062.36205.96204.8
Single-Family4637.16571.96179.65465.15167.15062.95051.64931.74799.3
Multifamily1306.0555.81887.31413.8729.6504.81010.71274.21405.5
Short Term Outlook for Deltona-Daytona Beach-Ormond Beach, FL
March 2025 Forecast
Personal Income (Billions $)
2024:42025:12025:22025:32025:42026:12026:22026:32026:42027:12027:22027:32027:4
TotalPersonalIncome44.545.245.946.747.448.248.949.550.150.951.652.453.1
PctChgYearAgo5.24.55.36.46.56.56.56.05.75.75.65.75.9
WagesandSalaries13.613.814.114.314.614.915.115.315.515.615.816.016.2
NonwageIncome30.931.431.832.432.833.333.834.334.735.335.836.436.9
RealPersonalIncome(12$)36.336.536.837.237.537.838.138.438.639.039.439.840.1
PctChgYearAgo3.02.33.03.63.53.53.63.23.03.23.43.73.9
PerCapitaIncome(Ths)59.260.060.761.762.563.464.264.965.566.467.267.968.6
RealPerCapitaIncome(12$)48.248.448.749.149.449.850.150.350.550.951.351.651.9
AverageAnnualWage(Ths)59.660.260.661.662.663.664.465.065.666.266.967.668.2
PctChgYearAgo4.72.84.14.75.05.76.25.54.84.13.94.04.0
Establishment Employment (Place of Work, Thousands, SA)
TotalEmployment227.1228.7230.7231.6232.5233.0233.5233.9234.3234.6235.1235.6236.1
PctChgYearAgo0.71.11.72.12.41.91.21.00.70.70.70.70.8
Manufacturing12.512.612.612.612.612.612.512.512.412.412.412.312.3
PctChgYearAgo-2.6-1.2-0.90.10.6-0.2-0.7-1.3-1.6-1.3-1.1-1.2-1.2
Nonmanufacturing214.6216.1218.1219.0219.9220.5221.1221.5221.9222.2222.7223.3223.8
PctChgYearAgo0.91.31.82.32.52.01.31.10.90.80.80.80.9
Construction&Mining15.415.515.715.815.916.016.016.016.016.016.116.116.1
PctChgYearAgo1.32.42.82.93.62.92.11.30.70.60.40.50.6 Trade,Trans,&Utilities45.045.546.146.146.145.946.146.346.346.446.646.746.7
PctChgYearAgo0.01.12.22.72.31.10.00.40.51.01.11.01.0 WholesaleTrade6.06.16.26.26.26.36.36.36.46.46.46.46.5 RetailTrade33.633.934.434.434.334.034.134.234.234.234.434.534.5 Trans,Wrhsng,&Util5.55.45.55.55.65.65.75.75.75.75.75.75.7 Information1.91.91.91.91.92.02.02.02.02.02.01.91.9
PctChgYearAgo0.00.1-1.3-0.42.84.55.14.01.7-0.4-1.3-1.6-1.7 FinancialActivities9.59.69.89.910.010.010.110.110.110.110.210.210.2
PctChgYearAgo-4.9-3.10.54.04.74.42.91.91.31.01.00.90.8 Prof&BusinessServices26.326.626.826.927.027.127.126.926.826.626.526.426.4
PctChgYearAgo1.13.23.72.82.61.91.3-0.1-0.8-1.8-2.3-1.9-1.6 Educ&HealthServices45.545.746.046.246.346.646.746.947.047.247.547.747.8
PctChgYearAgo1.60.2-0.20.21.82.01.61.51.41.41.51.71.8
Leisure&Hospitality35.335.535.835.936.236.236.336.436.636.636.736.937.1
PctChgYearAgo0.40.71.92.52.42.01.21.51.31.21.31.41.3
OtherServices8.28.38.58.68.88.99.09.09.19.29.39.49.5
PctChgYearAgo2.52.94.16.56.86.65.54.64.23.93.83.83.7
FederalGovernment1.61.61.71.71.71.71.71.71.71.71.71.71.7
PctChgYearAgo6.76.76.65.15.23.51.91.10.3-0.3-0.8-1.0-1.0
State&LocalGovernment25.825.925.926.026.026.126.126.226.226.326.326.326.3
PctChgYearAgo3.12.41.91.70.90.90.80.90.80.60.60.50.4
Other Economic Indicators
Population(Ths)752.1754.2755.9757.4758.4759.8761.4763.1764.9766.9768.7771.0773.3
PctChgYearAgo1.71.41.21.00.80.70.70.70.90.91.01.01.1
LaborForce(Ths)321.6323.4325.0325.6326.2326.7326.9327.2327.6327.9328.3328.7329.1
PctChgYearAgo-1.2-0.90.00.91.41.00.60.50.40.40.40.50.5
UnemploymentRate(%)3.93.94.04.14.24.24.24.34.34.44.44.44.4
TotalHousingStarts4819.55339.75536.85647.55746.75809.55966.96177.56295.16246.06207.86186.76183.1 Single-Family4462.44961.65072.65101.75115.75042.45049.25062.75051.94992.74942.64909.44882.2
Multifamily357.1378.1464.2545.8631.0767.2917.71114.81243.11253.21265.21277.31301.0
PROFILES
The Broward County MSA is located in Southeastern Florida. It is estimated to be the second-most populous county in the State of Florida and the 18th most populous county in the United States.
QUICK FACTS
• Metro population estimate of 1,962,531 as of 2023 (ACS 5-Year Estimate) (U.S. Census Bureau).
• Broward County population estimate of 1,962,531 as of 2023 (ACS 5-Year Estimate).
• Civilian labor force of 1,085,153 in December 2024 (FRED, U.S. Bureau of Labor Statistics).
• A n unemployment rate of 2.9% as of December 2024, not seasonally adjusted. This amounts to 31,278 unemployed people (FRED, U.S. Bureau of Labor Statistics).
OUTLOOK SUMMARIES
The Fort Lauderdale–Pompano Beach area is expected to show below-average levels of growth in the economic indicators. Personal income is expected to grow an average of 4.9 percent annually. It will experience an average real per capita income level of $55,600. Average annual wage growth will be 4.6 percent, and the annual wage level is expected to be $88,200, the 4th highest of the studied areas. Fort Lauderdale is expected to average a population growth of 0.5 percent each year. The area has the 5th highest Gross Metro Product of the MSAs studied at an average level of $143,936.85 million. Employment is expected to grow at a rate of 0.5 percent, while unemployment is expected to be 3.6 percent.
Fort Lauderdale’s fastest growing sector is expected to be the Education and Health Services sector, which will experience 1.5 percent average annual growth, followed by Other Services sector, which will grow at a similar average of 1.5 percent annually. The Manufacturing sector will see the largest contraction at -1.2 percent.
METRO NEWS SUMMARIES
Stadium touted as world’s first dedicated to pickleball nears completion in South Florida
• The Fort, a $25 million pickleball stadium and entertainment complex in Fort Lauderdale is set to open this month with 43 courts, four grandstands, and seating for 2,000 spectators. It will serve as the official headquarters and training facility for the Association of Pickleball Players and include a restaurant and membership options.
• The project is a public-private partnership between developer My Park Initiative and the city of Fort Lauderdale. It utilizes 10 acres of city-owned land at Snyder Park. Centennial Bank provided a $7 million construction loan, citing the sport’s rapid growth and previous work with the developers.
• The complex will feature high-tech amenities, including live-streaming, instant replays, and coaching analysis. Under the 50-year agreement, My Park Initiative will lead operations and share revenue with the city, positioning The Fort as a premier pickleball destination.
Source: Costar, December 3, 2024
Broward schools aim to move past 10-year construction debacle
• R iverside Elementary unveiled its renovated library, part of a $2 million investment that included restroom updates, air conditioning, and roofing upgrades. However, the renovation, originally set for 2020 at $1 million, ended up costing twice as much, reflecting broader delays and cost overruns in Broward’s $800 million school bond program.
• Broward’s school bond program, approved in 2014, has been plagued by mismanagement, cost increases, and delays, missing its original 2021 completion deadline. The program, intended to fund safety, music, art, athletics, and renovations, has now reached $1.7 billion. Despite progress, less than half the projects
are complete, and an October 2025 deadline has been set to move unfinished work into the district’s capital budget.
• The bond program has led to leadership changes, lawsuits, and a state grand jury investigation. The investigation found mismanagement and resulted in the removal of school board members and the indictment of former Superintendent Robert Runcie. With $5–6 billion in remaining capital needs, some board members are considering a new bond referendum as early as 2026, though concerns over public trust remain.
Source: Sun Sentinel, December 10, 2024
A landmark hotel just reopened in Fort Lauderdale. What about the rotating rooftop?
• Pier Sixty-Six in Fort Lauderdale has reopened after a major renovation following Hurricane Irma’s damage in 2017. The luxury waterfront resort now features 325 rooms and suites, a 164-slip marina for yachts up to 400 feet, and 12 dining options, with five currently open.
• The iconic Pier Top lounge, a fully rotating rooftop bar, will return in March with a modern twist on classic cocktails and upscale snacks. The renovation also includes a 13,000-square-foot spa, three pools, and expanded event spaces, solidifying the resort as a major destination.
• Originally built in the 1960s, Pier Sixty-Six helped define Fort Lauderdale’s yachting scene. Managed by CoralTree Hospitality, the resort blends history with modern luxury, offering hotel stays, residences for sale, and a premier location for dining, events, and boating.
Source: Miami Herald, January 14, 2025
Broward Health Unveils Designs for New Medical Office Buildings and Parking Garage
• Broward Health invests in two state-of-the-art medical office buildings at Broward Health Medical Center in Fort Lauderdale and Broward Health North in Deerfield Beach, along with a seven-story, 700-space parking
garage. This marks the first new construction for Broward Health in 25 years, with completion expected in 2027.
• The Fort Lauderdale facility will span 188,000 square feet across eight floors with 129 exam rooms, expandable to 237, offering cardiovascular, pulmonology, primary care, neuroscience, and women’s services. The Deerfield Beach facility will cover 114,000 square feet with 75 exam rooms, expandable to 123, specializing in cardiovascular, neuroscience, and orthopedics.
• The project aims to enhance patient care, physician services, and operational efficiency. The buildings will feature modern, scalable clinic layouts and cutting-edge medical technology, reinforcing Broward Health’s leadership in healthcare innovation and accessibility.
Source: Broward Health, January 15, 2024
Homes prices and new developments are booming along South Florida’s train line
• Brightline has transformed Florida’s transportation landscape, attracting 2.7 million riders in 2024, a 40% increase over the previous year. The privately funded $6.2 billion rail system has enhanced connectivity between major cities, reducing commute times and integrating with other transit networks like Tri-Rail, Metrorail, and Miami-Dade buses.
• Real estate values near Brightline stations have surged, with residential sales around Miami’s station up 31.9% and total property resale value increasing 131.4% between 2018 and 2023. Similar trends are seen in Fort Lauderdale, Boca Raton, West Palm Beach, Aventura, and Orlando, fueling new luxury developments like Okan Tower and Viceroy Residences.
• Brightline’s expansion continues, with a Tampa extension set for 2026 and the ambitious Brightline West project linking Los Angeles and Las Vegas in development.
Source: New York Post, February 14, 2025
Long Term Outlook for Fort Lauderdale-Pompano Beach-Deerfield Beach, FL (Division of Miami MSA)
March 2025 Forecast
Personal Income (Billions $)
202020212022202320242025202620272028
TotalPersonalIncome110.5122.1129.0139.3147.2153.3161.2169.8178.4
PctChgYearAgo6.110.55.78.05.74.15.25.35.1
WagesandSalaries52.058.664.769.173.577.281.985.689.6
NonwageIncome58.463.564.370.273.776.179.484.288.9
RealPersonalIncome(12$)96.4102.099.4103.4106.5108.2110.7114.1117.7
PctChgYearAgo4.05.8-2.54.03.01.62.43.13.1
PerCapitaIncome(Ths)56.863.065.769.972.975.679.783.987.9
RealPerCapitaIncome(12$)49.652.650.651.952.753.454.756.458.0
AverageAnnualWage(Ths)63.968.872.575.478.581.886.590.394.0
PctChgYearAgo7.87.85.34.04.14.35.74.34.2
Establishment Employment (Place of Work, Thousands, SA)
TotalEmployment811.2846.3889.0912.6932.6939.1942.5944.2948.7
PctChgYearAgo-6.44.35.02.72.20.70.40.20.5
Manufacturing27.628.630.230.630.129.929.529.128.7
PctChgYearAgo-4.73.55.71.4-1.7-0.8-1.2-1.4-1.5
Nonmanufacturing783.6817.8858.8882.0902.5909.2912.9915.1920.1
PctChgYearAgo-6.44.45.02.72.30.70.40.20.5 Construction&Mining49.049.049.652.154.755.756.156.757.7
PctChgYearAgo-1.8-0.11.25.25.01.80.71.01.8 Trade,Trans,&Utilities185.9193.7201.9206.0211.1210.8209.3209.6208.4
PctChgYearAgo-4.84.24.22.12.5-0.1-0.70.1-0.6 WholesaleTrade49.750.652.554.256.557.157.458.258.2 RetailTrade103.0106.0108.5108.9109.4109.2107.5106.8106.1 Trans,Wrhsng,&Util33.137.140.942.945.244.544.444.544.1 Information18.819.920.420.420.120.220.420.120.1
PctChgYearAgo-5.16.02.7-0.1-1.60.51.3-1.4-0.2 FinancialActivities63.966.271.472.872.672.573.373.673.4 PctChgYearAgo-1.23.57.82.0-0.4-0.11.20.4-0.3 Prof&BusinessServices147.1157.9170.7172.6171.8171.5171.1168.8170.6
PctChgYearAgo-4.27.38.11.1-0.5-0.2-0.2-1.41.1 Educ&HealthServices108.1111.1115.0119.9123.6125.6127.7129.5131.2
PctChgYearAgo-3.82.73.64.23.11.61.71.41.3
Leisure&Hospitality76.185.193.797.199.6100.6101.5102.5103.7
PctChgYearAgo-21.911.910.13.62.61.01.01.01.2 OtherServices32.033.134.335.839.440.440.741.341.8
PctChgYearAgo-15.43.63.64.510.12.40.71.41.3
FederalGovernment7.47.17.27.57.87.98.08.18.2
PctChgYearAgo5.9-4.51.74.23.52.31.31.00.9
State&LocalGovernment95.394.794.697.6101.9104.2104.6104.8104.9
PctChgYearAgo-4.1-0.6-0.13.24.42.30.40.10.1
Other Economic Indicators
Population(Ths)1944.61939.31963.01991.92019.12026.22023.22024.32030.2
PctChgYearAgo0.1-0.31.21.51.40.4-0.10.10.3
LaborForce(Ths)1018.51031.31059.41085.11095.31099.81102.81104.81107.4
PercentChange,YearAgo-1.31.32.72.40.90.40.30.20.2
UnemploymentRate(%)9.44.93.02.93.23.43.63.73.7 TotalHousingStarts4448.63377.82688.42489.81800.22148.83550.64319.74870.8
Single-Family1420.11549.41114.9852.0777.4892.81065.71166.51245.5
Multifamily3028.51828.41573.51637.81022.81256.02484.93153.13625.3
Short Term Outlook for Fort Lauderdale-Pompano Beach-Deerfield Beach, FL (Division of Miami MSA)
March 2025 Forecast
2024:42025:12025:22025:32025:42026:12026:22026:32026:42027:12027:22027:32027:4
Personal Income (Billions $) TotalPersonalIncome149.0150.5152.0154.3156.3158.5160.4162.0164.1166.5168.7170.8172.9
PctChgYearAgo2.61.21.41.81.92.42.62.22.32.63.03.43.4
PerCapitaIncome(Ths)73.674.275.076.277.278.379.380.181.182.383.484.485.4
RealPerCapitaIncome(12$)52.953.053.153.553.954.354.654.855.255.756.256.657.0
AverageAnnualWage(Ths)79.580.281.182.483.785.186.286.987.988.889.890.791.7
PctChgYearAgo3.92.64.24.95.36.16.35.65.04.44.24.44.4
Establishment Employment (Place of Work, Thousands, SA)
TotalEmployment933.7937.9939.3939.4939.9941.1942.3943.2943.3943.3943.9944.4945.0
PctChgYearAgo1.61.10.60.50.70.30.30.40.40.20.20.10.2
Manufacturing29.829.829.929.929.929.729.629.529.329.329.229.028.9
PctChgYearAgo-2.5-1.9-1.3-0.10.1-0.3-1.0-1.6-1.8-1.5-1.3-1.4-1.4
Nonmanufacturing903.9908.1909.4909.4910.0911.4912.7913.7913.9914.1914.7915.4916.1
PctChgYearAgo1.71.20.60.50.70.40.40.50.40.30.20.20.2
Construction&Mining55.555.755.655.755.855.956.056.256.356.556.656.857.0
PctChgYearAgo4.65.12.6-0.90.50.30.90.80.91.01.01.01.2 Trade,Trans,&Utilities211.0211.8211.3210.3209.6209.0209.1209.7209.5209.5209.7209.7209.3
PctChgYearAgo1.20.3-0.1-0.1-0.7-1.3-1.1-0.30.00.30.30.0-0.1 WholesaleTrade57.157.357.257.056.857.057.257.557.758.158.358.358.3 RetailTrade109.0109.6109.6109.0108.5107.7107.5107.7107.2106.9106.9107.0106.6 Trans,Wrhsng,&Util44.944.844.644.344.244.344.444.544.644.644.644.544.4 Information20.020.220.120.120.320.520.520.420.420.320.220.120.0
PctChgYearAgo-0.50.0-0.40.81.41.62.21.40.2-0.8-1.4-1.7-1.8 FinancialActivities72.272.372.472.572.773.173.273.573.473.673.673.773.6 PctChgYearAgo-0.7-1.0-0.50.20.81.21.21.31.00.70.60.30.2 Prof&BusinessServices170.6171.4171.6171.6171.4171.8171.8170.7170.1169.4168.8168.4168.5
PctChgYearAgo-0.70.4-0.7-0.70.40.20.2-0.5-0.7-1.4-1.8-1.4-1.0 Educ&HealthServices123.4124.5125.5125.9126.3127.0127.5128.0128.3128.9129.4129.8130.1
PctChgYearAgo2.01.01.21.62.32.01.61.71.61.51.41.41.4
Leisure&Hospitality99.6100.0100.5100.6101.2101.1101.2101.7102.2102.0102.3102.7103.1
PctChgYearAgo1.90.30.71.31.61.10.71.11.00.91.11.00.9 OtherServices40.440.540.440.340.440.540.640.840.941.141.241.441.5
PctChgYearAgo9.45.92.51.40.00.00.61.11.31.51.41.41.5 FederalGovernment7.87.97.98.08.08.08.08.18.18.18.18.18.2
PctChgYearAgo3.72.82.81.91.71.31.21.31.31.21.11.00.9
State&LocalGovernment103.3103.8104.2104.3104.5104.5104.6104.7104.7104.7104.8104.8104.8
PctChgYearAgo4.23.32.71.91.10.70.40.30.20.20.10.10.1
Other Economic Indicators
Population(Ths)2025.52026.72026.42026.12025.52024.12023.32023.02022.32022.92023.92024.82025.7
PctChgYearAgo1.10.80.40.10.0-0.1-0.2-0.2-0.2-0.10.00.10.2
LaborForce(Ths)1090.71096.71100.31100.91101.31102.41102.61102.81103.31103.81104.51105.11105.7
PctChgYearAgo-0.2-0.10.20.61.00.50.20.20.20.10.20.20.2
UnemploymentRate(%)3.33.33.43.43.53.63.63.63.73.73.83.83.8
TotalHousingStarts1351.91636.11950.92310.92697.33063.13403.73751.93984.04174.74291.64343.94468.4
Single-Family711.3794.7863.7925.6987.41020.61050.81080.91110.71136.51157.51176.61195.5
Multifamily640.6841.41087.21385.41709.92042.52352.92670.92873.23038.13134.13167.33273.0
PROFILES
The Gainesville MSA is comprised of Alachua and Gilchrist Counties and is located in the central north portion of the state. This metro is home to the University of Florida and the Florida Museum of Natural History, Florida’s official natural history museum.
QUICK FACTS
• Metro population estimate of 350,203 as of 2023 (ACS 5-Year Estimate) (U.S. Census Bureau).
• A lachua County population estimate of 285,994 as of 2023 (ACS 5-Year Estimate).
• Gilchrist County population estimate of 18,494 as of 2023 (ACS 5-Year Estimate).
• Civilian labor force of 151,629 in December 2024 (FRED, U.S. Bureau of Labor Statistics).
• A n unemployment rate of 3.1% as of December 2024, not seasonally adjusted. This amounts to 4,754 unemployed people (FRED, U.S. Bureau of Labor Statistics).
OUTLOOK SUMMARIES
The Gainesville Metropolitan Statistical Area (MSA) will see low levels of growth in the studied economic indicators. Gross Metro Product of $18,195.21 million will place the MSA 18th in the state for metro output. Average annual wage growth of 4.6 percent will help drive the average real annual wage to $74,200. Per capita income will be $50,800, with personal income growth at 5.6 percent. Population growth will be 0.3 percent, ranking Gainesville 22nd in the state.
Gainesville will be ranking 21st in the state for an average annual employment growth at 0.6 percent and will experience an unemployment rate of 3.6 percent.
The Other Services sector will see the largest annual growth at 2.9 percent. The Financial sector will follow with a growth rate of 2.0 percent. The two sectors experiencing the largest contraction will be the Information and Manufacturing sectors, seeing contractions of -2.3 percent and -0.7 percent respectively.
METRO NEWS SUMMARIES
Arsonist sets iconic Gainesville pizza shop seating ablaze
• A n arsonist set multiple small fires inside the iconic van seating area at Satchel’s Pizza in Gainesville early Sunday morning, using napkins and menus as fuel.
• Authorities have identified a potential suspect, whom the owner believes is struggling with mental illness rather than acting with malicious intent.
• The van, a 21-year fixture at Satchel’s and a symbol of the restaurant’s character, was destroyed, marking a significant loss for the beloved local eatery.
Source: WCJB, December 16, 2024
DeSantis reappoints two UF Board of Trustees members
• Gov. Ron DeSantis reappointed Richard Cole and Rahul Patel to the UF Board of Trustees, pending Florida Senate approval.
• Patel, vice chair of the board and leader of UF’s Presidential Search Committee, has been a trustee since 2015 and works as a lawyer in Atlanta.
• Cole, a trustee since 2020, is a South Floridabased lawyer and former UF student body president.
Source: Main Street Daily News, January 3, 2025
Gainesville City Commission swears in new and returning commissioners - The Independent Florida Alligator
• Gainesville Mayor Harvey Ward led the swearing-in ceremony for reelected commissioners Desmon Duncan-Walker and Cynthia Moore Chestnut, along with newly elected James Ingle.
• James Ingle joins the Gainesville City Commission, bringing a working-class perspective, while Desmon Duncan-Walker and Cynthia Moore Chestnut are reelected.
• D uncan-Walker emphasized past efforts to address gun violence as a public health crisis and pledged continued advocacy for resources.
Source: The Independent Florida Alligator, January 6, 2025
Foreclosure lawsuit filed against Oaks Mall claims more than $80M owed in principle, interest
• U.S. Bank filed a foreclosure complaint in December 2024 against Brookfield Properties’ Oaks Mall LLC for defaulting on a loan exceeding $78 million after it matured in October.
• The original $118.3 million loan from 2012 was extended twice before defaulting, with outstanding amounts including unpaid principal, accrued interest, and default fees.
• Brookfield Properties sold nearly 8 acres of mall land in 2023 for $3.8 million to Evergreen Westside LLC, which is currently developing an apartment complex, raising questions about the mall’s long-term viability.
Source: The Gainesville Sun, February 12, 2025
Gov. DeSantis creates Florida DOGE: Here’s what it will do
• Gov. Ron DeSantis launched Florida’s “DOGE Task Force,” modeled after Elon Musk’s federal Department of Government Efficiency (DOGE), to audit government spending and cut bureaucracy. Florida DOGE will leverage AI to track spending, audit contracts, and flag inefficiencies.
• The task force will ensure Diversity, Equity, and Inclusion (DEI) programs are removed from state agencies, colleges, and universities. The team’s X account criticized Gainesville’s Office of Equity and Inclusion for its $1.45
million budget, highlighting positions related to diversity, equity, and inclusion.
• The task force will also review state agencies and local governments for excess spending, with a focus on eliminating redundant programs and commissions. DOGE Florida is set to operate for one year, with state agencies providing monthly updates.
Source: Fox35 Orlando, February 24, 2025
Long Term Outlook for Gainesville, FL
March 2025 Forecast
Personal Income (Billions $)
202020212022202320242025202620272028
TotalPersonalIncome14.015.315.716.917.718.719.921.022.1
PctChgYearAgo6.69.12.47.45.25.76.45.35.2
WagesandSalaries7.98.69.29.810.511.111.812.312.8
NonwageIncome6.26.76.57.07.37.68.18.79.3
RealPersonalIncome(12$)14.514.714.014.414.815.315.816.316.8
PctChgYearAgo6.81.4-4.42.92.53.03.53.13.2
PerCapitaIncome(Ths)47.251.051.454.456.659.463.266.469.7
RealPerCapitaIncome(12$)48.748.846.046.647.348.450.151.653.1
AverageAnnualWage(Ths)55.058.060.663.466.268.872.875.979.1
PctChgYearAgo8.65.44.54.64.53.95.84.24.3
Establishment Employment (Place of Work, Thousands, SA)
TotalEmployment142.4147.3151.2154.8157.7160.9161.6161.3161.3 PctChgYearAgo-3.73.42.62.41.82.00.4-0.20.0 Manufacturing4.54.64.74.64.54.54.54.44.4
PctChgYearAgo-6.72.22.9-3.5-1.41.2-0.6-1.6-1.8
Nonmanufacturing137.9142.7146.4150.3153.2156.3157.1156.9156.9
PctChgYearAgo-3.63.52.62.61.92.10.5-0.10.0
Construction&Mining6.16.26.36.26.36.56.56.56.6
PctChgYearAgo1.41.80.5-0.61.12.81.00.10.7
Trade,Trans,&Utilities20.421.521.922.122.823.323.223.122.9 PctChgYearAgo-3.05.32.10.82.92.4-0.4-0.4-0.8 WholesaleTrade3.13.13.33.43.63.73.73.83.8 RetailTrade13.814.314.414.414.815.114.814.614.5 Trans,Wrhsng,&Util3.54.04.24.24.44.54.64.74.7 Information1.51.92.11.91.91.81.81.81.7 PctChgYearAgo-11.820.011.2-6.7-2.1-2.9-0.4-3.7-2.1 FinancialActivities6.66.56.66.56.46.66.86.96.9 PctChgYearAgo-4.2-2.41.6-1.1-1.42.63.61.60.3 Prof&BusinessServices15.617.818.518.818.818.918.818.418.5
PctChgYearAgo1.513.73.81.60.01.0-0.6-2.20.4 Educ&HealthServices26.727.228.030.031.132.132.332.332.1 PctChgYearAgo-1.41.73.17.03.83.10.8-0.2-0.5 Leisure&Hospitality13.314.615.716.016.116.216.316.516.8 PctChgYearAgo-17.810.57.51.90.20.60.91.21.6 OtherServices4.34.44.54.85.05.25.45.55.6
PctChgYearAgo-8.21.12.96.63.84.73.32.11.6 FederalGovernment4.94.84.95.15.35.45.45.35.3
PctChgYearAgo7.0-1.71.04.13.22.20.0-0.7-0.9 State&LocalGovernment38.437.938.038.939.740.440.540.640.6 PctChgYearAgo-2.5-1.20.32.32.11.80.20.10.0
Other Economic Indicators
Population(Ths)297.3300.7305.5309.9313.2315.2315.5316.0316.8
PctChgYearAgo0.91.11.61.41.10.60.10.20.3
LaborForce(Ths)141.2145.3147.8151.4152.5153.4153.1152.4151.8 PercentChange,YearAgo-2.62.91.72.40.80.6-0.2-0.4-0.4
UnemploymentRate(%)5.73.82.93.13.53.73.73.73.5
TotalHousingStarts1972.42212.22667.21576.41641.71211.31492.01620.71660.3 Single-Family919.01298.41178.1981.6927.1966.1990.6937.4902.0 Multifamily1053.4913.81489.1594.8714.5245.2501.4683.3758.4
Short Term Outlook for Gainesville, FL
March 2025 Forecast
Personal Income (Billions $)
2024:42025:12025:22025:32025:42026:12026:22026:32026:42027:12027:22027:32027:4
TotalPersonalIncome18.018.318.618.919.219.519.820.120.320.620.921.121.4
PctChgYearAgo4.94.55.36.36.56.86.96.15.75.45.15.35.4
WagesandSalaries10.710.811.011.211.411.611.811.912.012.112.212.312.5
NonwageIncome7.37.57.67.77.87.98.18.28.38.58.68.88.9
RealPersonalIncome(12$)14.915.115.215.315.515.615.815.915.916.116.216.416.5
PctChgYearAgo2.62.32.93.53.53.83.93.43.12.92.93.23.4
PerCapitaIncome(Ths)57.358.158.960.060.962.062.963.664.365.266.066.967.6
RealPerCapitaIncome(12$)47.547.848.148.749.149.650.050.350.550.951.451.852.1
AverageAnnualWage(Ths)66.867.568.169.270.471.672.673.273.974.775.576.377.1
PctChgYearAgo3.72.43.64.45.36.26.55.75.04.34.04.34.3
Establishment Employment (Place of Work, Thousands, SA)
TotalEmployment159.1160.1161.0161.2161.3161.5161.6161.6161.6161.4161.4161.3161.2
PctChgYearAgo2.02.82.21.81.30.90.40.30.2-0.1-0.2-0.2-0.2
Manufacturing4.54.54.54.64.64.54.54.54.54.54.54.44.4
PctChgYearAgo-0.11.41.21.20.80.1-0.2-1.0-1.4-1.4-1.5-1.8-1.8
Nonmanufacturing154.6155.5156.5156.7156.7157.0157.1157.1157.1157.0156.9156.9156.8
PctChgYearAgo2.02.92.21.81.40.90.40.30.30.0-0.1-0.2-0.2
Construction&Mining6.36.46.56.56.56.56.56.56.56.56.56.56.5
PctChgYearAgo1.53.13.02.72.72.01.10.60.30.20.10.10.2
Trade,Trans,&Utilities22.923.223.423.423.323.223.223.223.223.123.123.123.1
PctChgYearAgo2.43.32.42.11.80.3-0.7-0.6-0.7-0.5-0.4-0.4-0.4 WholesaleTrade3.63.63.73.73.73.73.73.83.83.83.83.83.8 RetailTrade14.915.015.115.115.114.914.814.814.714.714.714.714.6 Trans,Wrhsng,&Util4.44.54.54.54.64.64.64.74.74.74.74.74.7 Information1.91.81.81.81.81.81.81.81.81.81.81.71.7
PctChgYearAgo-3.6-2.3-3.7-4.2-1.2-0.20.5-0.3-1.8-3.2-3.8-4.0-3.9 FinancialActivities6.46.56.56.66.66.76.86.86.96.96.96.96.9
PctChgYearAgo-0.11.12.63.83.13.83.63.73.22.41.81.20.9 Prof&BusinessServices18.818.919.019.018.919.018.918.818.718.518.418.318.3
PctChgYearAgo0.82.01.00.30.70.3-0.2-1.0-1.4-2.4-2.6-2.2-1.7 Educ&HealthServices31.731.832.132.232.132.332.332.332.332.332.332.332.2
PctChgYearAgo4.54.43.92.81.31.30.70.60.60.1-0.1-0.3-0.4
Leisure&Hospitality16.016.016.216.216.316.216.316.416.416.416.516.616.7
PctChgYearAgo-0.5-0.30.90.02.01.30.60.90.91.01.31.31.4
OtherServices5.15.15.25.25.35.35.45.45.45.55.55.55.5
PctChgYearAgo4.84.95.05.04.04.03.23.12.82.52.22.01.9
FederalGovernment5.35.35.45.45.45.45.45.45.45.45.35.35.3
PctChgYearAgo1.21.52.12.72.41.2-0.2-0.5-0.5-0.6-0.6-0.7-0.8
State&LocalGovernment40.240.440.540.540.440.540.540.540.640.640.640.640.6
PctChgYearAgo2.03.61.51.70.50.20.10.20.40.30.20.1-0.1
Other Economic Indicators
Population(Ths)314.5315.0315.3315.2315.3315.4315.4315.5315.5315.7315.9316.1316.2
PctChgYearAgo1.11.00.80.50.30.10.10.10.10.10.10.20.2
LaborForce(Ths)152.4153.1153.5153.5153.4153.3153.1153.0152.8152.6152.5152.3152.2
PctChgYearAgo0.10.30.60.70.70.1-0.3-0.4-0.4-0.5-0.4-0.4-0.4
UnemploymentRate(%)3.63.63.73.73.73.73.73.73.73.73.73.73.6
TotalHousingStarts941.81093.61183.61254.71313.51350.11437.81549.71630.61623.51619.11616.91623.2
Single-Family811.9920.8957.0987.2999.31000.81007.3987.9966.5952.8940.8931.9924.0
Multifamily129.9172.8226.6267.5314.1349.4430.4561.8664.1670.7678.2685.0699.1
PROFILES
The Homosassa Springs MSA is located in the central northwest portion of the state. Homosassa Springs is a Census-designated place in Citrus County and is known for and named after the warm spring located in Homosassa Springs Wildlife State Park which attracts manatees to the area.
QUICK FACTS
• Metro population estimate of 166,696 as of 2023 (ACS 5-Year Estimate) (U.S. Census Bureau).
• Citrus County population estimate of 166,696 as of 2023 (ACS 5-Year Estimate).
• Civilian labor force of 48,850 in December 2024 (FRED, U.S. Bureau of Labor Statistics).
• A n unemployment rate of 4.8% as of December 2024, not seasonally adjusted. This amounts to 2,355 unemployed people (FRED, U.S. Bureau of Labor Statistics).
OUTLOOK SUMMARIES
The Homosassa Springs Metropolitan Statistical Area (MSA) is expected to see mixed levels of growth in most of the economic indicators. Homosassa’s expected Gross Metro Product will be $5,597.35 million. Personal income growth of 6.4 percent (7th highest) will put the MSA’s per capita income level at $43,400, the third lowest in the state. Average annual wage growth of 4.1 percent will push the average real annual wage up to $59,800, the 2nd lowest in the state. Population growth will reach 1.1 percent, ranking 11th compared to other MSAs studied.
Employment growth is expected to average 1.3 percent annually. Homosassa’s unemployment rate will come in at 5.7 percent, the highest in the state. The fastest growing sector in the Homosassa Springs MSA will be the Other Services sector, which will see an average annual growth rate of 2.6 percent. The Construction and Mining sector will come in second at a growth rate of 2.4 percent. The
Information sector will see the largest contraction at -1.6 percent.
METRO NEWS SUMMARIES
Proposed RV resort near Withlacoochee River aims to ‘preserve nature’ in area despite facing backlash from community
• Plans for the Paradise Meadows RV Resort, an 18-acre development near the Withlacoochee River, aim to maintain the area’s natural beauty while providing a unique RV park experience. The project is expected to take two years to complete if approved.
• L ocal opposition has formed, with groups like “Save Our Withlacoochee River From RV Rezoning” voicing concerns about environmental impacts and the loss of the Nature Coast’s natural character.
• Developers insist they will preserve trees and protect the river, emphasizing that the project will be a “Mother Nature masterpiece” and minimize ecological disturbance.
Source: Spectrum News, February 6, 2025
Golfers ready to tee up to support education
• The Women of Sugarmill Woods hosted their 28th annual School-astic Golf Classic on Feb. 24 to raise scholarship funds for Citrus County students. The 2024 tournament raised $30,500, awarding 15 students $1,500 scholarships each.
• Funds raised go toward scholarships and local educational initiatives, including Take Stock in Children, Withlacoochee Technical College, and Homosassa Elementary School. Since its inception, the organization has donated over $1.5 million to education and community programs.
• The event includes raffles and sponsorships from local businesses, and past scholarship recipients, including a Citrus County middle school teacher, spoke about the program’s impact.
Source: Citrus County Chronicle, February 13, 2025
Program to elevate, rebuild or harden home available now
• Applications opened for Citrus County home and business owners to apply for Elevate Florida, a one-time federal program covering at least 75% of costs to elevate, rebuild, or stormharden properties. This is in response to the storm damage residents have seen in previous months.
• Unlike the Flood Mitigation Assistance Grant Program (FMA), which takes three years, Elevate Florida streamlines approvals, allowing projects to finish in 18 months or less. The program is funded with $400 million, exclusively for Florida.
• Funding covers up to 100% of costs depending on damage severity, with a $220,000 cap on labor and materials. Citrus County already has 143 applicants seeking flood mitigation. Prior flooding is not required to apply.
Source: Citrus County Chronicle, February 14, 2025
Inverness staff unveil Festival of Arts changes to council
• The Inverness Festival of the Arts, set for Nov. 15-16, will feature interactive and immersive art experiences, including hands-on activities in painting, sculpture, cinema, theater, and music, along with live performances and student showcases.
• The city’s annual bass fishing tournament on March 7-8 will expand to include a barbecue competition, outdoor expo, and bluegrass concerts featuring eight bands. The event will be free to attend.
• The Inverness City Council approved a sewer project revision to reduce homeowner costs, adjusted commercial reclaimed water rates, and approved a $156,004 contract for road paving over two years.
Source: Citrus County, February 20, 2025
Homosassa Springs MSA Industry Location Quotients
Long Term Outlook for Homosassa Springs, FL March 2025 Forecast
202020212022202320242025202620272028
Personal Income (Billions $)
TotalPersonalIncome6.47.27.37.98.38.89.410.010.6
PctChgYearAgo8.611.81.57.85.66.36.96.46.0
WagesandSalaries1.41.71.81.81.92.12.22.32.4
NonwageIncome5.05.55.56.06.46.87.27.78.2
RealPersonalIncome(12$)6.87.06.66.87.07.37.67.98.2
PctChgYearAgo8.53.1-5.73.02.93.64.04.24.0
PerCapitaIncome(Ths)41.545.344.446.447.950.253.155.958.7
RealPerCapitaIncome(12$)44.144.440.440.440.641.542.744.145.4
AverageAnnualWage(Ths)44.749.451.351.454.055.858.861.163.6
PctChgYearAgo6.210.33.90.25.13.35.43.94.0
Establishment Employment (Place of Work, Thousands, SA)
TotalEmployment32.133.435.035.635.836.537.137.337.7
PctChgYearAgo-3.84.14.91.80.42.21.40.61.0
Manufacturing0.50.60.60.60.50.50.50.50.5
PctChgYearAgo1.37.81.71.2-9.20.7-2.20.10.2
Nonmanufacturing31.532.834.435.135.236.036.536.837.1
PctChgYearAgo-3.94.05.01.80.52.21.50.61.0
Construction&Mining3.03.13.43.33.33.43.53.63.6
PctChgYearAgo0.33.59.1-3.71.33.73.11.21.5 Trade,Trans,&Utilities7.27.37.67.57.67.87.98.08.0
PctChgYearAgo-2.72.43.1-0.91.42.51.11.00.8 WholesaleTrade1.01.01.11.11.11.11.21.21.2 RetailTrade5.05.15.25.25.35.45.45.45.4 Trans,Wrhsng,&Util1.21.21.31.31.31.31.31.41.4 Information0.30.30.30.30.30.30.30.30.2
PctChgYearAgo-7.5-7.35.00.3-7.02.0-0.4-4.6-3.6 FinancialActivities1.31.41.51.61.61.71.71.71.7
PctChgYearAgo-0.710.96.74.74.22.32.1-0.6-1.1 Prof&BusinessServices3.23.64.03.93.83.83.83.83.9
PctChgYearAgo-0.111.312.0-2.0-1.9-1.10.2-0.62.5 Educ&HealthServices7.37.27.17.47.67.87.98.08.0
PctChgYearAgo-6.0-0.4-1.14.31.42.91.90.40.5
Leisure&Hospitality4.24.65.15.45.35.45.55.65.6
PctChgYearAgo-8.410.19.25.6-1.32.81.41.01.3
OtherServices0.90.91.01.11.11.11.21.21.2
PctChgYearAgo-9.39.510.84.4-0.43.42.52.02.4
FederalGovernment0.20.20.20.20.20.30.30.30.2
PctChgYearAgo-7.9-12.55.16.35.812.81.1-2.7-5.4
State&LocalGovernment4.14.14.34.44.44.54.54.54.6
PctChgYearAgo-2.21.63.23.70.40.70.91.01.3
Other Economic Indicators
Population(Ths)154.8158.8164.2169.4173.3175.8177.5179.4181.3
PctChgYearAgo1.92.63.43.22.31.41.01.11.0
LaborForce(Ths)46.547.649.150.049.850.150.550.751.0
PercentChange,YearAgo-1.02.53.01.8-0.40.60.80.50.5
UnemploymentRate(%)8.95.84.34.55.25.55.75.85.6
TotalHousingStarts897.01848.11625.12171.22466.02218.61478.61338.81311.7
Single-Family857.21835.21622.62169.62456.32201.51445.21298.41265.0
Multifamily39.813.02.41.69.717.033.440.446.7
Short Term Outlook for Homosassa Springs, FL
March 2025 Forecast
Personal Income (Billions $)
2024:42025:12025:22025:32025:42026:12026:22026:32026:42027:12027:22027:32027:4
TotalPersonalIncome8.48.68.78.99.09.29.49.59.69.810.010.110.3
PctChgYearAgo5.35.15.97.07.17.17.26.86.46.46.36.36.4
WagesandSalaries2.02.02.02.12.12.22.22.22.22.32.32.32.3
NonwageIncome6.56.66.76.86.97.17.27.37.47.67.77.87.9
RealPersonalIncome(12$)7.17.27.37.37.47.57.67.67.77.87.98.08.0
PctChgYearAgo3.02.93.54.14.14.14.34.03.83.94.04.24.5
PerCapitaIncome(Ths)48.449.149.750.651.352.152.853.554.054.955.656.356.9
RealPerCapitaIncome(12$)40.841.041.341.742.042.342.642.943.143.543.944.344.5
AverageAnnualWage(Ths)54.554.955.356.157.158.058.659.159.760.260.861.462.0
PctChgYearAgo4.51.93.03.94.65.66.05.34.63.93.94.03.9
Establishment Employment (Place of Work, Thousands, SA)
TotalEmployment35.836.236.536.636.836.937.137.137.137.237.237.337.4
PctChgYearAgo0.62.12.11.92.61.91.51.31.00.60.50.60.8
Manufacturing0.50.50.50.50.50.50.50.50.50.50.50.50.5
PctChgYearAgo-8.05.10.5-1.7-0.9-2.2-2.4-2.4-1.7-0.40.30.30.4
Nonmanufacturing35.335.736.036.136.336.436.536.636.636.636.736.836.9
PctChgYearAgo0.72.12.11.92.72.01.61.41.00.70.50.60.8
Construction&Mining3.43.43.43.53.53.53.53.63.63.63.63.63.6
PctChgYearAgo4.64.44.12.83.63.53.53.12.41.91.10.81.0
Trade,Trans,&Utilities7.67.77.87.87.87.87.97.97.97.98.08.08.0
PctChgYearAgo0.41.82.22.63.21.60.91.10.91.01.01.01.2 WholesaleTrade1.11.11.11.11.11.11.21.21.21.21.21.21.2
RetailTrade5.35.35.45.45.45.45.45.45.45.45.45.45.4 Trans,Wrhsng,&Util1.31.31.31.31.31.31.31.41.41.41.41.41.4
Information0.30.30.30.30.30.30.30.30.30.30.30.30.3
PctChgYearAgo0.64.42.40.50.80.50.7-0.4-2.2-3.7-4.5-5.1-5.2 FinancialActivities1.61.61.71.71.71.71.71.71.71.71.71.71.7
PctChgYearAgo1.71.91.92.03.33.02.42.10.8-0.1-0.6-0.8-0.7 Prof&BusinessServices3.83.83.83.83.83.83.83.83.83.83.83.83.8
PctChgYearAgo-3.7-1.9-1.7-1.20.60.50.7-0.1-0.2-1.0-1.2-0.30.3
Educ&HealthServices7.67.77.87.87.87.97.97.97.97.97.98.08.0
PctChgYearAgo0.22.32.52.93.93.02.31.51.00.50.20.30.5
Leisure&Hospitality5.45.45.45.45.55.55.55.55.55.55.65.65.6
PctChgYearAgo1.44.43.21.62.11.51.31.51.20.91.11.01.0
OtherServices1.11.11.11.11.11.11.11.21.21.21.21.21.2
PctChgYearAgo-0.71.83.03.95.03.62.72.11.71.71.82.12.4
FederalGovernment0.30.30.30.30.30.30.30.30.30.30.30.30.3
PctChgYearAgo15.114.915.116.65.53.41.50.1-0.5-1.1-2.2-3.1-4.7
State&LocalGovernment4.44.54.54.54.54.54.54.54.54.54.54.64.6
PctChgYearAgo1.50.70.90.50.70.80.91.00.90.80.91.01.2
Other Economic Indicators
Population(Ths)174.5175.1175.6176.0176.3176.8177.3177.8178.2178.7179.2179.7180.1
PctChgYearAgo2.01.81.51.21.01.01.01.01.11.11.01.11.1
LaborForce(Ths)49.549.850.150.250.350.450.450.550.550.650.750.850.8
PctChgYearAgo-1.1-0.50.31.11.61.20.70.60.50.50.50.50.5
UnemploymentRate(%)5.45.45.55.65.65.75.75.85.85.85.85.85.8
TotalHousingStarts2658.82595.22335.32101.51842.21611.21507.91429.61365.71351.91340.51333.61329.3
Single-Family2650.72586.42319.52082.51817.71583.41476.31391.51329.51314.21301.21292.51285.9
Multifamily8.18.915.819.024.527.831.638.036.237.839.441.143.4
PROFILES
The Jacksonville MSA is comprised of Baker, Clay, Duval, Nassau, and St. Johns counties. It is located on the northeast coast of Florida and is home to several major U.S. military bases, such as the Jacksonville Naval Air Station, shipyards, the University of North Florida, and the Jacksonville International Airport.
QUICK FACTS
• Metro population estimate of 1,713,240 as of 2023 (ACS 5-Year Estimate) (U.S. Census Bureau).
• Baker County population estimate of 28,186 as of 2023 (ACS 5-Year Estimate).
• Clay County population estimate of 232,439 as of 2023 (ACS 5-Year Estimate).
• D uval County population estimate of 1,030,822 as of 2023 (ACS 5-Year Estimate).
• Nassau County population estimate of 101,501 as of 2023 (ACS 5-Year Estimate).
• St. Johns County population estimate of 320,110 as of 2023 (ACS 5-Year Estimate).
• Civilian labor force of 842,067 in December 2024 (FRED, U.S. Bureau of Labor Statistics).
• A n unemployment rate of 3.0% as of December 2024, not seasonally adjusted. This amounts to 25,480 unemployed people (FRED, U.S. Bureau of Labor Statistics).
OUTLOOK SUMMARIES
The Jacksonville Metropolitan Statistical Area (MSA) is expected to see above-average growth in most of the economic indicators, relative to the other MSAs studied. Jacksonville’s expected Gross Metro Product will be $115,407.96 million, ranking 7th in the state. Personal income growth of 5.9 percent will put the MSA’s per capita income level at $57.6K. Average annual wage growth of 4.6 percent will push the average real annual wage to $83,400, the 6th highest in the state. Population growth will be 1.2 percent.
Employment growth is expected to average 1.1 percent annually. Jacksonville’s unemployment rate
will come in at 3.7 percent.
The fastest growing sector in the Jacksonville MSA will be the Other Services sector, which will see an average annual growth rate of 3.0 percent. The Education/Health Services sector will come in second at a growth rate of 2.1 percent. The Information and Manufacturing sectors will see respective contractions in growth of -3.6 percent, and -1.6 percent.
METRO NEWS SUMMARIES
UF moves forward with site for new campus in Jacksonville
• U F’s Board of Trustees approved a site near the Prime F. Osborn III Convention Center for its new campus, pending final approval. The location is near corporate hubs and growing neighborhoods, aiming to boost economic and workforce development.
• Launching in Fall 2026, UF will offer AI, cybersecurity, biomedical sciences, law, and engineering programs. The campus will also support UF Health and house the Florida Semiconductor Institute for semiconductor research.
• Jacksonville’s rapid growth aligns with UF’s AI-driven curriculum, preparing students for high-demand industries and strengthening the city’s role as an innovation hub.
Source: UF News, December 12, 2024
Jacksonville Armada buys 6.56 acres of vacant Downtown land for new stadium | Jax Daily Record
• The Jacksonville Armada purchased 6.56 acres of downtown land for $1, with plans to build a stadium with an initial capacity of 2,545 seats, expanding to 9,472 in phase two. Construction begins this year, with completion expected for the 2026 season.
• The stadium will be a major addition to Jacksonville’s Sports and Entertainment District, driving foot traffic, creating jobs, and supporting local businesses. The project aligns
with the city’s efforts to revitalize downtown and attract investment.
• The city approved an $11.5 million permit to clear 4.84 acres, with development led by ColtGreen Construction and Gilbane Building Co. The project is expected to stimulate economic growth through job creation and increased tourism.
Source: Jacksonville Daily Record, December 31, 2024
Jacksonville International Airport passenger traffic reaches all-time high in 2024
• Jacksonville International Airport (JAX) saw 7.6 million passengers in 2024, a 3% increase from 2023, marking its busiest year ever.
• To accommodate growth, JAX is constructing a third concourse (six new gates) and a third parking garage (2,000 spaces), both expected to be completed by 2026.
• Avelo Airlines, Air Canada, Allegiant Airlines, and Breeze Airways are introducing new routes in 2024, expanding JAX’s connectivity to New Haven, Toronto, and other U.S. cities.
Source: News4Jax, January 31, 2025
Switch from Biden to Trump might turn off grant for EV charging stations in Jacksonville
• A $2.8 million federal grant for 100 electric vehicle charging stations in Jacksonville is stalled due to President Trump’s executive order halting funding from the Charging and Fueling Infrastructure Grant Program.
• Trump revoked Biden’s executive order promoting electric vehicles and declared an end to the “Green New Deal,” aiming to remove incentives for EV adoption.
• A federal judge will determine whether Trump can legally block grant funding already approved by Congress, with a hearing set for Monday.
Source: Jacksonville Florida Times-Union, January 31, 2025
Emergency facility expansion set for Baptist Medical Center in Jacksonville, Florida
• A $190 million, four-story emergency medicine facility is set to be built in downtown Jacksonville, Florida, designed by healthcare architecture firm Hoefer Welker.
• The 123,000-square-foot tower will house two separate emergency rooms, three pediatric trauma rooms, a suite for endoscopy procedures, and cardiovascular care areas. It will improve accessibility with a more visible patient drop-off area.
• The new facility will be connected to both Baptist Medical Center and Wolfson Children’s Hospital, with an expected opening in 2029.
Source: CoStar News, February 7, 2025
Thompson Thrift To Build Luxury Jacksonville Community
• Thompson Thrift is set to begin construction of Velara, a 312-unit luxury community in Ponte Vedra’s Nocatee area, in mid-February.
• Velara will offer studio to three-bedroom apartments. Community perks include a covered pool deck, fire pit, pickleball courts, a fitness center, and pet-friendly amenities.
• Jacksonville’s job and population growth, businessfriendly environment, and corporate relocations fuel demand for multifamily developments. Experts predict rental price growth as new construction slows, creating a supply gap.
Source: MultiHousing News, February 7, 2025
Long Term Outlook for Jacksonville, FL
March 2025 Forecast
Personal Income (Billions $)
202020212022202320242025202620272028
TotalPersonalIncome88.499.0104.1111.9118.8125.7133.7141.3149.3
PctChgYearAgo8.411.95.27.56.25.86.35.75.7
WagesandSalaries44.048.654.357.661.164.869.272.576.3
NonwageIncome44.450.449.854.357.760.964.568.873.0
RealPersonalIncome(12$)87.792.091.093.696.999.9103.4107.1111.0
PctChgYearAgo6.75.0-1.12.83.53.23.53.53.7
PerCapitaIncome(Ths)54.860.161.564.366.969.873.476.880.2
RealPerCapitaIncome(12$)54.355.953.853.854.555.556.858.259.7
AverageAnnualWage(Ths)60.964.368.971.374.477.481.885.389.0
PctChgYearAgo6.95.67.13.54.34.15.74.24.4
Establishment Employment (Place of Work, Thousands, SA)
TotalEmployment706.1736.0771.3790.9805.1820.2828.5833.6840.6
PctChgYearAgo-2.54.24.82.51.81.91.00.60.8
Manufacturing32.532.834.435.936.236.035.334.633.9
PctChgYearAgo-0.20.94.94.60.6-0.5-1.7-2.0-2.1
Nonmanufacturing673.6703.3737.0754.9768.9784.2793.1799.0806.7 PctChgYearAgo-2.64.44.82.41.92.01.10.71.0
Construction&Mining46.348.250.250.652.954.855.455.856.7 PctChgYearAgo-0.54.24.10.94.63.51.10.71.5 Trade,Trans,&Utilities155.3160.4167.5169.3171.9175.3176.0177.2177.2 PctChgYearAgo-1.43.34.41.01.62.00.40.70.0 WholesaleTrade26.627.028.829.731.232.232.332.532.2 RetailTrade78.081.283.184.986.086.986.486.786.9 Trans,Wrhsng,&Util50.752.255.654.754.756.357.358.058.1 Information10.511.413.514.514.414.213.813.012.4 PctChgYearAgo4.49.118.56.9-0.7-1.1-3.1-5.7-4.7 FinancialActivities66.970.073.275.574.073.274.675.776.2 PctChgYearAgo0.84.54.63.2-2.1-1.01.91.40.6 Prof&BusinessServices108.3115.6123.8121.9120.6121.5123.1122.8125.6 PctChgYearAgo-1.36.87.1-1.6-1.00.71.3-0.22.3 Educ&HealthServices109.2112.1117.6124.9130.3135.8138.3140.0141.5
PctChgYearAgo-0.32.74.96.34.34.21.91.21.1 Leisure&Hospitality73.881.286.791.394.196.597.798.799.9
PctChgYearAgo-15.110.16.85.33.12.61.11.01.2 OtherServices26.227.227.327.928.829.630.431.432.4 PctChgYearAgo-4.63.80.32.13.42.72.93.33.1 FederalGovernment19.219.019.019.520.320.921.021.021.0
PctChgYearAgo2.9-0.90.02.74.03.00.50.1-0.1 State&LocalGovernment58.158.158.159.661.662.362.863.363.9
PctChgYearAgo-1.80.2-0.12.53.31.20.80.90.9
Other Economic Indicators
Population(Ths)1614.11646.91693.11740.11776.21800.11819.91840.51860.7
PctChgYearAgo1.72.02.82.82.11.31.11.11.1
LaborForce(Ths)774.2799.1825.4845.0849.4856.6864.8871.9879.5
PercentChange,YearAgo-0.53.23.32.40.50.81.00.80.9
UnemploymentRate(%)6.64.12.93.03.33.53.73.93.8 TotalHousingStarts15413.120950.820788.418960.815108.415797.215880.815535.215450.2
Single-Family12655.915881.614387.612923.112939.113329.412648.112034.411618.4
Multifamily2757.25069.26400.86037.72169.32467.83232.73500.73831.8
Short Term Outlook for Jacksonville, FL
March 2025 Forecast
Personal Income (Billions $)
2024:42025:12025:22025:32025:42026:12026:22026:32026:42027:12027:22027:32027:4
TotalPersonalIncome120.8122.6124.6126.8128.8130.9132.9134.5136.3138.4140.3142.3144.2
PctChgYearAgo5.64.65.66.36.66.86.76.15.85.75.65.85.8
WagesandSalaries62.163.164.265.366.567.868.969.670.371.172.072.973.8
NonwageIncome58.759.560.461.462.263.164.064.966.067.368.369.470.4
RealPersonalIncome(12$)97.898.699.4100.5101.3102.3103.1103.8104.6105.6106.6107.6108.6
PctChgYearAgo3.32.43.23.53.63.83.73.33.23.23.43.73.8
PerCapitaIncome(Ths)67.668.469.370.371.272.273.173.874.675.576.477.278.0
RealPerCapitaIncome(12$)54.755.055.355.756.156.456.757.057.257.658.058.458.7
AverageAnnualWage(Ths)75.275.976.778.079.280.581.682.383.083.984.885.786.7
PctChgYearAgo3.92.54.14.75.26.06.35.64.94.24.04.24.4
Establishment Employment (Place of Work, Thousands, SA)
TotalEmployment808.8815.4819.9821.5823.8825.9827.8829.6830.6831.6832.9834.3835.6
PctChgYearAgo1.32.02.01.61.91.31.01.00.80.70.60.60.6
Manufacturing36.035.936.036.035.935.735.435.235.034.934.734.534.3
PctChgYearAgo-0.6-0.2-0.8-0.6-0.4-0.8-1.6-2.2-2.4-2.1-1.9-2.0-2.0
Nonmanufacturing772.8779.4783.9785.5787.9790.3792.4794.4795.5796.7798.2799.8801.3
PctChgYearAgo1.42.12.11.72.01.41.11.11.00.80.70.70.7
Construction&Mining54.054.454.755.055.255.355.455.555.655.755.755.956.1 PctChgYearAgo5.05.44.32.42.11.61.21.00.70.70.60.70.9 Trade,Trans,&Utilities173.1174.8175.6175.5175.5175.4175.7176.5176.6176.8177.2177.4177.4
PctChgYearAgo1.52.42.41.81.40.30.10.60.60.80.90.50.4 WholesaleTrade31.932.132.232.232.132.232.232.332.432.532.532.532.4 RetailTrade86.086.987.186.986.886.386.386.786.586.486.786.986.9 Trans,Wrhsng,&Util55.355.856.256.456.656.957.157.557.757.958.058.058.1 Information14.414.414.214.114.114.013.913.713.513.313.112.912.7
PctChgYearAgo0.91.7-1.5-2.2-2.4-2.7-2.3-3.0-4.2-5.1-5.7-6.0-6.2 FinancialActivities72.572.773.173.373.774.274.574.975.075.475.675.875.9
PctChgYearAgo-4.4-2.9-2.0-0.81.71.91.92.21.81.71.51.21.2 Prof&BusinessServices119.6120.7121.3121.8122.1123.0123.4122.9122.9122.7122.7122.7123.2 PctChgYearAgo-1.2-0.40.60.62.11.91.70.90.6-0.2-0.6-0.20.2 Educ&HealthServices132.9134.4135.7136.2136.8137.6138.1138.6138.9139.4139.8140.2140.5
PctChgYearAgo4.45.24.44.13.02.41.81.71.51.31.21.21.2
Leisure&Hospitality94.995.896.596.697.397.297.497.898.398.198.498.999.3
PctChgYearAgo2.42.62.92.32.51.50.91.21.01.01.11.11.0 OtherServices29.029.329.529.729.830.130.330.630.831.131.331.531.8
PctChgYearAgo3.33.52.42.12.62.52.73.03.33.33.23.23.3
FederalGovernment20.520.720.921.021.021.021.021.021.021.021.021.021.0
PctChgYearAgo3.33.93.42.42.41.20.30.30.30.20.10.00.0
State&LocalGovernment61.862.162.362.362.462.562.762.863.063.163.263.463.5
PctChgYearAgo1.71.71.30.71.10.70.60.80.90.90.90.90.8
Other Economic Indicators
Population(Ths)1786.91792.91797.61802.51807.41812.31817.21822.51827.61832.61837.81843.11848.5
PctChgYearAgo1.81.71.41.21.11.11.11.11.11.11.11.11.1
LaborForce(Ths)845.2852.0856.3857.9859.9862.4863.9865.5867.2869.1871.0872.9874.7
PctChgYearAgo-0.6-0.10.51.21.71.20.90.90.90.80.80.90.9
UnemploymentRate(%)3.43.43.53.63.63.73.73.83.83.83.93.93.9
TotalHousingStarts14744.915384.415758.816000.216045.715973.315902.115877.915769.815669.015559.515466.815445.5 Single-Family12778.713298.113412.613393.613213.312954.212732.612535.512370.112213.212073.511974.411876.6
Multifamily1966.22086.22346.22606.52832.43019.13169.53342.43399.83455.73486.03492.33568.8
PROFILES
The Lakeland–Winter Haven MSA is comprised only of Polk County. It is located in the westerncenter of the state and is heavily agriculturally based, especially in citrus. Lakeland is the home to Legoland Florida and is also the location of Publix Supermarket headquarters. Each year the Detroit Tigers host spring training at Joker Marchant Stadium. Lakeland is also home to Florida Polytechnic University, the newest member of the State University System.
QUICK FACTS
• Metro population estimate of 818,330 as of 2023 (ACS 5-Year Estimate) (U.S. Census Bureau).
• Polk County population estimate of 818,330 as of 2023 (ACS 5-Year Estimate).
• Civilian labor force of 344,188 in December 2024 (FRED, U.S. Bureau of Labor Statistics).
• A n unemployment rate of 3.8% as of December 2024, not seasonally adjusted. This amounts to 12,931 unemployed people (FRED, U.S. Bureau of Labor Statistics).
OUTLOOK SUMMARIES
The studied economic indicators are predicted to show mixed levels of growth in the Lakeland Metropolitan Statistical Area (MSA). Gross Metro Product for the MSA will come in at $35,577.10 million. The MSA will experience the 3rd highest personal income growth of 6.6 percent, but per capita income will be the lowest in the state at $39,300. The average annual wage will grow at an annual rate of 4.6 percent for an average annual wage of $68,500. Lakeland’s population will grow at an annual rate of 1.8 percent, the 3rd highest in the state. Employment growth is expected to average 1.4 percent, and Lakeland will experience a moderately high unemployment rate of 4.5 percent compared to the other MSAs.
The Other Services sector will lead the MSA in average annual growth at 4.0 percent. The Leisure sector will follow at 2.4 percent. The Information sector along with the Manufacturing Sector will see respective contractions in growth of -1.6 percent and -1.3 percent.
METRO NEWS SUMMARIES
Hurricane-related repairs cost at least $1.1 million at Lakeland’s RP Funding Center
• The city-owned entertainment complex and event center RP Funding Center in Lakeland generates nearly $80 million in economic impact according to Cindy Collins, the executive director of the facility. However, Hurricane Milton damaged a sizable portion of the roof of the facility in October which has caused cancellations of events.
• The economic impact of the center comes from the hotel stays, gas purchases, shopping, and eating from the visitors. The center’s operations manager says that they are in the last phase of fixing the north side of the arena. Not only was the roof damaged, so was the drainage system. Synergy NDS has been replacing and drying the insulation and ducts,
• The roof is temporarily replaced, and in 2022 the roof also had to be repaired due to Hurricane Ian. This earlier repair caused them to submit a $629,000 deductible to FEMA, but they can’t submit two deductibles on the same facility. Lakeland City Commission stepped in and approved $1.1 million to pay for the damages and insurance deductible for the recent damages.
Source: News Channel 8, December 4, 2025
City News Blog: Memorial Boulevard
Revitalization Study Survey and Public Meeting
• The City of Lakeland will conduct an Economic Development Strategy to revitalize the Memorial Boulevard corridor in collaboration with Ayres, an engineering and planning firm. The study will help develop an economic development vision and suggest innovative strategies for future infrastructure improvements.
• Lakeland has been growing incredibly fast, and Lakeland is looking to revitalize places like Memorial Boulevard to attract investors, improve pedestrian safety, boost the economy, and create more job opportunities.
• The plan for Memorial Boulevard (US 92) is a six-mile stretch of road between I-4 and East Lake Parker Drive. This study is a proactive measure to drive economic growth and enhance this corridor’s potential, and they are looking to identify clear and actionable steps for the city to introduce.
Source: City of Lakeland, January 14, 2025
What’s new and coming soon to Lakeland
• Many new things are coming to Lakeland, including restaurants and public parks. In the City Swan area there is the Publix Super Markets Information Technology Campus, a Publix Super Market, an Aldi, the Lakeland Antique Mall, and specialty olive oil and balsamic vinegar store called Alzaytoon.
• A s for community developments, there are the Mass Market redevelopment, the Orlando Health Lakeland Highlands Hospital, a Lakeland Regional Health freestanding emergency department, an AdventHealth medical complex, and a BayCare freestanding emergency department.
• For dining options, there will be a Bright Ice Scoop Shop + The Wine Garden, a Japaneseinspired place named Hakucho, a burger and fry place named Grievous Angel, and Sora which is a food hall inside the Lakeland International Airport. Education also has developments coming, such as the Florida Southern College of Architecture, Florida Polytechnical University’s Citrus Innovation Center, and a Florida Southern College golf clubhouse.
Source: New To Lakeland, February 3, 2025
City of Lakeland agrees to remove barriers, fund design of South Florida Avenue
• Lakeland County commissioners came together to fund the design phase of the reconstruction
project on South Florida Avenue, which will include removing concrete barriers, constructing two wide travel lanes and a twoway left turn lane, along with sidewalks.
• There are concerns in Lakeland regarding traffic congestion as more people are moving to the area. A 2020 decision to reduce a 5-lane road to just three, along with the introduction of concrete barriers, has naturally been a topic of debate. This road reduction project was unfinished due to disagreements over the $22 million needed.
• The City of Lakeland has agreed to pay for the design phase, manage the construction phase, and the Florida Department of Transportation (FDOT) will reimburse them for some costs. The design phase alone will cost $1,850,000. There may come additional changes, as some people are demanding crosswalks to make the road safer.
Source: Fox13 Tampa Bay, February 3, 2025
Spring training to drive economic boost in Lakeland
• Every spring, Lakeland baseball fans bring economic activity due to the spring training games. The director of Visit Central Florida has been anticipating the economic impact of these training games to be even larger than the previous year.
• In 2024, spring training generated $683 million for the entire state of Florida. Mark Jackson, the director of Visit Central Florida, has attributed a part of this impact to the Detroit Tigers’ relationship with Lakeland, which has been ongoing for 89 years.
• Jackson stated, “The Tigers’ Spring operation is not just the six weeks. That goes all year round with the training, the medical, and all the other things that happen right here in Polk County.” The Joker Marchant Stadium in Lakeland is the spring training location for the Tigers, and the 15 home games here have benefitted nearby businesses.
Source: Spectrum News 13, February 24, 2025
Long Term Outlook for Lakeland-Winter Haven, FL
March 2025 Forecast
Personal Income (Billions $)
202020212022202320242025202620272028
TotalPersonalIncome29.833.134.036.438.741.544.647.450.0
PctChgYearAgo10.711.12.77.06.57.27.56.25.5
WagesandSalaries12.413.615.116.017.118.219.620.621.5
NonwageIncome17.419.518.920.421.623.325.026.828.5
RealPersonalIncome(12$)30.531.630.431.032.233.635.236.637.9
PctChgYearAgo9.93.6-3.71.83.84.64.64.03.5
PerCapitaIncome(Ths)40.743.542.643.644.846.749.351.653.8
RealPerCapitaIncome(12$)41.741.638.237.237.237.938.839.840.8
AverageAnnualWage(Ths)51.553.356.658.561.263.667.370.173.1
PctChgYearAgo6.23.76.03.54.63.95.74.34.3
Establishment Employment (Place of Work, Thousands, SA)
TotalEmployment239.4254.2265.3271.9278.0285.4290.5292.0293.2
PctChgYearAgo1.46.24.42.52.22.71.80.50.4
Manufacturing17.918.219.619.719.919.819.519.218.9
PctChgYearAgo-0.51.57.50.60.9-0.3-1.4-1.7-1.6
Nonmanufacturing221.4236.0245.7252.3258.1265.6271.0272.8274.3
PctChgYearAgo1.66.64.12.72.32.92.00.70.5
Construction&Mining15.015.315.316.016.417.217.417.417.4
PctChgYearAgo4.62.4-0.44.72.64.61.5-0.30.0 Trade,Trans,&Utilities66.273.774.474.775.878.079.780.781.0
PctChgYearAgo8.011.40.90.41.52.92.11.30.3 WholesaleTrade11.211.311.511.712.312.612.813.012.9 RetailTrade29.331.532.332.933.233.934.134.434.5 Trans,Wrhsng,&Util25.730.930.630.230.431.632.733.333.6 Information1.82.02.42.42.32.42.42.32.2 PctChgYearAgo-6.99.722.3-1.7-3.23.3-0.1-5.0-4.4 FinancialActivities14.114.716.416.516.317.017.417.417.2 PctChgYearAgo6.04.412.00.5-1.24.12.6-0.2-1.2 Prof&BusinessServices32.935.438.039.440.240.941.340.740.9 PctChgYearAgo1.57.57.33.62.01.71.2-1.60.5 Educ&HealthServices34.535.337.139.241.142.143.143.844.4
PctChgYearAgo0.32.45.15.84.92.32.31.71.3
Leisure&Hospitality21.424.126.227.227.628.429.129.730.2
PctChgYearAgo-13.112.88.63.81.33.02.71.81.9 OtherServices6.97.37.77.98.28.69.09.39.5
PctChgYearAgo-4.06.74.83.72.85.74.53.02.6
FederalGovernment1.41.31.31.41.41.61.61.51.5
PctChgYearAgo13.6-9.03.46.44.39.50.2-2.7-3.3
State&LocalGovernment27.426.826.927.528.729.529.930.030.0
PctChgYearAgo0.0-2.00.22.44.32.81.40.40.0
Other Economic Indicators
Population(Ths)731.5760.2797.6833.0864.4888.6906.0918.7928.4
PctChgYearAgo2.53.94.94.43.82.82.01.41.1
LaborForce(Ths)318.7327.2336.1344.2347.3349.8351.7352.9354.1
PercentChange,YearAgo4.92.72.72.40.90.70.50.30.3
UnemploymentRate(%)9.55.33.63.64.14.44.64.64.5
TotalHousingStarts9139.112399.411451.211668.110181.27930.97884.77783.67664.7
Single-Family7105.210253.39162.18944.48894.66777.16685.26538.26282.4
Multifamily2033.92146.12289.12723.71286.61153.81199.61245.41382.2
Short Term Outlook for Lakeland-Winter Haven, FL
March 2025 Forecast
Personal Income (Billions $)
2024:42025:12025:22025:32025:42026:12026:22026:32026:42027:12027:22027:32027:4
TotalPersonalIncome39.540.241.142.042.843.644.445.045.646.447.147.748.3
PctChgYearAgo6.55.76.97.98.48.38.17.26.66.46.16.16.0
WagesandSalaries17.317.718.018.518.819.219.519.820.020.220.520.720.9
NonwageIncome22.122.523.023.523.924.324.825.325.626.226.627.127.4
RealPersonalIncome(12$)32.632.933.433.934.334.735.135.435.636.036.436.837.1
PctChgYearAgo4.23.44.55.05.35.25.14.43.93.93.94.04.1
PerCapitaIncome(Ths)45.145.646.347.147.848.449.149.650.050.751.351.952.4
RealPerCapitaIncome(12$)37.237.437.738.138.338.538.839.039.139.439.740.040.2
AverageAnnualWage(Ths)61.962.463.064.065.166.267.067.668.269.069.870.571.2
PctChgYearAgo4.12.23.94.65.06.06.45.64.94.24.14.34.4
Establishment Employment (Place of Work, Thousands, SA)
TotalEmployment278.6281.7284.9287.0288.1289.2290.2291.1291.6291.7291.9292.1292.3
PctChgYearAgo1.42.12.52.73.42.71.91.41.20.90.60.40.2
Manufacturing19.719.719.819.919.819.719.619.519.419.319.219.119.1
PctChgYearAgo-1.1-0.4-1.0-0.40.6-0.3-1.0-2.0-2.2-1.9-1.7-1.8-1.6
Nonmanufacturing258.9262.0265.1267.1268.3269.5270.6271.6272.2272.4272.7273.0273.2
PctChgYearAgo1.62.32.82.93.62.92.11.71.41.10.80.50.4
Construction&Mining16.616.917.117.317.417.417.417.417.417.417.417.317.3 PctChgYearAgo3.24.85.03.94.73.31.90.80.20.0-0.3-0.5-0.5 Trade,Trans,&Utilities75.776.878.078.678.879.079.480.080.380.580.780.980.9
PctChgYearAgo0.41.82.63.24.02.81.81.81.91.91.61.10.8 WholesaleTrade12.312.412.612.612.712.812.812.912.913.013.013.013.0 RetailTrade33.133.633.934.034.033.934.134.334.334.334.434.534.5 Trans,Wrhsng,&Util30.430.931.531.932.132.432.632.933.133.233.333.433.4 Information2.32.42.42.42.42.42.42.42.32.32.32.22.2 PctChgYearAgo1.63.92.94.32.31.80.9-0.9-2.2-3.9-4.8-5.3-5.8 FinancialActivities16.416.616.917.217.317.417.417.517.517.517.417.417.3 PctChgYearAgo-0.91.73.95.05.74.83.21.80.80.30.0-0.5-0.7 Prof&BusinessServices40.140.540.841.041.141.441.541.341.140.940.740.640.5 PctChgYearAgo1.51.91.01.52.42.11.80.60.1-1.2-1.9-1.7-1.5 Educ&HealthServices41.441.642.042.342.542.743.043.243.443.643.843.944.0
PctChgYearAgo2.92.32.22.02.72.72.32.32.22.01.81.61.5 Leisure&Hospitality27.527.928.328.628.828.929.029.229.529.429.629.829.9 PctChgYearAgo0.01.42.92.94.63.52.62.42.32.02.01.81.6 OtherServices8.28.48.68.78.88.99.09.09.19.29.39.39.4 PctChgYearAgo1.32.95.26.68.06.64.73.73.13.03.03.02.9 FederalGovernment1.51.51.61.61.61.61.61.61.61.61.51.51.5
PctChgYearAgo7.39.912.89.26.23.20.7-1.3-1.8-2.2-2.5-2.9-3.2
State&LocalGovernment29.129.329.529.529.729.829.930.030.030.030.030.030.0
PctChgYearAgo5.13.73.22.41.81.61.41.41.30.90.60.30.0
Other Economic Indicators
Population(Ths)875.0881.2886.5891.1895.5899.9904.2908.2911.6914.8917.6920.0922.5
PctChgYearAgo3.53.33.02.62.32.12.01.91.81.61.51.31.2
LaborForce(Ths)345.9348.1349.8350.4350.9351.3351.5351.8352.1352.4352.8353.1353.4
PctChgYearAgo-0.4-0.10.51.01.40.90.50.40.30.30.30.40.4
UnemploymentRate(%)4.34.34.44.44.54.54.54.64.64.64.74.74.6
TotalHousingStarts7830.18101.57864.07891.87866.57761.07900.57924.47953.27868.07802.27749.87714.4
Single-Family6587.36946.66764.06735.56662.46582.96692.56724.26741.06646.16563.76499.26443.9
Multifamily1242.81154.91100.01156.31204.11178.11207.91200.21212.21221.91238.51250.61270.5
PROFILES
The Miami-Fort-Lauderdale-West Palm Beach MSA is comprised of Miami-Dade County, Broward County, and Palm Beach County. Home to the largest populous county in the state of Florida and seventh in the United States, it is located on the southeast coast of Florida. Miami hosts many sports teams including the Miami Dolphins, the Miami Heat, the Florida Marlins, and the Florida Panthers, as well as many institutions of higher education including the University of Miami and Florida International University.
QUICK FACTS
• Metro population estimate of 6,183,199 as of 2023 (ACS 5-Year Estimate) (U.S. Census Bureau).
• M iami Dade County population estimate of 2,686,867 as of 2023 (ACS 5-Year Estimate).
• Broward County population estimate of 1,962,531 as of 2023 (ACS 5-Year Estimate).
• Palm Beach County population estimate of 1,533,801 as of 2023 (ACS 5-Year Estimate).
• Civilian labor force of 3,241,598 in December 2024 (FRED, U.S. Bureau of Labor Statistics).
• A n unemployment rate of 2.8% as of December 2024, not seasonally adjusted. This amounts to 89,218 unemployed people (FRED, U.S. Bureau of Labor Statistics).
OUTLOOK SUMMARIES
The Miami–Fort Lauderdale–Palm Beach area is expected to show below-average levels of growth in the economic indicators. Personal income is expected to grow an average of 4.9 percent annually, and the average real per capita income level of $66,000 is the 4th highest in the areas studied. Average annual wage growth will be 4.6 percent. The average annual wage level is expected to be $91,400, ranking 3rd in the state. Miami is expected to average a population
growth of 0.0 percent each year. The area has the highest Gross Metro Product of the MSAs studied at an average level of $467,594.20 million.
Employment is expected to grow at a below-average rate of 0.3 percent each year, while unemployment is expected to be at an average rate of 3.5 percent.
Miami’s fastest growing sector is expected to be the Other Services sector, which will experience 1.8 percent average annual growth, followed by the Education and Health Services sector, which will grow at an average of 1.4 percent. The Manufacturing and Information sector will see the largest contraction at -2.0 and -0.6 percent respectively.
METRO NEWS SUMMARIES
North Miami downtown revitalization in motion | South Florida News
• North Miami’s CRA allocated funds from a $55M budget loan to support new infrastructure, affordable housing, and public space enhancements, aiming to boost economic growth and property values.
• Key developments include five new restaurants ($1.25M grant), NoMi Square’s expanded affordable housing (342-unit complex with $6M grant), and the Claude Pepper Park transformation ($8M grant) into a mixed-use entertainment district with 2,000+ housing units.
• A controversial 22-story tower at 1200 North Bayshore Drive was approved despite concerns over exceeding height limits and restricted waterfront access, ultimately passing with a 4-0 vote after adding significant community benefits.
Source: The Miami Times, December 3, 2024
Art Basel Miami Beach generates half-billiondollar economic impact - South Florida Business Journal
• A rt Basel Miami Beach 2024 generated $547 million in economic activity, a 9.4% increase from last year, fueled by affluent collectors viewing art as an investment and hedge against inflation.
• The event attracted over 75,000 spectators and 286 participating galleries, serving as a premier hub for deal-making, luxury brand launches, and social networking among business leaders and celebrities.
• A rt Basel contributes to Miami’s broader $2.1 billion arts economy, drawing high-net-worth individuals, increasing private jet traffic, and further solidifying Miami’s reputation as a global cultural destination.
Source: South Florida Business Journal, December 10, 2024
Terra Gets $291M for Massive Miami Mixed-Use Development
• Terra secured $291 million in permanent financing for its Centro City development in West Miami-Dade. The development aims to create a vibrant, sustainable community and will be a key addition to the Miami-Dade area.
• The first phase features three eight-story residential buildings (470 units), 350,000 square feet of retail space, and a redevelopment of Central Shopping Plaza, anchored by a Target store.
• The full 38-acre development will include up to 1,200 market-rate apartments, a Class A office building, green spaces, and a K-8 Charter School. Phase 2, with 518 apartments, is set to begin in late 2025.
Source: GlobeStreet, January 6, 2025
Doral approves Trump’s luxury condo development, with units starting at $2 million
• The Doral City Council approved the Trump Organization’s luxury condominium project, which includes four 20-story towers with 1,498 residential units and 470 hotel units. The approval came with the support of newly elected Councilwoman Nicole Reinoso and Eric Trump.
• The project, known as Doral International Towers, will be built on 56 acres of land and includes 141,694 square feet of commercial space. The condo units will start at $2 million, targeting a high-end market.
• The development is expected to contribute $6 million annually to Doral, along with $11
million to Miami-Dade County from condo sales and closings. The Trump Organization also plans to make transportation improvements to address traffic concerns around the development.
Source: The Miami Herald, January 16, 2025
North Miami’s 7th Avenue corridor eyes major revitalization
• North Miami aims to transform the NW 7th Avenue Corridor into a vibrant mixed-use hub with affordable housing, business growth, and cultural enhancements.
• The city faces financial hurdles, leadership instability, and property ownership complexities, but has secured $1 million for initial improvements.
• Local business owners see potential in the corridor’s high traffic and are encouraged to upgrade properties, while grant programs and support initiatives aim to boost small businesses.
Source: Miami Times, February 13, 2025
Miami’s crypto bet
• Miami, Florida enthusiastically embraced crypto currency, with Mayor Francis Suarez promoting MiamiCoin and FTX securing naming rights for the Miami Heat’s stadium. However, the crypto crash led to significant losses, with MiamiCoin plummeting 99% in value.
• Miami’s strategy resembles a VC portfolio— placing multiple bets with the hope that a few will yield exponential returns. While crypto was a failure, Miami successfully attracted major financial firms like Citadel, Citadel Securities, and Blackstone, diversifying its economy beyond real estate and tourism.
• Miami has historically experienced boom-andbust cycles but continues to emerge stronger. While crypto’s collapse hurt, events like Art Basel and the Miami International Boat Show keep the economy vibrant. Miami’s broader economic initiatives ensure it remains a financial and cultural hub, regardless of crypto’s fate.
Source: The Guam Daily Post, February 18, 2025
Long Term Outlook for Miami-Fort Lauderdale-Pompano Beach, FL
March 2025 Forecast
Personal Income (Billions $)
202020212022202320242025202620272028
TotalPersonalIncome398.4447.2482.7521.3551.0572.3601.6634.5667.3
PctChgYearAgo4.212.27.98.05.73.95.15.55.2
WagesandSalaries167.6192.0213.5228.8243.3254.6269.5281.2294.1 NonwageIncome230.9255.2269.2292.5307.7317.7332.1353.3373.2
RealPersonalIncome(12$)347.7373.4371.8386.8398.6403.9413.1426.7440.2
PctChgYearAgo2.17.4-0.44.13.01.32.33.33.2
PerCapitaIncome(Ths)64.973.178.083.086.589.594.399.6104.6
RealPerCapitaIncome(12$)56.661.060.161.662.663.264.766.969.0
AverageAnnualWage(Ths)65.471.775.578.481.684.989.693.597.5 PctChgYearAgo8.09.75.33.84.04.05.64.34.3
Establishment Employment (Place of Work, Thousands, SA)
TotalEmployment2552.22661.82812.72905.02969.12986.62992.62993.43002.1
PctChgYearAgo-6.44.35.73.32.20.60.20.00.3
Manufacturing87.589.894.698.298.296.194.292.490.5
PctChgYearAgo-4.42.65.33.80.0-2.2-1.9-2.0-2.0 Nonmanufacturing2464.62572.02718.12806.82870.92890.52898.42901.02911.6
PctChgYearAgo-6.54.45.73.32.30.70.30.10.4
Construction&Mining140.4140.7145.5153.1163.9166.3167.0168.2170.6
PctChgYearAgo-1.90.33.45.27.11.50.40.71.4 Trade,Trans,&Utilities585.4606.5636.3651.9660.8660.6656.7657.9654.3
PctChgYearAgo-5.43.64.92.41.40.0-0.60.2-0.6 WholesaleTrade143.2147.7153.8159.7165.0165.7166.1168.0167.4 RetailTrade310.2319.6330.8335.3335.5335.3330.7329.2327.2 Trans,Wrhsng,&Util131.9139.2151.7156.9160.4159.7159.9160.7159.7 Information47.650.555.855.954.854.955.254.053.5 PctChgYearAgo-6.66.210.40.1-1.80.20.5-2.2-1.0 FinancialActivities188.2197.1210.4216.5216.8214.4215.1214.9213.0 PctChgYearAgo-0.84.76.82.90.1-1.10.4-0.1-0.9 Prof&BusinessServices437.0468.3509.2519.0521.1522.1520.1510.4513.5 PctChgYearAgo-3.37.28.71.90.40.2-0.4-1.90.6 Educ&HealthServices397.3408.3426.0447.6464.0473.4480.5485.3489.5 PctChgYearAgo-3.12.84.45.13.72.01.51.00.9 Leisure&Hospitality256.1289.9321.8338.9350.2352.6354.8358.6362.9 PctChgYearAgo-23.313.211.05.33.30.70.61.11.2 OtherServices107.0109.1111.3114.2119.3121.0122.8125.6128.2 PctChgYearAgo-11.22.02.02.64.51.41.52.32.1 FederalGovernment36.135.335.436.137.237.738.038.238.4 PctChgYearAgo4.6-2.20.42.03.01.20.80.60.4 State&LocalGovernment269.6266.2266.2273.6282.7287.6288.1287.9287.8 PctChgYearAgo-4.4-1.30.02.83.31.70.2-0.1-0.1
Other Economic Indicators
Population(Ths)6138.86119.76189.96277.36372.26394.46380.16373.56376.7
PctChgYearAgo0.1-0.31.11.41.50.3-0.2-0.10.1
LaborForce(Ths)3006.43081.73172.63241.63273.73280.83283.83288.93295.4
PercentChange,YearAgo-4.22.53.02.21.00.20.10.20.2
UnemploymentRate(%)8.65.12.82.52.83.23.53.73.7
TotalHousingStarts20099.920713.219766.518062.213345.014190.417916.019646.221104.3
Single-Family7520.18267.26916.45541.25624.16227.37087.87266.87196.6
Multifamily12579.812446.012850.012521.07720.87963.110828.312379.313907.7
Short Term Outlook for Miami-Fort Lauderdale-Pompano Beach, FL
March 2025 Forecast
Personal Income (Billions $)
2024:42025:12025:22025:32025:42026:12026:22026:32026:42027:12027:22027:32027:4
TotalPersonalIncome557.9562.4567.9576.0583.0591.0597.9604.5612.9622.3630.6638.7646.6 PctChgYearAgo4.93.13.54.44.55.15.34.95.15.35.55.75.5
WagesandSalaries246.9249.7252.3256.2260.3264.8268.4271.0273.7276.6279.7282.8285.9
NonwageIncome311.0312.7315.6319.9322.7326.2329.4333.5339.2345.8350.9355.9360.6
RealPersonalIncome(12$)400.9401.1402.2405.0407.1409.6411.7413.9417.2421.2425.0428.6431.9
PctChgYearAgo2.60.91.21.61.52.12.32.22.52.83.23.63.5
PerCapitaIncome(Ths)87.287.988.890.191.292.593.794.896.197.698.9100.2101.5
RealPerCapitaIncome(12$)62.762.762.963.363.764.164.564.965.466.166.767.367.8
AverageAnnualWage(Ths)82.683.384.185.486.788.289.390.191.092.093.094.095.1
PctChgYearAgo3.72.44.04.75.05.96.25.54.94.34.24.44.5
Establishment Employment (Place of Work, Thousands, SA)
TotalEmployment2977.02985.22987.12986.42987.72989.82992.42994.42993.82992.62993.12993.52994.1
PctChgYearAgo1.51.10.50.40.40.20.20.30.20.10.00.00.0
Manufacturing96.696.396.196.195.795.194.493.993.593.192.692.191.6
PctChgYearAgo-3.3-3.2-3.2-1.4-0.9-1.3-1.8-2.2-2.4-2.0-1.9-2.0-2.0
Nonmanufacturing2880.42888.92891.02890.42891.92894.72898.02900.42900.32899.52900.52901.42902.5
PctChgYearAgo1.71.20.60.50.40.20.20.30.30.20.10.00.1
Construction&Mining166.6166.8166.0166.1166.3166.6166.9167.2167.4167.7167.9168.3168.8 PctChgYearAgo6.44.91.8-0.5-0.2-0.10.60.70.70.70.60.60.9 Trade,Trans,&Utilities662.2663.4662.2659.5657.4655.4655.9658.0657.6657.7658.4658.3657.1
PctChgYearAgo0.60.50.00.1-0.7-1.2-1.0-0.20.00.40.40.1-0.1 WholesaleTrade166.8166.7165.9165.3164.7165.3165.6166.5166.9167.8168.2168.1168.0 RetailTrade334.3336.0336.5335.0333.8331.0330.7331.2330.0329.1329.3329.6328.7 Trans,Wrhsng,&Util161.1160.6159.8159.2159.0159.1159.6160.3160.7160.9160.8160.6160.4 Information54.855.154.754.855.255.555.455.154.954.754.253.853.4
PctChgYearAgo-0.40.2-0.10.00.70.71.30.6-0.6-1.5-2.1-2.4-2.6 FinancialActivities215.5214.8214.3214.1214.3214.9215.0215.5215.1215.3215.1214.9214.3
PctChgYearAgo-1.1-1.8-1.3-0.9-0.50.00.30.70.40.20.0-0.3-0.4 Prof&BusinessServices519.7522.0522.3522.5521.8523.1522.5518.5516.1513.2510.8508.9508.7
PctChgYearAgo0.20.9-0.3-0.10.40.20.0-0.8-1.1-1.9-2.2-1.9-1.4
Educ&HealthServices466.0469.5472.9474.8476.2478.6480.0481.5482.1483.7485.0486.0486.7
PctChgYearAgo2.52.01.82.12.21.91.51.41.21.11.01.00.9
Leisure&Hospitality350.9351.7352.5352.2353.9353.0353.7355.4357.2356.6357.8359.3360.7
PctChgYearAgo2.50.90.50.40.80.40.30.90.91.01.11.11.0
OtherServices121.1121.0120.9120.9121.1121.7122.4123.1123.8124.5125.2125.9126.6
PctChgYearAgo4.93.21.70.70.00.61.31.82.22.32.32.32.3
FederalGovernment37.437.637.737.737.737.837.938.038.138.138.238.238.2
PctChgYearAgo2.51.91.30.80.80.70.60.80.90.70.60.50.5
State&LocalGovernment286.1287.0287.6287.7288.0288.1288.1288.1288.2288.0288.0287.9287.8
PctChgYearAgo3.02.51.91.80.60.40.20.10.10.0-0.1-0.1-0.1
Other Economic Indicators
Population(Ths)6396.46397.46395.66393.76391.16386.06381.46377.96375.16373.86373.76373.36373.1
PctChgYearAgo1.30.90.50.1-0.1-0.2-0.2-0.2-0.2-0.2-0.1-0.10.0
LaborForce(Ths)3267.33277.73283.13281.93280.73282.83283.33284.03285.33286.63288.23289.83291.2
PctChgYearAgo0.10.10.20.10.40.20.00.10.10.10.10.20.2
UnemploymentRate(%)2.93.03.13.23.33.43.43.53.63.63.73.73.7
TotalHousingStarts11578.812454.013649.114816.415841.916741.817554.218445.118923.019335.019578.519671.220000.0 Single-Family5068.05653.16082.36447.96725.96901.87047.47159.67242.27280.37278.77262.57245.9
Multifamily6510.96800.97566.88368.59116.09840.010506.811285.511680.812054.812299.812408.712754.1
PROFILES
The Miami-Miami Beach-Kendall MSA is located in the southeastern section of the state of Florida. Miami-Dade is estimated to be the most populous county in Florida and the seventh-most populous county in the United States.
QUICK FACTS
• Metro population estimate of 2,688,237 as of 2023 (ACS 5-Year Estimate) (U.S. Census Bureau).
• Maimi Dade County population estimate of 2,688,237 as of 2023 (ACS 5-Year Estimate).
• Civilian labor force of 1,382,619 in December 2024 (FRED, U.S. Bureau of Labor Statistics).
• A n unemployment rate of 2.5% as of December 2024, not seasonally adjusted. This amounts to 34,659 unemployed people (FRED, U.S. Bureau of Labor Statistics).
OUTLOOK SUMMARIES
The Miami Dade–Kendall area is expected to show below-average levels of growth in the economic indicators. Personal income is expected to grow an average of 4.7 percent annually, ranking 25th compared to the other MSAs studied. This will lead to an average real per capita income level of $59,400. Average annual wage growth will be 4.6 percent, and the average annual wage level is expected to be $91,700, the 2nd highest of the studied areas. MiamiDade County is expected to average a 0.0 percent population growth each year. The area has the 3rd highest Gross Metro Product of the MSAs studied at an average level of $207,106.34 million. Employment is expected to decline slightly, averaging a -0.4 percent annual change, while unemployment is expected to be 3.3 percent. Miami Dade’s fastest growing sector is expected to be the Other Services sector, which will experience 1.6 percent average annual growth, followed by Education and Health Services sector, which will grow at an average of 1.2 percent annually. The Manufacturing and Financial sectors will see the largest contractions at -2.5 and -1.4 percent respectively.
METRO NEWS SUMMARIES
Art Basel Miami Beach generates half-billion dollar economic impact
• A rt Basel Miami Beach generated $547 million in economic activity in 2023, marking a 9.4% increase from the previous year, driven by affluent visitors investing in art and luxury experiences.
• M iami-Dade’s arts and cultural sector generated $2.1 billion in economic activity in 2023, with nonprofit arts organizations spending $1.2 billion annually, further supported by tourism, with 21.4% of attendees traveling from outside the county.
• A n all-time high of 286 galleries participated in the event. The fair is growing in influence as a global cultural and business hub, with notable sales like David Hammons’ Untitled (2014), which sold for $4.75 million.
Source: South Florida Business Journal, December 10, 2024
MIA is Bigger and Better in 2025
• M iami International Airport (MIA) is investing $7.4 billion in upgrades, including a new concourse, parking garage, and enhanced passenger experiences like glass bridges and sensor-based maintenance.
• The airport is also allocating $1.7 billion for improvements to elevators, moving walkways, bathrooms, and predictive maintenance systems, aimed at reducing operational disruptions.
• M iami will host several World Cup soccer matches in 2026, further cementing the city’s status as an international event destination, alongside growing international business and tourism.
Source: Miami’s Community Newspapers, December 18, 2024
Miami Beach looks to diversify as a business hub
• M iami Beach hosted Adobe MAX in October, marking its first time in the city, generating over $22 million in economic impact, and is in talks to bring the event back for multiple years.
• The city will launch a small business grant program offering up to $5,000 to 20 businesses, totaling $100,000, aimed at supporting businesses during the slow summer season.
• M iami Beach is set to break ground on a new 800-room hotel for the Miami Beach Convention Center, expected to be completed by 2027, with $75 million in funding to enhance the city’s appeal as a major convention and event destination.
Source: Miami Today News, January 22, 2025
Miami Beach may offer extra density to builders
• M iami Beach has lost 2,873 permanent residents since 2020 and 4,889 since 2010. The new zoning changes aim to reverse this trend by encouraging more residential development and reducing the conversion of apartments into short-term rentals.
• Proposed zoning amendments will increase the maximum floor area ratio (FAR) for residential projects along Washington Avenue, from 2.0 to 4.0 in some areas, allowing for higher density and larger residential buildings.
• The amendments propose raising residential density from 106 to 175 units per acre and increasing building heights from 50 feet (3-4 stories) to up to 150 feet (11-12 stories), with varying limits depending on zoning.
Source: South Florida Business Journal, January 31, 2025
Miami Beach development site sold for $12.5 million
• Jewelers Igal and Aaron Haimov acquired a 22,200-square-foot property in Miami Beach for $12.5 million, which includes three commercial buildings, totaling 17,006 square feet.
• With this acquisition, the Haimov family now controls 53,014 square feet (1.22 acres) on the block, adding to their existing holdings of five buildings totaling 32,814 square feet.
• The Haimov family is considering a mixeduse project with office and multifamily spaces, including commercial space on the ground floor, with architectural plans developed by Kobi Karp Architecture.
Source: South Florida Business Journal, February 3, 2025
South Beach Wine & Food Festival expects multimillion-dollar economic impact
• The 2024 South Beach Wine & Food Festival (SOBEWFF) contributed $31.2 million to Miami-Dade County’s economy, with over $20 million from direct spending and more than $10 million from indirect spending.
• The 2024 festival expects over 60,000 attendees and will feature 150 events, including celebrity chefs like Bobby Flay and partnerships with local brands such as Benihana and Virgin Voyages.
• Since its inception, SOBEWFF has raised more than $40 million for Florida International University’s Chaplin School of Hospitality & Tourism Management, providing training and hands-on experience for over 1,500 students and volunteers annually.
Source: South Florida Business Journal, February 21, 2025
Long Term Outlook for Miami-Miami Beach-Kendall, FL (Division of Miami-Fort Lauderdale MSA)
March 2025 Forecast
Personal Income (Billions $)
202020212022202320242025202620272028
TotalPersonalIncome152.0173.7188.4202.0214.5222.8233.6245.6257.6
PctChgYearAgo1.614.38.57.26.23.84.95.14.9
WagesandSalaries74.685.796.5103.2110.0114.7121.2126.3131.7 NonwageIncome77.387.991.998.8104.6108.0112.4119.3125.9
RealPersonalIncome(12$)132.6145.0145.1149.9155.2157.2160.4165.2169.9
PctChgYearAgo-0.49.40.13.33.51.32.12.92.9
PerCapitaIncome(Ths)56.364.969.974.077.480.384.889.694.3
RealPerCapitaIncome(12$)49.154.253.954.956.056.758.360.362.2 AverageAnnualWage(Ths)65.372.176.478.881.985.190.093.998.0 PctChgYearAgo7.210.46.03.14.03.95.74.44.3
Establishment Employment (Place of Work, Thousands, SA)
TotalEmployment1137.01180.91255.81302.51335.41341.01340.71337.91337.4 PctChgYearAgo-6.93.96.33.72.50.40.0-0.20.0 Manufacturing40.440.843.445.845.944.343.342.441.5
PctChgYearAgo-4.61.06.35.60.2-3.6-2.2-2.0-2.1 Nonmanufacturing1096.61140.11212.41256.71289.51296.71297.41295.51295.8 PctChgYearAgo-7.04.06.33.72.60.60.1-0.10.0 Construction&Mining53.452.554.257.262.864.664.664.564.8
PctChgYearAgo-1.6-1.83.45.59.73.0-0.1-0.20.6 Trade,Trans,&Utilities287.9295.8311.3319.6322.1322.9321.5322.2320.3
PctChgYearAgo-6.22.75.22.70.80.3-0.40.2-0.6 WholesaleTrade70.773.676.779.381.381.782.383.483.3 RetailTrade132.5136.6142.3145.8145.5145.8143.6142.8141.8 Trans,Wrhsng,&Util84.785.692.394.595.295.595.696.095.3 Information19.020.623.923.723.423.423.322.722.3 PctChgYearAgo-7.58.216.2-1.1-1.0-0.2-0.2-2.9-1.7 FinancialActivities80.885.190.293.894.692.491.890.989.3 PctChgYearAgo-1.35.36.03.90.8-2.2-0.7-0.9-1.8 Prof&BusinessServices175.1185.6205.3210.9215.3215.6214.3209.2209.3 PctChgYearAgo-3.96.010.62.72.10.1-0.6-2.40.1 Educ&HealthServices186.8193.5204.0214.3222.0226.5229.5231.3232.6 PctChgYearAgo-2.83.65.45.03.62.01.30.70.6 Leisure&Hospitality106.0122.7138.4148.0155.6155.0155.1156.6158.2 PctChgYearAgo-27.415.812.86.95.1-0.30.10.91.0 OtherServices45.846.647.448.349.950.351.052.153.1 PctChgYearAgo-9.51.81.71.93.30.71.52.22.0 FederalGovernment21.521.321.221.522.222.522.722.722.8 PctChgYearAgo4.6-1.0-0.11.03.41.60.60.30.2 State&LocalGovernment120.3116.6116.4119.5121.7123.4123.6123.3123.0 PctChgYearAgo-2.9-3.0-0.22.71.81.40.1-0.2-0.2
Other Economic Indicators
Population(Ths)2698.42673.82694.52728.62772.32772.52753.92740.02730.4
PctChgYearAgo-0.2-0.90.81.31.60.0-0.7-0.5-0.4
LaborForce(Ths)1274.01316.31355.71377.81397.01395.21391.01390.01389.4 PercentChange,YearAgo-7.53.33.01.61.4-0.1-0.3-0.10.0
UnemploymentRate(%)8.35.62.61.82.12.73.13.53.6
TotalHousingStarts8851.110186.410668.710542.77837.97335.48131.98598.09217.3
Single-Family2061.22436.92422.31481.31962.62003.92192.52215.32142.4 Multifamily6789.87749.48246.49061.45875.45331.55939.46382.87074.9
Short Term Outlook for Miami-Miami Beach-Kendall, FL (Division of Miami-Fort Lauderdale MSA)
March 2025 Forecast
Personal Income (Billions $)
2024:42025:12025:22025:32025:42026:12026:22026:32026:42027:12027:22027:32027:4
TotalPersonalIncome217.7219.0221.0224.2226.8229.8232.2234.6237.9241.3244.1247.1250.0
PctChgYearAgo3.31.01.21.61.21.92.11.92.22.52.93.23.1
PerCapitaIncome(Ths)78.278.879.780.982.083.284.285.386.687.989.090.291.4
RealPerCapitaIncome(12$)56.256.256.456.957.257.758.058.458.959.560.060.661.0
AverageAnnualWage(Ths)82.983.584.385.687.088.589.690.491.392.393.494.495.5
PctChgYearAgo3.62.23.84.65.05.96.35.64.94.34.24.44.6
Establishment Employment (Place of Work, Thousands, SA)
TotalEmployment1340.21341.71341.51340.51340.31340.41340.91341.21340.31339.01338.31337.51336.7
PctChgYearAgo1.51.00.30.40.0-0.10.00.00.0-0.1-0.2-0.3-0.3
Manufacturing44.744.544.344.244.043.743.443.242.942.842.542.342.1
PctChgYearAgo-5.1-4.9-5.2-2.6-1.5-1.8-2.1-2.4-2.5-2.1-2.0-2.0-2.0
Nonmanufacturing1295.51297.21297.11296.31296.21296.71297.51298.01297.41296.21295.81295.21294.6
PctChgYearAgo1.81.20.50.50.10.00.00.10.10.0-0.1-0.2-0.2
Construction&Mining64.664.864.564.664.664.664.664.664.564.564.464.464.5
PctChgYearAgo9.77.23.81.20.0-0.30.10.0-0.1-0.2-0.3-0.20.0 Trade,Trans,&Utilities323.9324.0323.6322.5321.6320.7321.0322.2322.1322.2322.5322.4321.8
PctChgYearAgo0.50.80.40.6-0.7-1.0-0.8-0.10.20.50.50.1-0.1 WholesaleTrade82.282.081.881.681.481.882.082.582.883.283.583.583.5 RetailTrade145.4146.1146.2145.6145.1143.8143.6143.8143.3142.8142.9143.0142.6 Trans,Wrhsng,&Util96.395.995.595.295.195.195.495.896.196.296.195.995.8 Information23.423.523.323.323.423.523.423.223.123.022.822.522.3
PctChgYearAgo0.30.2-0.4-0.4-0.10.00.6-0.2-1.3-2.2-2.8-3.1-3.3 FinancialActivities94.093.292.592.192.092.091.891.991.591.491.190.890.4
PctChgYearAgo-1.4-2.6-2.3-2.0-2.1-1.3-0.7-0.3-0.5-0.6-0.8-1.1-1.3 Prof&BusinessServices214.7215.5215.6215.7215.4215.9215.4213.5212.3210.8209.5208.4208.1
PctChgYearAgo1.41.1-0.7-0.10.30.2-0.1-1.0-1.5-2.4-2.8-2.4-2.0 Educ&HealthServices223.4224.8226.3227.2227.8228.8229.4229.9230.1230.7231.1231.5231.7
PctChgYearAgo2.62.32.11.82.01.81.31.21.00.80.80.70.7
Leisure&Hospitality155.6155.4155.1154.6155.0154.4154.7155.4156.1155.8156.3156.9157.4
PctChgYearAgo2.50.2-0.7-0.4-0.4-0.7-0.30.50.70.91.00.90.8
OtherServices50.650.350.250.350.350.650.951.151.451.752.052.252.5
PctChgYearAgo3.51.71.40.1-0.50.61.31.82.12.32.22.12.1
FederalGovernment22.422.522.622.622.622.622.722.722.722.722.722.722.8
PctChgYearAgo3.02.71.61.00.90.70.50.50.60.40.40.20.2
State&LocalGovernment123.0123.2123.4123.5123.5123.6123.6123.5123.5123.4123.3123.2123.1
PctChgYearAgo1.61.91.41.90.50.30.10.00.0-0.2-0.2-0.2-0.3
Other Economic Indicators
Population(Ths)2782.32778.62774.72770.52766.42761.02755.92751.12747.42744.12741.42738.72736.0
PctChgYearAgo1.40.80.2-0.3-0.6-0.6-0.7-0.7-0.7-0.6-0.5-0.5-0.4
LaborForce(Ths)1397.81398.11396.81394.21391.91391.61391.21390.71390.61390.31390.11389.91389.7
PctChgYearAgo0.90.50.0-0.6-0.4-0.5-0.4-0.3-0.1-0.1-0.1-0.1-0.1
UnemploymentRate(%)2.42.52.72.82.93.03.13.23.33.43.53.53.6
TotalHousingStarts6902.56925.27236.97499.37680.37847.68018.18283.68378.48492.48567.78595.58736.6 Single-Family1685.81861.81977.72062.62113.62148.72182.32209.62229.52235.02226.02209.12191.1
Multifamily5216.75063.55259.25436.75566.75698.95835.76074.06148.96257.46341.76386.36545.5
PROFILES
The Naples–Immokalee–Marco Island MSA is comprised of Collier County only. Located on the southwest coast of Florida, it is notable for numerous recreation and leisure activities, and is a popular retirement destination. This region is sometimes referred to as the “Crown Jewel of Southwest Florida.”
QUICK FACTS
• Metro population estimate of 404,310 as of 2023 (ACS 5-Year Estimate) (U.S. Census Bureau).
• Collier County population estimate of 404,310 as of 2023 (ACS 5-Year Estimate).
• Civilian labor force of 192,640 in December 2024 (FRED, U.S. Bureau of Labor Statistics).
• A n unemployment rate of 2.9% as of December 2024, not seasonally adjusted. This amounts to 5,561 unemployed people (FRED, U.S. Bureau of Labor Statistics).
OUTLOOK SUMMARIES
The Naples—Marco Island Metropolitan Statistical Area (MSA) is expected to show strong performance in most of the economic indicators studied in this forecast. Gross Metro Product will come in at $27,389.92 million. Average annual wage growth of 4.0 percent will push the average annual wage level to $83,000, ranking 7th in the state. Personal income growth of 6.5 percent will lead to the highest per capita income level in the state at $112,800. The Naples–Marco Island MSA will experience a population growth of 1.5 percent.
The Naples area will experience an employment growth rate of 1.5 percent, ranking 3rd in the state. However, the area will have a moderate unemployment rate of 3.7 percent.
The Other Services sector will lead Naples with the highest average annual growth rate of 4.8 percent. This is followed by the Federal sector at 2.3 percent. The Professional and Business Services Sector and Manufacturing sector will grow by 0.4 and 0.2 percent respectively.
METRO NEWS SUMMARIES
Collier County settlement allows golf course conversion to homes
• The Collier Board of County Commissioners approved a settlement allowing the redevelopment of the 82.5-acre Links of Naples golf course into 369 homes, resolving lawsuits filed by Naples Golf Development LLC. The agreement prevents a costly trial, reimburses the developer $250,000 in legal fees, and grants 122 more homes than the originally denied proposal.
• The lawsuit stemmed from Commissioner Bill McDaniel Jr.’s opposition, which Naples Golf claimed devalued its property and led to a Bert Harris Claim. The dispute escalated over public records requests, with the county estimating a $57,244 cost and nearly a year to review McDaniel’s emails. Naples Golf sued, arguing obstruction of public records access.
• The settlement rezones the property to allow 4.5 units per acre, accommodating multi- and single-family homes and requires a 15-foot-wide, 6-foot-high buffer on the eastern boundary. The county had attempted multiple case dismissals but ultimately settled to avoid further litigation.
Source: Gulfshore Business, December 10, 2024
Collier County visitor spending up 10% through October
• Visitor spending in Collier County grew 10.5% over the past year, reaching $2.38 billion and contributing to a $3.3 billion economic impact, a 9.4% increase. Growth was driven by longer visitor stays, with 2.31 million visitors recorded and a 9.9% rise in room nights occupied, despite a 3.2% decline in occupancy due to increased hotel availability.
• The Naples, Marco Island, Everglades Convention & Visitors Bureau reported $48.63 million in tourist-development tax revenue through October. Visitor trends shifted, with more guests traveling to see friends and family and day-trippers rising from 6% to 10%.
• Median visitor income increased to $162,000, while first-time visitors declined from 33% to 21%, reflecting a shift toward repeat travelers.
Source: Gulfshore Business, December 18, 2024
Collier commissioners narrowly approve building $50 million mental health center
• Collier County commissioners narrowly approved a nearly $50 million contract to construct a new mental health center, awarding the project to DeAngelis Diamond Construction in a 3-2 vote. The facility will be built next to the David Lawrence Centers campus and will offer 87 inpatient beds for behavioral health and addiction treatment.
• Funding for the project comes from a onecent sales tax approved in 2018, but concerns remain over the rising cost, site selection, and operational funding. The project’s budget has doubled from its original estimate, and some commissioners questioned David Lawrence Centers’ ability to sustain operations, though the organization has already raised $30 million in private donations.
• Despite opposition from nearby residents who objected to the sudden vote and increased costs, supporters emphasized the urgent need for expanded mental health services. Construction is set to begin in early 2025, with the county committing to long-term facility maintenance, including an annual $460,000 reserve for future repairs.
Source: Naples Daily News, January 15, 2025
Plans advance for second Costco store
• Costco plans to develop a 26-acre site at 8392 Collier Blvd., including a warehouse club, grocery sales, a 2,000-square-foot liquor store, and a fueling station. The project is expected to open in 2026, pending approval.
• Collier County requires a 500-foot separation between gas stations, but Costco’s proposed fuel station is only 132 feet from a nearby 7-Eleven. The company has requested a waiver, arguing that Rattlesnake Hammock Road provides sufficient separation between the two stations.
• The site is part of the Hacienda Lakes development, which was approved in 2011 for mixed-use expansion. In addition to Costco, the area includes residential, commercial, and office space, with four acres still available for future businesses.
Source: Gulfshore Business, January 17, 2025
Planning board supports 205-unit apartment development, with workforce housing, in North Naples
• Collier County’s planning board approved a proposal for 205 rental apartments in North Naples, with 30% designated for workforce housing for essential workers. The project, replacing an unfeasible 129-unit affordable housing plan, now awaits a final vote on April 8.
• Valencia Trails residents oppose the project, citing traffic, noise, and property values, with 650 signatures against it. In response, the developer reduced density, increased setbacks, and cut commercial space, lowering projected traffic impact by 50%.
• Planners see the project as beneficial, offering attainable housing with rents from $1,566 to $1,958 for income-restricted units. The $80 million investment aims to address the county’s housing shortage while minimizing neighborhood impact.
Source: Naples Daily News, February 24, 2025
Long Term Outlook for Naples-Immokalee-Marco Island, FL
March 2025 Forecast
Personal Income (Billions $)
202020212022202320242025202620272028
TotalPersonalIncome41.546.949.854.457.961.365.670.174.4
PctChgYearAgo4.613.26.19.26.45.97.06.96.1
WagesandSalaries9.010.411.512.413.213.814.815.516.3
NonwageIncome32.536.538.342.044.747.550.854.658.1
RealPersonalIncome(12$)40.042.241.742.744.245.747.649.851.9
PctChgYearAgo5.15.5-1.02.23.73.34.14.74.1
PerCapitaIncome(Ths)109.6120.8124.1132.5138.4144.6152.5161.0169.4
RealPerCapitaIncome(12$)105.7108.5104.1103.9105.9107.9110.7114.4118.1
AverageAnnualWage(Ths)60.866.969.672.075.077.781.884.887.7
PctChgYearAgo9.210.04.03.54.23.65.43.63.4
Establishment Employment (Place of Work, Thousands, SA)
TotalEmployment147.4155.2164.5171.2175.0177.3179.9182.3185.4 PctChgYearAgo-4.75.36.04.12.21.31.51.31.7 Manufacturing4.95.15.35.65.85.95.95.95.8
PctChgYearAgo5.23.14.95.32.62.3-0.1-0.5-0.9 Nonmanufacturing142.4150.1159.2165.5169.2171.4174.0176.4179.6
PctChgYearAgo-5.05.46.04.02.21.31.61.41.8 Construction&Mining17.218.119.420.721.621.722.022.222.7 PctChgYearAgo-2.65.57.16.64.20.71.21.22.1 Trade,Trans,&Utilities28.329.430.932.332.833.133.233.633.8 PctChgYearAgo-3.03.75.34.31.51.00.41.10.6 WholesaleTrade4.85.05.46.06.26.36.46.56.6 RetailTrade21.421.922.623.223.423.623.623.723.9 Trans,Wrhsng,&Util2.12.52.93.03.23.23.23.33.3 Information1.21.21.31.31.31.31.31.31.3 PctChgYearAgo-11.30.63.43.5-2.1-0.82.00.21.0 FinancialActivities8.79.410.210.510.410.610.811.011.1 PctChgYearAgo-0.78.57.83.6-0.91.42.41.30.8 Prof&BusinessServices17.419.020.921.921.721.621.821.622.0 PctChgYearAgo0.49.110.54.4-0.9-0.10.5-0.82.0 Educ&HealthServices22.823.725.026.226.927.127.828.428.9 PctChgYearAgo-0.54.05.44.72.70.92.52.11.9
Leisure&Hospitality25.527.829.330.131.432.232.733.434.3
PctChgYearAgo-14.99.05.52.84.42.41.82.02.7 OtherServices7.78.08.38.58.99.49.910.310.7
PctChgYearAgo-7.53.63.92.04.25.95.53.93.8 FederalGovernment0.80.70.70.70.70.70.70.70.8
PctChgYearAgo6.9-8.50.0-0.10.01.92.22.62.4
State&LocalGovernment12.812.813.113.413.613.613.713.914.0
PctChgYearAgo-5.80.02.22.31.70.20.81.11.3
Other Economic Indicators
Population(Ths)378.3388.6401.0410.4418.0423.6430.0435.5439.2
PctChgYearAgo1.72.73.22.41.81.41.51.30.8
LaborForce(Ths)175.9181.0187.1192.9194.6197.3199.8202.0204.2
PercentChange,YearAgo-1.72.93.33.10.91.41.31.11.1
UnemploymentRate(%)7.43.72.92.93.23.43.73.83.9
TotalHousingStarts4184.85936.14784.13967.33368.24780.75395.25225.05357.6
Single-Family3140.44248.73513.43018.02554.53151.63496.03474.63417.4
Multifamily1044.41687.41270.7949.3813.61629.11899.21750.31940.3
Short Term Outlook for Naples-Immokalee-Marco Island, FL
March 2025 Forecast
Personal Income (Billions $)
2024:42025:12025:22025:32025:42026:12026:22026:32026:42027:12027:22027:32027:4
TotalPersonalIncome58.859.860.761.862.864.065.166.267.168.569.670.771.7
PctChgYearAgo5.95.05.46.46.77.07.37.06.97.06.96.96.8
WagesandSalaries13.313.513.713.914.214.514.714.915.115.215.415.615.8
NonwageIncome45.546.347.047.948.649.550.451.352.053.254.255.155.9
RealPersonalIncome(12$)44.745.145.445.946.346.847.447.948.349.049.650.250.6
PctChgYearAgo3.62.83.03.63.73.94.34.24.24.54.74.84.9
PerCapitaIncome(Ths)140.0141.8143.5145.8147.5149.6151.7153.5155.1157.8160.0162.2164.0
RealPerCapitaIncome(12$)106.3106.9107.4108.3108.9109.6110.4111.1111.6112.8114.0115.0115.8
AverageAnnualWage(Ths)75.776.376.978.179.380.681.682.283.083.784.585.285.9
PctChgYearAgo3.91.93.44.34.75.66.05.34.63.83.63.63.5
Establishment Employment (Place of Work, Thousands, SA)
TotalEmployment174.8176.0177.0177.6178.4179.0179.6180.3180.7181.2181.9182.7183.4
PctChgYearAgo1.01.31.10.72.11.71.51.51.31.21.31.31.5
Manufacturing5.85.95.95.95.95.95.95.95.95.95.95.95.8
PctChgYearAgo1.21.72.43.21.90.90.1-0.6-0.6-0.4-0.4-0.6-0.8
Nonmanufacturing169.0170.1171.1171.7172.5173.1173.7174.4174.8175.3176.0176.8177.5
PctChgYearAgo1.01.31.10.62.11.71.51.61.41.31.31.41.5
Construction&Mining21.621.621.721.721.821.922.022.022.022.122.222.322.4
PctChgYearAgo2.41.50.8-0.81.21.51.11.20.91.01.01.21.6 Trade,Trans,&Utilities32.833.033.133.133.133.033.133.333.433.433.633.733.7
PctChgYearAgo0.31.11.20.71.10.10.00.60.81.21.31.01.0 WholesaleTrade6.26.36.36.36.36.46.46.46.46.56.56.66.6 RetailTrade23.323.523.623.623.623.523.523.623.623.623.723.823.8 Trans,Wrhsng,&Util3.23.23.23.23.23.23.23.33.33.33.33.33.3 Information1.31.31.31.31.31.31.31.31.31.31.31.31.3
PctChgYearAgo-4.7-1.3-2.30.8-0.21.12.62.71.70.90.40.0-0.4 FinancialActivities10.310.410.610.610.710.810.810.910.910.911.011.011.0
PctChgYearAgo-2.1-0.90.72.23.43.32.52.21.71.31.31.21.3 Prof&BusinessServices21.421.521.621.721.821.921.821.721.621.621.621.521.6
PctChgYearAgo-1.3-2.0-0.40.01.91.61.20.0-0.8-1.3-1.3-0.6-0.1 Educ&HealthServices26.826.927.127.227.427.627.827.928.128.228.428.528.6
PctChgYearAgo1.51.10.40.12.02.42.62.62.52.42.12.01.9
Leisure&Hospitality31.531.932.232.232.532.532.632.833.033.033.333.533.8
PctChgYearAgo1.93.42.40.83.01.91.52.01.71.62.02.12.3
OtherServices9.09.19.39.59.69.79.910.010.010.110.210.310.4
PctChgYearAgo5.66.75.45.36.46.45.75.24.74.13.83.84.0
FederalGovernment0.70.70.70.70.70.70.70.70.70.70.70.70.8
PctChgYearAgo0.10.61.62.62.72.31.92.12.42.62.72.62.5
State&LocalGovernment13.513.613.613.613.613.713.713.713.813.813.813.913.9
PctChgYearAgo0.60.7-0.3-0.30.60.40.70.91.11.11.11.21.2
Other Economic Indicators
Population(Ths)420.4421.8422.9424.2425.6427.4429.2430.9432.5433.9435.1436.0437.0
PctChgYearAgo1.71.61.41.31.21.31.51.61.61.51.41.21.0
LaborForce(Ths)194.3195.9197.1197.8198.4199.0199.5200.0200.6201.1201.7202.2202.8
PctChgYearAgo-0.10.71.51.32.11.61.21.11.11.01.11.11.1
UnemploymentRate(%)3.23.23.43.43.53.63.63.73.73.83.83.93.9
TotalHousingStarts3595.14113.94658.55094.75255.55378.45440.75519.75241.85225.05215.25218.15241.5
Single-Family2372.32875.03101.83271.23358.43416.63495.53534.83537.03503.63477.63463.73453.6
Multifamily1222.81239.01556.61823.41897.21961.91945.21984.81704.91721.41737.51754.41787.9
PROFILES
The North Port-Sarasota-Bradenton MSA is located in Sarasota County in the southwest segment of the state. North Port encompasses fourteen miles of interstate 1-75 within its boundaries and it has two international airports within 45 minutes.
QUICK FACTS
• Metro population estimate of 910,108 as of 2023 (ACS 5-Year Estimate) (U.S. Census Bureau).
• Sarasota County population estimate of 469,013 as of 2023 (ACS 5-Year Estimate).
• Manatee County population estimate of 441,095 as of 2023 (ACS 5-Year Estimate).
• Civilian labor force of 394,100 in December 2024 (FRED, U.S. Bureau of Labor Statistics).
• A n unemployment rate of 3.2% as of December 2024, not seasonally adjusted. This amounts to 12,793 unemployed people (FRED, U.S. Bureau of Labor Statistics).
OUTLOOK SUMMARIES
The North Port area is expected to show average levels of growth in the economic indicators. Personal income is expected to grow an average of 6.1 percent annually. The area will see an average real per capita income level of $63,300, which ranks 7th in the state. Average annual wage growth will be 4.4 percent, while the average real annual wage level is expected to be $76,000. North Port is expected to average a population growth of 1.2 percent each year. The Gross Metro Product of the MSA will have an average level of $49,910.63 million, ranking 8th overall.
Employment is expected to grow at an average rate of 1.0 percent each year, while unemployment is expected to be at 3.8 percent, which is slightly higher than the state’s average rate.
North Port’s fastest growing sector is expected to be the Education and Health Services Sector, which will experience a 2.3 percent average annual growth, followed by the Other Services sector, which
will grow at an average of 2.2 percent. It will see contractions in the Information sector by -1.5 percent and in the Manufacturing sector by -1.0 percent.
METRO NEWS SUMMARIES
A New Hotel is Probably Coming to Downtown Sarasota
• D unedin-based AV Florida Sarasota Hotel LLC. purchased properties on Fruitville Road for $5.25 million and plans to demolish them for a 10-story, 120-170 room Tempo by Hilton hotel. The development will feature 72 parking spaces, a fitness center, a pool, a dining area, office spaces, and a bar.
• The hotel will include modern aesthetics, an outdoor bar, and amenities like a café-style restaurant. The project is still in its early stages, awaiting city approvals for aspects such as the outdoor bar and public art contributions. Hotel rates are expected to range from $150 to $300 per night.
• The project falls within Sarasota’s “downtown core” zoning, encouraging mixed-use and pedestrian-friendly development, with additional architectural enhancements being considered.
Source: Sarasota Magazine, December 16, 2024
Downtown Sarasota condo project The Edge secures $46.5 million construction loan
• The Edge Sarasota, a 10-story luxury condo project at 290 Cocoanut Ave., secured a $46.5 million construction loan from Centennial Bank, marking a key milestone for the $109 million project developed by Jebco Edge LLC.
• The 27-unit condo development will offer residences with 12–14-foot ceilings and floorto-ceiling impact windows for panoramic views of Sarasota Bay and the skyline. Half of the units have already been sold, contributing to an expected $109 million in total sales.
• The project broke ground in December and is expected to be completed within 16 months.
The site was purchased for $1 million in 2013.
Source: Miami Herald-Tribune, December 20, 2024
SMH Board Approves $450M, Sumter Site for North Port’s First Hospital
• Sarasota Memorial Health Care System approved a $450 million plan to build a 6-story, 100-bed hospital in North Port, with construction set to begin in 2025 and completion expected by fall 2028.
• The hospital will cover 305,000 square feet and include a 60,000-square-foot medical office building, offering emergency, surgical, specialty care, and diagnostic services.
• SMH plans to recruit over 70 physicians to support the new hospital, with a long-term vision to expand the hospital’s capacity to 208 beds in a future phase.
Source: South Florida Hospital News and Healthcare Report, January 29, 2025
Pair of Luxury condo Towers to replace 1950s buildings in Sarasota
• A mara, a 54-unit luxury residential project by Ronto Group, received unanimous approval from the Sarasota Planning Board on January 8, 2024. The project will replace the midcentury Pier 550 condominiums, which were built between 1948-1953, on a 2.26-acre site.
• The two 8-story towers will include a total of 115 parking spaces (private, common garage, and surface), with amenities like a common pool, deck space, and boat docks. The north tower will house 31 units, while the south tower will have 23 units, and a rooftop viewing area will be available for residents.
• Demolition has begun, and construction will take about a year for design and site prep. The development team plans to address potential flooding concerns by adding two stormwater outfalls, a condition agreed upon by the developer. Ronto Group is also managing
construction logistics for nearby projects on Golden Gate Point.
Source: Business Observer, January 21, 2025
Sarasota Square Mall Demolition Begins
• I llinois-based Torburn Partners spent over $50 million acquiring the former Sarasota Square Mall and is investing an additional $1 million to demolish most of the property for redevelopment, leaving only Costco, JC Penney, and the AMC building intact.
• The mall property spans 93.5 acres, with plans for a town center-style multiuse development featuring up to 1,200 apartments, over 690,000 square feet of commercial, retail, and office space, and an event lawn for outdoor activities.
• Torburn received Sarasota County Commission approval in April 2024, including special exceptions for outdoor entertainment and events, as well as provisions for a garden center, bars, and late-night dining within the new commercial and residential development.
Source: Observer, February 21, 2025
Apartments, New York restaurant coming to former Sarasota Checkers site
• MRM Management purchased the property for $325,000 in 2002, is redeveloping the former Checkers fast-food restaurant on Ringling Boulevard into a five-story mixed-use building. It will feature 24 rental apartments, retail space, and a restaurant venue.
• The building will house Tony Harper’s Pizza & Clam Shack, a family-owned New York-based chain known for its pizza and seafood. This will be the chain’s first location outside of New York, with other locations in Old Forge, Inlet, and Lowville.
• The project is currently in the site review phase, with an anticipated 7-8 months for completion once construction begins.
Source: Business Observer, February 11, 2025
Long Term Outlook for North Port-Sarasota-Bradenton, FL
March 2025 Forecast
Personal Income (Billions $)
202020212022202320242025202620272028
TotalPersonalIncome53.959.762.568.272.476.381.486.791.6
PctChgYearAgo6.110.74.79.16.15.56.76.45.6
WagesandSalaries16.418.820.922.523.825.126.828.029.3
NonwageIncome37.540.941.645.848.651.254.658.762.2
RealPersonalIncome(12$)51.755.253.054.656.558.160.362.965.2
PctChgYearAgo5.36.8-4.03.13.42.93.84.23.7
PerCapitaIncome(Ths)64.268.969.573.876.779.884.188.692.7
RealPerCapitaIncome(12$)61.663.858.959.159.960.762.364.366.0
AverageAnnualWage(Ths)54.959.663.665.368.070.874.877.780.7
PctChgYearAgo7.58.66.72.74.14.25.53.93.9
Establishment Employment (Place of Work, Thousands, SA)
TotalEmployment297.5313.0327.4342.2347.8353.4356.8358.8361.9
PctChgYearAgo-4.25.24.64.51.61.61.00.60.9 Manufacturing16.417.818.518.618.518.418.218.017.8
PctChgYearAgo-4.28.73.80.7-0.8-0.4-0.9-1.2-1.3 Nonmanufacturing281.1295.2308.9323.5329.3335.0338.6340.8344.1
PctChgYearAgo-4.25.04.64.71.81.71.10.71.0 Construction&Mining26.527.428.931.433.134.434.734.835.2
PctChgYearAgo0.33.45.58.55.43.90.90.41.1 Trade,Trans,&Utilities58.061.363.766.067.067.867.868.168.1 PctChgYearAgo-3.35.73.83.71.41.20.00.40.0 WholesaleTrade8.49.210.110.510.911.011.111.211.3 RetailTrade42.844.445.747.748.048.748.448.348.2 Trans,Wrhsng,&Util6.87.77.87.98.08.18.48.58.6 Information3.33.44.04.24.34.24.24.14.0 PctChgYearAgo-5.14.116.06.50.6-0.6-0.3-3.2-2.0 FinancialActivities15.616.717.918.318.819.219.219.118.8 PctChgYearAgo1.66.57.42.52.62.00.3-0.9-1.6 Prof&BusinessServices41.345.446.848.448.648.748.848.148.6 PctChgYearAgo-3.710.03.03.40.40.30.1-1.41.1 Educ&HealthServices54.956.058.060.962.563.965.667.068.4
PctChgYearAgo-1.82.03.75.02.62.22.72.22.0
Leisure&Hospitality39.042.946.949.649.951.151.752.453.2
PctChgYearAgo-15.39.99.45.70.52.51.21.31.5
OtherServices14.014.414.715.516.116.616.917.217.5
PctChgYearAgo-4.72.72.15.53.83.11.91.91.8
FederalGovernment2.12.02.02.12.12.22.32.32.2
PctChgYearAgo4.5-4.21.23.11.74.30.80.0-0.2
State&LocalGovernment26.325.726.027.127.026.927.427.728.1
PctChgYearAgo-0.4-2.41.14.1-0.1-0.41.81.11.2
Other Economic Indicators
Population(Ths)839.9866.5899.7924.4943.4957.1968.0978.2987.5
PctChgYearAgo2.03.23.82.72.11.51.11.11.0
LaborForce(Ths)359.0369.5381.1395.8398.4401.1404.7407.2410.0
PercentChange,YearAgo-2.02.93.13.90.60.70.90.60.7
UnemploymentRate(%)7.24.03.03.03.53.73.93.93.8
TotalHousingStarts10123.913952.514694.714512.814811.112280.410158.29562.99540.0
Single-Family8083.311582.210875.410517.610976.39475.58201.57696.87453.4
Multifamily2040.52370.33819.23995.33834.82804.91956.71866.12086.6
Short Term Outlook for North Port-Sarasota-Bradenton, FL
March 2025 Forecast
Personal Income (Billions $)
2024:42025:12025:22025:32025:42026:12026:22026:32026:42027:12027:22027:32027:4
TotalPersonalIncome73.574.575.677.078.279.680.882.083.384.886.187.388.5
PctChgYearAgo5.34.35.06.16.56.86.96.66.46.56.56.46.2
WagesandSalaries24.124.524.925.425.826.326.727.027.227.527.828.228.5
NonwageIncome49.450.050.751.652.453.354.155.156.157.358.359.260.0
RealPersonalIncome(12$)57.057.357.858.458.959.560.160.661.261.962.663.263.8
PctChgYearAgo3.12.12.63.33.53.83.93.83.84.04.24.34.3
PerCapitaIncome(Ths)77.478.279.180.381.482.683.684.685.687.088.189.290.1
RealPerCapitaIncome(12$)60.060.260.560.961.361.762.262.562.963.564.164.665.0
AverageAnnualWage(Ths)68.969.570.271.372.473.674.575.275.876.577.378.078.8
PctChgYearAgo3.82.54.14.95.15.96.25.54.64.03.73.84.0
Establishment Employment (Place of Work, Thousands, SA)
TotalEmployment348.7351.1353.1354.1355.3355.9356.5357.3357.6357.9358.5359.1359.7
PctChgYearAgo1.01.71.51.41.91.41.00.90.70.60.50.50.6
Manufacturing18.418.318.418.418.418.318.218.218.118.118.018.017.9
PctChgYearAgo-1.5-0.9-1.30.40.3-0.1-0.7-1.3-1.5-1.3-1.1-1.2-1.2 Nonmanufacturing330.3332.8334.7335.7336.9337.5338.3339.1339.5339.8340.5341.2341.8
PctChgYearAgo1.11.81.61.52.01.41.11.00.80.70.60.60.7
Construction&Mining33.834.134.334.534.634.634.734.734.734.734.834.834.9 PctChgYearAgo5.66.15.22.22.31.61.20.60.30.30.30.30.5 Trade,Trans,&Utilities67.067.667.867.867.867.667.768.067.967.968.168.268.2
PctChgYearAgo0.21.31.31.21.20.1-0.20.20.10.50.60.40.4 WholesaleTrade10.911.011.011.010.911.011.011.111.111.211.211.311.3 RetailTrade48.248.648.848.748.748.448.448.548.348.248.348.448.3 Trans,Wrhsng,&Util7.98.08.18.18.28.38.38.48.48.58.58.68.6 Information4.24.34.24.24.24.34.34.24.24.24.14.14.0 PctChgYearAgo-0.7-0.4-2.00.00.10.00.5-0.2-1.5-2.6-3.2-3.5-3.6 FinancialActivities19.019.119.219.219.319.319.319.319.219.219.119.119.0
PctChgYearAgo3.72.82.21.71.40.90.40.3-0.3-0.6-0.7-1.0-1.1 Prof&BusinessServices48.348.648.748.848.849.049.048.748.548.348.148.048.0
PctChgYearAgo-0.10.4-0.40.21.10.80.5-0.2-0.6-1.4-1.8-1.4-1.0 Educ&HealthServices62.563.163.764.164.565.065.465.866.166.566.967.267.5
PctChgYearAgo0.71.31.52.63.23.12.72.62.42.32.22.12.1 Leisure&Hospitality50.550.751.051.151.551.451.551.852.152.152.352.552.8 PctChgYearAgo1.53.33.51.22.01.31.01.31.21.31.41.41.3
OtherServices16.316.516.616.616.716.816.916.917.017.117.217.317.3
PctChgYearAgo4.54.33.62.42.11.91.91.91.92.01.91.92.0 FederalGovernment2.22.22.22.22.22.32.32.32.32.32.32.32.3
PctChgYearAgo4.85.35.73.33.01.90.80.40.20.10.0-0.1-0.1
State&LocalGovernment26.426.626.927.027.227.327.427.527.527.627.727.827.8
PctChgYearAgo-3.2-2.8-2.61.12.92.41.81.61.31.21.21.11.1
Other Economic Indicators
Population(Ths)949.1952.7955.5958.6961.4963.8966.4969.4972.5974.8977.1979.3981.5
PctChgYearAgo1.81.71.51.41.31.21.11.11.21.11.11.00.9
LaborForce(Ths)395.8398.7400.9402.0402.9403.9404.4404.9405.6406.2406.9407.6408.3
PctChgYearAgo-0.7-0.30.31.01.81.30.90.70.70.60.60.70.7
UnemploymentRate(%)3.63.63.73.83.83.83.93.93.93.94.03.93.9
TotalHousingStarts13947.013284.712628.511949.911258.610665.510235.99968.59762.89642.99568.79524.49515.8
Single-Family10012.49987.39678.89319.38916.48548.18272.78065.77919.37806.07718.27659.97603.2
Multifamily3934.63297.42949.72630.62342.22117.41963.21902.81843.51836.91850.51864.41912.6
PROFILES
Comprised of Marion County only, the Ocala MSA is located northwest of the Orlando area and is in the center of the state. The second largest national forest in Florida, the Ocala National Forest, and Silver Springs are two main outdoor attractions in the area.
QUICK FACTS
• Metro population estimate of 409,959 as of 2023 (ACS 5-Year Estimate) (U.S. Census Bureau).
• Marion County population estimate of 409,959 as of 2023 (ACS 5-Year Estimate).
• Civilian labor force of 150,624 in December 2024 (FRED, U.S. Bureau of Labor Statistics).
• A n unemployment rate of 3.8% as of December 2024, not seasonally adjusted. This amounts to 5,707 unemployed people (FRED, U.S. Bureau of Labor Statistics).
OUTLOOK SUMMARIES
The Ocala Metropolitan Statistical Area (MSA) expected to show strong levels of growth in its economic indicators. Ocala’s Gross Metro Product is $13,928.20 million, ranking 19th in the state. Average annual wage growth of 4.8 percent, the highest of the MSAs studied, will lead to an average annual wage of $64,900. Personal income is expected to grow by 7.2 percent, ranking 1st in the state, and Ocala will have a per capita income level of $42,800, the 24th lowest in the state. Population growth will average 1.8 percent each year.
Employment growth is expected to be above average at a rate of 1.7 percent annually. The unemployment rate is estimated to average 4.7 percent.
The Other Services sector will lead Ocala at an average annual growth rate of 5.2 percent. This is followed by the Education and Health services
sector which will expand at rates of 3.0 percent. The Manufacturing sector is expected to see a contraction of -1.0 and the Federal sector is expected to grow by just 0.4 percent.
METRO NEWS SUMMARIES
A hotel, two new schools and more: What’s coming to Ocala and Marion County in 2025?
• Ocala will see the completion of 1,310 new residential units in the Bellehaven subdivision and 202 homes in the Sabana Reserve community in 2025.
• Two new elementary schools are scheduled to open by August 2025, each designed to accommodate approximately 850 students.
• A $5.57 million automotive and aviation training facility is expected to be completed at Marion Technical College by September 2025.
Source: Ocala StarBanner, December 12, 2024
Marion County neighbors ‘will stand together’ against a possible new 300 home development
• A proposed development of 310 single-family homes on a 77-acre lot along NE Jacksonville Road has been approved for consideration by county commissioners.
• O ver 800 residents have signed an online petition opposing the development, citing concerns over increased traffic, crime, and overcrowding.
• Nearly 15,400 people moved to Marion County last year, contributing to the county’s need to address urban development within its designated growth boundaries.
Source: WCJB, January 31, 2025
Gov. Ron DeSantis in Ocala to break ground on I-75 improvement project
• Governor Ron DeSantis launched a $550 million project to expand I-75 through Ocala, adding lanes and modernizing interchanges to reduce congestion.
• The project is fast-tracked, starting more than a decade earlier than expected, with an estimated $2.3 billion economic impact.
• The expanded highway will support local businesses, improve hurricane evacuation routes, and enhance Ocala’s logistics and tourism sectors.
Source: Ocala StarBanner, February 25, 2025
Long Term Outlook for Ocala, FL
March 2025 Forecast
Personal Income (Billions $)
202020212022202320242025202620272028
TotalPersonalIncome15.417.217.619.120.321.823.625.126.8
PctChgYearAgo8.711.62.18.86.27.38.16.76.5
WagesandSalaries5.05.66.16.67.07.68.28.69.1
NonwageIncome10.411.611.412.513.314.215.416.517.6
RealPersonalIncome(12$)16.216.916.116.617.218.018.919.820.7
PctChgYearAgo8.34.2-4.43.23.54.65.24.54.5
PerCapitaIncome(Ths)40.844.543.845.947.249.452.555.258.0
RealPerCapitaIncome(12$)42.843.640.239.940.040.842.243.544.8
AverageAnnualWage(Ths)46.750.352.554.757.560.063.666.469.5 PctChgYearAgo7.07.74.44.25.24.35.94.44.6
Establishment Employment (Place of Work, Thousands, SA)
TotalEmployment106.7111.1116.2120.2121.5125.1128.0129.3130.6 PctChgYearAgo-1.64.14.63.41.13.02.31.01.0
Manufacturing9.59.910.39.99.69.69.59.49.2 PctChgYearAgo2.34.93.9-3.8-3.3-0.2-0.8-1.3-1.5 Nonmanufacturing97.3101.2105.9110.3111.9115.6118.5119.9121.4 PctChgYearAgo-2.04.04.74.11.53.32.51.21.2 Construction&Mining8.78.99.49.59.910.510.911.011.1 PctChgYearAgo2.23.35.50.74.46.03.61.01.2 Trade,Trans,&Utilities26.228.330.030.931.232.132.733.133.3 PctChgYearAgo0.77.86.13.01.02.91.71.30.7 WholesaleTrade4.14.34.64.95.05.35.45.55.5 RetailTrade16.517.719.119.920.120.520.420.520.5 Trans,Wrhsng,&Util5.66.36.36.16.16.46.87.17.4 Information0.50.50.60.80.70.70.80.80.8 PctChgYearAgo-17.10.114.328.2-7.95.54.3-0.3-0.6 FinancialActivities3.94.04.34.44.34.44.64.74.8 PctChgYearAgo-1.54.57.40.2-1.73.44.72.31.4 Prof&BusinessServices9.910.611.111.411.211.411.611.511.6 PctChgYearAgo3.77.34.73.3-1.81.71.3-1.01.5 Educ&HealthServices18.218.218.720.120.721.522.322.823.2 PctChgYearAgo-2.70.02.97.03.04.13.92.11.8 Leisure&Hospitality11.712.613.414.114.314.614.915.115.3
PctChgYearAgo-13.58.46.05.31.42.32.01.31.3 OtherServices3.23.33.63.73.94.14.44.64.7
PctChgYearAgo-0.22.18.94.73.86.96.04.23.7 FederalGovernment0.90.80.80.90.91.01.01.00.9
PctChgYearAgo18.4-6.72.19.02.96.00.3-1.7-3.0 State&LocalGovernment14.213.913.914.514.815.115.315.415.5
PctChgYearAgo-2.2-2.40.54.31.82.01.50.60.7
Other Economic Indicators
Population(Ths)378.0386.9401.1417.0430.8441.6448.7454.9461.3
PctChgYearAgo1.92.43.74.03.32.51.61.41.4
LaborForce(Ths)138.7143.0147.2151.7152.0153.2154.5155.5156.4
PercentChange,YearAgo0.53.13.03.00.20.80.80.60.6
UnemploymentRate(%)7.55.03.63.64.24.54.74.84.7
TotalHousingStarts3607.15690.16331.15191.76694.75341.14082.53906.23833.1
Single-Family3591.45459.25210.55049.06331.95152.63894.63672.73578.0
Multifamily15.7230.91120.5142.7362.7188.6187.9233.5255.1
Short Term Outlook for Ocala, FL
March 2025 Forecast
Personal Income (Billions $)
2024:42025:12025:22025:32025:42026:12026:22026:32026:42027:12027:22027:32027:4
TotalPersonalIncome20.721.121.522.122.523.023.423.824.124.524.925.325.7
PctChgYearAgo6.15.56.88.08.79.08.77.76.96.76.66.66.8
WagesandSalaries7.27.37.57.67.88.08.18.28.38.58.68.78.8
NonwageIncome13.613.814.114.414.715.015.315.515.716.116.416.616.9
RealPersonalIncome(12$)17.417.617.818.218.418.618.919.119.219.419.719.920.1
PctChgYearAgo3.83.34.45.15.65.95.74.94.24.24.34.54.8
PerCapitaIncome(Ths)47.648.148.849.850.651.552.252.953.454.254.955.656.2
RealPerCapitaIncome(12$)40.040.240.541.041.441.842.142.442.543.043.343.744.0
AverageAnnualWage(Ths)58.358.959.460.461.462.563.463.964.665.366.066.867.5
PctChgYearAgo5.22.84.25.05.36.26.75.85.24.44.24.54.6
Establishment Employment (Place of Work, Thousands, SA)
TotalEmployment121.9123.3124.8125.8126.6127.3127.8128.3128.6128.8129.2129.5129.7
PctChgYearAgo0.82.12.93.13.93.22.42.01.51.21.10.90.9
Manufacturing9.69.69.69.69.69.59.59.59.59.49.49.49.3
PctChgYearAgo-1.4-0.2-0.3-0.2-0.1-0.5-0.6-1.0-1.3-1.2-1.2-1.4-1.4
Nonmanufacturing112.3113.7115.2116.2117.1117.7118.3118.8119.1119.4119.8120.1120.4
PctChgYearAgo1.02.33.13.44.23.52.72.21.81.41.31.11.1
Construction&Mining10.210.310.410.610.710.810.910.911.011.011.011.011.0
PctChgYearAgo5.96.77.25.14.94.74.13.42.51.71.10.70.6
Trade,Trans,&Utilities31.131.632.132.332.532.532.632.832.832.933.133.233.2
PctChgYearAgo-0.41.22.43.54.53.01.51.41.21.41.41.21.2 WholesaleTrade5.15.25.35.35.45.45.45.45.55.55.55.55.5 RetailTrade20.020.220.520.620.520.420.420.520.420.420.520.520.5 Trans,Wrhsng,&Util6.06.16.36.56.66.76.86.97.07.07.17.27.2 Information0.70.70.70.70.80.80.80.80.80.80.80.80.8
PctChgYearAgo-8.64.27.07.63.44.15.14.53.31.80.0-1.0-1.9 FinancialActivities4.24.34.44.54.54.64.64.74.74.74.74.74.8
PctChgYearAgo-1.50.32.74.26.46.15.04.53.32.72.42.02.0 Prof&BusinessServices11.211.311.411.511.511.611.611.511.511.511.411.411.5
PctChgYearAgo-1.50.91.11.73.12.42.00.8-0.1-1.1-1.4-1.0-0.6 Educ&HealthServices20.821.121.421.721.922.122.322.422.522.722.822.923.0
PctChgYearAgo1.93.13.94.25.25.14.23.52.92.42.12.01.9 Leisure&Hospitality14.414.514.614.714.814.814.915.015.015.015.115.115.2
PctChgYearAgo1.42.12.32.12.72.21.92.01.71.51.51.31.1
OtherServices3.94.04.14.24.24.34.44.44.54.54.54.64.6
PctChgYearAgo3.65.86.77.18.07.16.25.75.04.54.34.03.9
FederalGovernment1.01.01.01.01.01.01.01.01.01.01.01.00.9
PctChgYearAgo7.27.28.17.01.81.60.2-0.2-0.3-0.7-1.3-2.0-2.5
State&LocalGovernment14.815.015.115.215.215.315.315.315.415.415.415.415.5
PctChgYearAgo0.91.42.01.72.72.21.61.20.90.60.60.60.6
Other Economic Indicators
Population(Ths)435.6438.3440.7442.8444.7446.3447.9449.6451.1452.5454.0455.6457.3
PctChgYearAgo3.12.92.72.42.11.81.61.51.51.41.41.31.4
LaborForce(Ths)151.2152.3153.1153.5153.8154.2154.4154.6154.8155.1155.3155.6155.8
PctChgYearAgo-0.9-0.40.51.31.71.20.80.70.60.60.60.70.7
UnemploymentRate(%)4.34.44.54.54.64.64.74.74.74.84.84.84.8
TotalHousingStarts5806.06001.35521.25107.04735.04295.34060.23985.33989.33947.93912.73889.53874.6 Single-Family5709.35847.35326.34904.84531.94129.63907.23781.03760.53717.23680.43655.93637.2
Multifamily96.7154.0194.9202.2203.1165.7153.0204.3228.8230.7232.3233.6237.4
PROFILES
The Orlando–Kissimmee–Sanford MSA is comprised of Lake, Orange, Osceola and Seminole Counties. Located in the southern center of the state, this area is home to numerous tourist attractions such as Walt Disney World, Universal Studios and Sea World. It is also home to the Orlando Magic and the Orlando City Soccer Club. Orlando hosts many conventions utilizing some of the biggest hotels in the country and America’s second largest convention center. The University of Central Florida, the nation’s second largest university, and many other places of higher education also reside in the MSA.
QUICK FACTS
• Metro population estimate of 2,817,933 as of 2023 (ACS 5-Year Estimate) (U.S. Census Bureau).
• Lake County population estimate of 424,462 as of 2023 (ACS 5-Year Estimate).
• Orange County population estimate of 1,471,416 as of 2023 (ACS 5-Year Estimate).
• Osceola County population estimate of 437,784 as of 2023 (ACS 5-Year Estimate).
• Seminole County population estimate of 484,271 as of 2023 (ACS 5-Year Estimate).
• Civilian labor force of 1,464,081 in December 2024 (FRED, U.S. Bureau of Labor Statistics).
• A n unemployment rate of 3.0% as of December 2024, not seasonally adjusted. This amounts to 44,143 unemployed people (FRED, U.S. Bureau of Labor Statistics).
OUTLOOK SUMMARIES
The Orlando—Kissimmee Metropolitan Statistical Area (MSA) is expected to show above-average growth in the economic indicators studied in this forecast. The MSA’s Gross Metro Product level will be $193,299.60 million, the 4th highest in the state. Average annual wage growth of 4.7 percent will push
the average annual wage level to $79,200, the 9th highest in the state. The per capita income level of $49,700 will be boosted by personal income growth of 5.9 percent, ranking 13th. Population growth will average 1.1 percent annually.
The Orlando MSA will experience above-average levels of employment growth, averaging 1.1 percent annually. Orlando’s unemployment rate should average 3.7 percent, which is slightly above the state average.
The Construction and Mining sector is expected to be the fastest growing sector in the area, averaging 2.2 percent growth annually. The Other Services sector will follow at an annual growth rate of 1.8 percent. Manufacturing will contract at -1.0 percent, whereas the Financial Services sector will see a -0.2 percent growth annually.
METRO NEWS SUMMARIES
JPMorgan Bolsters Florida Bet with 300 New Jobs in Orlando
• J PMorgan Chase is growing in Orlando by adding 300 new jobs over two years at its Heathrow corporate campus.
• The expansion includes a $500,000 workforce training initiative, aiming to support the region’s emerging semiconductor industry.
• The firm is renovating its 250,000 square-foot campus, which currently house over 2,000 employees
Source: Bloomberg, December 3, 2024
Orlando leaders look to extend affordable housing incentives to builders through 2026
• Orlando city officials plan to extend the expiring affordable-housing incentive program that reduces or refunds building fees for developers. The pilot was launched in 2022 and was set to end in February.
• The program rebated $782,000 in permit fees for seven housing developments, resulting in over 1,000 new affordable units built in the city.
• The aim is to make projects viable and keep units affordable instead of market-rate.
Source: News 13 Orlando, January 13, 2025
Downtown Orlando bars, nightclubs reach agreements with city over alcohol sales violations
• Eleven Downtown Orlando bars and nightclubs were accused of violating aftermidnight alcohol sales permits, following a series of drug stings, “Operation Nightcap.”
• Violations included failure to implement ID scanners, occupancy monitors, and handheld weapons detection systems.
• The businesses reached mitigation agreements to comply with regulations, except for Proper, which had its after-midnight license suspended for 30 days.
Source: ClickOrlando, January 16, 2025
Record Tourism Tax in Orange County boosts 2025 optimism
• Orange County ended 2024 with a recordbreaking tourist development tax
• E xperts at a tourism summit noted that hotel demand has remained above pre-pandemic levels for a third consecutive year
• Universal’s Epic Universe is set to open in 2025, meaning more job growth and infrastructure investments in the region.
Source: ClickOrlando, February 6, 2025
Pulse memorial eyes construction timeline, expected to draw more visitors near downtown
• Orlando plans to complete the Pulse nightclub memorial by the second half of 2027, with construction starting on June 12, 2026, the 10year anniversary of the shooting.
• The memorial will be located in the SoDo district and is expected to draw more visitors to the area.
• The city is moving forward with design proposals and plans to purchase adjacent parcels of land to potentially expand the memorial in the future.
Source: Orlando Business Journal, February 24, 2025
Hourglass District townhome project gets timeline as part of $170M investment
• Construction for 36 townhomes in Orlando’s Hourglass District will begin in December 2025, with earthwork and ground preparation starting in July.
• The $170 million investment by developer Giovanni Fernandez over the next four years includes the townhome project and other developments in the area.
• Townhome prices will range from $600,000 to $700,000, and Fernandez aims to balance urban development with the neighborhood’s bungalow charm.
Source: Orlando Business Journal, February 26, 2025
Orlando Health to add more bilingual clinics to meet population boom
• Orlando Health has opened two bilingual clinics in Kissimmee to serve the growing Spanish-speaking population in Central Florida.
• The Hispanic population in Central Florida has been growing rapidly, driving demand for services catering to this community.
• The new clinics offer family medicine, pediatrics, obstetrics, and gynecology, with bilingual services, signage, and electronic health records.
Source: Orlando Business Journal, February 26, 2025
-Kissimmee -Sanford MSA
Long Term Outlook for Orlando-Kissimmee-Sanford, FL
March 2025 Forecast
Personal Income (Billions $)
202020212022202320242025202620272028
TotalPersonalIncome128.5142.9150.9162.8172.4181.6193.3204.9217.0
PctChgYearAgo7.711.25.67.95.95.46.46.05.9
WagesandSalaries70.981.091.298.6104.6110.4117.8123.5130.1
NonwageIncome57.661.959.764.267.771.275.581.486.9
RealPersonalIncome(12$)124.8131.4129.3133.6137.9141.7146.8152.4158.4
PctChgYearAgo6.25.4-1.63.43.22.83.53.83.9
PerCapitaIncome(Ths)47.952.754.156.958.861.164.467.770.9
RealPerCapitaIncome(12$)46.548.546.346.747.047.748.950.351.7
AverageAnnualWage(Ths)58.062.564.767.270.373.577.881.084.5
PctChgYearAgo8.57.83.53.94.54.55.94.24.2
Establishment Employment (Place of Work, Thousands, SA)
TotalEmployment1219.01289.31404.21460.81483.31497.21509.41519.31535.3
PctChgYearAgo-8.75.88.94.01.50.90.80.71.1 Manufacturing48.550.452.052.552.351.651.150.750.2
PctChgYearAgo-1.63.83.21.0-0.4-1.3-0.8-0.9-0.9
Nonmanufacturing1170.51238.91352.21408.31431.01445.71458.21468.61485.1
PctChgYearAgo-9.05.89.14.11.61.00.90.71.1 Construction&Mining83.283.487.490.294.097.298.9100.3102.5
PctChgYearAgo-3.50.24.83.24.33.41.81.42.2 Trade,Trans,&Utilities235.2246.8261.5268.7273.0273.0273.6276.5277.7
PctChgYearAgo-4.54.96.02.81.60.00.21.10.4 WholesaleTrade44.846.850.352.754.754.154.355.155.1 RetailTrade140.6145.3150.2153.7155.0154.1153.3154.3155.2 Trans,Wrhsng,&Util49.954.661.062.363.364.866.067.067.4 Information24.124.926.826.926.927.227.627.327.4
PctChgYearAgo-5.83.27.80.30.01.01.6-1.00.2 FinancialActivities77.483.689.590.789.990.190.590.389.3
PctChgYearAgo-1.18.07.01.3-0.90.20.5-0.3-1.0 Prof&BusinessServices218.5239.4271.7283.3283.8283.8283.6280.1283.6
PctChgYearAgo-7.09.613.54.30.20.0-0.1-1.21.3 Educ&HealthServices157.5164.0173.4184.2190.0193.0196.0198.9201.7
PctChgYearAgo-1.44.15.86.23.11.61.61.51.4
Leisure&Hospitality202.0224.4265.9283.7287.7292.9297.5302.3307.7
PctChgYearAgo-26.811.118.56.71.41.81.61.61.8
OtherServices47.048.351.052.554.755.756.657.758.8
PctChgYearAgo-8.12.85.43.14.21.81.62.01.8
FederalGovernment15.215.315.816.516.817.117.517.818.0
PctChgYearAgo3.60.33.64.02.41.72.11.61.5
State&LocalGovernment110.4108.8109.2111.5114.2115.7116.5117.4118.3
PctChgYearAgo-2.3-1.40.42.12.41.40.70.80.8
Other Economic Indicators
Population(Ths)2680.82710.82789.12863.32933.22973.62999.33028.73060.7
PctChgYearAgo1.21.12.92.72.41.40.91.01.1
LaborForce(Ths)1321.91332.61423.31475.11478.21482.11498.31514.31531.1
PercentChange,YearAgo-2.00.86.83.60.20.31.11.11.1
UnemploymentRate(%)10.84.83.02.93.33.53.73.83.7
TotalHousingStarts23739.927909.925786.625255.121474.924234.726249.326807.127357.9
Single-Family15097.917081.216087.817180.015296.617558.318564.518564.018137.5
Multifamily8642.010828.69698.78075.16178.26676.47684.88243.19220.4
Short Term Outlook for Orlando-Kissimmee-Sanford, FL
March 2025 Forecast
Personal Income (Billions $)
2024:42025:12025:22025:32025:42026:12026:22026:32026:42027:12027:22027:32027:4
TotalPersonalIncome175.0177.3179.8183.1186.2189.3192.1194.4197.2200.4203.5206.4209.3
PctChgYearAgo5.54.15.06.06.46.86.86.25.95.96.06.26.1
WagesandSalaries106.3107.7109.2111.2113.4115.6117.3118.6119.8121.2122.7124.3125.9
NonwageIncome68.769.670.671.972.873.874.875.977.479.280.882.183.4
RealPersonalIncome(12$)139.1139.9140.9142.4143.8145.1146.3147.2148.5150.0151.7153.2154.6
PctChgYearAgo3.31.92.63.23.43.73.83.43.23.43.74.14.2
PerCapitaIncome(Ths)59.259.860.561.562.463.364.164.765.566.467.368.168.9
RealPerCapitaIncome(12$)47.147.247.447.848.248.648.849.049.349.750.150.550.9
AverageAnnualWage(Ths)71.371.972.874.075.376.577.578.278.979.780.681.582.3
PctChgYearAgo4.32.84.55.15.66.46.55.74.84.24.04.24.4
Establishment Employment (Place of Work, Thousands, SA)
TotalEmployment1486.41492.91496.01497.91502.11504.61508.11511.31513.61514.81517.61520.71524.0
PctChgYearAgo1.01.00.70.91.10.80.80.90.80.70.60.60.7
Manufacturing51.451.451.551.751.651.451.251.150.950.950.850.650.5
PctChgYearAgo-2.8-2.4-2.4-0.90.3-0.1-0.7-1.2-1.3-1.0-0.8-0.9-0.9
Nonmanufacturing1435.01441.41444.51446.21450.51453.21456.91460.21462.61463.91466.81470.01473.5
PctChgYearAgo1.21.20.91.01.10.80.91.00.80.70.70.70.7 Construction&Mining95.996.596.897.497.998.498.799.199.499.8100.1100.5101.0 PctChgYearAgo5.55.63.82.02.12.02.01.71.51.41.31.41.6 Trade,Trans,&Utilities271.9273.4273.4272.7272.7272.2273.0274.4274.7275.4276.3277.0277.2
PctChgYearAgo0.00.1-0.20.00.3-0.4-0.20.60.81.21.21.00.9 WholesaleTrade54.354.354.254.053.954.054.154.554.655.055.255.255.2 RetailTrade153.7154.5154.5153.8153.7152.8153.0153.7153.5153.6154.2154.8154.8 Trans,Wrhsng,&Util63.964.564.764.865.165.465.866.266.666.867.067.167.2 Information27.027.227.027.127.427.627.727.627.527.527.427.227.1
PctChgYearAgo0.20.50.71.21.61.72.41.70.5-0.4-1.0-1.3-1.4 FinancialActivities90.190.089.990.090.390.590.590.690.490.590.490.290.0
PctChgYearAgo-0.4-0.20.30.60.20.60.60.70.20.0-0.1-0.4-0.5 Prof&BusinessServices282.7284.1283.8283.8283.6284.6284.7283.0282.1280.9280.1279.5279.8 PctChgYearAgo-0.30.1-0.3-0.20.30.20.3-0.3-0.5-1.3-1.6-1.2-0.8 Educ&HealthServices190.6191.8192.8193.5193.9194.8195.7196.5197.0197.9198.6199.3199.9 PctChgYearAgo1.51.81.71.11.71.61.51.61.61.61.51.51.5 Leisure&Hospitality289.3290.5292.3293.0295.7295.5296.4298.2300.0300.0301.4303.1304.8 PctChgYearAgo1.71.01.52.52.21.71.41.71.51.51.71.61.6 OtherServices55.455.655.755.855.956.256.556.757.057.357.657.958.1
PctChgYearAgo4.33.71.01.80.91.11.41.72.02.02.02.02.0 FederalGovernment16.816.917.117.217.317.417.417.517.617.717.717.817.9
PctChgYearAgo0.70.61.41.82.92.42.02.01.91.81.71.61.5
State&LocalGovernment115.4115.6115.7115.7116.0116.1116.4116.6116.9117.1117.3117.5117.7
PctChgYearAgo2.92.41.41.10.50.50.60.80.80.80.80.80.7
Other Economic Indicators
Population(Ths)2955.62965.02970.72976.32982.42988.82995.73002.73010.03017.43024.93032.53040.0
PctChgYearAgo2.32.01.51.20.90.80.80.90.91.01.01.01.0
LaborForce(Ths)1467.71475.01480.81484.21488.31492.91496.41500.11504.01508.01512.21516.41520.5
PctChgYearAgo-1.1-0.8-0.20.81.41.21.11.11.11.01.11.11.1
UnemploymentRate(%)3.43.43.53.53.63.63.73.73.73.83.83.83.7
TotalHousingStarts21249.322699.723899.324883.325456.325801.126102.526485.526608.026724.726778.226791.326934.3
Single-Family15394.416593.217368.617974.918296.318421.218535.418621.118680.218672.018602.218525.918456.1
Multifamily5854.96106.56530.76908.47160.07379.97567.17864.47927.88052.78176.08265.48478.2
PROFILES
The Palm Bay–Melbourne–Titusville MSA is comprised of Brevard County only. Typically known as “Florida’s Space Coast”, this area is home to the Kennedy Space Center. Located in the central part of Florida’s east coast, the region is home to Cape Canaveral Air Force Base, Patrick Air Force Base, and government contractors such as Harris Corporation. Like much of Florida, this area is growing fast; Port Canaveral is now a leading cruise ship port.
QUICK FACTS
• Metro population estimate of 643,979 as of 2023 (ACS 5-Year Estimate) (U.S. Census Bureau).
• Brevard County population estimate of 643,979 as of 2023 (5-Year Estimate) (U.S. Census Bureau).
• Civilian labor force of 301,837 in December 2024 (FRED, U.S. Bureau of Labor Statistics).
• A n unemployment rate of 3.2% as of December 2024, not seasonally adjusted. This amounts to 9,530 unemployed people (FRED, U.S. Bureau of Labor Statistics).
OUTLOOK SUMMARIES
The Palm Bay—Melbourne—Titusville Metropolitan Statistical Area (MSA) will show moderate growth in the studied economic indicators when compared to other MSAs. The MSA will have the 10th-highest Gross Metro Product at $36,271.15 million. Average annual wage growth will average 4.6 percent, leading to the 8th highest average annual wage of $81,600. Personal income growth will average 6.2 percent, ranking 9th, leading to a per capita income level of $53,200. Population growth will have an average annual rate of 1.1 percent.
Palm Bay will experience employment growth that will average 1.1 percent. Palm Bay’s unemployment rate will hover around 3.8 percent, aligning with the state average.
The Other Services sector will lead the way in Palm Bay with an average annual growth rate of
4.2 percent. The Financial sector will follow with a growth rate of 2.6 percent. The Information along with the Manufacturing sectors will both contract by -2.2 percent and -1.6 percent respectively.
METRO NEWS SUMMARIES
What’s ahead for Space Coast development?
Everything from luxury homes to high-tech centers
• Brevard County has been experiencing a building boom, and this is only expected to continue this year. In 2025, development is expected to be robust, especially in the residential sector for single-family homes, apartment complexes, and hotels.
• Additionally, commercial and industrial projects along with projects at Space Coast’s colleges are underway. Port Canaveral’s CEO, John Murray, believes that the record number of lumber and plywood coming through the port from November and December are indications of a rebound in the housing industry.
• L3Harris Technologies has two major projects that are under construction at its Palm Bay Campus. Project SAMT is constructing a 105,000-square-foot facility and will create 100 jobs in three years. Project LEO will construct a 93,000-square-foot-facility and will create 101 new jobs over three years. Palm Bay City Council also approved city property tax breaks over a 10-year period for these projects, worth $1.14 million annually.
Source: Florida Today, January 5, 2025
Palm Bay wants to lure space jobs as governor works to relocate NASA HQ to Florida
• Palm Bay is offering up city land as a potential location for NASA’s headquarters after a city council meeting, with Governor Ron DeSantis saying that the move will boost the state’s economy. The governor hopes to work with the Trump administration to relocate the headquarters south.
• Officials such as Chandler Langevin are proposing a resolution to support Brevard County as the permanent location of any government agency headquarters focused on space, including NASA. The proposed location is a 462-acre federal property currently run by the Space Force Base.
• However, local space experts such as the director of the Spaceport Education Center at Florida Tech, Don Platt, suspect that there will be competition between states such as Alabama and Texas for the relocation.
Source: Fox 35 Orlando, January 16, 2025
DIX
Developments
Announces $15.6 Million
Acquisition of 302 Acres for Ashton Park in Palm Bay
• A shton Park in Palm Bay, a mixed-use community coming to Palm Bay, is moving along as DIX Developments announced a $15.6 million acquisition of 302 acres. This is the first acquisition for the proposed 1,568-acre park, with 2 more coming.
• Th is $2.5 billion mixed-used community is claiming to redefine Florida’s Space Coast. The park was recently rezoned to a Planned Unit Development, and will include 961 SingleFamily Homes, 1,037 Apartments, 1.5 million square-feet of flex space, 3.9 million square-feet of commercial/industrial space, and a 113-acre town center.
• The town center will provide retail, dining, and entertainment options. Plans indicate a potential Brevard County K-8 school and an equestrian component. The area has seen a surge of high-income residents, and this development is aimed to address this growing demand in the Space Coast corridor.
Source: Fox 4 EIN Presswire, January 16, 2025
‘A buzzing hive’: Florida Tech relaunching underused CAMID space as Vertex, a high-tech hub
• F lorida Institute of Technology has relaunched the Center for Advanced Manufacturing and Innovative Design, now called Vertex, with the
goal of being a new applied innovation hub. The space was deemed underutilized, used as a traditional academic building with empty spaces.
• Vertex will host business tenants with its office space, manufacturing, and clean rooms. It will be utilized for contracted research, development work, facility rentals, workforce training, and more. Vertex Executive Director Samantha Miles stated, “… not only are we improving the space and making it more industry facing, we’re redesigning our labs.”
• Vertex currently houses CAMID, the Florida Tech Research Institute, along with the Larsen Motorsports jet dragster racing team, SafeSky Systems USA and Zeal OTM, and Solar Transport Systems. It will also house ASCEND, standing for AeroSpace Cybersecurity Engineering Development, which will receive $5 million in state funding.
Source: Florida Today, February 20, 2025
Palm Bay to get $19.2M Live Local Act affordable apartments
• F lorida’s Live Local Act affordable housing initiative is being used to construct a 12unit apartment complex in Palm Bay. The multifamily project is required to have a minimum nonresidential space of 35%, with 40% of units being affordable for 30 years.
• The land was purchased for $2.25 million in 2023 by Apartments at Palm Bay LLC. The LLC has connections to Agador Spartacus Development in Aventura, who secured a $19.2 million construction loan in February of this year.
• The residential community is expected to have luxury amenities which will include a resortstyle pool and clubhouse. The South Brevard County apartment submarket accounts for nearly 15% of all apartments in the county and boasts the fastest pace of new developments across the wider Melbourne market, according to CoStar Group.
Source: Orlando Business Journal, February 24, 2025
Long Term Outlook for Palm Bay-Melbourne-Titusville, FL
March 2025 Forecast
Personal Income (Billions $)
202020212022202320242025202620272028
TotalPersonalIncome31.234.335.738.741.143.646.749.452.2
PctChgYearAgo7.710.04.08.66.06.37.05.85.7
WagesandSalaries13.614.916.317.718.920.021.522.423.5
NonwageIncome17.619.419.421.122.223.625.227.028.7
RealPersonalIncome(12$)30.831.830.931.932.934.135.636.838.2
PctChgYearAgo6.43.4-2.93.23.33.64.13.63.7
PerCapitaIncome(Ths)51.155.356.059.261.664.768.972.475.9
RealPerCapitaIncome(12$)50.551.348.548.849.450.752.554.055.5
AverageAnnualWage(Ths)58.962.065.668.972.675.880.283.486.8
PctChgYearAgo6.85.25.75.05.54.35.94.14.1
Establishment Employment (Place of Work, Thousands, SA)
TotalEmployment228.0237.8245.4253.6256.8261.7265.2266.1267.9
PctChgYearAgo-2.34.33.23.41.21.91.30.30.7 Manufacturing28.729.831.633.834.534.633.933.132.3
PctChgYearAgo4.73.86.17.12.10.2-2.0-2.3-2.4 Nonmanufacturing199.3208.0213.8219.8222.2227.1231.3232.9235.6
PctChgYearAgo-3.34.32.82.81.12.21.80.71.1 Construction&Mining16.317.617.718.619.119.319.619.719.9 PctChgYearAgo5.48.60.45.12.91.01.30.41.1 Trade,Trans,&Utilities37.239.040.040.140.641.642.142.743.2 PctChgYearAgo-2.64.82.50.21.22.51.41.41.1 WholesaleTrade5.25.55.75.55.65.96.26.56.6 RetailTrade27.628.428.828.929.329.829.830.030.2 Trans,Wrhsng,&Util4.45.25.55.65.65.86.16.36.4 Information2.02.12.62.93.02.92.92.82.7 PctChgYearAgo-19.06.822.815.00.6-1.5-0.2-4.3-2.8 FinancialActivities8.78.58.38.88.89.09.39.69.7 PctChgYearAgo0.6-1.6-3.05.60.02.44.32.21.4 Prof&BusinessServices37.038.640.140.438.938.839.138.538.9 PctChgYearAgo4.84.53.90.7-3.9-0.10.7-1.41.0 Educ&HealthServices35.336.237.339.140.842.543.644.044.4 PctChgYearAgo-7.52.63.04.74.44.12.61.00.8 Leisure&Hospitality24.427.028.729.930.330.931.532.032.5
PctChgYearAgo-14.610.56.34.01.42.02.01.61.8 OtherServices10.310.711.111.411.812.313.013.413.9
PctChgYearAgo-5.53.93.42.93.14.85.33.33.3 FederalGovernment6.76.86.76.87.17.37.47.47.4
PctChgYearAgo4.61.1-0.91.63.34.11.2-0.5-0.5 State&LocalGovernment21.521.321.321.822.122.522.822.923.1
PctChgYearAgo-2.5-0.7-0.12.51.02.11.10.50.7
Other Economic Indicators
Population(Ths)609.3619.9636.9654.0666.7674.0677.7682.5688.4
PctChgYearAgo1.31.72.72.71.91.10.60.70.9
LaborForce(Ths)281.0289.5296.3305.4306.1307.6310.2312.2314.3
PercentChange,YearAgo-0.13.02.43.10.20.50.80.60.7
UnemploymentRate(%)7.04.12.93.03.43.73.83.93.8 TotalHousingStarts4617.75403.75284.15918.64816.15827.45063.54740.44760.9
Single-Family3218.04298.34246.94970.63969.44658.64048.93715.23619.3
Multifamily1399.81105.41037.2948.0846.71168.91014.61025.21141.6
Short Term Outlook for Palm Bay-Melbourne-Titusville, FL
March 2025 Forecast
Personal Income (Billions $)
2024:42025:12025:22025:32025:42026:12026:22026:32026:42027:12027:22027:32027:4
TotalPersonalIncome41.842.543.244.144.845.746.547.147.648.449.149.850.4
PctChgYearAgo5.64.76.07.17.37.67.66.86.15.95.65.75.9
WagesandSalaries19.119.519.820.220.721.121.421.621.822.122.322.622.8
NonwageIncome22.723.023.423.824.224.625.025.425.826.326.827.227.6
RealPersonalIncome(12$)33.333.633.934.434.735.135.535.735.936.336.737.037.3
PctChgYearAgo3.32.53.64.34.24.64.64.03.53.43.43.73.9
PerCapitaIncome(Ths)62.463.164.165.466.467.668.669.470.171.172.072.973.6
RealPerCapitaIncome(12$)49.749.950.351.051.451.952.452.752.953.453.854.254.6
AverageAnnualWage(Ths)73.674.375.076.277.578.979.980.681.482.283.083.984.7
PctChgYearAgo5.02.74.15.05.36.16.65.85.04.23.94.04.0
Establishment Employment (Place of Work, Thousands, SA)
TotalEmployment257.3259.2261.4262.6263.8264.7265.2265.5265.5265.6265.9266.2266.5
PctChgYearAgo0.41.21.92.12.52.11.51.10.60.40.20.30.4
Manufacturing34.534.734.634.634.534.334.033.833.633.433.233.032.8
PctChgYearAgo0.40.2-0.10.7-0.1-1.2-1.8-2.4-2.7-2.4-2.2-2.3-2.3
Nonmanufacturing222.8224.5226.8228.0229.3230.4231.2231.7231.9232.2232.7233.2233.7
PctChgYearAgo0.41.42.22.32.92.62.01.61.10.80.60.70.8
Construction&Mining19.019.119.319.419.519.519.619.619.619.619.619.719.7
PctChgYearAgo-0.80.31.1-0.12.72.11.51.00.50.40.30.30.5
Trade,Trans,&Utilities40.541.041.641.841.941.942.142.342.342.542.742.943.0
PctChgYearAgo0.51.42.52.63.32.11.01.31.11.41.51.41.5 WholesaleTrade5.75.85.96.06.06.16.26.36.36.46.56.56.5 RetailTrade29.229.529.929.929.929.729.829.929.829.830.030.130.1 Trans,Wrhsng,&Util5.65.75.85.95.96.06.16.16.26.26.26.36.3 Information2.92.92.92.92.92.92.92.92.92.82.82.82.7
PctChgYearAgo-2.3-1.2-2.7-1.9-0.20.01.30.0-2.2-3.8-4.4-4.4-4.4 FinancialActivities8.78.88.99.09.19.29.39.49.49.59.59.69.6
PctChgYearAgo-1.6-0.72.33.34.75.44.24.23.42.62.32.01.9 Prof&BusinessServices38.638.738.738.939.039.239.239.038.938.738.538.438.5
PctChgYearAgo-3.9-1.9-0.40.81.01.31.20.3-0.2-1.3-1.7-1.4-1.0 Educ&HealthServices41.341.842.442.743.043.443.643.743.743.944.044.144.1
PctChgYearAgo3.53.94.24.14.23.82.82.31.51.10.90.81.0
Leisure&Hospitality30.630.630.830.931.231.331.431.531.731.731.932.132.2
PctChgYearAgo1.51.52.22.22.12.21.92.11.71.51.51.61.6 OtherServices11.812.012.212.412.612.812.913.013.113.213.413.513.6
PctChgYearAgo2.83.84.14.76.76.75.74.94.13.43.23.23.4
FederalGovernment7.17.27.37.47.47.47.47.47.47.47.47.47.4
PctChgYearAgo2.33.04.83.94.63.01.20.50.1-0.3-0.5-0.6-0.6
State&LocalGovernment22.222.422.522.622.722.722.822.822.822.922.922.923.0
PctChgYearAgo1.42.52.12.11.91.51.21.00.80.60.40.50.5
Other Economic Indicators
Population(Ths)670.4672.4673.7674.4675.5676.4677.2678.1679.2680.5681.8683.1684.5
PctChgYearAgo1.71.51.20.90.70.60.50.50.60.60.70.70.8
LaborForce(Ths)303.7305.9307.5308.3308.9309.5309.9310.4310.9311.4311.9312.4312.9
PctChgYearAgo-1.5-1.00.11.31.71.20.80.70.60.60.60.70.7
UnemploymentRate(%)3.53.53.63.73.73.83.83.93.93.94.03.93.9
TotalHousingStarts5565.25905.55807.25897.05700.05345.75134.54979.14794.64762.34739.24727.94732.3 Single-Family4404.24688.74715.04690.44540.14350.84100.23940.93803.63759.63722.93698.83679.4
Multifamily1161.01216.91092.21206.61159.9995.01034.21038.1991.01002.71016.31029.01052.9
PROFILES
The Panama City MSA, known for its beaches and recreational fishing vessels, is located in the Northwest portion of the state. Panama City is the largest City between Tallahassee and Pensacola. This area is the more populated of two principal cities of the Panama City-Lynn Haven MSA and it is the county seat of Bay County.
QUICK FACTS
• Metro population estimate of 216,371 as of 2023 (ACS 5-Year Estimate) (U.S. Census Bureau).
• Bay County population estimate of 216,371 as of 2023 (ACS 5-Year Estimate).
• Civilian labor force of 93,169 in December 2024 (FRED, U.S. Bureau of Labor Statistics).
• A n unemployment rate of 3.0% as of December 2024, not seasonally adjusted. This amounts to 2,834 unemployed people (FRED, U.S. Bureau of Labor Statistics).
OUTLOOK SUMMARIES
The Panama City Metropolitan Statistical Area (MSA) will show average levels of growth in the studied economic indicators when compared to other MSAs. The MSA will have a Gross Metro Product of $11,542.18 million. Average annual wage growth will average 4.4 percent, ranking 20th in the state, leading to an average annual wage of $67,900. Personal income growth will average 6.5 percent, ranking 6th, leading to a per capita income level of $50,000. Population growth will average 1.3 percent annually. Employment growth will be at an average rate of 1.3 percent. Additionally, Panama City’s unemployment rate will hover around 3.7 percent, which is slightly below average in the state. The Other Services sector will lead the way in Panama City with an average annual growth rate of 3.6 percent. The Education and Health Services
sector will follow with a growth rate of 2.3 percent. The Manufacturing sector will contract by -1.1 percent and the State and Local Government sector will grow by just 0.3 percent.
METRO NEWS SUMMARIES
Bay County greenlights $3 million study for CR 2321 expansion
• Bay County commissioners approved a development and environmental study to widen County Road 2321 between U.S. 231 and State Road 77. The project aims to improve traffic flow and accommodate future growth in the area.
• A new multi-lane bridge is planned over Deer Point Dam, allowing traffic to be removed from the existing structure, which will help extend the dam’s lifespan. The study will determine the best design approach and potential impacts.
• The Florida Department of Transportation is funding the $3 million study, with additional matching funds from a local surtax. The study, led by Metric Engineering Inc., marks the first step in a 10-year timeline before construction begins.
Source: Panama City News Herald, December 4, 2024
New aviation company lands at ECP, bringing in millions, jobs and construction
• In the upcoming months, Panama City Beach is set to open an 80,000-square-foot medical office that will offer primary care, urgent care, an ambulatory surgery center, and cardiology services.
• Th is facility is being developed in partnership with Florida State University and Tallahassee Memorial Hospital, with St. Joe Company donating the 87 acres of land for the project.
• In addition to the current development, there are plans to add a 100-bed inpatient hospital, an emergency center, and additional specialty services. Once the hospital is built in 2027, FSU plans to use it as a new campus for training its medical students.
Source: WJHG December 11, 2024
IAG Aero Group Lands in Florida, Will Create 500 Aviation Jobs
• I AG Aero Group is investing $107 million to build a maintenance, repair, and overhaul (MRO) facility and a rare engine test cell facility at Northwest Florida Beaches International Airport (ECP), strengthening the Gulf Coast Aerospace Corridor.
• The project includes three key facilities: a 120,000-square-foot MRO facility for commercial aircraft engines, a 40,000-squarefoot engine test cell (one of the few in the Southeast U.S.), and a 140,000-square-foot warehouse and distribution center on a 36-acre site in Bay County.
• E xpected to generate $479 million in household income over the next decade, the project is the largest economic development recruitment effort in Bay County’s history. Construction will begin soon, with completion set for 2026.
Source: Businessfacilities, January 1, 2025
Bay County commissioners discuss $2.5M water system upgrade
• Bay County is planning a $2.5 million water infrastructure project to enhance system resiliency and prevent future water outages. The Potable Water Distribution System Hardening Project will install a 10-inch PVC water main in Southport and an 18-inch potable water main along Transmitter Road in the CallawaySpringfield area.
• The project aims to improve redundancy and reliability in the county’s water system, ensuring a backup supply in case of equipment failures or maintenance issues. Additional connections will strengthen the existing infrastructure, reducing the risk of widespread disruptions.
• Bay County officials emphasize that these upgrades will be especially critical during natural disasters, allowing for faster recovery and continued water service. If approved, the project is expected to take about one year to complete.
Source: Mypanhandle, February 3, 2025
Long Term Outlook for Panama City, FL March 2025 Forecast
202020212022202320242025202620272028
Personal Income (Billions $)
TotalPersonalIncome9.410.510.711.512.313.214.215.015.8
PctChgYearAgo7.611.62.17.56.87.57.55.65.2
WagesandSalaries4.14.64.95.25.66.06.46.77.0
NonwageIncome5.35.95.76.26.77.27.88.38.8
RealPersonalIncome(12$)9.59.99.49.710.110.611.111.511.9
PctChgYearAgo6.54.8-4.93.14.14.94.73.43.3
PerCapitaIncome(Ths)49.253.752.754.756.759.663.166.169.1
RealPerCapitaIncome(12$)49.850.946.646.446.848.049.450.752.0
AverageAnnualWage(Ths)50.854.256.157.861.163.266.669.472.4
PctChgYearAgo4.96.73.63.05.63.65.34.24.3
Establishment Employment (Place of Work, Thousands, SA)
TotalEmployment78.482.084.987.688.691.192.893.193.3
PctChgYearAgo-2.34.63.53.21.22.81.90.30.2
Manufacturing3.13.13.33.43.43.43.43.33.3
PctChgYearAgo2.70.34.83.40.60.4-1.2-1.7-1.8
Nonmanufacturing75.378.981.684.285.287.789.489.890.0
PctChgYearAgo-2.54.83.43.21.22.92.00.40.3
Construction&Mining7.07.07.47.47.67.87.97.97.8
PctChgYearAgo1.4-0.25.40.52.53.31.2-0.8-0.5 Trade,Trans,&Utilities15.716.416.917.017.317.818.118.418.5
PctChgYearAgo0.04.13.20.32.22.71.91.10.6 WholesaleTrade2.22.32.42.52.62.72.82.92.9 RetailTrade11.812.212.612.612.813.213.413.413.4 Trans,Wrhsng,&Util1.81.91.91.91.91.92.02.12.1 Information0.70.70.70.80.80.90.90.90.9
PctChgYearAgo-15.11.26.317.6-4.06.54.2-1.9-2.1 FinancialActivities4.85.35.55.65.65.85.95.95.9 PctChgYearAgo5.911.93.11.40.53.12.30.3-0.9 Prof&BusinessServices10.210.210.611.711.812.012.312.312.5 PctChgYearAgo-8.70.83.310.90.81.72.5-0.51.6 Educ&HealthServices9.610.110.410.610.811.211.511.711.8
PctChgYearAgo0.95.72.41.71.84.32.91.10.7
Leisure&Hospitality12.013.414.114.414.114.514.814.914.9
PctChgYearAgo-7.311.85.12.1-2.13.02.20.70.1 OtherServices2.22.22.22.32.42.52.72.72.8 PctChgYearAgo-3.01.11.53.24.84.94.42.92.2 FederalGovernment3.93.94.04.24.34.44.44.44.4
PctChgYearAgo4.91.61.74.22.82.41.0-0.2-0.5 State&LocalGovernment9.39.69.810.310.510.810.810.710.7
PctChgYearAgo-4.52.92.54.32.62.10.4-0.6-0.6
Other Economic Indicators
Population(Ths)190.4195.0202.7210.0216.4221.6225.0226.9228.5
PctChgYearAgo-0.52.43.93.63.12.41.50.80.7
LaborForce(Ths)87.690.992.294.795.195.496.296.897.4
PercentChange,YearAgo-1.03.81.52.70.30.40.80.60.6
UnemploymentRate(%)6.33.92.82.83.23.43.73.93.8
TotalHousingStarts1932.23146.12431.12512.82590.42436.22229.82094.32079.0
Single-Family1519.81764.82321.42100.22211.61925.91600.71433.81335.8
Multifamily412.51381.3109.6412.6378.7510.2629.1660.5743.3
Short Term Outlook for Panama City, FL
March 2025 Forecast
Personal Income (Billions $)
2024:42025:12025:22025:32025:42026:12026:22026:32026:42027:12027:22027:32027:4
TotalPersonalIncome12.612.813.013.413.613.914.114.314.514.714.915.115.3
PctChgYearAgo7.06.07.28.68.48.58.37.26.35.85.55.65.8
WagesandSalaries5.75.85.96.06.16.36.46.46.56.66.66.76.8
NonwageIncome6.97.07.27.37.57.67.87.98.08.18.28.48.5
RealPersonalIncome(12$)10.310.410.510.710.811.011.111.211.211.311.511.611.7
PctChgYearAgo4.73.74.85.75.45.45.34.43.63.33.23.53.8
PerCapitaIncome(Ths)57.458.259.060.161.062.062.863.564.164.965.766.567.3
RealPerCapitaIncome(12$)47.147.447.748.248.649.049.449.649.850.150.551.051.3
AverageAnnualWage(Ths)61.862.362.763.564.565.666.467.067.668.269.069.870.6
PctChgYearAgo5.12.63.44.04.35.25.95.44.84.14.04.34.5
Establishment Employment (Place of Work, Thousands, SA)
TotalEmployment89.189.990.891.592.292.592.792.993.193.193.193.193.1
PctChgYearAgo0.81.52.63.63.52.92.11.51.00.60.40.20.0
Manufacturing3.43.43.43.43.43.43.43.43.33.33.33.33.3
PctChgYearAgo-0.10.10.50.50.3-0.4-1.1-1.6-1.8-1.7-1.5-1.8-1.8
Nonmanufacturing85.786.587.488.188.789.189.489.689.789.789.789.889.8
PctChgYearAgo0.91.52.73.73.63.02.21.71.10.70.40.20.1
Construction&Mining7.77.77.87.97.97.97.97.97.97.97.97.97.8
PctChgYearAgo2.52.34.03.73.32.81.50.5-0.1-0.5-0.8-0.9-1.0 Trade,Trans,&Utilities17.317.517.817.918.018.018.118.218.218.318.318.418.4
PctChgYearAgo0.31.71.73.04.33.01.91.61.11.31.31.01.0 WholesaleTrade2.62.62.72.72.72.82.82.82.82.82.92.92.9 RetailTrade12.813.013.213.313.313.313.313.413.413.413.413.513.4 Trans,Wrhsng,&Util1.91.91.91.92.02.02.02.02.02.12.12.12.1 Information0.80.80.80.90.90.90.90.90.90.90.90.90.9 PctChgYearAgo-0.16.87.28.24.25.05.44.12.40.1-1.6-2.6-3.5 FinancialActivities5.65.75.75.85.95.95.95.95.95.95.95.95.9
PctChgYearAgo-1.9-0.22.65.94.23.72.51.81.10.70.50.1-0.2 Prof&BusinessServices11.811.912.012.112.212.312.412.312.312.312.312.212.3 PctChgYearAgo0.10.70.72.13.23.83.32.01.1-0.3-0.9-0.6-0.4 Educ&HealthServices10.911.011.211.311.411.511.511.611.611.611.711.711.7
PctChgYearAgo3.04.14.14.54.54.13.32.52.01.51.21.00.9 Leisure&Hospitality14.214.314.414.514.714.714.814.815.014.914.914.915.0 PctChgYearAgo-0.4-0.64.05.63.12.62.22.21.81.41.10.60.0 OtherServices2.42.52.52.62.62.62.62.72.72.72.72.72.8
PctChgYearAgo1.32.03.87.76.35.84.54.03.43.23.12.82.6 FederalGovernment4.24.34.44.44.44.44.44.44.44.44.44.44.4
PctChgYearAgo-0.1-0.62.13.64.52.91.00.2-0.1-0.1-0.1-0.3-0.3
State&LocalGovernment10.610.710.810.810.810.810.810.810.810.810.810.710.7
PctChgYearAgo3.03.22.21.31.61.00.50.30.0-0.4-0.6-0.6-0.6
Other Economic Indicators
Population(Ths)218.7220.0221.2222.2223.2224.1224.8225.4225.9226.3226.7227.1227.5
PctChgYearAgo2.92.82.52.32.01.81.61.41.21.00.90.80.7
LaborForce(Ths)94.394.995.495.695.896.096.196.296.496.596.796.897.0
PctChgYearAgo-1.3-1.1-0.11.21.71.10.70.60.60.50.60.60.6
UnemploymentRate(%)3.33.33.43.53.53.63.73.73.83.83.93.93.9
TotalHousingStarts2423.42458.62426.52437.02422.42367.32240.82151.02160.12128.22106.62083.72058.7
Single-Family2025.12064.21943.31889.31806.91700.01607.91574.81520.01484.11450.91422.51377.8
Multifamily398.3394.4483.2547.8615.6667.4632.9576.1640.1644.1655.8661.2681.0
PROFILES
The Pensacola–Ferry Pass–Brent MSA is comprised of Escambia County and Santa Rosa County. Located in the northwest corner of Florida bordering Alabama, the region is home to the Pensacola Naval Air Station, Blue Angels, and the National Museum of Naval Aviation. This area has been referred to as the “Cradle of Naval Aviation.”
QUICK FACTS
• Metro population estimate of 530,090 as of 2023 (ACS 5-Year Estimate) (U.S. Census Bureau).
• Escambia County population estimate of 326,928 as of 2023 (ACS 5-Year Estimate).
• Santa Rosa County population estimate of 203,162 as of 2023 (ACS 5-Year Estimate).
• Civilian labor force of 241,458 in December 2024 (FRED, U.S. Bureau of Labor Statistics).
• A n unemployment rate of 3.2% as of December 2024, not seasonally adjusted. This amounts to 7,652 unemployed people (FRED, U.S. Bureau of Labor Statistics).
OUTLOOK SUMMARIES
The Pensacola—Ferry Pass—Brent Metropolitan Statistical Area (MSA) will experience slow levels of economic growth in the studied indicators. Gross Metro Product will be $26,438.15 million. Average annual wage growth will be 4.2 percent, ranking 22nd in the state, leading to an average annual wage of $71,200. Personal income growth will be 5.5 percent, ranking 20th, with per capita income reaching $52,200. Pensacola’s population will grow at an average annual rate of 0.9 percent.
Employment growth will average 0.9 percent, which is below average in the state. Meanwhile, Pensacola’s unemployment rate will be 3.7 percent, in line with the state average.
The Other Services sector will be the fastest growing sector in Pensacola with a 2.9 percent average annual
growth rate. The Construction and Mining sector will grow at an annual rate of 1.4 percent. The Information sector is expected to experience a contraction of -3.7 percent, followed by a contraction in Manufacturing by -0.9 percent.
METRO NEWS SUMMARIES
Pensacola Big Lots and Party City employees face sudden layoffs before holiday season
• Nearly 50 employees from Big Lots and Party City in Pensacola are urgently seeking new jobs after being given less than 24 hours’ notice of store closures, just five days before Christmas.
• Party City is closing all its stores after 40 years, while Big Lots announced a potential sale of its assets, which is now unlikely to proceed. Economic factors like high inflation and interest rates contributed to Big Lots’ bankruptcy.
• Employees, including Brent Smith from Big Lots, expressed frustration and uncertainty about their future, especially during the holiday season.
Source: KOKH, December 20, 2024
Small businesses in Pensacola thrive as holiday shoppers flock to downtown stores
• Holiday spending in Pensacola is projected to reach record highs, with many people doing last-minute shopping, benefiting small businesses along Palafox Street.
• Businesses like Rusted Arrow and Innerlight Surf Shop rely heavily on the holiday season, with November and December being their busiest months, contributing significantly to their annual earnings.
• The National Retail Federation reports that holiday spending is expected to hit new heights, with shoppers spending an average of $902 per person, emphasizing the importance of community support for local businesses during this time.
Source: WEAR News 3, December 24, 2024
Escambia County’s DRC approved 10+ businesses to set up shop throughout 2024
• Several new businesses received development orders, including Smalls Sliders, Cook Out, Dutch Bros, Panera Bread, Jim ‘N Nick’s, Del Taco, and 7 Brew. These businesses are expanding their presence in Pensacola with new locations and facilities.
• The Nine Mile Retail Center and Zoomies Pet Hotel & Daycare are among the new commercial projects approved by the Development Review Committee. The Nine Mile Retail Center will feature a shopping center and restaurant space, while Zoomies Pet Hotel & Daycare has already opened its new facility.
• A new sport gaming venue with an accompanying restaurant called Bogey’s Golf Suites opened in Ferry Pass, providing a new spot for residents and University of West Florida students to dine and play games.
Source: Yahoo News, December 26, 2024
New Wawa Pensacola store is coming to Ferry Pass
• A new Wawa gas-and-convenience store is under construction across from HCA Florida West Hospital on North Davis Highway in Pensacola, with plans for a 5,915-square-foot building and 71 parking spaces.
• The store will be located at 8530 N. Davis Highway on a 3.44-acre parcel, with access from East Johnson Avenue and North Davis Highway.
• Pensacola’s first Wawa opened on Boesch Lane in late December, and the chain has been approved to build more stores across Escambia County.
Source: Pensacola News Journal, February 14, 2025
250+ new homes coming to Escambia after February approvals
• The Development Review Committee (DRC) approved seven residential development projects in Escambia County, including five new projects that will add over 250 homes.
• Most projects are located in the northern half of the county, with one major project in southwest Pensacola. These include subdivisions in areas like Cantonment, Ensley, and Northwest Pensacola.
• The approved projects range from minor subdivisions with a few lots to larger developments like the Davis Run subdivision, which will create 196 residential lots on a 54acre site.
Source: Pensacola News Journal, March 4, 2025
Pensacola -Ferry Pass -Brent MSA Industry Location Quotients
Long Term Outlook for Pensacola-Ferry Pass-Brent, FL
March 2025 Forecast
Personal Income (Billions $)
202020212022202320242025202620272028
TotalPersonalIncome24.827.528.330.231.933.635.537.439.4
PctChgYearAgo8.810.63.16.55.65.35.85.45.3
WagesandSalaries10.511.412.413.114.014.815.716.417.1
NonwageIncome14.416.015.917.117.818.719.821.022.3
RealPersonalIncome(12$)25.526.425.626.227.027.728.529.430.4
PctChgYearAgo8.43.5-2.92.52.92.73.03.23.3
PerCapitaIncome(Ths)48.653.153.756.158.461.064.267.070.0
RealPerCapitaIncome(12$)49.750.948.548.749.450.351.652.754.1
AverageAnnualWage(Ths)52.855.959.260.764.066.570.172.775.5
PctChgYearAgo6.16.05.82.55.53.85.43.73.9
Establishment Employment (Place of Work, Thousands, SA)
TotalEmployment183.4188.2194.8201.0204.8208.8210.3211.2212.5
PctChgYearAgo-2.02.63.53.11.92.00.70.40.6
Manufacturing6.97.27.17.06.96.96.86.76.7
PctChgYearAgo-2.34.0-2.1-1.3-0.7-0.1-1.1-1.2-1.3 Nonmanufacturing176.5181.0187.8194.0197.9201.9203.5204.5205.9
PctChgYearAgo-2.02.63.83.32.02.10.80.50.7 Construction&Mining12.012.613.313.513.813.914.114.314.6 PctChgYearAgo-1.34.95.12.11.71.31.41.21.8 Trade,Trans,&Utilities33.534.835.536.436.937.437.537.938.2 PctChgYearAgo-0.73.72.22.51.51.30.21.10.9 WholesaleTrade5.76.06.46.66.76.86.86.96.9 RetailTrade23.524.124.224.725.025.425.425.625.8 Trans,Wrhsng,&Util4.34.74.85.15.15.25.35.45.5 Information1.71.71.81.81.81.81.71.61.6 PctChgYearAgo-5.32.17.8-0.7-0.2-0.7-3.0-6.0-5.2 FinancialActivities15.215.416.517.617.717.918.218.418.5 PctChgYearAgo1.91.47.36.40.80.72.11.00.3 Prof&BusinessServices24.525.526.326.927.128.128.127.627.6 PctChgYearAgo0.54.13.02.40.53.9-0.1-1.80.0 Educ&HealthServices30.330.631.532.833.834.634.935.135.4 PctChgYearAgo-1.41.02.93.93.12.20.90.70.7 Leisure&Hospitality22.824.126.126.927.528.128.528.829.1 PctChgYearAgo-11.65.98.33.02.42.21.31.01.1 OtherServices8.28.79.09.29.69.910.210.510.7
PctChgYearAgo1.46.03.52.83.73.72.92.62.4 FederalGovernment6.86.76.87.37.57.77.77.67.6
PctChgYearAgo2.9-1.21.56.43.52.00.1-0.4-0.6
State&LocalGovernment21.520.820.921.622.222.622.622.622.7
PctChgYearAgo-2.2-3.00.63.22.51.90.10.20.2
Other Economic Indicators
Population(Ths)511.8517.9527.0537.9545.7550.3553.4558.3562.7
PctChgYearAgo1.41.21.72.11.40.80.60.90.8
LaborForce(Ths)226.1230.3236.8243.4245.1246.9248.1248.8249.7
PercentChange,YearAgo-0.21.92.82.80.70.70.50.30.3
UnemploymentRate(%)6.64.23.03.03.43.63.73.83.6
TotalHousingStarts4157.03400.23576.62866.23436.63438.03014.72927.72892.7
Single-Family3870.63112.93260.22856.53362.23280.82800.02690.42631.4
Multifamily286.4287.3316.49.774.4157.2214.7237.3261.3
Short Term Outlook for Pensacola-Ferry Pass-Brent, FL
March 2025 Forecast
Personal Income (Billions $)
2024:42025:12025:22025:32025:42026:12026:22026:32026:42027:12027:22027:32027:4
TotalPersonalIncome32.432.833.333.834.334.835.335.736.136.737.237.738.1
PctChgYearAgo5.34.25.16.06.06.26.25.65.35.35.25.45.6
WagesandSalaries14.314.514.715.015.215.515.715.816.016.116.316.516.6
NonwageIncome18.118.318.618.919.119.419.619.920.220.620.921.221.5
RealPersonalIncome(12$)27.227.427.627.828.028.228.528.628.829.029.329.629.8
PctChgYearAgo3.02.02.83.23.03.23.22.82.72.83.03.33.6
PerCapitaIncome(Ths)59.159.760.561.562.363.163.964.565.165.966.767.468.1
RealPerCapitaIncome(12$)49.749.850.150.650.951.251.551.751.952.252.652.953.2
AverageAnnualWage(Ths)64.865.265.966.967.969.069.970.370.971.672.373.073.7
PctChgYearAgo5.12.43.74.34.95.96.15.24.43.73.43.84.0
Establishment Employment (Place of Work, Thousands, SA)
TotalEmployment206.2207.5208.9209.4209.6209.9210.1210.6210.8210.8211.1211.3211.6
PctChgYearAgo1.62.02.32.01.71.20.60.60.50.40.50.40.4
Manufacturing6.96.96.96.96.96.96.86.86.86.86.86.76.7
PctChgYearAgo-1.5-0.3-1.30.50.6-0.5-0.8-1.4-1.5-1.3-1.2-1.2-1.2
Nonmanufacturing199.3200.6202.0202.5202.7203.0203.2203.8204.0204.0204.3204.6204.9
PctChgYearAgo1.72.12.42.11.71.20.60.60.60.50.50.40.4
Construction&Mining13.813.913.914.014.014.114.114.214.214.214.314.314.4
PctChgYearAgo1.22.31.10.31.51.41.41.51.21.21.11.11.3 Trade,Trans,&Utilities36.737.037.537.537.537.437.437.537.637.737.838.038.0
PctChgYearAgo0.00.60.91.42.20.9-0.30.10.20.81.31.21.3
WholesaleTrade6.76.76.86.86.86.86.86.86.86.96.96.96.9 RetailTrade24.925.225.525.625.525.425.325.425.425.425.525.725.7 Trans,Wrhsng,&Util5.15.15.25.25.25.25.25.35.35.45.45.45.5 Information1.81.81.81.81.81.81.81.71.71.71.71.61.6
PctChgYearAgo1.83.2-0.2-2.0-3.5-3.1-2.2-2.7-3.8-5.2-6.0-6.4-6.6 FinancialActivities17.717.717.817.918.018.118.218.318.318.418.418.418.4
PctChgYearAgo-0.8-0.30.90.41.82.32.12.21.71.41.20.70.8 Prof&BusinessServices27.928.028.128.228.128.228.228.028.027.827.627.527.4
PctChgYearAgo3.85.45.34.00.80.60.1-0.4-0.5-1.4-1.9-2.0-1.9 Educ&HealthServices34.034.234.634.734.734.834.834.934.935.035.135.235.2
PctChgYearAgo2.22.52.61.92.01.60.70.70.70.70.80.70.7
Leisure&Hospitality27.827.928.128.228.428.328.428.528.728.628.728.829.0
PctChgYearAgo1.70.92.93.12.11.41.11.31.21.01.21.00.9
OtherServices9.79.89.910.010.010.110.210.210.310.410.410.510.6
PctChgYearAgo3.53.63.34.03.73.42.72.72.72.62.62.52.5
FederalGovernment7.57.67.77.77.77.77.77.77.77.77.67.67.6
PctChgYearAgo1.72.22.01.52.11.10.0-0.3-0.4-0.4-0.4-0.5-0.5
State&LocalGovernment22.522.622.622.622.622.622.622.622.622.622.622.622.6
PctChgYearAgo2.82.92.41.80.50.1-0.10.00.20.20.20.20.1
Other Economic Indicators
Population(Ths)548.2549.3550.1550.6551.0551.7552.8553.9555.0556.3557.6559.0560.3
PctChgYearAgo1.31.20.90.70.50.40.50.60.70.80.90.91.0
LaborForce(Ths)244.2245.8246.9247.3247.6247.9248.0248.1248.3248.5248.7248.9249.1
PctChgYearAgo-0.6-0.30.41.41.40.90.40.30.30.30.30.30.3
UnemploymentRate(%)3.53.53.63.63.73.73.73.73.83.83.83.83.7
TotalHousingStarts3286.63562.03561.03393.83235.23158.92999.32919.62981.12952.72930.62916.82910.9 Single-Family3227.83471.13408.13214.33029.52925.92806.22720.02748.02718.72694.62679.32669.0
Multifamily58.890.9152.9179.5205.7232.9193.1199.5233.1234.0236.0237.4241.9
PROFILES
The Port St. Lucie MSA is a city on the Atlantic coast of southern Florida. Located in St. Lucie County, this municipality is the most populous in the county. Known for its Botanical Gardens and the waterways of the North Fork St. Lucie Aquatic Preserve which are home to manatees, river otters, egrets, and alligators.
QUICK FACTS
• Metro population estimate of 536,901 as of 2023 (ACS 5-Year Estimate) (U.S. Census Bureau).
• Martin County population estimate of 163,315 as of 2023 (ACS 5-Year Estimate).
• St. Lucie County population estimate of 373,586 as of 2023 (ACS 5-Year Estimate).
• Civilian labor force of 238,116 in December 2024 (FRED, U.S. Bureau of Labor Statistics).
• A n unemployment rate of 3.3% as of December 2024, not seasonally adjusted. This amounts to 7,925 unemployed people (FRED, U.S. Bureau of Labor Statistics).
OUTLOOK SUMMARIES
The Port St. Lucie Metropolitan Statistical Area (MSA) is expected to show average levels of growth in its economic indicators. Port St. Lucie’s Gross Metro Product will be $23,472.83 million. Average annual wage growth will be 4.2 percent, ranking 23rd in the state, leading to an average annual wage of $68,100. Meanwhile, personal income growth will be 5.6 percent, ranking 18th, leading to a per capita income level of $61,700, which ranks 8th highest in the state. Population growth will average 1.5 percent annually.
Employment growth is expected to average 1.5 percent annually, ranking 5th highest in the state. The unemployment rate is estimated to average 4.2 percent.
The Other Services sector will lead Port St. Lucie at an average annual growth rate of 4.3 percent. Education and Health services sector will follow at 1.9 percent. The Information sector and Manufacturing sector will both by -0.3 percent.
METRO NEWS SUMMARIES
Crunch Franchise Brings State-of-the-Art Fitness Facility to Port St. Lucie, FL
• Crunch Fitness is opening a $5 million, 55,000-square-foot gym in Port St. Lucie this winter, featuring state-of-the-art equipment, group fitness studios, Hot Yoga, Ride cycling, HydroMassage, tanning, and more.
• Franchisee CR Fitness Holdings LLC, which operates 72 locations, plans to expand to 100 clubs by 2026, bringing Crunch’s inclusive and innovative workout experience to more communities.
• Crunch offered opening promotions plus perks for the first 500 members, while the gym is also hiring staff to run the location.
Source: PR Newswire, December 10, 2024
CEO of new Port St. Lucie hospital excited to meet needs for medical care in growing area
• The new Florida Coast Medical Center, under construction in Port St. Lucie and slated to open in September 2025, aims to address the growing healthcare needs in St. Lucie County, which has seen significant population growth over the past two decades.
• The $200 million hospital will offer 54 beds and services, including 24-hour emergency care, orthopedics, advanced cardiac care, robotics, general surgery, and more. It will also have an adjacent medical office building.
• CEO Tyler Sherrill, previously with Tenet hospitals in South Carolina, envisions this hospital as the first of many in the expanding Treasure Coast market, with plans to adapt to the community’s evolving healthcare needs.
Source: TC Palm, January 29, 2025
Building Boom in St. Lucie meets resistance
• Port St. Lucie residents and local leaders are expressing concerns about rapid growth, with several new development proposals, including housing projects and zoning changes, sparking tensions over potential environmental and infrastructure impacts.
• A major project, the Walton Ranch Plan, was withdrawn before a vote due to public frustration with the developer, Meritage Homes, reworking the proposal to address local opposition.
• Growing development is often criticized and pushed back on due to threats to agricultural land and an increase in urban sprawl.
Source: CBS12, February 5, 2025
East Capital Partners and Tramview Capital Management Acquire 8-Building Small Bay Industrial Portfolio in South Florida
• Tramview Capital Management and East Capital Partners acquired an eight-building, 133,172-square-foot small bay industrial portfolio in Port St. Lucie, Florida, strategically located near Interstate 95 and a rapidly growing residential area.
• The portfolio, developed between 2019 and 2024, is 95% leased and features modern amenities, including hurricane-resistant glass, high clear heights, ample parking, and attractive facades, with recent developments like 500 NW Stadium Drive leasing quickly.
• The acquisition provides stable cash flow and value-add potential, with a flexible design catering to a variety of tenants and offering strong rental growth in the constrained small bay warehouse market.
Source: Business Wire, February 13, 2025
St. Lucie Co. approves 1,000 new homes for 55+ community amid growth concerns
• The Oak Ridge Ranches development in unincorporated St. Lucie County is expanding to include “The Reverie at Solaeris,” a 1,000home 55+ gated community on 326 acres, with amenities like a center and wetland preservation.
• St. Lucie County commissioners are balancing growth with concerns about population density. The original proposal for nearly 10,000 homes has been reduced to around 6,400, with lower density compared to Port St. Lucie.
• The development will include retail stores along Range Line Road to address traffic concerns, and the county is focusing on growth that aligns with community needs while maintaining the area’s natural character.
Source: CBS12, January 21, 2025
Long Term Outlook for Port St. Lucie, FL March 2025 Forecast
202020212022202320242025202620272028
Personal Income (Billions $)
TotalPersonalIncome30.433.535.439.241.944.246.849.452.1
PctChgYearAgo8.710.35.610.96.75.65.95.55.4
WagesandSalaries7.78.69.410.110.911.612.312.913.6
NonwageIncome22.725.026.029.131.032.634.536.538.5
RealPersonalIncome(12$)29.531.231.032.033.334.335.436.637.8
PctChgYearAgo3.06.1-0.83.34.03.03.13.33.4
PerCapitaIncome(Ths)61.966.267.271.974.577.180.684.187.7
RealPerCapitaIncome(12$)60.061.758.958.759.259.960.962.263.7
AverageAnnualWage(Ths)50.253.756.758.561.563.566.969.572.4
PctChgYearAgo6.67.05.53.25.13.35.43.94.1
Establishment Employment (Place of Work, Thousands, SA)
TotalEmployment151.5158.3165.5172.0176.0181.4183.4184.6186.4
PctChgYearAgo-2.24.54.53.92.33.11.10.61.0 Manufacturing7.47.78.18.38.28.28.28.18.1
PctChgYearAgo-1.74.35.61.7-1.70.6-0.3-0.5-0.8
Nonmanufacturing144.1150.6157.3163.7167.8173.2175.2176.4178.3
PctChgYearAgo-2.24.54.54.12.53.21.20.71.1 Construction&Mining12.312.813.614.315.215.916.116.116.3
PctChgYearAgo2.73.56.55.55.94.61.30.41.1 Trade,Trans,&Utilities31.032.734.936.036.337.637.838.238.4 PctChgYearAgo0.25.56.63.21.03.40.61.10.6 WholesaleTrade5.05.05.75.75.76.06.16.26.2 RetailTrade20.921.922.723.123.223.823.723.924.0 Trans,Wrhsng,&Util5.15.96.57.27.47.77.98.18.3 Information1.11.21.41.41.41.41.41.41.4 PctChgYearAgo-9.19.116.14.5-3.10.90.8-2.2-0.5 FinancialActivities6.06.16.26.56.56.76.86.96.9 PctChgYearAgo1.91.41.84.1-0.12.62.30.90.3 Prof&BusinessServices22.023.023.423.725.025.625.625.125.2 PctChgYearAgo5.84.61.91.15.72.40.0-2.10.5 Educ&HealthServices27.628.229.531.332.533.434.034.535.0
PctChgYearAgo-2.82.34.56.43.73.01.81.41.5
Leisure&Hospitality18.020.221.222.022.122.723.023.423.8
PctChgYearAgo-14.112.45.23.80.42.71.51.41.7 OtherServices7.17.57.98.28.38.99.39.59.8
PctChgYearAgo-6.36.05.03.71.67.73.82.92.9
FederalGovernment1.11.01.01.11.11.21.21.11.1
PctChgYearAgo4.8-6.82.57.20.85.8-1.8-1.1-1.3
State&LocalGovernment18.018.018.219.119.419.820.020.220.3
PctChgYearAgo-3.8-0.41.64.91.52.10.80.80.9
Other Economic Indicators
Population(Ths)491.3506.7526.6546.0562.3573.5581.1587.8593.7
PctChgYearAgo2.03.13.93.73.02.01.31.21.0
LaborForce(Ths)217.8224.3229.8237.2239.3242.5244.2245.4246.6
PercentChange,YearAgo-0.13.02.43.20.91.30.70.50.5
UnemploymentRate(%)7.64.63.33.33.73.94.24.44.4
TotalHousingStarts4967.07386.07277.46079.95575.05637.15087.74682.44650.0
Single-Family4580.26237.65103.75385.25197.14579.03939.43691.23555.1
Multifamily386.81148.42173.7694.7378.01058.11148.3991.21094.8
Short Term Outlook for Port St. Lucie, FL
March 2025 Forecast
Personal Income (Billions $)
2024:42025:12025:22025:32025:42026:12026:22026:32026:42027:12027:22027:32027:4
TotalPersonalIncome42.643.243.844.645.245.946.647.247.748.449.149.850.4
PctChgYearAgo5.54.75.46.26.26.36.35.75.45.45.45.55.7
WagesandSalaries11.111.311.511.711.912.112.312.412.512.712.813.013.1
NonwageIncome31.531.932.432.933.333.834.334.835.235.836.336.837.3
RealPersonalIncome(12$)33.733.934.234.534.735.035.335.535.736.136.436.737.0
PctChgYearAgo3.22.53.03.43.23.33.33.02.83.03.13.43.7
PerCapitaIncome(Ths)75.175.876.677.778.579.480.381.181.782.783.784.685.4
RealPerCapitaIncome(12$)59.359.459.760.160.360.560.861.061.161.662.062.462.7
AverageAnnualWage(Ths)62.162.563.063.864.865.966.767.267.968.569.269.970.6
PctChgYearAgo4.51.83.23.84.35.45.95.44.84.03.74.04.0
Establishment Employment (Place of Work, Thousands, SA)
TotalEmployment177.7179.6181.3182.0182.8183.1183.3183.6183.7184.0184.4184.7185.1
PctChgYearAgo2.53.23.42.92.81.91.10.80.50.50.60.60.8 Manufacturing8.18.28.28.28.28.28.28.28.28.28.18.18.1
PctChgYearAgo-2.1-0.50.51.51.00.2-0.1-0.6-0.7-0.4-0.3-0.6-0.7 Nonmanufacturing169.6171.5173.1173.8174.5174.9175.1175.4175.5175.8176.2176.6177.0
PctChgYearAgo2.73.43.53.02.92.01.20.90.60.50.60.70.8
Construction&Mining15.615.715.815.916.016.116.116.116.116.116.116.216.2
PctChgYearAgo6.36.85.53.62.72.11.51.00.50.40.30.30.5 Trade,Trans,&Utilities36.637.137.637.837.837.737.737.937.938.038.238.338.3
PctChgYearAgo0.42.33.93.93.51.50.20.40.30.91.21.11.0
WholesaleTrade5.85.96.06.16.16.16.16.26.26.26.26.26.2 RetailTrade23.323.623.923.923.923.723.723.823.723.823.923.923.9 Trans,Wrhsng,&Util7.47.67.77.87.87.97.98.08.08.18.18.18.2 Information1.41.41.41.41.41.41.41.41.41.41.41.41.4 PctChgYearAgo-0.11.20.6-0.32.11.61.70.7-0.8-2.0-2.3-2.3-2.2 FinancialActivities6.56.66.66.76.76.86.86.86.86.96.96.96.9 PctChgYearAgo-0.10.62.23.54.23.52.62.01.20.90.90.80.8 Prof&BusinessServices25.325.525.625.725.725.825.725.525.425.225.125.025.0 PctChgYearAgo6.45.22.50.81.41.00.6-0.5-1.2-2.2-2.5-2.1-1.5 Educ&HealthServices32.733.033.433.633.833.934.034.134.234.334.534.634.7
PctChgYearAgo2.42.53.12.83.32.71.71.51.21.31.41.51.6 Leisure&Hospitality22.322.522.622.722.922.923.023.123.223.223.323.423.5
PctChgYearAgo1.32.42.52.63.12.01.61.41.11.11.41.51.5 OtherServices8.58.78.99.09.19.29.29.39.49.49.59.69.6
PctChgYearAgo4.98.18.67.16.95.23.73.53.02.82.92.93.0 FederalGovernment1.11.21.21.21.21.21.21.11.11.11.11.11.1 PctChgYearAgo2.96.57.16.73.0-0.3-2.3-2.5-2.2-1.5-1.1-0.9-0.9
State&LocalGovernment19.619.819.819.919.920.020.020.020.020.120.120.220.2
PctChgYearAgo1.92.12.52.71.31.00.70.60.80.70.80.90.9
Other Economic Indicators
Population(Ths)567.4570.2572.6574.5576.5578.3580.2581.9583.9585.6587.1588.6590.1
PctChgYearAgo2.72.42.11.81.61.41.31.31.31.31.21.21.1
LaborForce(Ths)239.7241.3242.5243.0243.4243.8244.0244.3244.6244.9245.2245.5245.8
PctChgYearAgo0.40.91.51.41.51.00.60.50.50.40.50.50.5
UnemploymentRate(%)3.83.83.94.04.14.14.24.24.34.34.44.44.4
TotalHousingStarts5586.45747.85716.85553.95530.05389.65148.55044.64768.04725.34687.74663.74652.8 Single-Family4765.64883.24667.04441.04324.74130.63934.33888.23804.43751.23704.43669.83639.6
Multifamily820.8864.61049.81112.91205.21259.01214.21156.4963.6974.1983.4994.01013.2
PROFILES
The Punta Gorda MSA is located in the southwest segment of the state. Punta Gorda is the County seat of Charlotte County and the only incorporated municipality in the country. The city is known as one of the top sport-fishing destinations along with the water recreation in Charlotte Harbor.
QUICK FACTS
• Metro population estimate of 206,134 as of 2023 (ACS 5-Year Estimate) (U.S. Census Bureau).
• Charlotte County population estimate of 206,134 as of 2023 (ACS 5-Year Estimate).
• Civilian labor force of 78,214 in December 2024 (FRED, U.S. Bureau of Labor Statistics).
• A n unemployment rate of 3.8% as of December 2024, not seasonally adjusted. This amounts to 2,979 unemployed people (FRED, U.S. Bureau of Labor Statistics).
OUTLOOK SUMMARIES
The Punta Gorda Metropolitan Statistical Area (MSA) is expected to show moderate levels of growth in its economic indicators. Punta Gorda’s Gross Metro Product will be $7,623.03 million. Average annual wage growth will be 4.5 percent, ranking 16th in the state, leading to an average annual wage of $68,200, the 7th lowest in the state. Personal income growth will be 6.3 percent, ranking 8th, leading to a per capita income level of $49,900, which ranks 20th in the state. Population growth will average 0.9 percent annually.
Employment growth is expected to average 0.9 percent annually, ranking 18th in the state. The unemployment rate is estimated to average 4.5 percent, ranking 7th highest in the state.
The Other Services sector will lead Punta Gorda at an average annual growth rate of 2.4 percent. The Leisure sector will expand at an average rate of 1.5 percent. The Federal Government sector will see a contraction of -2.2 percent, followed by a contraction in the Professional and Business Services sector by -0.2 percent.
METRO NEWS SUMMARIES
Punta Gorda supports denying Mosaic and phosphate mining in Desoto County
• The City of Punta Gorda passed a resolution on December 4, encouraging Desoto County to continue blocking The Mosaic Company from mining phosphate in the Peace River Basin due to potential public health and environmental risks.
• Desoto County previously denied Mosaic’s attempt to mine phosphate in 2018, and the company may reapply in 2025. Punta Gorda joins Charlotte County and the City of North Port in passing similar resolutions.
• L ocal water quality activist Tim Ritchie, founder of March Against Mosaic, has been a vocal opponent of phosphate mining and requested the council to draft and pass the resolution, highlighting the city council’s commitment to environmental protection.
Source: WFTX-TV, December 4, 2024
Charlotte Technical College Breaks Ground on New Aviation Training Facility
• The groundbreaking of the Aviation Training Facility near the PGD Air Center marks a significant step in aviation workforce development in Charlotte County, supported by $5.75 million in state funding.
• The 19,420-square-foot facility will offer hands-on training in Aviation Maintenance Technology, featuring a 10,000-squarefoot hangar, classrooms, labs, and modern amenities. The program aims to prepare students for careers as certified Aviation Maintenance General Technicians and Aviation Power Plant Maintenance Technicians.
• The project, a collaboration between the Airport Authority, Charlotte County Public Schools, and local businesses, is expected to be
completed by December 2025, enhancing the regional workforce and positioning PGD as a hub for aviation excellence.
Source: FlyPGD, December 12, 2024
Punta Gorda scraps plan for new $16M City Hall building
• The least expensive option for a new Punta Gorda City Hall building would cost nearly $16 million. The City Council decided on January 15 to solicit estimates for repairing and rehabbing the 1927 building and its 1978 addition, both damaged during Hurricane Ian.
• Previous plans to build a new City Hall were abandoned due to skyrocketing costs, with the most expensive option reaching over $19 million. The council is now considering repairs, with some members noting that parts of the building are in better shape than others.
• The city has been holding meetings at various locations due to the closure of City Hall, and a public workshop and tour of the building are scheduled for January 21 to gather input on the future of the facility.
Source: Gulfshore Business, January 16, 2025
New Punta Gorda affordable housing project plans to tackle 800-person waitlist
• Construction has begun on The Verandas III, Punta Gorda’s newest affordable housing apartment complex, which will have 72 apartments and is expected to begin leasing in January 2025.
• The project is part of ongoing efforts by the City, Charlotte County Commission, and the Punta Gorda Housing Authority to rebuild affordable housing destroyed by Hurricane Charley in 2004. Over 800 applicants are currently waiting for affordable housing.
• The Punta Gorda Housing Authority, along with city and county officials, will continue to seek and develop future public housing projects to address the high real estate and rental costs in the area.
Source: Fox 4 News, January 22, 2025
Punta Gorda’s City Marketplace hits market for $12M
• The vacant City Marketplace acreage in downtown Punta Gorda is on the market for $12 million, marketed as a mixed-use development opportunity with residential, retail, and hospitality components.
• The development proposal includes 270 residential units, 17,268 square feet of retail space, a 60-room boutique hotel, and a fourlevel parking garage. The plan aims to blend with existing structures and meet community desires for a local market and green space.
• The property has been vacant since Hurricane Charley in 2004, and previous development proposals faced challenges due to concerns about density and parking. The current City Council is reviewing land development regulations to facilitate the project.
Source: Gulfshore Business, January 24, 2025
Comcast Invests $15M to Expand High-Speed Network Across Charlotte County, FL
• Comcast announced a $15 million investment to expand its high-speed, reliable network across Charlotte County, Florida, providing access to Xfinity and Comcast Business services for thousands of homes and businesses.
• Comcast is also supporting the community through initiatives like a $30,000 grant to the Boys & Girls Clubs of Charlotte County for a new computer lab and continuing its Internet Essentials program to provide affordable internet access.
Source: PR Newswire, January 24, 2025
Long Term Outlook for Punta Gorda, FL
March 2025 Forecast
Personal Income (Billions $)
202020212022202320242025202620272028
TotalPersonalIncome9.110.110.511.412.112.913.814.615.5
PctChgYearAgo8.710.83.88.66.46.76.36.06.1
WagesandSalaries2.32.73.03.33.53.73.94.14.3
NonwageIncome6.87.47.58.18.79.39.910.511.2
RealPersonalIncome(12$)8.89.69.49.610.010.410.711.111.6
PctChgYearAgo4.19.4-2.32.03.74.03.53.84.1
PerCapitaIncome(Ths)48.451.651.454.556.959.963.166.169.1
RealPerCapitaIncome(12$)46.849.346.246.046.848.049.250.551.8
AverageAnnualWage(Ths)47.752.354.958.261.063.266.969.972.7
PctChgYearAgo7.39.84.86.14.93.56.04.44.1
Establishment Employment (Place of Work, Thousands, SA)
TotalEmployment48.851.253.855.956.657.557.758.058.6
PctChgYearAgo-2.44.95.03.91.21.60.40.51.0
Manufacturing0.80.90.90.91.01.01.01.01.0
PctChgYearAgo-0.112.53.71.35.90.3-0.3-0.1-0.5 Nonmanufacturing48.050.352.854.955.556.556.757.057.6 PctChgYearAgo-2.44.85.04.01.11.70.50.51.0 Construction&Mining4.54.85.25.86.06.16.26.16.2
PctChgYearAgo3.77.58.710.53.02.90.3-0.30.7 Trade,Trans,&Utilities11.611.912.512.913.013.313.313.413.4
PctChgYearAgo-1.53.15.13.20.42.50.30.60.2 WholesaleTrade0.80.80.91.01.01.11.11.11.1 RetailTrade9.59.810.310.310.310.510.510.510.6 Trans,Wrhsng,&Util1.21.31.41.61.61.71.81.81.7 Information0.30.40.40.40.40.40.40.40.4 PctChgYearAgo-17.020.20.0-0.20.10.91.5-1.8-0.3 FinancialActivities2.22.32.32.32.42.42.52.52.5 PctChgYearAgo-3.44.9-0.71.23.11.01.60.90.7 Prof&BusinessServices4.55.26.06.26.36.46.46.26.3
PctChgYearAgo3.715.114.74.21.31.1-0.4-2.00.6 Educ&HealthServices9.69.49.510.010.110.110.210.310.5 PctChgYearAgo-3.3-1.10.84.71.00.70.61.31.5 Leisure&Hospitality6.97.57.87.97.77.87.98.08.1 PctChgYearAgo-11.48.74.30.9-2.31.60.81.52.1 OtherServices2.42.62.92.93.03.13.23.23.3
PctChgYearAgo4.97.98.32.03.54.01.52.12.0 FederalGovernment0.30.30.30.40.40.40.40.40.4
PctChgYearAgo10.3-13.75.426.9-0.3-0.6-2.8-3.3-2.1 State&LocalGovernment5.75.85.96.16.46.46.46.46.5
PctChgYearAgo-2.12.01.73.53.70.30.10.71.2
Other Economic Indicators
Population(Ths)188.5196.0204.2209.3213.3216.1218.1220.9224.0
PctChgYearAgo2.53.94.22.51.91.30.91.31.4 LaborForce(Ths)71.273.476.578.878.779.479.880.080.3
PercentChange,YearAgo-0.13.14.33.0-0.10.80.50.30.3
UnemploymentRate(%)7.74.43.33.33.94.34.54.64.4
TotalHousingStarts2554.73977.75447.94119.54332.13859.23143.22845.12743.7 Single-Family2362.53262.74497.13815.73726.82874.42568.72345.52187.5
Multifamily192.2715.0950.8303.8605.3984.8574.5499.6556.2
Short Term Outlook for Punta Gorda, FL March 2025 Forecast
Personal Income (Billions $)
2024:42025:12025:22025:32025:42026:12026:22026:32026:42027:12027:22027:32027:4
TotalPersonalIncome12.412.612.813.113.313.513.713.914.014.314.514.714.9
PctChgYearAgo6.95.86.47.27.27.16.85.95.55.65.86.26.4
WagesandSalaries3.53.63.63.73.73.83.93.94.04.04.14.14.2
NonwageIncome8.99.09.29.49.59.79.810.010.110.310.410.610.8
RealPersonalIncome(12$)10.110.210.310.410.510.610.710.810.811.011.111.211.3
PctChgYearAgo4.63.54.04.44.24.13.83.22.83.23.64.14.4
PerCapitaIncome(Ths)57.758.559.460.561.362.262.963.564.064.965.766.567.2
RealPerCapitaIncome(12$)47.147.447.848.348.648.949.249.449.549.950.350.751.0
AverageAnnualWage(Ths)61.762.162.563.564.565.866.767.268.068.869.570.270.9
PctChgYearAgo4.31.93.34.14.76.06.75.95.34.54.24.54.4
Establishment Employment (Place of Work, Thousands, SA)
TotalEmployment56.757.157.557.657.757.757.757.857.857.858.058.158.2
PctChgYearAgo1.41.91.81.11.81.00.30.30.20.30.50.60.7
Manufacturing1.01.01.01.01.01.01.01.01.01.01.01.01.0
PctChgYearAgo0.1-0.7-2.53.41.00.0-0.2-0.7-0.5-0.20.00.0-0.4
Nonmanufacturing55.756.156.556.656.756.756.756.856.856.857.057.157.2
PctChgYearAgo1.51.91.81.11.81.10.30.30.20.30.50.60.7
Construction&Mining6.06.16.16.26.26.26.26.16.16.16.16.16.1
PctChgYearAgo3.03.23.51.93.22.10.5-0.4-0.8-0.7-0.4-0.30.0
Trade,Trans,&Utilities13.013.213.313.313.313.313.313.413.413.413.413.413.4
PctChgYearAgo0.62.22.92.82.10.70.00.30.30.70.80.60.5 WholesaleTrade1.11.11.11.11.11.11.11.11.11.11.11.11.1 RetailTrade10.310.410.510.510.510.410.410.510.510.510.510.610.6 Trans,Wrhsng,&Util1.71.71.71.71.71.81.81.81.81.81.81.81.8 Information0.40.40.40.40.40.40.40.40.40.40.40.40.4
PctChgYearAgo0.10.4-0.10.13.12.92.51.5-0.6-1.7-1.8-1.9-2.0 FinancialActivities2.42.42.42.42.42.52.52.52.52.52.52.52.5
PctChgYearAgo0.1-0.50.10.93.53.01.61.10.60.70.90.91.1 Prof&BusinessServices6.36.46.46.46.46.46.46.36.36.36.26.26.2
PctChgYearAgo1.71.21.60.61.10.8-0.2-0.8-1.4-2.3-2.3-1.9-1.5
Educ&HealthServices10.110.110.110.210.210.210.210.210.210.310.310.410.4
PctChgYearAgo1.50.90.80.01.00.80.40.60.71.01.41.41.5
Leisure&Hospitality7.77.77.87.87.87.87.87.97.97.98.08.08.1
PctChgYearAgo-0.31.81.90.52.01.20.40.90.81.11.51.61.7
OtherServices3.13.13.13.23.23.23.23.23.23.23.23.33.3
PctChgYearAgo3.53.44.84.43.22.51.01.11.41.82.22.12.1
FederalGovernment0.40.40.40.40.40.40.40.40.40.40.40.40.4
PctChgYearAgo0.12.0-0.7-4.10.8-1.0-2.7-3.6-3.9-4.0-3.5-3.2-2.6
State&LocalGovernment6.46.46.46.46.46.46.46.46.46.46.46.46.5
PctChgYearAgo3.32.8-0.3-1.30.10.00.10.10.30.40.50.81.0
Other Economic Indicators
Population(Ths)214.7215.4215.9216.3216.7217.2217.7218.4219.1219.8220.5221.3222.1
PctChgYearAgo1.81.71.41.20.90.80.91.01.11.21.31.31.4
LaborForce(Ths)78.579.079.479.579.679.779.879.879.979.980.080.180.1
PctChgYearAgo-0.40.20.81.01.40.90.50.40.30.30.30.30.3
UnemploymentRate(%)4.14.14.34.34.44.44.44.54.54.64.64.64.5
TotalHousingStarts4126.14205.03981.63756.33493.93288.93191.73112.52979.62916.32859.12816.12788.8 Single-Family2843.83047.52936.02818.72695.52625.92595.92556.12496.92427.82363.92314.62275.7
Multifamily1282.31157.61045.6937.6798.3663.1595.8556.3482.7488.5495.2501.5513.1
PROFILES
The Sebastian MSA is located in central east Florida and is comprised of the Indian River County. Sebastian is home to Pelican Island, America’s first National Wildlife refuge, and is known for its Atlantic-facing beaches.
QUICK FACTS
• Metro population estimate of 169,795 as of 2023 (ACS 5-Year Estimate) (U.S. Census Bureau).
• Indian River County population estimate of 169,795 as of 2023 (ACS 5-Year Estimate).
• Civilian labor force of 68,629 in December 2024 (FRED, U.S. Bureau of Labor Statistics).
• A n unemployment rate of 3.6% as of December 2024, not seasonally adjusted. This amounts to 2,486 unemployed people (FRED, U.S. Bureau of Labor Statistics).
OUTLOOK SUMMARIES
The Sebastian Metropolitan Statistical Area (MSA) is expected to show mixed growth in the economic indicators studied in this forecast. The MSA’s Gross Metro Product level will be $8,773.83 million. Average annual wage growth of 4.5 percent will lead the average annual wage level to $73,600, ranking 15th in the state. The per capita income level will be $95,600, the 2nd highest in the state, boosted by personal income growth of 5.8 percent, ranking 16th. Population growth will be 1.1 percent, ranking 10th in the state.
The Sebastian MSA will experience an average employment growth rate of 1.1 percent annually, ranking 10th. Sebastian’s unemployment rate should average 4.5 percent, ranking 6th highest in the state.
The Other Services sector is expected to be the fastest growing sector in the area, averaging 3.3 percent growth annually. The Financial sector will have the second-highest average annual growth rate of 2.0 percent. The Manufacturing sector is expected to contract by -1.0 percent.
METRO NEWS SUMMARIES
Take hike to see how much land in Indian River County urban area can be built on | Opinion
• A n interesting question is raised—does Indian River County’s urban area have enough land for the projected growth in the area to manifest?
• Developers and Realtors in the area have claimed that there is not enough land to convert into housing in the region—however a study by the County’s consultants suggests that 51,049 additional people can be accommodated in just the urban services boundary. By 2050, growth projections expect the population to grow by 37,100.
• Some county commissioners are hoping to encourage this growth outside the current boundary to control urban sprawl and manage costs and traffic issues. SR 60 already experiences heavy traffic, and more urban development may just cause more traffic problems despite the plans for a new I-95 interchange in 2027.
Source: TC Palm, January 6, 2025
It’s a new year and Indian River County’s parks are getting a new look
• $13.4 million has been invested to improve Indian River County’s public beaches and parks, funding improvements to signage, landscaping, ballfields, and bathrooms.
• Two new ballfields, with one being a regulation baseball field, are being added to Hobart Park. This will include a concession stand, renovated bathrooms, and improvements to the sewer system. The total cost is estimated to $6.78 million. Fran Adams Park will have its restroom and concessions expanded, with fencing being added, costing $1.3 million, and both projects are being paid for by the 1% local optional sales tax.
• Across the county parks of Treasure Shores,
Found Island Oceanside, and Golden Sands Parks, the playgrounds have been upgraded, costing $451,021 and were paid for using the 1 percent optional sales tax. The Golden Sands Beach Park also had a parking lot resurfaced for $345,358.
Source: Vero News, January 22, 2025
Indian River County pledges $400,000 to Humiston Beach Boardwalk rebuilding in Vero Beach
• Hurricanes have damaged Humiston Beach Boardwalk, and the County Commission has agreed to support the project to rebuild the boardwalk. The original plan was to replace the boardwalk with a sidewalk, but this decision was repealed and a new boardwalk was decided instead.
• The county will provide $400,000, and City Manager Monte Falls says that an estimated $2.3 million is needed. Only $1 million has been budgeted, with other funds coming from $175,000 in pledges from donors, $100,000 from philanthropist Tom Corr. The Federal Emergency Management Agency said they would contribute $84,000 a far cry from the $400,000 requested from the agency.
• Construction of the boardwalk would have to wait until November, as sea turtle nesting season is from March through October. The boardwalk was originally built in 1937, rebuilt in 1973, but was destroyed by Hurricane Nicole in 2022.
Source: TC Palm, January 31, 2025
Indian River County identifies top transportation needs, warns they won’t happen overnight
• Indian River County’s Metropolitan Planning Organization (MPO), responsible for identifying top transportation needs, has set its eyes on eight targets for 2026. Many of these targets are projects that have been in progress for a few years, and MPO Director Brian Freeman said that “it generally takes 13 years
from concept to concrete.”
• The 8 targets, in order of importance, are retrofitting and completing a section of 45th Street in Gifford, widen two sections of County Road 510 to four lanes, add two lanes to two sections of 82nd Avenue, improve the U.S. 1 and Aviation Boulevard intersection, widen a section of Aviation Boulevard to 4 lanes, and widen a section of U.S. 1 to a sixlane divided highway.
• Funding has been requested for these projects from the State and federal government, with only one widening of County Road 510 being approved. Without access to funds, projects can take years to go through the process. This process is broken into four stages: project development and environmental surveying, preliminary engineering, right of way acquisition, and construction.
Source: TC Palm, February 14, 2025
Analysis finds Sebastian-Vero Beach area home sale prices dropped by 3.2% last year
• New homebuyers may see some relief as the Sebastion-Vero Beach metropolitan area experienced the 5th steepest decline in home sale prices in 2024, according to ResiClub who used data from Freddie Mac House Price Index.
• They compared 384 metropolitan housing markets in the U.S., and the Freddie Mac House Price Index looks at repeat sales of homes to determine price inflation or deflation.
• A lthough Indian River County experienced a 3.2% decrease in same-home sale values, the median sale price for single-family homes actually increased by 8.4% whereas the median sale price for townhomes and condominiums decreased by 5.7%. The Freddie Mac report expects the pace of price appreciation to be relatively moderate in 2025 with higher refinance volumes.
Source: TC Palm, February 28, 2025
Long Term Outlook for Sebastian-Vero Beach, FL
March 2025 Forecast
Personal Income (Billions $)
202020212022202320242025202620272028
TotalPersonalIncome14.015.816.318.019.019.921.122.423.8
PctChgYearAgo5.813.13.210.05.64.95.96.36.1
WagesandSalaries2.83.13.53.73.94.14.44.64.9
NonwageIncome11.212.712.914.315.115.816.717.818.9
RealPersonalIncome(12$)14.014.814.815.415.816.216.717.418.1
PctChgYearAgo3.65.5-0.34.33.02.33.14.14.1
PerCapitaIncome(Ths)87.096.396.8104.3108.4112.6118.5124.8131.1
RealPerCapitaIncome(12$)87.390.187.489.390.591.793.896.999.8
AverageAnnualWage(Ths)52.657.460.762.365.768.572.475.378.3
PctChgYearAgo7.09.25.62.75.44.25.74.04.0
Establishment Employment (Place of Work, Thousands, SA)
TotalEmployment52.253.956.958.759.160.060.661.161.8
PctChgYearAgo-4.13.25.53.20.71.41.10.81.2
Manufacturing2.22.12.42.72.72.72.72.62.6
PctChgYearAgo-6.8-3.115.610.20.51.8-1.5-1.8-2.4
Nonmanufacturing50.151.854.556.156.557.357.958.559.3
PctChgYearAgo-4.03.55.12.90.71.41.20.91.3
Construction&Mining4.54.54.84.95.05.15.25.35.3
PctChgYearAgo-0.11.26.62.22.12.51.60.71.2 Trade,Trans,&Utilities10.611.111.611.911.912.112.112.212.3
PctChgYearAgo-0.84.84.62.3-0.31.80.10.70.6 WholesaleTrade1.11.31.51.61.61.61.61.61.6 RetailTrade8.68.89.09.29.29.39.39.49.5 Trans,Wrhsng,&Util0.91.01.11.11.11.11.21.21.2 Information0.50.40.40.50.50.50.50.50.5
PctChgYearAgo-14.7-17.36.316.80.7-1.15.00.92.6 FinancialActivities2.83.03.13.03.03.03.13.13.2 PctChgYearAgo0.37.53.4-1.9-2.20.83.02.51.6 Prof&BusinessServices6.26.67.27.57.37.37.37.27.3
PctChgYearAgo-4.06.310.03.2-2.1-0.30.4-1.41.0 Educ&HealthServices10.610.611.011.511.912.012.212.412.5
PctChgYearAgo-2.00.33.24.63.41.61.71.21.1 Leisure&Hospitality7.17.68.38.68.68.68.78.99.2
PctChgYearAgo-14.97.59.23.7-0.70.91.31.92.6
OtherServices2.72.93.03.13.13.23.33.43.5
PctChgYearAgo-2.06.12.63.10.83.93.72.82.7
FederalGovernment0.40.40.40.40.40.40.40.40.4
PctChgYearAgo4.2-4.1-4.24.30.13.10.21.00.9
State&LocalGovernment4.74.74.74.74.95.05.05.05.1
PctChgYearAgo-3.4-0.5-0.91.14.01.50.50.60.8
Other Economic Indicators
Population(Ths)160.7164.3168.7172.3175.1176.7178.0179.6181.5
PctChgYearAgo1.72.32.72.11.61.00.70.91.0
LaborForce(Ths)64.065.568.169.869.670.170.670.971.2
PercentChange,YearAgo-1.72.43.92.5-0.30.80.60.40.5
UnemploymentRate(%)7.84.83.53.54.04.24.54.74.7
TotalHousingStarts1122.91547.21156.11490.6552.4643.41044.91163.91134.1
Single-Family1114.51543.01144.31233.6381.4527.1972.91079.41035.6
Multifamily8.44.211.7257.0171.1116.372.084.598.6
Short Term Outlook for Sebastian-Vero Beach, FL
March 2025 Forecast
Personal Income (Billions $)
2024:42025:12025:22025:32025:42026:12026:22026:32026:42027:12027:22027:32027:4
TotalPersonalIncome19.219.519.720.120.320.620.921.321.521.922.322.622.9
PctChgYearAgo4.43.64.35.75.86.06.25.85.86.26.36.36.5
WagesandSalaries4.04.04.14.24.24.34.44.44.54.54.64.74.7
NonwageIncome15.315.415.615.916.116.316.616.817.017.417.717.918.2
RealPersonalIncome(12$)15.916.016.116.316.416.516.616.816.917.117.317.517.7
PctChgYearAgo2.11.42.02.92.83.03.23.03.23.74.04.24.6
PerCapitaIncome(Ths)109.2110.4111.6113.6114.8116.3117.8119.3120.5122.4124.1125.7127.1
RealPerCapitaIncome(12$)90.690.891.292.192.593.093.694.294.695.696.597.398.0
AverageAnnualWage(Ths)66.667.167.868.970.171.272.172.873.574.274.975.776.4
PctChgYearAgo5.22.74.15.05.26.06.45.74.94.23.94.04.0
Establishment Employment (Place of Work, Thousands, SA)
TotalEmployment59.259.660.060.160.360.460.660.760.860.961.161.261.4
PctChgYearAgo0.61.31.31.31.81.41.01.00.90.80.80.80.9
Manufacturing2.72.72.72.72.72.72.72.72.72.72.62.62.6
PctChgYearAgo0.12.41.43.50.1-1.0-1.3-1.8-1.9-1.5-1.7-1.9-2.1
Nonmanufacturing56.556.957.257.457.557.757.958.158.258.258.458.658.8
PctChgYearAgo0.61.31.31.21.91.51.11.11.10.90.90.91.0
Construction&Mining5.15.15.15.25.25.25.25.25.25.25.35.35.3
PctChgYearAgo1.42.32.82.32.52.11.71.41.21.00.70.60.6 Trade,Trans,&Utilities11.812.012.112.112.112.112.112.112.112.112.212.212.2
PctChgYearAgo0.11.91.91.22.20.5-0.30.10.20.60.80.70.9 WholesaleTrade1.61.61.61.61.61.61.61.61.61.61.61.61.6 RetailTrade9.19.29.49.49.39.39.39.49.39.39.49.49.4 Trans,Wrhsng,&Util1.11.11.11.11.11.21.21.21.21.21.21.21.2 Information0.50.50.50.50.50.50.50.50.50.50.50.50.5
PctChgYearAgo0.1-0.5-3.0-3.63.15.16.35.43.41.40.80.60.8 FinancialActivities2.92.93.03.03.03.03.13.13.13.13.13.13.2
PctChgYearAgo-2.1-1.9-0.12.42.93.32.63.23.02.72.62.32.3
Prof&BusinessServices7.37.37.37.37.37.37.47.37.37.27.27.27.2
PctChgYearAgo-3.0-1.6-0.20.20.50.80.80.1-0.3-1.3-1.7-1.5-1.1 Educ&HealthServices11.912.012.012.112.112.212.212.312.312.312.412.412.4
PctChgYearAgo2.11.71.41.71.71.81.61.61.61.41.31.21.1
Leisure&Hospitality8.58.68.68.68.78.78.78.88.88.88.98.99.0
PctChgYearAgo0.51.20.9-0.52.01.31.11.41.41.41.92.12.2
OtherServices3.13.13.23.23.23.33.33.33.33.43.43.43.4
PctChgYearAgo3.53.73.33.94.74.53.93.53.02.82.72.83.0
FederalGovernment0.40.40.40.40.40.40.40.40.40.40.40.40.4
PctChgYearAgo0.11.83.63.83.10.5-0.20.10.60.71.01.21.0
State&LocalGovernment4.95.05.05.05.05.05.05.05.05.05.05.05.1
PctChgYearAgo2.93.01.11.20.70.40.30.40.80.60.50.60.7
Other Economic Indicators
Population(Ths)175.9176.4176.7176.9177.0177.4177.8178.2178.6179.0179.4179.8180.3
PctChgYearAgo1.41.31.10.90.60.60.70.70.90.90.90.91.0
LaborForce(Ths)69.369.870.170.370.470.570.570.670.770.870.970.971.0
PctChgYearAgo-0.90.00.81.01.51.00.60.50.40.40.40.50.5
UnemploymentRate(%)4.04.14.24.24.34.44.54.54.64.64.74.74.7
TotalHousingStarts350.2477.3603.2717.7775.5874.11015.21108.31182.21175.21169.31159.41151.6
Single-Family218.9345.9470.6613.9678.1790.1952.01046.61102.91094.01086.11074.01063.3
Multifamily131.2131.4132.6103.897.484.163.261.779.281.283.285.488.2
PROFILES
The Sebring MSA is comprised of Highlands County and located in the South-central portion of the state. Sebring is nicknamed “The City of the Circle” in reference to Circle Drive, the center of the Sebring Downtown Historic District. Sebring is the home of the Sebring International Raceway, created on a former airbase and it is currently known as the host of the host of the Mobil 1 Twelve Hours of Sebring, an annual WeatherTech SportsCar Championship Race.
QUICK FACTS
• Metro population estimate of 107,614 as of 2023 (ACS 5-Year Estimate) (U.S. Census Bureau).
• H ighlands County population estimate of 107,614 as of 2023 (ACS 5-Year Estimate).
• Civilian labor force of 36,830 in December 2024 (FRED, U.S. Bureau of Labor Statistics).
• A n unemployment rate of 4.5% as of December 2024, not seasonally adjusted. This amounts to 1,666 unemployed people (FRED, U.S. Bureau of Labor Statistics).
OUTLOOK SUMMARIES
The Sebring Metropolitan Statistical Area (MSA) is expected to have mixed levels of growth in its economic indicators. Sebring’s Gross Metro Product is the lowest in the state at $3,142.98 million. Average annual wage growth of 4.6 percent, the 9th highest, will lead to an average annual wage of $63,500, the 2nd lowest in the state. Personal income will grow by 6.2 percent, ranking 11th in the state. This will lead to a per capita income level of $43,000, once again the 2nd lowest in the state. Population growth will average 0.9 percent, ranking 16th.
Employment growth is expected to be 0.9 percent annually, ranking 16th. The unemployment rate is estimated to average 5.4 percent, the 2nd highest in the state.
The Federal Government sector will see the highest annual growth rate in Sebring at 3.2 percent. The Other Services sector will follow with a growth rate of 2.0 percent. The Information and Manufacturing sectors will contract at rates of -3.2 and -5.9 percent respectively.
METRO NEWS SUMMARIES
Ron DeSantis approves $20M for rural infrastructure projects (Sebring airport awarded funding)
• Sebring Regional Airport secured $600,000 in state infrastructure grants aimed at boosting economic development from Florida’s Rural Infrastructure Fund.
• The Sebring Airport Authority is using the money for critical upgrades to its commerce park – designing improvements for Carroll Shelby Drive and enhancing drainage and road surfaces on Webster Turn Road.
• State leaders said these investments will help Sebring grow by improving industrial infrastructure, preparing sites for new employers and long-term job creation.
Source: Florida Politics, December 8, 2024
Sebring made an offer on land to relocate public works
• Sebring has made an offer to relocate its Public Works and Utilities Departments, with plans to redevelop the 422 Park Street property currently housing the old power plant.
• A sale agreement for the relocation is expected to be discussed at the City Council meeting on January 7, 2025.
• The redevelopment of the old power plant property could provide new opportunities for urban development in the area once the departments are moved.
Source: Highlands News-Sun, December 29, 2024
Sebring Circle gets an HGTV Home Town Takeover
• Sebring was selected as HGTV’s Home Town Takeover, bringing a team to renovate over a dozen homes, businesses, and public spaces in the historic downtown area.
• The 14-week project accelerated local redevelopment efforts, addressing rundown buildings, updating infrastructure, and engaging with local contractors to help transform the town.
• City officials hope the premier, releasing on March 25, will boost tourism and business, while attracting more visitors and renewed investor interest..
Source: Highland News-Sun. January 1, 2025
Long Term Outlook for Sebring, FL
March 2025 Forecast
Personal Income (Billions $)
202020212022202320242025202620272028
TotalPersonalIncome3.94.34.44.85.05.35.76.06.4
PctChgYearAgo7.79.52.28.55.36.37.16.05.4
WagesandSalaries1.21.31.41.51.61.71.81.92.0
NonwageIncome2.83.03.03.23.43.63.94.14.4
RealPersonalIncome(12$)4.24.44.24.34.44.64.85.05.1
PctChgYearAgo8.63.3-4.12.92.73.64.33.83.4
PerCapitaIncome(Ths)38.541.441.143.545.047.250.353.255.8
RealPerCapitaIncome(12$)41.742.339.439.639.840.842.343.845.1
AverageAnnualWage(Ths)46.448.651.153.756.659.062.465.067.6
PctChgYearAgo6.84.65.35.15.34.35.74.24.1
Establishment Employment (Place of Work, Thousands, SA)
TotalEmployment24.925.727.228.228.529.129.429.529.6
PctChgYearAgo-4.93.55.63.71.31.91.20.20.3
Manufacturing0.70.60.60.70.70.70.70.60.6
PctChgYearAgo2.3-9.86.19.05.6-0.4-6.4-8.1-8.5 Nonmanufacturing24.225.126.527.527.828.428.828.929.0 PctChgYearAgo-5.13.85.63.61.22.01.40.40.5
Construction&Mining1.61.71.81.91.92.02.02.02.0
PctChgYearAgo6.37.79.35.20.12.31.6-0.10.4 Trade,Trans,&Utilities5.55.75.96.06.06.16.26.26.2
PctChgYearAgo-3.92.64.40.80.32.50.50.3-0.2 WholesaleTrade0.80.80.80.80.80.90.90.90.9 RetailTrade3.83.94.14.14.14.24.24.24.2 Trans,Wrhsng,&Util0.90.91.01.01.01.01.11.11.1 Information0.10.20.20.20.20.20.20.20.2 PctChgYearAgo-8.336.9-8.44.9-3.9-2.0-1.7-5.5-3.6 FinancialActivities0.90.90.91.01.11.21.21.11.1 PctChgYearAgo-4.90.92.811.07.43.90.9-1.7-2.6 Prof&BusinessServices2.12.62.82.82.72.72.72.72.8 PctChgYearAgo-8.119.210.3-2.2-3.50.50.90.42.8 Educ&HealthServices6.16.16.56.86.86.97.17.27.2
PctChgYearAgo-3.41.45.45.30.31.32.11.11.1
Leisure&Hospitality3.13.23.53.73.94.14.24.14.1
PctChgYearAgo-12.53.09.75.75.84.02.0-0.4-0.7 OtherServices0.60.60.70.70.70.80.80.80.8
PctChgYearAgo-7.6-3.19.48.93.63.32.50.91.2 FederalGovernment0.30.30.30.30.30.30.30.30.3
PctChgYearAgo9.2-9.54.8-0.2-2.45.53.42.41.5 State&LocalGovernment3.83.93.94.14.24.24.24.34.3
PctChgYearAgo-5.51.50.84.02.00.51.40.60.7
Other Economic Indicators
Population(Ths)101.7103.7106.6109.3111.4112.7113.3113.6114.1
PctChgYearAgo0.71.92.92.51.91.20.50.40.4
LaborForce(Ths)34.535.336.337.437.537.637.537.337.2
PercentChange,YearAgo-2.82.22.93.10.10.2-0.2-0.4-0.4
UnemploymentRate(%)8.25.94.34.34.85.15.45.55.4
TotalHousingStarts357.1564.5630.9670.9690.4584.3473.6451.4442.7
Single-Family353.7549.7623.3630.1632.4531.6428.5393.2374.0
Multifamily3.414.87.640.858.152.645.158.268.7
Short Term Outlook for Sebring, FL
March 2025 Forecast
Personal Income (Billions $)
2024:42025:12025:22025:32025:42026:12026:22026:32026:42027:12027:22027:32027:4
TotalPersonalIncome5.15.25.35.45.55.65.75.85.85.96.06.16.2
PctChgYearAgo5.24.85.97.17.27.37.57.16.66.66.15.75.8
WagesandSalaries1.71.71.71.71.81.81.81.91.91.91.91.92.0
NonwageIncome3.43.53.63.63.73.73.83.93.94.04.14.14.2
RealPersonalIncome(12$)4.54.54.64.64.74.74.84.84.94.95.05.05.0
PctChgYearAgo3.02.63.54.24.24.24.54.34.04.13.83.63.8
PerCapitaIncome(Ths)45.446.146.747.648.349.150.050.951.452.252.953.554.1
RealPerCapitaIncome(12$)40.040.340.641.041.341.742.242.742.843.343.744.044.3
AverageAnnualWage(Ths)57.457.958.459.460.461.362.162.763.364.064.665.366.0
PctChgYearAgo5.33.04.14.95.35.96.35.64.94.34.14.14.2
Establishment Employment (Place of Work, Thousands, SA)
TotalEmployment28.628.829.029.229.329.429.529.529.529.529.529.529.5
PctChgYearAgo0.71.51.91.92.31.81.41.10.70.30.10.10.1
Manufacturing0.70.70.70.70.70.70.70.70.70.60.60.60.6
PctChgYearAgo4.83.8-0.1-1.7-3.3-5.1-5.9-6.9-7.6-7.8-8.1-8.3-8.3
Nonmanufacturing27.928.128.328.428.628.728.828.828.828.828.928.928.9
PctChgYearAgo0.61.52.02.02.52.01.61.30.90.50.30.30.3
Construction&Mining2.02.02.02.02.02.02.02.02.02.02.02.02.0
PctChgYearAgo3.63.72.70.91.81.91.91.51.00.4-0.2-0.3-0.2
Trade,Trans,&Utilities6.06.16.16.16.16.16.16.26.26.26.26.26.2
PctChgYearAgo1.32.03.12.32.71.30.30.40.20.50.50.20.2 WholesaleTrade0.80.90.90.90.90.90.90.90.90.90.90.90.9
RetailTrade4.14.24.24.24.24.24.24.24.24.24.24.24.2 Trans,Wrhsng,&Util1.01.01.01.01.01.01.01.11.11.11.11.11.1
Information0.20.20.20.20.20.20.20.20.20.20.20.20.2
PctChgYearAgo-8.7-4.0-2.9-1.91.10.2-0.2-2.6-4.4-5.6-5.9-5.4-5.2 FinancialActivities1.11.11.21.21.21.21.21.21.21.21.21.11.1
PctChgYearAgo5.64.93.93.63.22.31.20.6-0.5-1.1-1.6-2.1-2.1
Prof&BusinessServices2.62.72.72.72.72.72.72.72.72.72.72.72.7
PctChgYearAgo-3.5-0.10.30.71.00.71.10.91.00.20.00.50.8
Educ&HealthServices6.86.96.97.07.07.07.17.17.17.17.27.27.2
PctChgYearAgo-2.4-0.20.52.02.82.82.31.71.51.11.01.21.2
Leisure&Hospitality4.04.04.14.14.14.14.24.24.24.14.14.14.1
PctChgYearAgo5.45.04.33.53.12.52.22.11.10.3-0.4-0.8-0.9
OtherServices0.70.80.80.80.80.80.80.80.80.80.80.80.8
PctChgYearAgo-0.21.42.93.75.34.02.91.81.30.90.71.01.2
FederalGovernment0.30.30.30.30.30.30.30.30.30.30.30.30.3
PctChgYearAgo1.62.56.08.05.64.13.33.33.02.82.72.31.7
State&LocalGovernment4.24.24.24.24.24.24.24.34.34.34.34.34.3
PctChgYearAgo0.8-0.40.70.21.51.61.51.41.00.70.60.60.6
Other Economic Indicators
Population(Ths)112.0112.4112.7112.9113.0113.1113.2113.3113.4113.5113.6113.7113.8
PctChgYearAgo1.71.51.31.10.90.70.50.40.30.30.30.40.4
LaborForce(Ths)37.337.537.637.637.637.637.537.537.437.437.437.337.3
PctChgYearAgo-0.9-0.20.20.10.70.2-0.2-0.3-0.4-0.4-0.4-0.4-0.4
UnemploymentRate(%)4.95.05.15.25.25.35.35.45.45.55.55.55.5
TotalHousingStarts642.9644.2598.2565.9528.9495.8475.4463.9459.2455.4451.7450.3448.1
Single-Family585.9589.1541.9512.6482.9454.9432.9417.9408.2401.4395.3390.2385.8
Multifamily57.055.156.253.346.040.942.546.051.054.056.460.162.3
PROFILES
The Tallahassee MSA is comprised of Gadsden, Jefferson, Leon, and Wakulla Counties. It is located between Pensacola and Jacksonville on the Florida panhandle. Tallahassee is the capital city of Florida and houses Florida State University and Florida A&M University.
QUICK FACTS
• Metro population estimate of 393,414 as of 2023 (ACS 5-Year Estimate) (U.S. Census Bureau).
• Gadsden County population estimate of 43,642 as of 2023 (ACS 5-Year Estimate).
• Jefferson County population estimate of 14,713 as of 2023 (ACS 5-Year Estimate).
• L eon County population estimate of 296,913 as of 2023 (ACS 5-Year Estimate).
• Wakulla County population estimate of 34,608 as of 2023 (ACS 5-Year Estimate).
• Civilian labor force of 203,360 in December 2024 (FRED, U.S. Bureau of Labor Statistics).
• A n unemployment rate of 3.2% as of December 2024, not seasonally adjusted. This amounts to 6,600 unemployed people (FRED, U.S. Bureau of Labor Statistics).
OUTLOOK SUMMARIES
The Tallahassee Metropolitan Statistical Area (MSA) is expected to show mixed levels of growth in the studied indicators. Tallahassee’s Gross Metro Product will be $22,680.98 million. Average annual wage growth of 4.4 percent, ranking 21st, should put the average annual wage at $71,800. Personal income will grow by 5.3 percent annually, ranking 21st, placing the per capita income level at $52,000. Population growth will be 0.7 percent, ranking 20th among the MSAs studied.
Employment growth is expected to be 0.7 percent annually, ranking 20th. The unemployment rate is
estimated to average 3.9 percent, ranking 11th in the state.
The Other Services sector will see the highest annual growth rate in Tallahassee at 4.1 percent. The Financial sector will follow with a growth rate of 1.2 percent. The Information and Manufacturing sectors will contract at rates of -3.8 and -1.4 percent respectively.
METRO NEWS SUMMARIES
Tallahassee Winter Festival helps small businesses through holiday tradition
• Tallahassee’s 38th Annual Winter Festival drew thousands of visitors, giving local businesses a much-needed holiday revenue boost.
• Small businesses like Sugarbox Bake Shop benefited from increased exposure, surpassing what they typically get from pop-ups and social media.
• The festival remains a holiday tradition for many families, featuring Santa visits, Candy Cane Lane, and the Jingle Bell Run.
Source: WTXL Tallahassee, December 7, 2024
Leon County leaders talk tourism, affordable housing at yearly retreat
• L eon County leaders set 20 new goals for 2025-2026, adding to 85 ongoing initiatives, focusing on affordable housing, tourism, and infrastructure.
• Major upcoming events, including the Motor, Drive Systems & Magnetics Conference and the World Cross Country Championship, are expected to bring millions to the local economy.
• 158 affordable housing units are planned near Lake Bradford Road, with incentives like 100% property tax exemptions to encourage more development.
Source: WTXL Tallahassee, January 27, 2025
Mega gas station and convenience store Buc-ee’s sets sights on Tallahassee.
• Buc-ee’s has submitted a permit application to Leon County for a 75,000-square-foot travel center on 73 acres north of I-10, featuring 120 fueling positions, parking spaces, and fast-food service.
• The proposed store could bring 200 jobs with salaries ranging from $16 to $32 per hour, and six positions offering over $100,000 annually, boosting the economy on the west side of Leon County.
• Buc-ee’s would join other C-store chains like Wawa and SunStop expanding in Tallahassee, marking a growing trend in the area’s convenience store market.
Source: Tallahassee Democrat, February 14, 2025
Working Class Wednesday encourages small business owners to Dream, Explore and Innovate
• Working Class Wednesday is hosting its Ultimate Networking Experience on Feb. 26 from 6-8 p.m. at Midtown & 3rd, focusing on Diversity, Equity, and Inclusion (DEI) in business.
• The event aims to connect small businesses with the community while discussing the role of DEI policies amid federal scrutiny.
• Founder Terrance Barber emphasized the importance of entrepreneurship and economic empowerment, particularly in Black communities, stating that small businesses are the backbone of local economies.
Source: WTXL Tallahassee, February 26, 2025
City lands $6.7 million grant for airport
• Tallahassee International Airport will receive a $6.7 million federal grant for taxiway construction and lighting upgrades to improve safety and efficiency.
• The funding is part of TLH’s broader modernization efforts, including a $28 million terminal expansion to accommodate international flights and boost regional trade.
• Additional projects, such as the Airport Gateway initiative, aim to enhance connectivity between TLH and downtown Tallahassee, supporting economic growth and business development.
Source: The FAMUAN, February 26, 2025
Tallahassee MSA
Long Term Outlook for Tallahassee, FL March 2025 Forecast
202020212022202320242025202620272028
Personal Income (Billions $)
TotalPersonalIncome18.320.020.221.723.124.425.827.028.4
PctChgYearAgo7.19.41.07.46.55.45.65.05.2
WagesandSalaries9.210.311.111.913.013.814.615.215.8
NonwageIncome9.19.89.29.810.110.611.111.912.6
RealPersonalIncome(12$)19.219.418.518.919.620.220.821.322.0
PctChgYearAgo8.40.9-4.72.53.82.82.82.83.2
PerCapitaIncome(Ths)47.551.551.454.657.760.563.866.769.8
RealPerCapitaIncome(12$)49.849.946.947.648.950.151.452.654.0
AverageAnnualWage(Ths)51.855.857.860.664.267.170.773.376.1
PctChgYearAgo7.27.73.64.85.94.65.33.73.8
Establishment Employment (Place of Work, Thousands, SA)
TotalEmployment177.5183.2190.9196.2201.8205.2206.2206.3207.2
PctChgYearAgo-3.83.24.22.82.81.70.50.10.4
Manufacturing3.43.84.04.24.24.24.14.04.0
PctChgYearAgo1.510.86.83.60.5-0.5-1.5-1.7-1.8
Nonmanufacturing174.1179.4186.9192.1197.6201.0202.1202.3203.2
PctChgYearAgo-3.93.14.22.82.91.70.50.10.5
Construction&Mining8.48.38.99.610.010.310.310.310.3
PctChgYearAgo-4.3-0.97.37.94.33.00.3-0.50.0 Trade,Trans,&Utilities23.624.725.726.527.728.027.927.927.8 PctChgYearAgo-4.04.73.93.34.51.2-0.5-0.1-0.3 WholesaleTrade3.73.94.34.95.25.25.25.35.3 RetailTrade17.618.418.819.019.119.519.419.419.4 Trans,Wrhsng,&Util2.22.52.52.73.43.33.33.33.2 Information3.23.64.24.24.34.24.13.93.7 PctChgYearAgo1.612.717.20.33.4-2.2-2.9-5.9-4.3 FinancialActivities7.68.08.59.29.49.59.79.89.8 PctChgYearAgo-1.85.05.98.42.01.52.20.90.0 Prof&BusinessServices23.025.327.127.128.328.528.628.128.3
PctChgYearAgo3.49.77.40.04.20.80.3-1.70.8
Educ&HealthServices24.324.625.726.927.428.028.128.328.4
PctChgYearAgo-1.11.24.44.91.92.00.60.50.5 Leisure&Hospitality16.718.820.420.821.021.121.321.621.9
PctChgYearAgo-20.212.38.52.40.50.90.71.31.6 OtherServices6.56.16.56.46.77.07.37.67.9
PctChgYearAgo-7.9-6.36.0-1.05.63.84.54.14.0
FederalGovernment2.22.12.22.32.32.32.32.42.4
PctChgYearAgo3.2-2.33.93.60.51.80.30.20.3
State&LocalGovernment58.658.057.859.060.561.962.362.562.6
PctChgYearAgo-2.2-1.0-0.32.02.62.40.60.30.3
Other Economic Indicators
Population(Ths)385.4388.8393.9398.1401.4403.1403.9405.4407.5
PctChgYearAgo0.60.91.31.10.80.40.20.40.5
LaborForce(Ths)188.9194.6197.7201.9205.1205.9206.2206.1206.1
PercentChange,YearAgo-2.03.01.62.21.50.40.20.00.0
UnemploymentRate(%)6.24.43.13.13.53.83.93.93.8
TotalHousingStarts2370.72626.82691.12575.92225.42064.02076.82151.62238.0
Single-Family1288.31542.41396.41439.11421.51269.91145.31106.31068.4
Multifamily1082.31084.41294.71136.8803.9794.1931.51045.31169.6
Short Term Outlook for Tallahassee, FL
March 2025 Forecast
Personal Income (Billions $)
2024:42025:12025:22025:32025:42026:12026:22026:32026:42027:12027:22027:32027:4
TotalPersonalIncome23.523.824.224.625.025.325.725.926.126.526.927.227.5
PctChgYearAgo5.84.35.35.96.16.36.15.34.84.74.85.15.3
WagesandSalaries13.313.513.713.914.214.414.614.714.814.915.115.315.4
NonwageIncome10.210.410.510.710.810.911.111.211.311.611.812.012.1
RealPersonalIncome(12$)19.820.020.120.320.420.620.720.820.921.121.321.421.6
PctChgYearAgo3.52.12.93.13.13.33.22.52.12.32.53.03.4
PerCapitaIncome(Ths)58.559.260.061.061.962.863.664.164.665.566.467.167.8
RealPerCapitaIncome(12$)49.349.549.850.350.751.151.451.551.652.152.552.953.2
AverageAnnualWage(Ths)65.165.866.567.668.769.870.671.071.572.273.073.774.4
PctChgYearAgo5.53.34.55.15.56.16.15.04.13.53.43.84.0
Establishment Employment (Place of Work, Thousands, SA)
TotalEmployment203.2204.2205.1205.6205.9206.1206.2206.3206.2206.2206.3206.4206.5
PctChgYearAgo2.12.02.01.31.30.90.50.30.20.00.00.00.1
Manufacturing4.24.24.24.24.24.14.14.14.14.14.14.04.0
PctChgYearAgo-2.3-1.1-1.00.2-0.2-0.9-1.3-1.7-2.0-1.7-1.6-1.7-1.7 Nonmanufacturing199.0200.0200.9201.4201.7202.0202.1202.2202.1202.1202.2202.3202.5
PctChgYearAgo2.22.12.11.41.41.00.60.40.20.10.10.10.2 Construction&Mining10.310.310.310.310.310.310.310.310.310.310.310.310.3 PctChgYearAgo3.74.74.42.30.70.60.40.2-0.1-0.2-0.4-0.6-0.6 Trade,Trans,&Utilities27.627.828.128.128.128.027.927.927.927.927.927.927.9
PctChgYearAgo0.50.70.71.52.00.5-0.5-0.7-1.0-0.40.00.00.1 WholesaleTrade5.15.25.25.25.25.25.25.25.25.25.35.35.3 RetailTrade19.119.319.519.619.619.519.419.419.419.319.419.419.4 Trans,Wrhsng,&Util3.33.33.33.33.43.33.33.33.33.33.33.23.2 Information4.34.34.24.24.24.24.14.14.04.03.93.83.8 PctChgYearAgo0.81.1-3.2-3.7-2.7-2.6-2.2-2.9-4.1-5.7-6.1-6.1-6.0 FinancialActivities9.49.49.59.69.69.79.79.89.89.89.89.89.8
PctChgYearAgo-0.70.51.42.12.22.72.12.21.71.31.10.70.5 Prof&BusinessServices28.428.428.528.528.628.728.728.528.428.228.128.028.0
PctChgYearAgo4.11.41.00.20.71.00.90.0-0.6-1.7-2.1-1.8-1.3 Educ&HealthServices27.727.828.028.028.028.128.128.228.228.228.328.328.3
PctChgYearAgo2.62.73.11.11.11.00.50.50.50.50.60.50.5 Leisure&Hospitality20.921.021.121.221.221.221.221.321.421.421.521.621.7 PctChgYearAgo0.81.30.8-0.11.70.90.40.70.71.01.31.31.5 OtherServices6.86.97.07.07.17.27.37.37.47.57.67.77.7
PctChgYearAgo4.62.92.84.35.25.04.44.34.13.94.14.24.3 FederalGovernment2.32.32.32.32.32.32.32.32.42.42.42.42.4
PctChgYearAgo0.00.42.62.02.10.90.00.00.30.20.30.20.3
State&LocalGovernment61.461.761.962.062.162.262.362.362.462.462.562.562.5
PctChgYearAgo2.62.93.22.21.20.90.50.50.40.30.30.30.2
Other Economic Indicators
Population(Ths)402.4402.9403.1403.3403.2403.5403.7404.0404.4404.7405.1405.6406.1
PctChgYearAgo0.80.70.50.40.20.10.10.20.30.30.30.40.4
LaborForce(Ths)204.3205.2206.0206.2206.2206.3206.2206.2206.1206.1206.1206.1206.1
PctChgYearAgo0.30.00.20.60.90.50.10.00.0-0.10.00.00.0
UnemploymentRate(%)3.73.73.73.83.83.93.93.93.94.04.03.93.9
TotalHousingStarts2045.82109.22080.12048.02018.82038.32049.92081.62137.32134.62146.52153.32172.0 Single-Family1247.11338.01298.51250.31192.81163.81151.81137.91127.61113.01110.31104.21097.8
Multifamily798.7771.2781.5797.7826.0874.6898.1943.71009.61021.61036.21049.11074.2
PROFILES
The Tampa–St. Petersburg–Clearwater MSA is comprised of Hernando, Hillsborough, Pasco, and Pinellas counties. Located centrally on the west coast of Florida, this region includes Tarpon Springs, Sponge Docks, Ybor City, Bush Gardens, the University of South Florida, and the University of Tampa. The Tampa Bay Buccaneers and the Tampa Bay Rays call this region home.
QUICK FACTS
• Metro population estimate of 3,342,963 as of 2023 (ACS 5-Year Estimate) (U.S. Census Bureau).
• Hernando County population estimate of 212,807 as of 2023 (ACS 5-Year Estimate).
• H illsborough County population estimate of 1,535,564 as of 2023 (ACS 5-Year Estimate).
• Pasco County population estimate of 632,996 as of 2023 (ACS 5-Year Estimate).
• Pinellas County population estimate of 961,596 as of 2023 (ACS 5-Year Estimate).
• Civilian labor force of 1,678,128 in December 2024 (FRED, U.S. Bureau of Labor Statistics).
• A n unemployment rate of 3.2% as of December 2024, not seasonally adjusted. This amounts to 54,186 unemployed people (FRED, U.S. Bureau of Labor Statistics).
OUTLOOK SUMMARIES
The Tampa—St. Petersburg—Clearwater Metropolitan Statistical Area (MSA) is expected to show average levels of growth in the studied economic indicators compared to other MSAs. The Tampa MSA will contribute the second-highest level of Gross Metro Product in the state at $218,835.65 million. Average annual wage growth of 4.7 percent, ranking 4th, will result in an average annual wage of $84,000, ranking 5th among Florida MSAs. Personal income growth of 5.6 percent, ranking 18th, will place the per capita income level at $54,300, ranking 13th.
Employment growth is expected to grow at an average of 0.7 percent annually. The MSA’s unemployment rate should average 3.8 percent. The fastest growing sector in the Tampa area will be the Other Services sector with an average annual growth rate of 2.6 percent. This is followed by the Construction and Mining sector with an average annual growth rate of 1.9 percent. The Information and Manufacturing sectors will experience a contraction of -0.5 percent and -1.8 percent respectively.
METRO NEWS SUMMARIES
Tampa Bay area third in the nation for new business applications this year
• New business applications have reached nearly 90,000 annually, almost double the 2019 figures, making Tampa one of the top three U.S. cities for startups.
• The surge is fueled by new residents, particularly from the northeast, attracted by Florida’s tax benefits and climate. Many entrepreneurs are exploring business ownership after job insecurity during COVID-19.
• Most new business owners keep their jobs while launching startups, contributing to job creation and economic growth in the region.
Source: FOX 13, December 9, 2024
USDA to provide more than $815M to Pasco County energy facility
• The USDA is investing over $815 million in a new Pasco County energy facility as part of a $6.3 billion effort to enhance rural infrastructure.
• Seminole Electric Cooperative will use $750 million to build and operate a 575-megawatt natural gas facility and transmission lines near Spring Hill, with Peace River Electric Cooperative receiving $65.8 million.
• The funding is part of broader USDA initiatives, including $5.7 billion for electric infrastructure and $642 million for clean water and waste management projects across multiple states.
Source: Tampa Bay Business Journal, December 17, 2024
Developer secures $50M tax rebate for 30-acre mixed-use Pasco development
• Pasco County approved a $50 million tax rebate incentive for Legacy Wiregrass Ranch’s first phase, a $400-500 million mixed-use development.
• The 30-acre phase will include 820 apartments, a 150-room hotel, 150,000 square feet of retail, and 150,000 square feet of office space.
• The project is expected to create 4,900 direct jobs and 7,000 induced jobs and aims to become a downtown hub for Wesley Chapel.
Source: Tampa Bay Business Journal, December 17, 2024
Several organizations receive NOAA grant aimed at growing Tampa Bay’s ‘marine economy’
• A $13.9 million NOAA grant will support Tampa Bay startups focused on solving coastal challenges and expanding the marine economy.
• USF and the St. Petersburg Innovation District will collaborate with The Continuum to find and fund startups, including those in industries such as shipping, tourism, and cybersecurity.
• The grant will fund a four-year initiative to develop innovative solutions for coastal resilience, with half of the money directly supporting new businesses.
Source: FOX 13, December 19, 2024
Cigar City Brewing founder donates $2 million to University of South Florida
• Joey and Jennifer Redner donated $2.2 million to USF, with half supporting the on-campus stadium and half benefiting the brewing arts program.
• The $340 million, 35,000-seat stadium, set to open in 2027, will host football, lacrosse, concerts, and other events.
• Th is donation follows other major contributions, including $1 million from the Gonzmart family and another $1 million from Oscar and Miriam Horton.
Source: Tampa Bay Business Journal, January 28, 2025
EPA grants $15 million to build economic development center near USF
• The UACDC received a $14.9 million EPA grant to develop an economic development center at its Cultural Campus near USF, focusing on workforce training, small business support, and health services.
• Additional projects include redeveloping contaminated properties, improving stormwater management, and expanding water access to underserved homes.
• USF students will gain hands-on experience through the initiative. In the future, plans include building an affordable housing complex.
Source: Tampa Bay Business Journal, January 28, 2025
Long Term Outlook for Tampa-St. Petersburg-Clearwater, FL
March 2025 Forecast
Personal Income (Billions $)
202020212022202320242025202620272028
TotalPersonalIncome170.9187.8197.4213.2225.6237.6252.3266.3280.5
PctChgYearAgo8.59.95.18.15.85.36.25.55.4
WagesandSalaries83.092.7102.6110.3117.0124.0132.2138.1144.8
NonwageIncome87.995.194.8102.9108.6113.7120.1128.1135.8
RealPersonalIncome(12$)161.2174.4170.1171.1176.5181.3187.3193.6200.1
PctChgYearAgo2.28.2-2.40.63.12.73.33.33.4
PerCapitaIncome(Ths)53.658.059.462.865.468.372.275.779.3
RealPerCapitaIncome(12$)50.553.851.250.451.152.153.655.156.5
AverageAnnualWage(Ths)61.165.368.571.474.677.882.486.089.7
PctChgYearAgo7.66.75.04.14.54.45.94.34.3
Establishment Employment (Place of Work, Thousands, SA)
TotalEmployment1345.61406.91484.11533.31556.61579.91592.01593.91601.4
PctChgYearAgo-3.04.65.53.31.51.50.80.10.5 Manufacturing66.969.073.174.976.776.274.772.971.2
PctChgYearAgo-3.03.16.02.42.4-0.6-2.1-2.3-2.3 Nonmanufacturing1278.71337.91411.01458.51479.91503.71517.41521.01530.1
PctChgYearAgo-3.04.65.53.41.51.60.90.20.6 Construction&Mining83.386.589.992.695.798.399.9101.0102.9 PctChgYearAgo1.73.84.03.03.32.81.61.11.9 Trade,Trans,&Utilities249.0260.7274.7279.5282.8286.2285.9286.0284.4
PctChgYearAgo-1.24.75.41.71.21.2-0.10.0-0.6 WholesaleTrade54.556.659.761.262.263.564.164.864.6 RetailTrade153.7159.9164.7166.4167.6168.7167.7167.5167.0 Trans,Wrhsng,&Util40.844.250.351.953.054.154.153.752.8 Information24.626.529.029.529.730.430.529.629.0 PctChgYearAgo-4.47.69.41.70.62.60.2-3.0-1.9 FinancialActivities125.7131.5139.7143.6144.8147.5149.9150.7150.4 PctChgYearAgo1.84.66.22.80.81.81.70.6-0.2 Prof&BusinessServices247.1265.0287.0293.2292.8296.1296.1290.6292.4 PctChgYearAgo0.47.28.32.2-0.21.10.0-1.90.6 Educ&HealthServices212.4216.9225.2239.9249.5256.9261.6264.5267.1 PctChgYearAgo-2.22.13.86.54.03.01.81.11.0 Leisure&Hospitality134.0148.5160.9169.6170.6172.2174.4176.7179.3
PctChgYearAgo-17.610.98.35.40.60.91.31.31.5 OtherServices47.749.652.554.355.756.558.159.961.7
PctChgYearAgo-7.23.95.93.42.51.52.83.12.9 FederalGovernment28.428.729.431.032.032.532.732.732.6
PctChgYearAgo6.31.12.55.33.41.70.5-0.1-0.2 State&LocalGovernment126.5124.0122.7125.2126.5127.1128.2129.2130.3
PctChgYearAgo-3.2-1.9-1.12.11.00.50.90.80.8 Other Economic Indicators
Population(Ths)3188.63239.93320.73394.33451.03479.13494.83515.93539.5
PctChgYearAgo1.21.62.52.21.70.80.40.60.7
LaborForce(Ths)1539.91580.91642.71692.01698.11703.81712.31719.21726.9
PercentChange,YearAgo-0.12.73.93.00.40.30.50.40.4
UnemploymentRate(%)7.64.32.93.03.43.73.83.93.7
TotalHousingStarts20630.923107.524238.524248.320387.918082.520380.521281.621659.4
Single-Family15574.418692.315580.514950.013759.113553.914815.114953.014585.7
Multifamily5056.54415.38658.09298.36628.94528.75565.46328.77073.6
Short Term Outlook for Tampa-St. Petersburg-Clearwater, FL
March 2025 Forecast
Personal Income (Billions $)
2024:42025:12025:22025:32025:42026:12026:22026:32026:42027:12027:22027:32027:4
TotalPersonalIncome228.9232.1235.4239.7243.4247.4250.9253.9257.0260.9264.6268.1271.5
RealPersonalIncome(12$)177.9179.0180.2182.2183.7185.4186.8187.9189.1190.9192.8194.5196.1
PctChgYearAgo2.91.92.63.13.33.63.63.12.93.03.23.53.7
PerCapitaIncome(Ths)66.066.867.768.969.870.971.872.673.474.475.376.277.0
RealPerCapitaIncome(12$)51.351.551.852.452.753.153.553.854.054.454.955.355.6
AverageAnnualWage(Ths)75.676.377.178.379.681.082.182.983.684.585.586.587.4
PctChgYearAgo4.22.84.35.05.36.16.55.85.14.44.24.34.5
Establishment Employment (Place of Work, Thousands, SA)
TotalEmployment1558.91570.01577.91583.91587.81590.31592.01593.11592.91592.81593.51594.21595.1
PctChgYearAgo0.81.41.41.31.91.30.90.60.30.20.10.10.1
Manufacturing76.576.376.376.376.075.474.874.474.073.673.272.772.3
PctChgYearAgo0.70.0-1.0-0.7-0.7-1.2-1.9-2.5-2.7-2.4-2.2-2.3-2.3
Nonmanufacturing1482.41493.71501.61507.61511.81514.91517.11518.71518.91519.11520.31521.51522.9
PctChgYearAgo0.81.51.51.42.01.41.00.70.50.30.20.20.3
Construction&Mining96.897.498.098.799.299.599.8100.1100.3100.6100.8101.2101.6
PctChgYearAgo3.13.82.62.12.52.21.91.41.11.11.01.11.3
Trade,Trans,&Utilities283.6285.5286.5286.5286.3285.5285.6286.4286.0285.9286.2286.2285.7
PctChgYearAgo0.41.51.11.31.00.0-0.30.0-0.10.10.20.0-0.1
WholesaleTrade62.963.263.563.763.663.863.964.264.464.764.964.964.8 RetailTrade167.2168.4168.9168.7168.7167.7167.6168.0167.5167.2167.5167.8167.4 Trans,Wrhsng,&Util53.553.954.154.154.154.154.154.154.154.053.953.653.4 Information30.330.530.330.330.630.830.630.430.230.029.729.429.1
PctChgYearAgo3.14.23.22.01.10.81.10.1-1.3-2.4-3.0-3.3-3.5 FinancialActivities144.8146.3147.1147.9148.6149.4149.7150.3150.2150.6150.7150.9150.7
PctChgYearAgo0.01.21.52.02.62.11.81.61.10.80.70.40.3
Prof&BusinessServices292.8294.7295.8296.8297.0297.8297.5295.2293.8292.2290.8289.7289.6
PctChgYearAgo0.31.01.11.01.41.10.6-0.6-1.1-1.9-2.2-1.8-1.4 Educ&HealthServices251.9254.0256.3258.1259.2260.4261.3262.1262.5263.5264.2264.9265.3
PctChgYearAgo3.02.73.13.32.92.51.91.61.31.21.11.11.1
Leisure&Hospitality168.9170.6171.8172.6173.6173.4173.9174.8175.7175.5176.2177.1177.9
PctChgYearAgo-1.2-0.10.70.42.81.71.21.31.21.21.41.31.3
OtherServices55.556.156.356.757.057.557.958.358.759.259.760.160.6
PctChgYearAgo1.21.41.00.82.72.52.82.93.13.13.03.13.1 FederalGovernment32.032.332.632.732.732.732.732.732.732.732.732.732.7
PctChgYearAgo0.91.21.51.82.21.30.50.20.10.00.0-0.1-0.2
State&LocalGovernment125.9126.4127.0127.3127.6127.8128.1128.3128.6128.9129.1129.4129.6
PctChgYearAgo-0.10.50.3-0.41.41.10.90.80.80.80.80.80.8
Other Economic Indicators
Population(Ths)3466.53474.03477.33480.83484.43488.63492.63496.53501.53507.23513.23518.83524.4
PctChgYearAgo1.41.20.90.70.50.40.40.50.50.50.60.60.7
LaborForce(Ths)1688.31696.71703.01706.81708.81710.21711.51712.81714.51716.31718.31720.21722.0
PctChgYearAgo-0.9-0.60.00.71.20.80.50.40.30.40.40.40.4
UnemploymentRate(%)3.63.63.73.73.73.83.83.83.83.93.93.93.8
TotalHousingStarts15735.516793.217757.718587.819191.419678.920159.220686.820997.221225.821303.921262.621334.2
Single-Family11719.512714.313347.413883.514270.214531.514759.314928.315041.415065.315005.914913.514827.1
Multifamily4016.04078.94410.34704.24921.25147.45399.95758.55955.96160.56298.06349.16507.1
PROFILES
The Villages, located in central Florida, approximately an hour north of Orlando. It is the largest retirement community in the world, comprised mostly of Sumter County, but also includes parts of Lake and Marion counties.
QUICK FACTS
• Metro population estimate of 144,970 as of 2023 (ACS 5-Year Estimate) (U.S. Census Bureau).
• Sumter County population estimate of 144,970 as of 2023 (ACS 5-Year Estimate).
• Civilian labor force of 38,936 in December 2024 (FRED, U.S. Bureau of Labor Statistics).
• A n unemployment rate of 4.7% as of December 2024, not seasonally adjusted. This amounts to 1,706 unemployed people (FRED, U.S. Bureau of Labor Statistics).
OUTLOOK SUMMARIES
The Villages Metropolitan Statistical Area (MSA) is expected to see strong levels of growth in the studied economic indicators. The Gross Metro Product will be $6,249.40 million, ranking 23rd in the state. Average annual wage growth of 4.9 percent, the highest in the state, will result in an average annual wage of $73,800. Personal income growth of 7.1 percent, the 2nd highest in the state, will contribute to a per capita income level of $64,100, ranking 5th.
The Villages will experience the highest population growth of any MSA in Florida, averaging 1.8 percent annually. Employment growth is also expected to be the highest in the state, averaging 1.8 percent annually. The unemployment rate is projected to average 5.1 percent, ranking 3rd highest among Florida MSAs.
The Other Services sector will lead The Villages at an average annual growth rate of 4.9 percent. The Leisure sector will follow with an average annual
growth rate of 3.1 percent. The Information sector will experience the largest contraction in the MSA at -2.1 percent annually, followed by Manufacturing at a -0.4 percent contraction.
METRO NEWS SUMMARIES
Safety concerns prompt change at busy intersection in The Villages
• A study found that accident history and current traffic conditions at County Road 103 and Woodridge Drive warranted a shift to a fourway stop, enhancing safety for drivers and pedestrians.
• L ocated near Buffalo Ridge Plaza, where more commercial development is planned, the change ensures the intersection can handle increased traffic flow as the area expands.
• To prevent confusion and improve compliance, message boards will be placed in January ahead of the January 10th implementation of the new traffic pattern.
Source: Villages-News, December 14, 2024
Residents overjoyed at news Costco finally coming to The Villages
• Costco is officially opening a 162,000-squarefoot store at Buffalo Ridge Plaza, featuring a gas station, liquor store, and 700 parking spots, addressing long-standing resident demand.
• The new Costco will create jobs, increase local tax revenue, and boost surrounding businesses, further solidifying The Villages as a growing commercial hub.
• A fter months of speculation and doubt, residents are celebrating the confirmation of Costco’s arrival, which has been highly anticipated since the initial announcement in April.
Source: Villages-News December 30, 2024
The Villages tops 2024 home sales list - Orlando Business Journal
• The Villages in Florida ranked as the bestselling master-planned community in the U.S. for the third consecutive year, with 3,208 home sales in 2024, a 6% increase from 2023.
• F lorida has 13 communities in the top 50, making up 38% of all home sales, more than any other state.
• The Villages now has about 152,000 residents, a 200% increase since 2010, with surrounding cities seeing a 50% population growth between 2010 and 2020.
Source: Orlando Business Journal, January 13, 2025
The Villages ranks first in job, wage growth among small cities
• The Villages ranked first in both job growth and wage growth among 203 small cities in the U.S., according to the Milken Institute’s 2025 Best Performing Cities report.
• The Villages ranked 11th in overall economic performance, a drop from 10th in 2024 and 4th in 2023, but still remains a top performer in job growth.
• Despite its strong performance in job and wage growth, The Villages ranked 203rd in community resilience, indicating a vulnerability to natural disasters.
Source: Villages-News, January 31, 2025
$5.2 million bid to renovate five executive golf courses will be reviewed Monday
• F ive executive golf courses in the Villages— Bogart & Bacall, Bonita Pass, Heron, and Truman—will undergo full renovations, including new greens, tees, fairways, bunker sand, and drainage systems.
• The total cost is $5.2 million, with the largest portion allocated to Bogart & Bacall at $2.227 million.
• The Project Wide Advisory Committee (PWAC) will evaluate the bid on Monday, Feb. 10, at Seabreeze Recreation Center at 8:30 A.M.
Source: The Gazette, February 7, 2025
County to pay $277 million to reimburse The Villages for building roads
• Sumter County will pay The Villages $277 million for roads built under a 30-year agreement made in 2018. Most reimbursements are due five years after construction.
• The county relies on fuel taxes, but revenue is stagnating due to fuel-efficient and electric vehicles. Two key fuel taxes expire in 2027, requiring a referendum for renewal. The county may use the general fund, grants, FDOT support, and impact fees to cover costs.
• Projects like Bexley Trail bridge and CR 470 widening are in progress. Rural roads are deteriorating, and major intersections are at capacity. Officials suggest property taxes or bonds as funding solutions.
Source: Villages News, February 19, 2025
The Villages MSA Industry Location Quotients
Long Term Outlook for The Villages, FL March 2025 Forecast
202020212022202320242025202620272028
Personal Income (Billions $)
TotalPersonalIncome7.69.09.610.811.612.413.514.415.3
PctChgYearAgo8.619.16.012.87.66.88.46.86.4
WagesandSalaries1.61.92.22.52.72.93.13.33.5
NonwageIncome5.97.17.38.38.99.510.311.011.8
RealPersonalIncome(12$)7.98.69.09.510.010.411.011.512.0
PctChgYearAgo10.09.74.85.14.94.25.54.64.4
PerCapitaIncome(Ths)57.966.265.369.971.873.977.881.384.8
RealPerCapitaIncome(12$)60.163.361.861.561.661.863.364.966.4
AverageAnnualWage(Ths)50.754.758.562.165.468.172.175.679.2
PctChgYearAgo6.77.96.96.15.34.16.04.74.8
Establishment Employment (Place of Work, Thousands, SA)
TotalEmployment32.135.237.940.041.142.443.443.844.1
PctChgYearAgo0.89.77.85.52.63.42.20.90.8
Manufacturing1.21.21.51.61.51.41.41.41.4
PctChgYearAgo0.91.121.86.4-8.9-1.0-1.70.30.7
Nonmanufacturing30.934.036.438.439.641.042.042.442.7
PctChgYearAgo0.810.17.35.43.13.52.40.90.8
Construction&Mining3.53.83.94.14.44.64.74.74.8
PctChgYearAgo3.07.23.55.57.05.61.30.41.1 Trade,Trans,&Utilities6.56.76.87.27.78.08.18.28.1 PctChgYearAgo1.62.40.96.77.14.01.50.5-0.6 WholesaleTrade0.90.90.91.01.11.11.21.21.2 RetailTrade4.54.64.75.05.35.55.55.65.5
Trans,Wrhsng,&Util1.11.11.11.21.31.41.41.41.4 Information0.20.20.40.30.40.40.40.30.3 PctChgYearAgo-13.631.363.5-10.14.8-0.4-0.3-4.6-3.2
FinancialActivities1.61.92.02.32.82.93.02.92.8 PctChgYearAgo10.313.38.313.919.56.21.1-2.8-4.2 Prof&BusinessServices2.52.93.43.83.93.94.04.04.0
PctChgYearAgo7.719.317.411.71.10.71.4-0.31.9 Educ&HealthServices6.87.07.78.18.58.79.19.39.5
PctChgYearAgo5.62.69.95.14.93.23.72.42.1
Leisure&Hospitality4.05.76.26.25.65.96.16.26.4
PctChgYearAgo-13.043.29.7-0.4-9.04.33.82.51.9
OtherServices0.50.60.80.90.70.80.80.80.9
PctChgYearAgo-7.013.036.43.7-14.62.94.55.66.4
FederalGovernment1.71.71.71.61.71.81.81.81.8
PctChgYearAgo5.71.0-3.4-0.93.07.31.6-1.8-2.6
State&LocalGovernment3.53.53.63.84.04.04.14.14.2
PctChgYearAgo-2.0-0.71.78.13.30.02.21.62.3
Other Economic Indicators
Population(Ths)130.8136.5146.5154.5161.7168.0173.0176.8180.3
PctChgYearAgo3.14.37.35.54.73.93.02.22.0
LaborForce(Ths)32.635.137.238.939.439.940.440.841.2
PercentChange,YearAgo0.87.66.04.81.21.31.21.01.0
UnemploymentRate(%)8.45.74.04.24.95.15.25.24.9
TotalHousingStarts3531.64408.94380.93617.13779.23572.52852.62674.32618.9
Single-Family2877.03846.03719.53363.03531.03290.22750.32593.52525.4
Multifamily654.6562.9661.5254.1248.2282.3102.380.893.5
Short Term Outlook for The Villages, FL
March 2025 Forecast
Personal Income (Billions $)
2024:42025:12025:22025:32025:42026:12026:22026:32026:42027:12027:22027:32027:4
TotalPersonalIncome11.812.012.312.612.813.113.413.613.814.014.314.514.7
PctChgYearAgo6.35.46.37.78.08.78.98.37.87.46.86.56.6
WagesandSalaries2.82.82.92.93.03.13.13.23.23.33.33.43.4
NonwageIncome9.19.29.49.69.810.010.210.410.610.811.011.111.3
RealPersonalIncome(12$)10.110.210.310.510.610.710.911.011.111.311.411.511.6
PctChgYearAgo4.03.23.94.84.95.65.95.55.14.94.64.44.6
PerCapitaIncome(Ths)72.172.573.374.475.276.377.478.479.080.080.981.882.6
RealPerCapitaIncome(12$)61.561.361.562.162.362.763.263.763.864.264.765.165.4
AverageAnnualWage(Ths)66.266.867.468.569.770.971.972.573.374.275.176.076.9
PctChgYearAgo4.32.53.94.75.36.26.75.95.14.64.54.95.0
Establishment Employment (Place of Work, Thousands, SA)
TotalEmployment41.441.842.342.743.043.243.343.543.643.743.743.843.9
PctChgYearAgo2.03.13.23.43.93.32.31.81.41.11.00.80.7
Manufacturing1.51.41.41.41.41.41.41.41.41.41.41.41.4
PctChgYearAgo-10.2-0.6-1.0-1.5-1.1-1.2-1.6-2.4-1.6-0.60.10.90.8
Nonmanufacturing39.940.440.941.241.541.741.942.142.242.242.342.442.5
PctChgYearAgo2.53.33.33.54.13.52.52.01.51.21.00.80.7
Construction&Mining4.64.64.64.74.74.74.74.74.74.74.74.74.7
PctChgYearAgo10.98.57.44.02.72.11.51.00.50.40.30.30.5
Trade,Trans,&Utilities7.87.98.08.18.18.18.18.28.28.28.28.28.2
PctChgYearAgo3.84.04.34.03.62.41.31.31.21.10.70.2-0.1 WholesaleTrade1.11.11.11.21.21.21.21.21.21.21.21.21.2 RetailTrade5.45.55.55.55.55.55.55.65.65.65.65.65.6 Trans,Wrhsng,&Util1.31.31.41.41.41.41.41.41.41.41.41.41.4 Information0.30.40.40.40.40.40.40.40.30.30.30.30.3
PctChgYearAgo8.4-4.3-1.91.23.92.91.0-1.7-3.3-4.5-4.6-4.7-4.7
FinancialActivities2.92.92.92.93.03.03.03.02.92.92.92.92.8
PctChgYearAgo17.010.17.44.63.02.81.70.6-0.7-1.8-2.6-3.2-3.6 Prof&BusinessServices3.83.93.93.93.94.04.04.04.04.04.03.94.0
PctChgYearAgo-4.50.9-1.50.72.72.52.00.70.5-0.3-0.6-0.10.0
Educ&HealthServices8.58.68.78.88.99.09.09.19.19.29.29.39.3
PctChgYearAgo0.41.82.53.45.14.83.83.42.82.62.52.32.2
Leisure&Hospitality5.75.85.85.96.06.06.16.16.26.26.26.36.3
PctChgYearAgo0.41.74.36.25.04.53.63.73.63.02.82.31.8
OtherServices0.70.70.80.80.80.80.80.80.80.80.80.90.9
PctChgYearAgo-17.91.60.13.26.76.35.03.23.54.04.96.96.7
FederalGovernment1.71.81.81.81.91.81.81.81.81.81.81.81.8
PctChgYearAgo4.15.67.77.58.65.52.10.1-1.2-1.4-1.6-1.8-2.4
State&LocalGovernment3.93.94.04.04.04.04.14.14.14.14.14.14.2
PctChgYearAgo0.1-0.7-1.3-0.62.82.72.32.01.71.31.41.61.9
Other Economic Indicators
Population(Ths)164.3165.8167.4168.7170.0171.3172.5173.6174.5175.5176.3177.2178.1
PctChgYearAgo4.44.24.03.83.53.33.12.92.62.42.22.12.0
LaborForce(Ths)39.339.639.940.040.240.340.440.540.640.740.840.941.0
PctChgYearAgo-0.20.41.21.62.11.61.21.11.01.01.01.01.0
UnemploymentRate(%)5.15.05.15.25.25.25.25.25.25.25.25.25.1
TotalHousingStarts3653.03792.83670.83516.23310.43066.42855.72760.12728.22700.92677.92663.82654.4 Single-Family3404.33518.03353.63218.23071.12907.82749.42688.32655.92625.42599.22581.62567.6
Multifamily248.8274.7317.2298.0239.3158.6106.371.972.475.578.782.286.8
PROFILES
The West Palm Beach-Boca Raton-Boyton Beach MSA stretches from the state’s Atlantic coast into the rural center and includes the northern edge of the everglades national park. It is known for being the “Golf Capital of Florida” and its sandy beaches.
QUICK FACTS
• Metro population estimate of 1,533,801 as of 2023 (ACS 5-Year Estimate) (U.S. Census Bureau).
• Palm Beach County population estimate of 1,533,801 as of 2023 (ACS 5-Year Estimate).
• Civilian labor force of 773,826 in December 2024 (FRED, U.S. Bureau of Labor Statistics).
• A n unemployment rate of 3.0% as of December 2024, not seasonally adjusted. This amounts to 23,281 unemployed people (FRED, U.S. Bureau of Labor Statistics).
OUTLOOK SUMMARIES
The West Palm Beach–Boca Raton area is expected to show relatively slow levels of growth in the economic indicators. Personal income is expected to grow an average of 5.1 percent annually. The average real per capita income level of $90,300 is the 3rd highest in the state. Average annual wage growth will be 4.5 percent, and the average annual wage level is expected to be $95,000, the highest of the studied metropolitan areas. West Palm Beach is expected to average a 0.6 percent population growth each year. The area will have a modestly high Gross Metro Product at an average level of $116,551.03 million. Employment is expected to grow at a rate of 0.6 percent each year, while unemployment is expected to be relatively moderate at an average rate of 3.9 percent.
West Palm Beach’s fastest growing sector is expected to be Other Services followed by the Education and Health Services sector which will experience 2.7 and 1.5 percent average annual growth respectively. The Information sector will contract by -0.5 percent, while the Manufacturing sector will contract by -2.2 percent.
METRO NEWS SUMMARIES
Woodfield Development and Flagler Realty & Development Inc. Break Ground on Mixed-use Development on Dixie Highway in West Palm Beach
• Woodfield Development and Flagler Realty & Development Inc. broke ground on a mixed-use development at 8111 S. Dixie Highway in West Palm Beach, featuring 358 apartment units, 90 affordable housing units, and 19,000 square feet of retail space.
• The development, located in the South End neighborhood, will offer amenities such as a coworking business lounge, resort-style pool, toplevel sky lounge, and a landscaped waterfront walkway with a dock and kayak/canoe launch.
• Woodfield Development has been expanding in Florida, with recent projects including a 318unit mixed-use community in Palm Bay and a 15-acre acquisition in Merritt Island, totaling over $1 billion in construction over the past five years.
Source: Yield PRO Magazine, December 20, 2024
Low-fare airline launches nonstop flight from CVG to West Palm Beach
• Frontier Airlines launched a new nonstop flight from Cincinnati & Northern Kentucky International Airport to Palm Beach International Airport, starting with weekly service.
• The new flight offers tickets as low as $39, with specific criteria for purchasing, making travel to Florida more accessible for budget-savvy tourists.
• Th is new route follows the introduction of a flight to Sarasota from CVG in October, and the airline also introduced a loyalty program in December with benefits like first-class seating.
Source: Journal-News, December 23, 2024
Cleveland Clinic plans to build a hospital in downtown West Palm Beach
• Cleveland Clinic announced plans to open a new hospital in West Palm Beach, featuring 150 beds, an emergency department, a medical office building, and an ambulatory surgery center. This will be the city’s first nonprofit research hospital and the first new hospital downtown in over a century..
• The clinic also plans a major expansion of its outpatient services at the downtown CityPlace development, nearly quadrupling the existing center’s square footage and adding services like chemotherapy, infusions, concierge medicine, imaging, endoscopy, and outpatient surgery.
• Cleveland Clinic has been serving South Florida for over 30 years and West Palm Beach for more than 15 years. The expansion aims to enhance care for the community, supported by an accelerated fundraising campaign.
Source: Health News Florida, December 23, 2024
Construction Is Steadily Advancing On Alba Palm Beach, A 22-Story Luxury Condominium
Located At 4714 North Flagler Drive In West Palm Beach
• A lba Palm Beach, a luxury condo development in West Palm Beach, recently reached a major construction milestone with the pouring of the transfer slab for the sixth-floor amenity deck, keeping the project on track for completion.
• The development offers 55 exclusive water-view residences and townhomes, featuring modern design, high-end amenities, and a prime location on the West bank of the Intracoastal Waterway, with easy access to Palm Beach Island and various local attractions.
• New Alba owners will receive a complimentary one-year membership to the Palm Beach Yacht Club & Marina, enhancing their luxury lifestyle with private boating, socializing, and dining opportunities.
Source: MENA-FM, January 17, 2025
Vanderbilt unveils plans for new business and
tech
campus in Florida
• Vanderbilt University plans to open a new campus in West Palm Beach, FL, focusing on graduate programs in business, computing, and engineering, with an expected enrollment of around 1,000 students.
• The university was granted seven acres of land by county and city commissioners in October 2024 and has set a fundraising goal of $300 million. Renderings for the campus were released to generate awareness and encourage community investment.
• The campus will use renewable resources and comply with floodplain regulations, offering opportunities for collaboration among startups, investors, businesses, and academia, and fostering community engagement in the Palm Beach area.
Source: WSMV, February 10, 2025
Palm Beach awards $31 million construction contract for improvements to Phipps Ocean Park
• The Town Council approved a nearly $31 million contract with Burkhardt Construction Inc. for the redevelopment of Phipps Ocean Park, including renovations to tennis courts, lifeguard stations, and electrical panels.
• The Preservation Foundation of Palm Beach, which is leading the project, decided to re-bid the contract to get more competitive responses. The project has a total budget of $34.5 million, with the town contributing $2 million and the rest funded by the foundation and other sources.
• The redevelopment project, which began design work in 2021, includes two 75-year leases for the Little Red Schoolhouse and the Coastal Restoration Center. The project aims to transform the park and has been praised by council members as a significant benefit to the community.
Source: Palm Beach Daily News, February 16, 2025
Long Term Outlook for West Palm Beach-Boca Raton-Delray Beach, FL (Division of Miami MSA)
March 2025 Forecast
Personal Income (Billions $)
202020212022202320242025202620272028
TotalPersonalIncome136.0151.4165.2180.0189.3196.3206.7219.2231.3
PctChgYearAgo5.611.39.18.95.23.75.36.05.5 WagesandSalaries40.947.752.256.659.862.766.469.472.8 NonwageIncome95.1103.7113.0123.4129.5133.6140.3149.8158.5
RealPersonalIncome(12$)118.7126.4127.2133.5136.9138.5141.9147.4152.6
PctChgYearAgo3.56.50.65.02.51.22.53.83.5
PerCapitaIncome(Ths)90.9100.5107.8115.6119.7123.0128.9136.2143.1
RealPerCapitaIncome(12$)79.383.983.085.886.686.888.591.694.4
AverageAnnualWage(Ths)67.574.977.881.785.088.493.297.2101.3 PctChgYearAgo9.711.04.04.94.04.15.44.34.3
Establishment Employment (Place of Work, Thousands, SA)
TotalEmployment604.0634.5667.9689.9701.1706.5709.5711.3716.0 PctChgYearAgo-5.65.05.33.31.60.80.40.30.7 Manufacturing19.620.421.021.822.221.921.420.920.3 PctChgYearAgo-3.34.52.83.81.7-1.2-2.4-2.5-2.6 Nonmanufacturing584.5614.1646.9668.1678.9684.6688.1690.5695.7 PctChgYearAgo-5.65.15.33.31.60.80.50.30.8 Construction&Mining37.939.341.743.746.446.046.347.048.1 PctChgYearAgo-2.43.76.14.96.1-0.90.81.52.2 Trade,Trans,&Utilities111.6117.0123.2126.2127.7127.0125.9126.1125.5 PctChgYearAgo-4.34.95.32.51.2-0.6-0.80.1-0.4 WholesaleTrade22.823.424.726.127.226.926.426.425.9 RetailTrade74.777.080.080.680.580.479.679.579.3 Trans,Wrhsng,&Util14.116.618.519.520.019.719.920.220.3 Information9.810.111.511.811.311.411.511.211.1 PctChgYearAgo-7.62.713.82.9-3.80.50.6-2.1-0.9 FinancialActivities43.545.848.849.949.749.550.050.350.3 PctChgYearAgo0.85.36.62.2-0.4-0.41.10.6-0.1 Prof&BusinessServices114.8124.9133.2135.5134.1135.1134.7132.4133.5 PctChgYearAgo-1.38.86.71.7-1.00.8-0.3-1.70.8 Educ&HealthServices102.4103.7107.0113.4118.3121.3123.3124.6125.7
PctChgYearAgo-3.01.33.26.04.42.51.71.00.9 Leisure&Hospitality74.082.189.793.995.097.098.199.5101.0 PctChgYearAgo-18.310.99.34.71.32.01.21.31.5 OtherServices29.329.529.630.130.030.331.132.233.3 PctChgYearAgo-8.70.60.61.6-0.51.32.53.63.4 FederalGovernment7.26.97.07.27.37.27.27.37.4
PctChgYearAgo3.4-3.60.63.01.2-1.10.80.90.8 State&LocalGovernment54.154.955.356.559.159.959.959.959.9
PctChgYearAgo-7.91.60.72.24.61.40.0-0.10.0
Other Economic Indicators
Population(Ths)1495.71506.61532.31556.81580.91595.71603.11609.21616.2
PctChgYearAgo0.70.71.71.61.50.90.50.40.4 LaborForce(Ths)713.9734.1757.4778.8781.4785.8790.0794.2798.7
PercentChange,YearAgo-2.02.83.22.80.30.60.50.50.6 UnemploymentRate(%)8.14.43.03.03.43.63.84.04.0 TotalHousingStarts6800.37149.06409.45029.73706.94706.16233.56728.57016.2
Single-Family4038.84280.93379.23207.92884.23330.53829.53885.03808.7 Multifamily2761.52868.13030.21821.8822.61375.62404.02843.43207.5
Short Term Outlook for West Palm Beach-Boca Raton-Delray Beach, FL (Division of Miami MSA)
March 2025 Forecast
Personal Income (Billions $)
2024:42025:12025:22025:32025:42026:12026:22026:32026:42027:12027:22027:32027:4
TotalPersonalIncome191.2192.9194.9197.5199.9202.7205.3207.9210.9214.6217.8220.8223.6
PctChgYearAgo1.90.50.91.51.62.12.42.52.93.43.84.14.0
PerCapitaIncome(Ths)120.3121.2122.2123.7125.0126.6128.1129.6131.4133.5135.4137.1138.8
RealPerCapitaIncome(12$)86.586.486.687.087.387.788.288.789.490.491.392.092.7
AverageAnnualWage(Ths)86.186.887.789.090.291.792.893.794.695.696.697.798.7
PctChgYearAgo3.72.54.14.74.85.65.95.34.94.34.14.34.3
Establishment Employment (Place of Work, Thousands, SA)
TotalEmployment703.1705.6706.4706.5707.5708.3709.3710.0710.2710.3710.9711.6712.4
PctChgYearAgo1.31.20.70.60.60.40.40.50.40.30.20.20.3
Manufacturing22.022.021.921.921.821.621.521.321.221.120.920.820.6
PctChgYearAgo-0.5-1.2-1.9-1.0-0.8-1.6-2.2-2.8-2.9-2.6-2.4-2.5-2.5
Nonmanufacturing681.1683.6684.4684.6685.7686.7687.8688.7689.0689.2690.0690.8691.7
PctChgYearAgo1.41.30.80.60.70.40.50.60.50.40.30.30.4
Construction&Mining46.546.345.945.845.946.146.346.446.646.846.947.147.3
PctChgYearAgo4.21.7-1.5-2.5-1.3-0.50.81.41.41.41.41.41.6 Trade,Trans,&Utilities127.3127.6127.3126.7126.3125.7125.8126.1126.0126.0126.1126.2126.0
PctChgYearAgo0.2-0.1-0.6-0.8-0.8-1.5-1.2-0.4-0.20.20.30.00.0 WholesaleTrade27.527.427.026.726.526.426.426.426.426.526.426.426.2 RetailTrade79.980.480.680.480.179.679.579.779.579.479.579.679.5 Trans,Wrhsng,&Util19.919.819.719.619.619.719.820.020.020.120.220.220.2 Information11.311.411.411.411.511.511.511.411.411.411.311.211.1
PctChgYearAgo-1.60.31.1-0.41.00.81.40.6-0.6-1.5-2.1-2.4-2.5 FinancialActivities49.349.449.449.549.649.950.050.250.250.350.350.450.3
PctChgYearAgo-1.0-1.3-0.5-0.30.61.01.11.41.10.90.70.40.4 Prof&BusinessServices134.3135.0135.1135.2135.0135.4135.3134.3133.7133.0132.5132.1132.1
PctChgYearAgo-0.61.10.90.60.50.20.1-0.7-1.0-1.7-2.1-1.7-1.2 Educ&HealthServices119.3120.2121.1121.7122.2122.8123.1123.5123.7124.1124.5124.8124.9
PctChgYearAgo2.92.31.93.22.42.11.71.51.21.11.11.01.0
Leisure&Hospitality95.896.396.897.097.797.697.898.398.998.899.299.7100.2
PctChgYearAgo2.92.62.41.02.01.31.01.31.21.31.41.41.3
OtherServices30.230.330.330.330.430.730.931.231.531.832.032.332.6
PctChgYearAgo1.52.21.10.80.91.32.23.03.43.63.53.53.6
FederalGovernment7.27.27.27.27.27.27.27.37.37.37.37.37.3
PctChgYearAgo0.1-1.4-1.5-0.6-0.70.00.61.21.31.11.00.90.8
State&LocalGovernment59.859.960.059.959.959.959.959.959.959.959.959.959.9
PctChgYearAgo3.92.31.61.50.20.0-0.10.00.00.0-0.1-0.1-0.1
Other Economic Indicators
Population(Ths)1588.61592.11594.51597.01599.21600.91602.21603.81605.31606.91608.41609.91611.5
PctChgYearAgo1.51.31.00.80.70.60.50.40.40.40.40.40.4
LaborForce(Ths)778.8782.9786.0786.8787.5788.8789.6790.4791.4792.5793.6794.7795.8
PctChgYearAgo-0.6-0.10.40.81.10.70.50.50.50.50.50.50.6
UnemploymentRate(%)3.43.43.63.63.73.73.83.83.93.94.04.04.0
TotalHousingStarts3324.53892.74461.45006.15464.35831.26132.56409.66560.66668.06719.16731.86794.9 Single-Family2670.82996.63240.93459.83624.93732.63814.33869.13902.03908.83895.23876.83859.3
Multifamily653.6896.11220.51546.41839.42098.62318.22540.62658.62759.22823.92855.02935.6
EXPLANATION AND INTERPRETATION
This technique compares the local economy to a reference economy; in this case, the local economy is the chosen MSA, and the reference economy is the state of Florida. An Industry Location Quotient (LQ) is calculated to determine if the local economy has a greater share of each industry’s employment than the reference economy. The LQ helps to identify specializations that exist in the local economy.
There are only three possible outcomes: 1. An LQ greater than one 2. An LQ equal to one and 3. An LQ less than one. An LQ that is greater than one means that the share of local employment in that particular industry is greater than the reference economy employment share in that same industry. This implies that some of the goods or services produced by that industry are exported for consumption elsewhere. An LQ of one means that local demand is met by the local industry. No goods/services are imported or exported from the local area in that industry. The share of local employment in that industry is equal to the share for that industry in the reference economy. An LQ less than one implies that the industry is not meeting local demand for that good or service, and in order to meet demand, that area must import that good or service. This also means that the share of local employment in that industry is less than the share of employment in that industry for the reference economy.
CALCULATION
An industry location quotient is a calculated ratio of two ratios.
LQ = ((Local employment in industry A in year T / Total local employment in year T) / (Reference economy employment in industry A in year T) / (Total reference employment in year T))
For example:
Orlando MSA employment for Information is 27,400
Total Orlando MSA nonagricultural employment is 1,104,100
Florida employment for Information is 169,800
Total Florida nonagricultural employment is 8,247,000
LQ = ((27,400 / 1,104,100) / (169,800 / 8,247,000)) = 1.2039
Source: Florida Regional Economic Database, Current Employment Statistics, November 2022
Sean Snaith, Ph.D., is the director of the University of Central Florida’s Institute for Economic Forecasting and a nationally recognized economist in the field of business and economic forecasting.
Snaith is the recipient of multiple awards for the accuracy of his forecasts, his research and his teaching. He has served as a consultant for local governments and multinational corporations such as Compaq, Dell and IBM. Before joining UCF’s College of Business, he held teaching positions at Pennsylvania State University, American University in Cairo, the University of North Dakota and the University of the Pacific.
Snaith is frequently interviewed in international, national and regional media. He has been quoted in The Wall Street Journal, USA Today, The New York Times, The Economist and The Guardian and has appeared on CNBC, Fox Business Network, The Nightly News with Brian Williams, Al Jazeera, the BBC and CBC, China Central TV, Sky News, Nippon TV and the Business News Network, based in Toronto.
Snaith is a sought-after speaker known for his engaging and humorous presentations. He has built a national reputation for his unique ability to explain complex subject matter in a digestible manner. He earned praise from one business editor for having “an uncanny knack of making economics not only understandable but interesting.”
Snaith is a member of several economic organizations and national economic forecasting panels, including The Wall Street Journal’s Economic Forecasting Survey, the Associated Press’ Economy Survey, CNNMoney.com’s Survey of Leading Economists, USA Today’s Survey of Top Economists, Federal Reserve Bank of Philadelphia’s Survey of Professional Forecasters, Bloomberg and Reuters.
Snaith holds a B.S. in Economics from Allegheny College and an M.A. and Ph.D. in Economics from Pennsylvania State University.
Sean M. Snaith, PhD Director, Institute for Economic Forecasting
P 407.823.1451
E ssnaith@ucf.edu ief@ucf.edu
ucf_ief
ucf.ief
ucf.ief
linkedin.com/company/institutefor-economic-forecasting/