U.S. Economic Forecast (Summer 2025) from UCF Institute for Economic Forecasting

Page 1


U.S. FORECAST

About University of Central Florida (UCF)

The University of Central Florida is a public, multi-campus, metropolitan research university, dedicated to serving its surrounding communities with their diverse and expanding populations, technological corridors, and international partners. The mission of the university is to offer highquality undergraduate and graduate education, student development, and continuing education; to conduct research and creative activities; to provide services that enhance the intellectual, cultural, environmental, and economic development of the metropolitan region; to address national and international issues in key areas; to establish UCF as a major presence; and to contribute to the global community.

About the College of Business

The College of Business advances the university’s mission and goal in providing intellectual leadership through research, teaching, and service. The college is striving to enhance graduate programs, while maintaining a strong undergraduate base. The college delivers research and quality business education programs at the undergraduate, master’s, doctoral, and executive levels to citizens of the state of Florida and to select clientele nationally and internationally.

We would like to recognize the following organizations for their support of the Institute for Economic Forecasting:

U.S. FORECAST 2025 - 2028

Published quarterly by the Institute for Economic Forecasting, College of Business, University of Central Florida

Copyright © 2025 Institute for Economic Forecasting. All rights reserved.

Publications of the Institute for Economic Forecasting are made possible by the following staff:

Dr. Sean Snaith, Director

Steven Abraham, Researcher

Elijah Agathe, Researcher

Noah Aguirre, Researcher

Marek Covard, Researcher

Al-sadh Imadh, Researcher

Meleah Malcolm, Researcher

Sophia Nunez, Researcher

Emileka Stephen, Researcher

Paige Wolle, Researcher

This forecast was prepared based upon assumptions reflecting the Institute for Economic Forecasting judgments as of the date it bears. Actual results could vary materially from the forecast. Neither the Institute for Economic Forecasting nor the University of Central Florida shall be held responsible as a consequence of any such variance. Unless approved by the Institute for Economic Forecasting, the publication or distribution of this forecast and the preparation, publication or distribution of any excerpts from this forecast are prohibited.

HIGHLIGHTS SUMMER 2025

IN THIS U.S. FORECAST

• The Fed is independent, not infallible and not above accountability.

• The national debt continues to rise surpassing $37.3 trillion. Annual net interest payments on this debt now exceed $1 trillion. It took decades to accumulate this debt, and the problem cannot be fixed until Congress acts. DOGE was unable to fully address this issue.

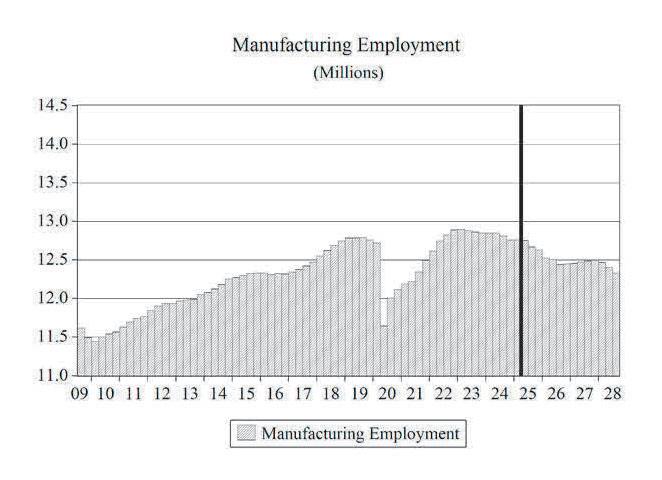
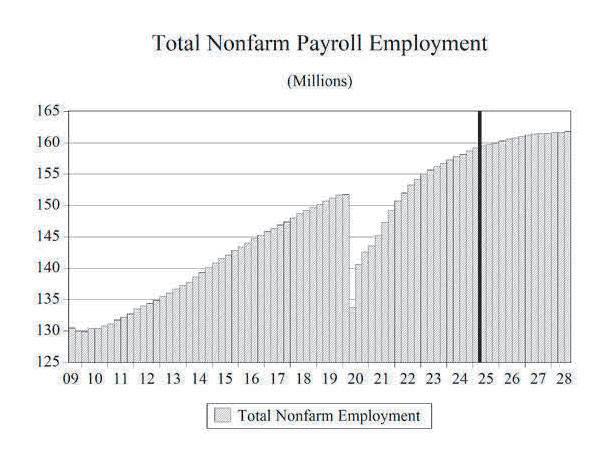
• The labor market is cooling, but still solid with low unemployment rates. Payroll job growth of 2.2% in 2023 fell to 1.3% in 2024 and will continue to slow. It is expected to hit 1.0% in 2025, and 0.7% in 2026, 0.5% in 2027 and then tick down to 0.2% in 2028.

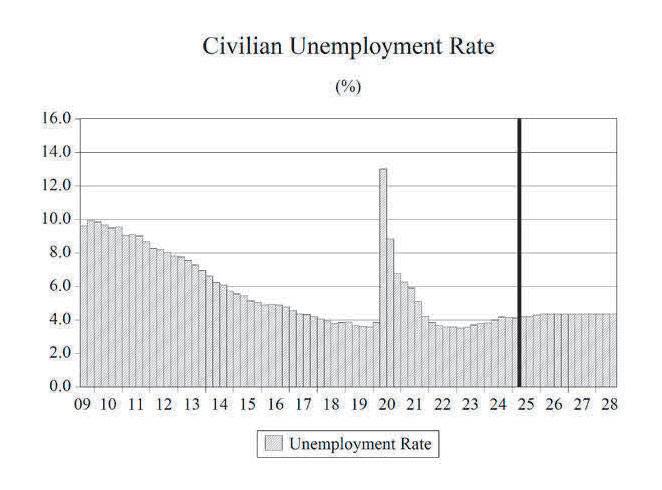
• Despite the slowdown in hiring, the headline unemployment rate (U-3) is expected to remain at historically low levels hovering around 4.3% through 2028. This rate of unemployment is consistent with full employment in the economy.

• After two years of erosion, consumers’ purchasing power has been clawing its way back. Wage growth continues to exceed inflation, allowing households to begin repairing strained budgets and address more than $1.1 trillion in credit card debt.

• Real consumption spending ticked up to 2.8% in 2024 as real wages started to rise, but will begin to decelerate, hitting 2.1% in 2025. Growth will slow to 1.9% in 2026, rise to 2.1% in 2027 and 2.4% in 2028.

• Real GDP growth was 2.8% for 2024. Growth will slow in 2025 to 1.8%, rise to 2.6% in 2026 and then ease to 1.7% in 2027, and 1.6% in 2028.

• High home prices combined with 7% mortgage rates eroded housing demand. However, low inventories will provide a floor for the sector. Housing starts declined to 1.42 million units in 2023 and will ease to 1.33 million units in 2026. However, if mortgage rates decline faster than expected, housing starts could begin to creep up.

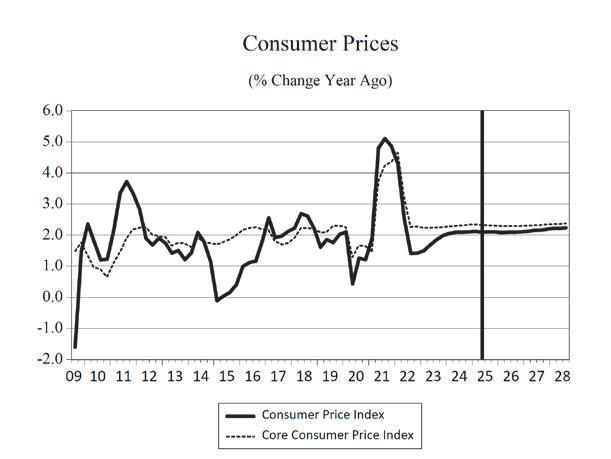
• Core consumer price inflation will continue its slow decline. By the beginning of 2027, headline inflation will be very close to the Fed’s target level of 2%. The Fed prematurely started to cut interest rates in 2024 but is poised to resume them in 2025.

Should We be Fed Up with the Fed? COVID- Era Conflicts and Missteps Should Not Go Unaddressed

Let me begin by saying that the independence of a central bank from the central government is very important. History shows that a lack of independence creates adverse consequences for banks that were fully or partially controlled by the government. Extreme examples are Weimar Germany and Zimbabwe where hyperinflation raged (prices were doubling every three days in Germany and every 24 hours in Zimbabwe) and the real economies collapsed as a result. When money no longer has a store of value function, economies will resort to barter for the exchange of goods and services. In these countries, the central government had full control over the central bank and printed money at a rapid pace that gave rise to hyperinflation and economic collapse.

Other countries have suffered adverse economic effects from central banks lacking independence, but not at the levels in Germany and Zimbabwe. Since the 1970’s countries such as India, Brazil, Argentina, Turkey and Venezuela have suffered episodes of high inflation and economic troubles stemming from a lower level of independence of the central banks in each country. The results varied, but high levels of inflation, economic instability, a devaluation of their currencies, reduced foreign investment and capital flight from these countries. All of which had negative consequences for the performance of their economies.

Independence doesn’t make a central bank infallible, and it should demand more meaningful oversight than a semi-annual testimony to Congress. In short, the Fed is independent, not infallible.

I’ve long been critical of the Fed’s handling of the COVID-19 economic response. But my criticism from that era doesn’t stop there. Allegations of improper trading and ethics controversies go back years. So much so that they fueled bipartisan accusations of a “culture of corruption” at the Fed earlier this year from Senators Elizabeth Warren and Rick Scott, arguing that Chairman Jerome Powell has been slow to enforce robust reforms.

Monetary policy is too powerful and important to expect anything less. But my real focus here is on the policy decisions the Fed made that have had sweeping impacts on our economy.

The Federal Reserve’s response to the COVID-19 economic cycle has been debated, with critics pointing to several areas where its actions have contributed to economic problems. I have argued for years that the entire policy response to COVID was incredibly flawed, and this includes, but is certainly not limited to, monetary policy.

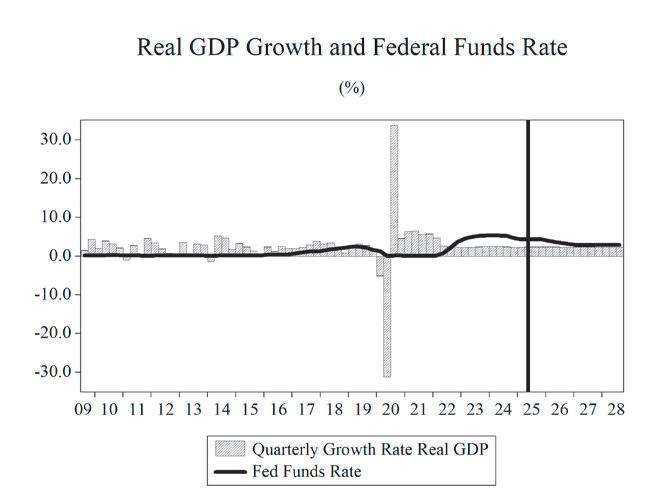
The Fed’s overly aggressive monetary stimulus led to inflation. The Fed rapidly reduced the federal funds rate to near zero in March 2020 and engaged in a massive quantitative easing (QE) program, purchasing $120 billion per month in Treasury and mortgage-backed securities, flooding the economy with liquidity. This policy mirrored that of the 2008 financial crisis, a very different economic situation that warranted this type of policy. This monetary stimulus, combined with government spending fiscal measures, was excessive relative to the short-lived economic contraction (real GDP growth in the 3rd quarter of 2020 was 35.2%) and ultimately this led to

inflation rates reaching a 40-year high by 2022. The Fed also mistakenly claimed that inflation would be transitory and underestimated its persistence.

The Fed was slow to react to rising inflation, despite early signs of inflation in 2021. The median FOMC projection in January 2021 anticipated no rate hikes until at least 2023, and this lag forced the Fed to implement aggressive rate hikes later.

I also think that the Fed was overly focused on stimulating aggregate demand without accounting for the supply side impacts of the pandemic response. The massive stimulus to demand ran headlong into the supply chain disruptions as well as the challenges of the very tight labor market post lock-downs.

The Fed’s zero interest rates and quantitative easing contributed to a surge in asset prices, including stock, bond markets and the housing market. Financial markets roared past pre-pandemic highs in a matter of months. This occurred even as lending standards continued to tighten for businesses and less qualified households.

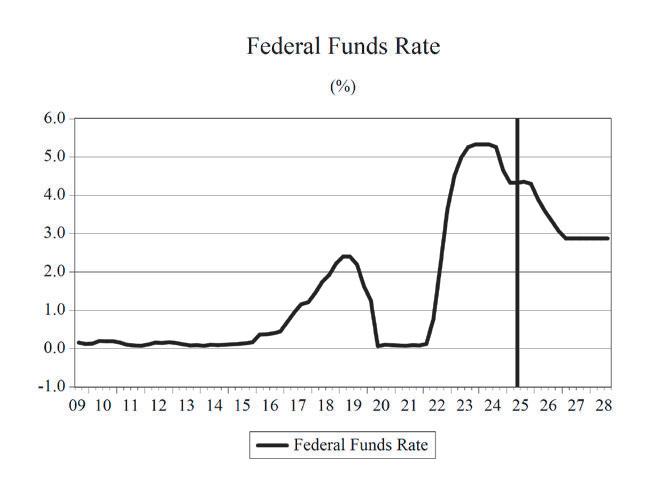
The decision to begin to cut interest rates in September, while inflation was still far from the

Fed’s target, fueled market backlash. There was an excessive amount of cherry picking of the economic data to try and paint a picture of an economy on the brink of recession, that one year later has yet to materialize. Markets did not respond well to the 100 basis points that were cut from the federal funds rate; in fact, longer-term interest rates such as the 10-year bond and 30-year mortgage rate increased by nearly as much as the fed funds rate was cut.

ANXIOUS INDEX

Recession Fear Eases a Bit

The most recent release (3rd quarter of 2025) of the Survey of Professional Forecasters by the Federal Reserve Bank of Philadelphia states that the forecasters surveyed for the publication put a 29.6% chance that a decline in real GDP will occur in the 4th quarter of 2025. This is a lower reading of the anxious index after a tariff-inspired spike in anxiety last quarter.

One section of the Survey of Professional Forecasters asked panelists to estimate the probability that real GDP will decline in the quarter in which the survey is taken, as well as the probability of a decline in each of the following four quarters. The Anxious Index is the estimated probability of a decline in real GDP in the quarter after a survey is conducted. In the survey taken in August for the 3rd quarter of 2025, the index stands at 29.6, meaning forecasters believe there is a 29.6% chance that real GDP will decline in the 4th quarter of 2025. This is down from 36.1% in the survey conducted in the 2nd quarter of 2025.

The Figure 1 plots the historical values of the anxious Figure 1.

index, where the gray bars indicate periods of recession in the U.S. economy. The current level of the Anxious Index is slightly more than 16.0 points higher than the average level during the 2009-2020 economic recovery (13.63).

GDP OUTLOOK

The slowing growth we are projecting for federal government spending is going to have an impact on overall real GDP growth for the next several years. There has been a high level of uncertainty in the economy with the frenetic pace of activity in the early months of the Trump administration. As the dust settles and markets discern the new rules of the game, uncertainty will ease, and with it the dampening effect on economic growth will fade.

Persistent large deficits at the federal level continued to fuel economic growth through the end of 2024. The size of these deficits is set to decline to a lower level in 2025 before drifting higher again through 2028.

The eventual end of trade related uncertainty and business friendlier policies from D.C. should continue the economic expansion through the end of our forecast horizon, albeit with slower economic growth as consumers are tapping the brakes and working at repairing their inflation-damaged balance sheets.

The slowing growth in 2025 and beyond will impact the labor market. The unemployment rate will gradually rise into 2026, before stabilizing well below 5%. Job growth will slow to a trickle but should not turn negative as the economy essentially remains at full employment.

There will be another recession, but the chance that it could be borne of the uncertainty happening in the nation’s capital has diminished in recent months. We are not predicting that it will come to pass in the next several years. In the meantime, we are anticipating a softening of real GDP growth slowing from 2.8% in 2024 to 1.8% in 2025 before rising to 2.6% in 2026 and then drifting down to 1.6% in 2028.

CONSUMER SPENDING

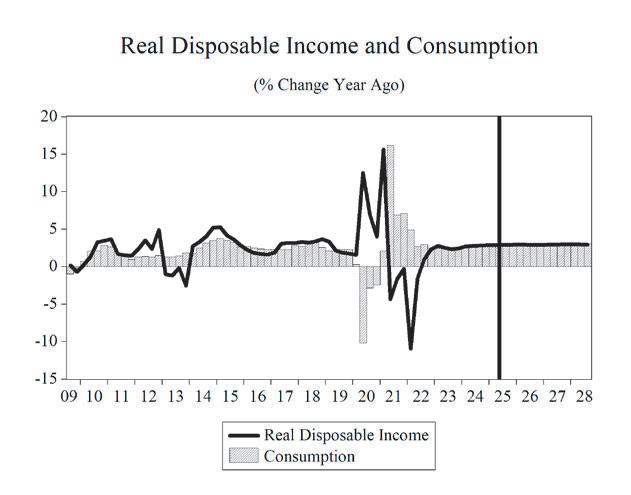
U.S. consumers were hit hard by high inflation for more than two years, and despite wage and salary growth, the rising cost of living eroded all those wage gains and even more purchasing power beyond that. Starting in the second quarter of 2021, real median weekly wage and salary growth had been negative. This means that even though workers had more dollars in their paychecks, the amount of goods and services that they could purchase with these dollars declined for more than two years. This declining purchasing power set the stage for a slowing economy and raised the possibility of a recession.

The holes in consumers’ budgets were patched by savings from the COVID era and the use of credit card debt. However, these patches to consumers’ budgets were not a solution to the loss of purchasing power and could only hold for so long before spending is impacted.

Inflation hit middle- and lower-income households hard. Roughly 63% of consumer expenditure goes to food, shelter, and transportation; all three of these categories saw outsized price increases over this twoyear span.

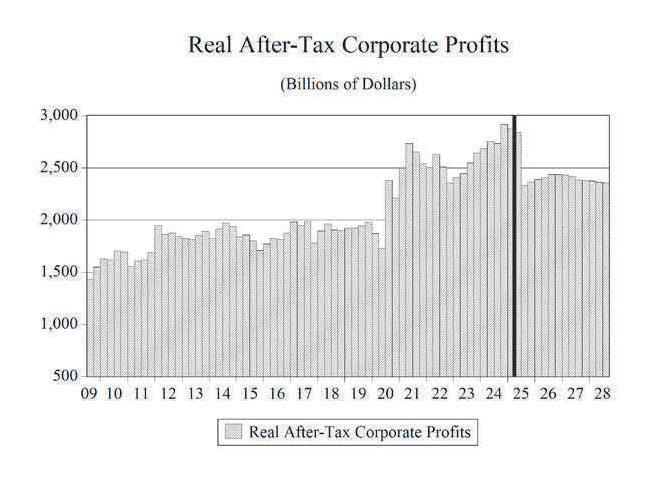
Over the most recent two years, thanks to a still strong labor market and retreating inflation, growth in real wages has turned positive. This is enabling consumers to make more permanent repairs to damaged household budgets.

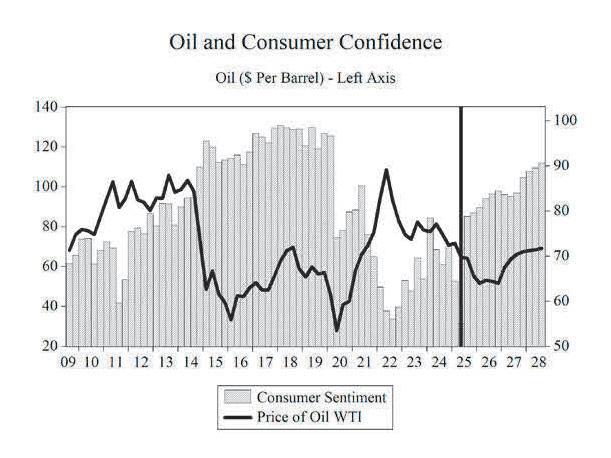
Credit card delinquency rates were rising for more than two years as households struggled to make ends meet. In the second half of 2024, these delinquency rates declined thanks to rising real wages. However, overall credit card debt remains above $1.1 trillion, and this will continue to constrain consumer spending growth over the next few years.

Consumer sentiment has been on an upward, but somewhat volatile path since hitting an all-time low at the height of the inflation crisis. Seeing paychecks start to go further has played a role in regaining confidence in households’ financial status, despite the doom and gloom predictions that were a feature of the early months of the Trump administration.

COVID-19 public health policies caused spending growth in 2020 to contract by 2.5%. Consumption spending growth slowed from 8.8% in 2021 to 3.0% in 2022, and then to 2.5% in 2023, before ticking up to 2.8% in 2024. During 2025-2028, real consumer spending growth is expected to average 2.1%. Consumer spending growth will be dampened by the economic slowdown in 2025 and 2026 after hitting 2.7% in 2024, before rising to 2.4% in 2028.
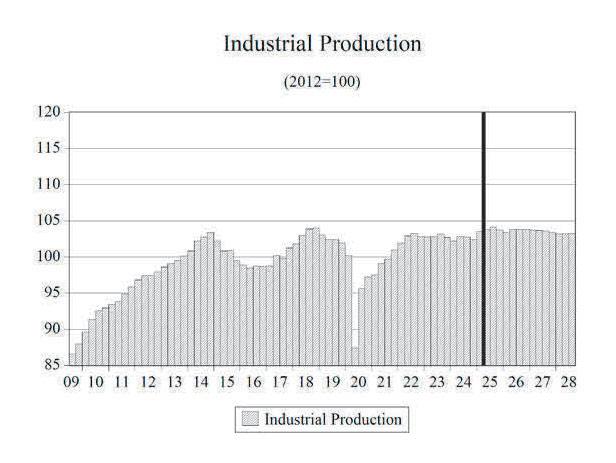
INVESTMENT

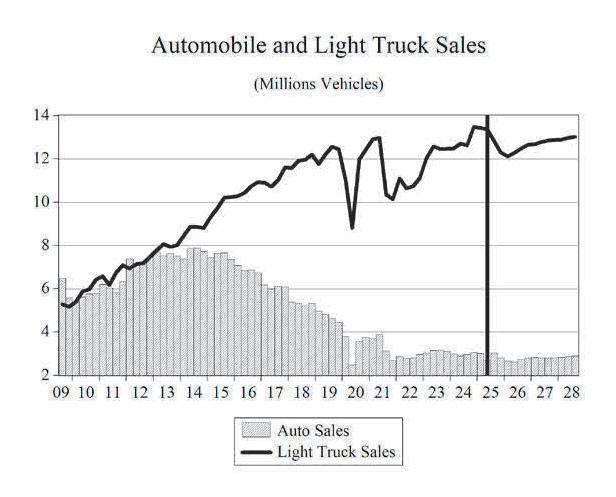
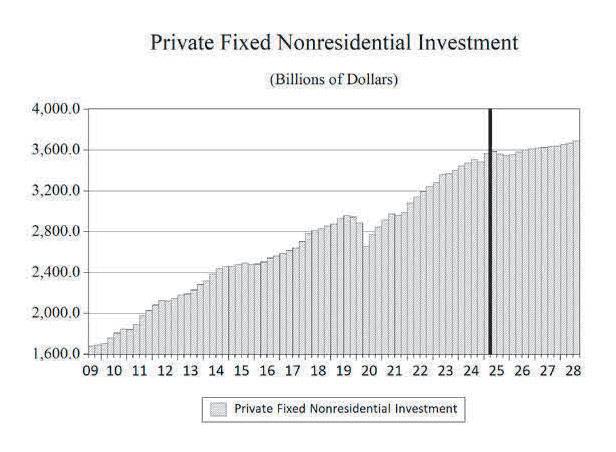
Higher interest rates and increasing levels of policy uncertainty combined to slow investment spending in 2024, which will likely decelerate through 2026, before rising in the final two years of our forecast. Businesses will continue to try and figure out what tariffs, spending cuts, and regulatory changes are going to be implemented and more importantly, how long such changes might remain in place. As uncertainty surrounding these issues fades, investment spending growth will respond.

In 2020, nonresidential investment spending contracted by 4.6%, then rebounded to 6.0% growth in 2021 and 7.0% growth in 2022, easing to 6.0% in 2023 and 3.6% in 2024. During 2025-2028, we expect average growth in nonresidential investment spending to be just 1.4%, decelerating from 3.6% in 2024 to 0.6% in 2026 before rebounding to 1.4% in 2028.

Spending growth on equipment and software held steady in 2023 and 2024 at 3.5% and 3.4%. Average growth in this type of investment spending is expected to be 2.6% over the 2025-2028 timeframe, after slipping to 0.6% in 2026.

In 2022 as air travel continued to grow in the post-lockdown era, aircraft purchases grew by 5.4% that year and surged to 28.9% in 2023. Over the 2025-2028 period, aircraft purchases are expected to grow by an average of 5.2%. This deceleration of growth comes after a two-year period where growth averaged 23.1% in 2023-2024.

Lower oil prices over the past quarter and the green focused policy from the Biden administration have pushed the current U.S. rig count to 536, which is 47 rigs fewer than a year ago. Rig counts were over 1,000 as recently as 2019. Friendlier policy and resumption of transportation projects from the Trump administration should help that number in the next couple of years.

Investment in mining and petroleum equipment growth plunged to -38.4% in 2020. Investment will average a 5.6% growth per year during 2025-2028, including a surge to 20.1% in 2026 as regulatory restraints are eased.

Business nonresidential structures investment growth contracted by 9.2% in 2020, 2.6% in 2021, and then accelerated to 3.6% in 2022. After growing 10.8% in 2023 and 3.5% in 2024, non-residential structures spending will grow at an average rate of -1.7% during 2025-2028. Higher borrowing costs and tighter credit conditions in the wake of the Silicon Valley Bank failure will be a persistent headwind for commercial real estate investment spending.

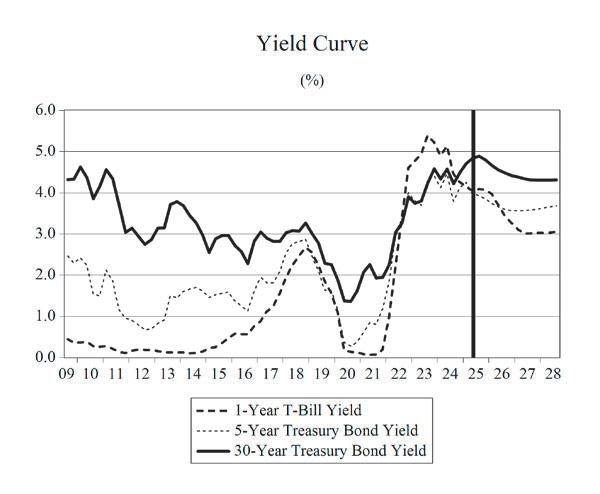
The Federal Reserve cut short-term interest rates to near zero and kept them there for nearly two years in response to the pandemic. Interest rates on U.S. Treasury bonds fell to historic lows and have since gone up. Higher interest rates slow investment spending. The Fed temporarily switched gears to go into recession-fighting mode, prematurely cutting short-term rates in September, which in turn caused long-term rates to rise in response to these cuts. With inflation close to the target level, the Fed is expected to resume interest rate cuts this fall, which should push longer-term rates lower.

Business spending on industrial equipment will grow at an annual average rate of 3.9% from 20252028, perhaps boosted from spending for reshoring production in the face of tariffs. Investment spending growth on computers and peripherals will average 5.4% during 2025-2028 with 30.4% growth in 2025 as the rush into artificial intelligence steams on.

Spending on communications equipment should expand at an average annual rate of 1.4% during the same period, with spending in 2025 expanding at a 10.4% rate.

Residential fixed investment growth hit 10.9% in 2021. Growth will average just 0.7% during 2025-2028, as higher prices combined with higher mortgage rates have eroded demand and caused investment spending to contract by 8.6% in 2022 and 8.3% in 2023 before growing 4.2% in 2024.

We expect housing starts to stabilize after a slow deceleration that commenced in 2023 and continued through 2024. After reaching 1.6 million in 2021, starts fell to 1.37 million in 2024. They will continue to hover in a narrow range for the next four years, coming in at a level slightly more than 1.34 million in 2028. High home prices and a slowing economy are headwinds. The expected decline in mortgage rates, anticipated when the Federal Reserve initially loosened monetary policy, did not materialize as long-term interest rates moved in the opposite direction, but cuts this fall should cause mortgage rates to drift lower.. The ongoing shortage of housing in many parts of the country will help fight against these headwinds and provide support for home building, albeit at this slightly lower pace.

GOVERNMENT SPENDING

DOGE We Hardly Knew You

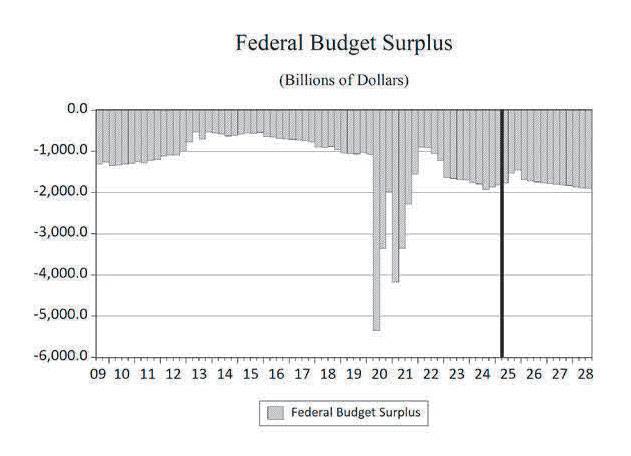
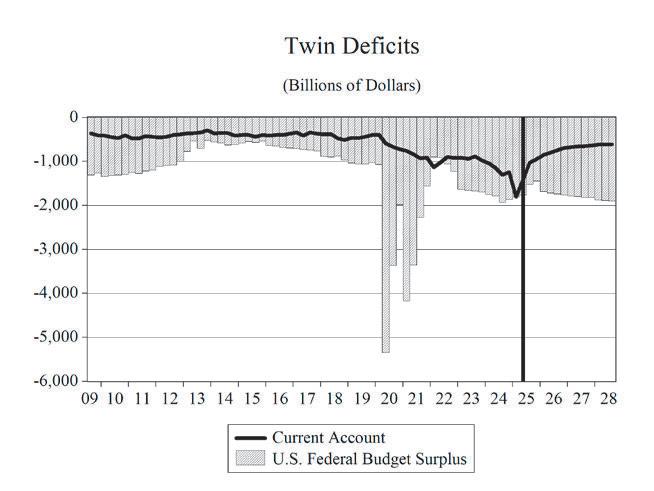
Government budget management has devolved into a series of continuing resolutions, COVID-19 stimulus packages, and spending made under the umbrella of a pandemic emergency declaration. Federal government spending has been devoid of any policy discussions or debates about priorities, problems, objectives, or any consideration of deficits and the national debt, let alone talk of a balanced budget for far too long. Unsurprisingly, public finances have been adrift, and deficits climbed back to the $1 trillion mark in 2019, even before the massive wave of deficit spending triggered by the pandemic and the current deficit is in excess of $2 trillion.

The pandemic ended, but the spending spree in Washington, DC continued unabated. The vote to suspend the debt ceiling in June of 2023 removed the last restraint on our elected prodigals, and prior to DOGE, $1.0 trillion was added to the national debt every 100 days. The interest payments on this national debt are now more than $1 trillion every year.

Can the cuts made by the Department of Government Efficiency (DOGE) curb this profligate and unchecked spending? I am still not convinced that it will be able to rein in a bureaucracy entrenched by decades of the same modus operandi. DOGE has been making cuts and according to the US debt clock website in the footnote below, there has been more than $620 billion in cuts made via this process. That’s a lot of money, but when deficits are over two trillion dollars, it also shows how much heavy lifting still must be done, assuming these cuts come to fruition.

Federal government spending growth was 3.8% in 2019 before jumping to 6.3% in 2020. During the 2025-2028 period, federal government spending growth will continue, growing at an annual average pace of 0.5%. Over the same period, state and local governments will see spending growth at an average rate of 0.6%.

I am not yet convinced that Congress will undertake the required cuts to the deficit, and the One Big, Beautiful Bill turned law suggests further delay in addressing this issue. Thus, we are still projecting deficits through 2028 that will consistently average nearly $2.0 trillion. The amount that the projected deficits will add to the national debt over the next four years will be $7.0 trillion, pushing the total national debt to more than $44 trillion and a debt-to-GDP ratio of approximately 127%. If higher interest rates return to the economy, the burden of servicing this debt will continue to rise as well. Slower-than-projected economic growth or a recession would also push projected deficits higher, though the possibility of faster-than-projected economic growth and interest rate cuts could help mitigate the growth of these deficits on the debt-toGDP ratio.

Currently, the national debt is over $37.3 trillion and rising. This represents a debt of more than $323,054 per taxpayer and $108,707 per citizen. The unfunded liabilities of the U.S. are even more troubling. These include Social Security, Medicare Parts A, B, and D, and Federal debt held by the public and federal employee and veteran benefits, representing more than $123.3 trillion in liabilities, boiling down to more than $356,191 per person.1

NET EXPORTS

Uncertainty regarding tariffs to be levied against U.S. trading partners continues to rile the international sector of the U.S. economy.

A country’s use of tariffs has historically been to protect a domestic industry from international competition. The Trump administration is primarily using tariffs as a lever to get other countries to make changes that benefit of the United States, as we saw with the 25% tariffs on Colombia that lasted for four hours. The administration has also been using tariffs to bring about changes to other barriers to trade.

A longer-run goal appears to be incentivizing U.S. firms to onshore production that was previously moved overseas. It is not clear how successful these efforts will ultimately be, particularly with the possibility that these tariffs may not be in place in the longer term—this is a more general problem of governing via executive order instead of by legislation. However, to date there has been *some* anecdotal evidence of success on this front.

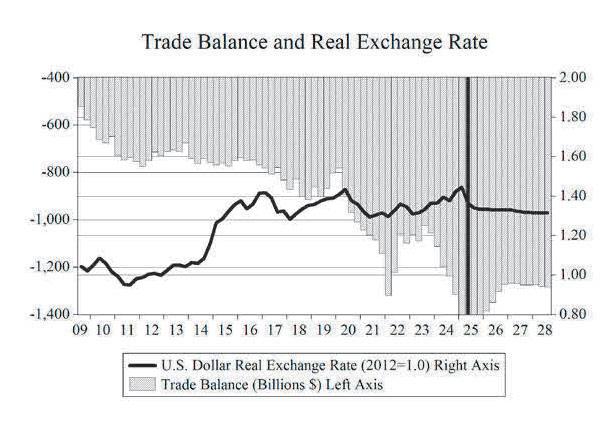
A stronger dollar boosts imports and reduces exports by making our goods and services more expensive to foreigners, while at the same time making imported goods and services less expensive to U.S. consumers. This results in a worsening of the trade deficit, which is the difference between the dollar value of exports and the dollar value of imports. The opposite is true when the dollar undergoes depreciation.

However, the effects of currency changes take time to work on the actual quantity of trade flows, resulting in what is known as the J-curve effect on net exports. Because of this effect, an appreciation (depreciation) of the dollar initially decreases (increases) the trade deficit before eventually increasing (decreasing) it. Why? Importers and exporters do not enter contracts based on the total dollar value of the transaction, but rather on the actual quantity of goods to be shipped (automobiles, flat-screen televisions, etc.). As the exchange rate varies in the short run, the values of these shipments and, thus, net exports vary as well. Over time, however, the quantities do adjust in response to the exchange rate fluctuations, and this is what gives rise to the J-curve effect.

With the Federal Reserve resuming the interest rate cuts, that began last September, lower interest rates will lead to a depreciation of the dollar beginning in 2025 and persisting through 2028.

Overall, real export growth has resumed, after a sharp contraction in 2020, and will continue through the end of our forecast horizon after accelerating sharply in 2021 and 2022. The appreciation of the dollar in 2022 caused a deceleration of this growth in 2023 and 2024. Real import growth also experienced a strong contraction in 2020, but growth recovered before contracting again in 2023. Import growth resumed in 2024 and will continue until turning negative in 2026. Evolving trade policy issues, a slowing economy, increasing geopolitical uncertainty notwithstanding, real export growth from 20252028 will average 2.9%, while real import growth will average 1.7% over the same period.

Real net exports will average over -$1.31 trillion during 2025-2028, with the trade balance improving somewhat in 2026 and 2027 in response to imposition of new tariffs this year before worsening to -$1.32 trillion in 2028.

UNEMPLOYMENT

The national unemployment rate (U-3) in July 2025 stood at 4.2%, down 10.6 percentage points from the April 2020 reading of 14.8%, which was the highest level since the Great Depression. The labor force participation rate ticked down to 62.2% from the May 2025 rate of 62.4%. The labor force participation rate is still below pre-pandemic levels of 63.3%.

The Bureau of Labor Statistics (BLS) produces alternative measures of labor market weakness, including the broadest measure of unemployment (U6). U-6 accounts for discouraged workers (currently 425,000 workers), underemployed workers—working part-time but not by choice—(currently 4.68 million workers), and workers who are marginally attached to the labor force—those who have looked for work in the past 12 months, but are not currently looking, yet indicate a willingness to work (1.69 million workers). None of these, nearly 6.8 million workers, are accounted for in the May headline unemployment rate of 4.2%.

U-6 stands at 7.9% as of July 2025, up 0.1 points from the July 2024 level, and up 1.2 percentage points from the start of 2023. The current level of U-6 is close to its level in November 2021. U-6 was stuck in double digits for more than seven years. It had been in single digits for fifty-one consecutive months, beginning in December 2015, before surging during the lockdowns in April and May of 2020, hitting 22.9% in April.

The spread between U-6 and U-3 measures of unemployment sits at 3.7 percentage points and is 3.7 points below the peak spread of 7.4 points that took place in September 2011.

Table 1. Summary of the Long-Term Forecast of the U.S.

Composition of Real GDP, Percent Change

2019202020212022202320242025202620272028

GrossDomesticProduct2.6-2.26.12.52.92.81.82.61.71.6

FinalSalesofDomesticProduct2.5-1.75.81.93.32.71.62.31.81.6

TotalConsumption2.1-2.58.83.02.52.82.11.92.12.4

Durables3.37.116.6-1.93.93.33.33.86.16.2

Nondurables3.03.48.60.10.81.92.21.21.01.4

Services1.7-5.87.55.02.92.91.81.81.72.1

NonresidentialFixedInvestment3.8-4.66.07.06.03.62.60.61.21.4

Equipment&Software1.0-10.16.74.43.53.45.30.62.62.0

InformationProcessingEquipment2.90.810.77.3-4.35.315.2-3.0-0.8-0.6 Computers&Peripherals1.28.614.66.1-7.118.030.4-3.5-3.0-2.2 CommunicationsEquipment3.1-0.311.512.5-3.7-1.510.4-6.71.40.6 IndustrialEquipment1.8-8.96.73.10.81.83.14.84.82.8 TransportationEquipment-3.4-28.2-3.07.139.98.72.55.84.34.8 Aircraft-49.041.3-12.45.428.917.221.7-6.73.12.5 OtherEquipment3.2-28.914.011.75.3-7.4-9.22.8-1.3-3.9 Structures2.3-9.2-2.63.610.83.5-3.6-2.6-1.20.8

Commercial&HealthCare1.53.2-3.6-2.9-0.1-5.2-4.25.06.44.0 Manufacturing5.6-9.53.324.245.020.4-3.6-19.8-18.4-12.4 Power&Communication8.0-1.4-4.7-6.93.67.00.8-8.2-6.28.5

Mining&Petroleum-0.3-38.418.221.64.9-6.0-8.720.112.1-1.0

Other-0.8-10.7-11.92.411.91.3-3.80.80.21.8

ResidentialFixedInvestment-0.97.710.9-8.6-8.34.2-2.30.32.72.0

Exports0.5-13.16.57.52.83.30.93.24.23.3 Imports1.2-9.014.78.6-1.25.32.6-3.12.74.5 FederalGovernment3.86.31.8-3.22.92.60.42.00.4-0.8 State&LocalGovernment3.91.7-1.60.24.43.92.10.30.1-0.1

Billions of Dollars

RealGDP19302.018884.520028.020531.221124.021714

.722109.322674.523064.923423.7 NominalGDP21540.021354.123681.226006.927720.729184.930592.132292.433603.034943.3

Prices & Wages, Percent Change, Annual Rate GDPDeflator1.71.34.57.13.62.42.92.92.32.4 ConsumerPrices1.81.34.78.04.13.02.82.72.62.3 Excl.Food&Energy2.21.73.66.24.83.43.13.02.32.4 ProducerPrices,FinishedGoods0.8-1.38.913.41.61.21.81.12.22.1 EmploymentCostIndex-TotalComp.2.72.63.65.14.43.83.54.24.44.5

Other Measures

Oil-WTI($perbarrel)57.039.268.094.877.676.564.052.364.269.0

Productivity(%change)2.15.32.0-1.51.92.70.92.21.71.7 IndustrialProduction(%change)-0.7-7.14.43.40.2-0.31.2-0.1-0.1-0.3

FactoryOperatingRate77.272.777.279.478.276.876.876.375.374.2 NonfarmInven.Chg.(Bil.of2012$)89.3-19.214.0131.636.538.275.7134.0116.395.1 ConsumerSentimentIndex96.081.577.659.065.472.569.582.984.690.1 LightVehicleSales(Millionunits)17.014.514.913.815.515.815.915.115.615.9 HousingStarts(Millionunits)1.31.41.61.61.41.41.31.31.31.3 ExistingHouseSales(Millionunits)4.75.15.44.53.73.73.64.04.44.5 UnemploymentRate(%)3.78.15.43.63.64.04.24.34.34.3 PayrollEmployment(%change)1.4-5.82.94.32.21.31.00.70.50.2 FederalSurplus(Unified,FY,bil.$)-1043.8-2940.8-2838.8-1020.3-1666.4-1833.4-1636.0-1726.7-1805.1-1876.1 CurrentAccountBalance(Bil.$)-442.0-593.5-858.6-993.1-928.0-1185.3-1301.8-772.9-655.6-612.2

Financial Markets, NSA

FederalFundsRate(%)2.20.40.11.75.05.14.33.52.92.9 3-MonthTreasuryBillRate(%)2.10.40.02.05.15.04.23.32.72.7 1-YearTreasuryNoteYield(%)2.10.40.12.85.14.74.13.63.03.0 5-YearTreasuryNoteYield(%)2.00.50.93.04.14.14.03.63.63.7 10-YearTreasuryNoteYield(%)2.10.91.43.04.04.24.44.03.93.9 25-YearTreasuryNoteYield(%)2.61.62.13.14.14.44.84.54.34.3

30-YearFixedMortgageRate(%)4.13.23.05.46.86.76.76.25.95.8 S&P500StockIndex2912.53218.54266.84100.74284.25426.76083.86164.75891.15856.3 (Percentchange)6.110.532.6-3.94.526.712.11.3-4.4-0.6 ExchangeRate,MajorTradingPartners1.31.21.21.31.31.31.31.21.21.2 (Percentchange(negative=depreciation))3.5-1.1-4.110.10.30.9-2.7-4.1-1.6-1.0 Incomes

PersonalIncome(Bil.of$)18363.219620.121419.522088.923402.524669.325892.527364.928830.530192.9 (Percentchange)4.86.89.23.15.95.45.05.75.44.7 DisposableIncome(Bil.of$)16164.517374.818714.418844.020546.821633.622624.324085.725311.526519.9 (Percentchange)4.67.57.70.79.05.34.66.55.14.8 RealDisposableIncome(Bil.Of2012$)14762.715697.616244.815340.416119.716559.116824.617401.317898.818362.4 (Percentchange)3.16.33.5-5.65.12.71.63.42.92.6 SavingRate(%)7.315.211.13.04.74.64.25.76.46.6 After-TaxProfits(Billionsof$)2078.32211.72888.12950.63068.83440.63319.53187.53225.63227.5 (Percentchange)2.96.430.62.24.012.1-3.5-4.01.20.1

Real GDP Billions 2012 $

GrossDomesticProduct19302.018884.520028.020531.221124.021714.722109.322674.523064.923423.7

FinalSalesofDomesticProduct19212.618887.519981.020364.921040.321618.721974.622484.122891.023268.3

TotalConsumption13185.712851.613979.014403.414767.815175.215488.815784.016110.416500.4

Durables1740.61863.62173.22131.32214.32287.32363.62452.22602.92763.4

Nondurables3038.23141.83411.13415.13441.93507.33585.53629.63667.53719.5

Services8459.47971.18568.58993.29250.59522.39695.49870.910040.810253.8

NonresidentialFixedInvestment2926.52791.02959.23165.13355.13476.13566.43587.63630.13679.7

Equipment&Software1279.51150.11227.01280.51324.91369.41441.51449.91487.11517.0

InformationProcessingEquipment518.4522.8578.6620.7594.1625.6720.7699.2693.6689.7 Computers&Peripherals123.9134.6154.3163.6152.1179.4234.0225.8218.9214.0

CommunicationsEquipment240.1239.4266.8300.1289.1284.8314.3293.1297.2299.0

IndustrialEquipment250.5228.3243.5251.1253.3257.7265.7278.4291.9300.0

TransportationEquipment308.4221.3214.7229.9321.7349.5358.4379.2395.5414.6 Aircraft25.936.732.133.843.651.162.258.159.861.4

OtherEquipment75.353.561.068.171.766.560.462.161.358.9

Structures580.9527.7513.8532.5590.2610.7588.7573.2566.4570.8

Commercial&Health168.7174.1167.9163.0162.9154.4147.9155.3165.2171.8

Manufacturing65.559.361.276.0110.2132.6127.9102.683.873.4

Power&Communication129.5127.8121.7113.3117.4125.6126.7116.3109.1118.4

Mining&Petroleum111.168.480.998.3103.297.088.5106.3119.1117.9 Other112.1100.188.290.3101.1102.598.699.499.6101.4

ResidentialFixedInvestment617.0664.3736.6673.6617.8643.9629.0630.7647.7660.6 Exports2575.72237.52382.52561.52632.32718.42743.32832.32951.73050.5 Imports3467.23155.93618.93929.93883.84089.94196.74066.84176.34365.9 FederalGovernment1289.31370.11395.21350.01389.61425.31430.61459.01464.21452.9 State&LocalGovernment2073.92108.22075.52079.12171.12256.12303.22309.92312.72311.4

2025Q12025Q22025Q32025Q42026Q12026Q22026Q32026Q42027Q12027Q22027Q32027Q42028Q12028Q22028Q32028Q4

Composition of Real GDP, Percent Change, Annual Rate

GrossDomesticProduct-0.53.01.92.03.03.12.41.71.51.31.41.51.61.61.71.6

FinalSalesofDomesticProduct-3.16.30.21.62.82.62.41.81.71.61.51.61.71.71.71.6

TotalConsumption0.51.41.91.02.52.22.01.82.02.22.32.42.52.52.52.4

Durables-3.73.72.9-3.76.56.16.15.86.76.05.96.16.26.46.36.0

Nondurables2.11.31.11.01.61.31.00.90.81.11.31.41.51.51.51.4

Services0.61.12.01.72.11.81.61.51.61.92.02.12.22.22.22.1

NonresidentialFixedInvestment10.31.9-2.7-1.20.63.02.21.20.80.60.81.11.51.61.81.9

Equipment&Software23.74.8-7.8-3.30.66.04.32.72.21.71.61.52.12.32.42.6

InformationProcessingEquipment72.95.4-9.7-5.8-4.51.3-0.1-0.9-0.7-1.3-1.6-1.2-0.60.00.41.1

Computers&Peripherals122.450.3-11.2-10.0-6.8-1.7-2.3-3.4-2.8-3.4-3.9-2.9-1.9-1.6-1.4-0.5

CommunicationsEquipment106.7-35.92.0-10.2-11.01.02.12.41.41.00.70.20.00.81.31.8

IndustrialEquipment4.74.54.64.71.87.96.35.34.74.33.33.12.92.32.21.3

Transportationequipment4.414.7-17.9-5.120.013.67.85.52.30.75.03.15.05.95.97.6

Aircraft68.7114.3-67.21.87.91.61.62.83.93.24.22.12.42.32.61.3

OtherEquipment-19.00.16.9-9.45.98.85.81.3-4.3-3.9-4.6-5.5-4.7-2.7-2.30.0

Structures-2.4-10.3-5.2-4.7-0.8-0.4-0.4-1.3-2.0-1.7-0.70.71.11.51.71.5

Commercial&HealthCare-3.4-7.4-11.011.88.65.48.211.57.91.72.26.13.83.84.04.2

Manufacturing-5.2-5.5-3.9-29.3-23.7-18.4-18.1-23.7-21.8-13.3-11.0-15.2-13.8-8.3-14.1-6.9

Power&Communication8.1-5.3-1.5-25.8-1.7-4.6-6.2-4.9-9.2-15.4-0.422.712.80.513.712.0

Mining&Petroleum-1.3-35.60.937.735.228.317.412.313.516.73.5-11.3-3.78.11.4-12.1 Other-6.6-9.1-4.212.6-1.80.41.0-1.3-1.43.50.5-0.63.71.81.24.2 ResidentialFixedInvestment-1.3-4.6-9.8-2.04.03.83.23.02.72.51.62.01.92.02.21.9 Exports0.4-1.8-1.32.23.95.76.83.74.43.33.33.33.92.93.23.1

Imports38.0-30.30.8-4.0-2.71.41.51.62.63.74.14.34.74.94.74.8 FederalGovernment-4.6-3.7-0.95.62.82.21.60.40.30.0-0.5-1.1-1.2-0.6-0.6-0.2

State&LocalGovernment2.03.00.20.6-0.30.10.10.20.10.10.10.00.0-0.1-0.2-0.4

Billions of Dollars

RealGDP21908.222069.022173.822286.322452.522625.222762.422857.922945.923022.823103.023187.823280.823374.823473.323565.9 NominalGDP29962.030331.130827.331248.031717.532124.232495.232832.733136.733449.033746.334080.134435.834772.335111.735453.5

Prices & Wages, Percent Change, Annual Rate

GDPDeflator3.82.04.73.53.02.12.22.52.22.42.22.52.62.32.22.3

ConsumerPrices3.81.63.52.92.72.52.32.23.22.72.22.42.42.32.12.3

Excl.Food&Energy3.52.13.93.53.12.42.42.42.02.32.42.42.42.32.32.4

ProducerPrices,FinishedGoods4.2-2.54.01.61.7-0.80.91.33.23.62.12.32.31.51.41.5

EmploymentCostIndex-TotalComp.3.43.93.53.45.14.34.04.14.34.54.74.74.44.44.34.2

Other Key Measures

Oil-WTI($perbarrel)71.864.664.255.451.653.352.651.759.663.666.267.568.168.569.270.0

Productivity(%change)-1.81.21.81.62.62.82.31.51.51.41.61.71.81.81.71.6

IndustrialProduction(%change)4.31.11.2-1.6-1.21.7-0.10.1-0.4-0.2-0.3-0.8-0.60.20.01.0

FactoryOperatingRate76.676.877.176.776.576.476.376.175.875.475.174.774.574.274.174.0

NonfarmInven.Chg.(Bil.of2012$)164.7-30.970.598.4108.6139.8146.0141.8131.5119.4110.9103.498.595.594.092.2

ConsumerSentimentIndex64.555.078.879.680.882.883.784.483.783.284.187.488.789.590.691.4 LightVehicleSales(Millionunits)16.416.115.915.114.814.915.215.415.515.615.715.715.715.915.916.0 HousingStarts(Millionunits)1.41.31.31.31.31.31.31.31.31.31.31.31.31.31.31.3 ExistingHouseSales(Millionunits)3.73.63.63.63.84.04.14.24.34.44.44.44.44.54.54.5 UnemploymentRate(%)4.14.24.24.34.34.34.34.34.34.34.34.44.44.34.34.3

PayrollEmployment(%change)1.30.70.70.40.80.70.70.60.50.40.20.10.20.20.30.3

FederalSurplus(NIPABil.$)-1811.0-1765.8-1521.3-1446.1-1683.5-1717.3-1741.3-1764.6-1783.4-1795.9-1816.5-1824.5-1871.8-1885.2-1900.5-1847.2

CurrentAccountBalance(Bil.$)-1800.7-1429.6-1027.5-949.3-849.2-801.9-742.6-697.9-674.5-659.1-650.9-637.9-620.0-616.1-608.7-604.1

Financial Markets, NSA

FederalFundsRate(%)4.34.34.44.33.93.63.33.12.92.92.92.92.92.92.93.1 3-MonthTreasuryBillRate(%)4.24.24.34.23.83.43.22.92.72.72.62.62.62.62.62.8 1-YearTreasuryNoteYield(%)4.14.04.14.14.03.73.53.33.13.03.03.03.03.03.03.1

5-YearTreasuryNoteYield(%)4.34.03.93.83.73.73.63.63.63.63.63.63.63.73.73.7 10-YearTreasuryNoteYield(%)4.54.44.44.34.14.04.03.93.93.93.93.93.93.93.93.9 25-YearTreasuryNoteYield(%)4.74.84.94.84.74.64.54.44.44.34.34.34.34.34.34.3 30-YearFixedMortgageRate(%)6.86.86.76.66.46.26.16.06.05.95.95.95.85.85.85.8 S&P500StockIndex5900.75736.86322.76374.96311.16213.56111.66022.55943.85894.55868.75857.55858.35854.85854.35858.0 (Percentchange)-0.7-10.747.53.3-3.9-6.0-6.4-5.7-5.1-3.3-1.7-0.80.1-0.20.00.3 ExchangeRate,MajorTradingPartners1.41.31.31.21.21.21.21.21.21.21.21.21.21.21.21.2 (Percentchange(negative=depreciation))6.6-21.2-7.7-2.5-1.3-3.1-1.3-0.8-1.2-2.4-2.2-1.2-1.3-0.70.50.3 Incomes

PersonalIncome(Bil.of$)25450.125780.126028.426311.626816.727194.527539.227909.128319.528671.329003.829327.429701.830035.230355.630679.1 (Percentchange)6.75.33.94.47.95.85.25.56.05.14.74.55.24.64.34.3 DisposableIncome(Bil.of$)22257.722535.922727.222976.523608.623937.024237.224560.224864.925170.325462.425748.426084.326379.126664.026952.1 (Percentchange)6.25.13.44.511.55.75.15.45.15.04.74.65.34.64.44.4

RealDisposableIncome(Bil.Of2012$)16752.416874.716824.416847.117194.417339.517465.917605.217725.717845.417960.718063.418200.518311.118418.118519.8 (Percentchange)2.53.0-1.20.58.53.42.93.22.82.72.62.33.12.52.42.2 SavingRate(%)4.34.74.03.95.35.55.86.16.36.46.56.56.66.66.66.5 After-TaxProfits(Billionsof$)3602.63574.33017.53083.63137.33168.33215.73228.83238.63237.63211.13215.13224.23216.93225.53243.5 (Percentchange)-3.1-3.1-49.29.17.24.06.11.61.2-0.1-3.20.51.1-0.91.12.3

Real GDP Billions 2012 $

Table 4. Quarterly Gross Domestic Product

2025Q12025Q22025Q32025Q42026Q12026Q22026Q32026Q42027Q12027Q22027Q32027Q42028Q12028Q22028Q32028Q4

GrossDomesticProduct21908.222069.022173.822286.322452.522625.222762.422857.922945.923022.823103.023187.823280.823374.823473.323565.9

FinalSalesofDomesticProduct21696.422030.222042.422129.322284.822429.422561.322661.022758.522846.222934.023025.423122.623219.123318.723412.7

TotalConsumption15401.315456.515530.315567.115663.415749.015825.415898.015976.516062.116153.716249.116348.416451.016552.316649.8

Durables2344.42366.12383.02360.92398.52434.22470.52505.72546.52583.72621.22660.22700.32742.52784.92825.8

Nondurables3569.63581.33590.83600.13614.13625.93634.93643.23650.73660.93673.03685.63698.93713.03726.63739.6

Services9640.89667.79716.29757.09808.69853.69892.39929.09968.210014.310064.210116.410171.010226.910282.010335.3

NonresidentialFixedInvestment3568.63585.73561.23550.23555.13581.73601.33612.13619.63625.43632.73642.83656.23671.03687.23704.4

Equipment&Software1446.41463.51434.01422.21424.31445.01460.31470.11478.01484.41490.11495.71503.51512.21521.21531.0

InformationProcessingEquipment725.3735.0716.5706.0697.9700.3700.0698.5697.2694.9692.1690.0689.0688.9689.6691.4

Computers&Peripherals221.3245.1237.9231.7227.7226.7225.4223.4221.9220.0217.8216.1215.1214.3213.5213.3

CommunicationsEquipment342.6306.6308.1300.0291.3292.1293.6295.4296.4297.1297.7297.8297.8298.4299.3300.7

IndustrialEquipment261.3264.2267.2270.3271.5276.7280.9284.6287.9290.9293.3295.5297.7299.4301.0301.9

TransportationEquipment359.1371.6353.8349.1365.4377.3384.4389.5391.8392.5397.3400.3405.2411.1417.1424.8

Aircraft61.574.556.356.657.757.958.158.559.159.660.260.560.861.261.661.8

OtherEquipment60.260.261.359.860.661.962.863.062.361.761.060.159.459.058.658.6

Structures606.5590.3582.4575.5574.4573.8573.2571.4568.4566.1565.0566.0567.5569.6572.0574.1

Commercial&Health151.2148.3144.0148.1151.2153.2156.2160.5163.6164.3165.2167.7169.3170.9172.6174.3

Manufacturing132.6130.7129.4118.7110.9105.4100.393.788.185.082.679.376.474.771.970.6

Power&Communication130.6128.8128.3119.1118.6117.2115.3113.9111.2106.6106.5112.1115.5115.7119.4122.9

Mining&Petroleum94.084.284.491.498.6104.9109.2112.4116.0120.6121.6118.0116.9119.2119.6115.8

Other100.297.896.899.799.299.399.699.398.999.899.999.7100.7101.1101.4102.5

ResidentialFixedInvestment643.5636.0619.8616.6622.6628.5633.5638.2642.5646.6649.2652.5655.6658.8662.4665.6

Exports2753.32741.12732.02746.92773.12812.22858.72885.12916.12939.82963.42987.53016.13038.03062.43085.6

Imports4493.14106.14114.74072.94044.94058.74073.94089.74116.24153.74195.74239.64288.94340.74390.84443.1

FederalGovernment1437.61424.11420.71440.11450.01457.71463.41465.01466.21466.11464.31460.11455.71453.61451.51450.6

State&LocalGovernment2289.02306.22307.22310.52308.82309.32310.12311.42312.02312.62313.02313.22313.02312.32311.22309.2

Table 5. Annual Employment

Millions

TotalNonfarmEmployment150.9142.2146.3152.5155.9158.0159.6160.6161.4161.7

PrivateNonfarm128.3120.2124.3130.3133.1134.6136.0137.1137.8138.0

Mining0.70.60.50.60.60.60.60.60.60.6

Construction7.57.37.47.88.08.28.38.38.48.5

Manufacturing12.812.112.312.812.912.812.712.512.512.4

Trade,TransportationandUtilities27.726.627.728.628.828.929.129.429.729.4

Transportation&Warehousing5.75.66.16.66.66.76.86.96.96.9

FinancialActivities8.88.78.89.19.29.29.39.49.69.6

Education&Health24.223.323.624.325.426.527.428.028.428.8

Professional&BusinessServices21.420.421.422.622.822.622.622.421.822.0 Information2.92.72.93.13.02.92.93.03.02.9

Leisure&Hospitality16.613.114.115.816.616.817.017.317.617.5 Government22.622.022.022.222.823.423.523.523.623.7 Federal2.82.92.92.92.93.02.92.82.82.8

State&Local19.819.119.119.319.920.420.620.720.921.0

Growth Rates

TotalNonfarmEmployment1.4-5.82.94.32.21.31.00.70.50.2

PrivateNonfarm1.5-6.33.44.92.11.11.10.80.40.2

Mining0.1-18.5-7.19.25.8-1.1-0.80.53.4-0.4

Construction2.8-3.22.54.43.12.51.00.00.81.2

Manufacturing1.0-5.11.53.70.8-0.4-0.9-1.70.0-0.9

Trade,TransportationandUtilities0.4-3.73.93.60.60.40.71.00.9-1.1

Transportation&Warehousing4.4-0.59.07.6-0.31.01.51.90.9-0.1

FinancialActivities1.9-0.61.22.91.20.01.11.81.30.2

Education&Health2.2-3.71.62.94.34.33.32.41.21.5

Professional&BusinessServices1.6-4.55.05.40.8-0.70.1-1.0-2.50.6

Information0.9-5.05.07.2-1.8-2.10.13.1-1.7-1.8

Leisure&Hospitality1.8-20.87.611.94.71.51.11.81.7-0.7

Government0.7-2.8-0.11.02.72.60.7-0.20.60.4

Federal1.13.6-1.6-0.62.02.5-3.0-5.30.00.0

State&Local0.6-3.70.21.32.82.61.30.60.60.4

Employment (Millions)

Table 6. Quarterly Employment

2025Q12025Q22025Q32025Q42026Q12026Q22026Q32026Q42027Q12027Q22027Q32027Q42028Q12028Q22028Q32028Q4

TotalNonfarmEmployment159.2159.5159.7159.9160.2160.5160.8161.

Mining0.60.60.60.60.60.60.60.60.60.60.60.60.60.60.60.6

Construction8.38.38.38.38.38.38.38.38.38.38.48.48.48.48.58.5

Manufacturing12.812.812.712.612.512.512.412.512.512.512.512.512.512.412.312.3 Trade,TransportationandUtilities29.129.129.129.229.329.329.529.629.729.829.729.629.429.429.329.3

Transportation&Warehousing6.76.76.86.86.86.96.96.97.07.06.96.97.06.96.96.9 FinancialActivities9.29.29.39.39.49.49.59.59.59.69.69.59.69.69.69.5 Education&Health27.127.327.527.627.928.128.128.128.328.428.428.528.728.828.828.9

Professional&BusinessServices22.622.622.722.822.622.522.422.222.021.821.821.821.921.922.022.1

Information2.92.92.93.03.03.03.13.03.03.03.02.92.92.92.92.9 Leisure&Hospitality17.017.017.017.017.117.317.417.517.517.617.717.717.417.517.517.5 Government23.623.623.623.423.423.523.523.623.623.623.723.723.723.723.723.7 Federal3.03.02.92.82.82.82.82.82.82.82.82.82.82.82.82.8 State&Local20.620.620.620.720.720.720.820.820.820.920.920.920.921.021.021.0

Growth Rates

TotalNonfarmEmployment1.30.70.70.40.80.70.70.60.50.40.20.10.20.20.30.3

PrivateNonfarm1.40.90.90.90.90.80.70.50.50.40.10.10.10.20.30.3

Mining-0.6-0.3-1.7-1.2-0.72.44.32.81.64.66.31.9-2.8-3.1-2.1-3.1

Construction0.90.50.0-1.20.40.10.50.60.90.80.91.21.21.41.41.4

Manufacturing0.0-0.3-2.6-1.3-3.3-0.5-2.10.30.20.60.40.4-1.1-2.0-2.3-1.9 Trade,TransportationandUtilities1.8-0.20.70.71.10.92.31.11.31.0-0.5-1.3-2.2-1.0-0.7-0.4

Transportation&Warehousing3.6-0.91.11.92.62.02.52.20.70.2-0.7-0.81.5-0.6-0.6-0.6 FinancialActivities1.70.71.21.82.51.32.61.41.81.10.0-0.82.1-0.8-0.8-0.4

Education&Health3.13.23.42.13.92.3-0.21.11.81.40.70.83.21.01.10.9 Professional&BusinessServices0.10.11.21.9-3.1-2.2-1.4-2.8-3.4-3.5-1.5-0.12.50.71.51.6

Information1.10.10.14.27.23.50.5-2.5-1.5-2.0-3.8-4.0-0.6-0.8-0.5-0.7

Leisure&Hospitality0.71.30.40.12.62.83.02.40.91.31.71.0-5.61.20.6-0.2

Government1.00.0-0.4-2.40.40.60.60.60.50.50.50.40.40.30.30.2

Federal-1.1-5.9-4.6-21.50.20.10.10.10.00.00.00.00.00.00.00.0

State&Local1.30.80.30.60.40.70.70.70.60.60.60.50.50.40.30.3

2025Q12025Q22025Q32025Q42026Q12026Q22026Q32026Q42027Q12027Q22027Q32027Q42028Q12028Q22028Q32028Q4

GDP136.8137.4139.0140.2141.3142.0142.8143.6144.4145.3146.1147.0147.9148.8149.6150.4

Consumption132.9133.5135.1136.4137.3138.0138.8139.5140.3141.0141.8142.5143.3144.1144.8145.5

Durables94.595.298.1100.399.999.398.898.297.596.996.496.095.595.194.694.2

MotorVehicles125.6125.1127.4129.4129.3129.1129.1129.0128.7128.6128.6128.6128.7128.8128.8128.8

Furniture96.297.5101.4104.1106.0105.9105.7105.3104.3103.6102.8102.3101.8101.4101.0100.6

OtherDurables86.686.889.391.793.292.892.792.391.891.691.391.190.890.490.289.9

Nondurables117.0116.6117.9119.0119.4119.7120.0120.4121.2121.9122.4123.0123.5124.0124.4124.9

Food132.5132.8133.7135.7136.7137.3138.0138.8139.3140.0140.4141.2142.1142.8143.4144.1

Clothing&Shoes102.8103.0104.8106.3106.4106.2106.4106.4106.5106.3106.6106.7106.8106.9107.0107.0

Gasoline&Oil93.588.085.882.879.680.079.678.884.488.190.491.892.693.494.094.7

Fuel98.895.994.991.688.588.487.286.390.493.495.196.096.697.197.497.8

Services146.0147.0148.3149.4150.8152.1153.2154.4155.6156.7157.8158.9160.1161.2162.3163.5

Housing160.8162.3163.7165.0166.2167.4168.6169.8170.9172.0173.2174.4175.6176.9178.1179.4

Electricity143.9147.9150.8153.1156.3158.5160.3161.3162.5163.1162.7162.7162.7162.9163.5164.5

NaturalGas147.9157.8161.5167.4176.7181.4186.1190.1194.2190.3180.6176.5178.6183.2180.3179.5

Water&Sewer164.7166.4167.9169.2171.4173.7176.3179.0181.7184.2186.8189.3191.7193.9196.2198.6

Telephone61.861.461.762.261.861.260.760.359.759.158.758.157.857.457.257.1

Transportation141.9142.3143.4144.5145.5146.1146.6147.4148.3149.4150.5151.5152.4153.2153.9154.7

OtherServices142.2144.3146.2147.3149.2151.0152.9154.6155.7156.9158.3159.5160.6161.6162.8164.0

Table 8. Percent Change in Implicit Price Deflators

2025Q12025Q22025Q32025Q42026Q12026Q22026Q32026Q42027Q12027Q22027Q32027Q42028Q12028Q22028Q32028Q4

GDP3.82.04.73.53.02.12.22.52.22.42.22.52.62.32.22.3

Consumption3.72.14.73.92.72.22.12.12.22.22.12.22.22.12.02.1

Durables0.93.112.59.5-1.5-2.6-2.0-2.3-3.0-2.2-2.2-1.8-1.7-1.8-1.9-1.8

MotorVehicles4.7-1.67.86.3-0.4-0.50.0-0.3-0.9-0.1-0.20.20.30.30.00.1

Furniture-1.45.516.911.07.7-0.7-0.6-1.7-3.5-2.7-2.9-2.1-1.8-1.6-1.8-1.5

OtherDurables-3.01.011.911.16.9-1.8-0.7-1.5-2.0-1.0-1.1-1.1-1.5-1.3-1.1-1.1

Nondurables3.0-1.34.63.81.31.01.11.12.72.41.61.91.81.61.41.5

Food2.90.92.75.93.21.62.12.31.42.01.22.32.52.01.91.9

Clothing&Shoes-2.70.67.55.50.5-0.70.80.00.4-0.80.90.40.30.40.40.1

Gasoline&Oil7.3-21.4-9.4-13.4-14.72.1-2.2-3.731.418.910.76.23.83.22.83.0

Fuel21.8-11.3-4.1-13.1-12.9-0.5-5.1-4.420.813.77.44.02.52.11.21.7

Services4.32.93.53.13.83.33.13.23.02.92.93.02.92.92.82.9

Housing3.84.03.43.23.12.92.82.82.82.62.72.92.82.82.93.0

Electricity4.011.78.06.28.75.94.52.53.21.3-0.90.1-0.20.61.42.5

NaturalGas29.029.59.715.424.310.910.98.89.1-7.9-18.8-8.84.810.6-6.1-1.7

Water&Sewer6.64.23.73.25.35.46.16.26.35.65.65.55.14.84.85.0

Telephone-3.1-2.72.13.1-2.2-3.9-3.3-2.5-3.9-4.2-2.8-3.5-2.6-2.6-1.2-1.0

Transportation4.01.33.03.22.71.71.32.22.72.93.12.72.42.11.92.0

Table 9. Annual Implicit Price Deflators (2012=100) 2019202020212022202320242025202620272028

GDP111.6113.1118.2126.7131.2134.4138.4142.4145.7149.2

Consumption109.5110.7115.3122.8127.5130.6134.5138.4141.4144.4

Durables87.586.891.697.596.894.897.099.196.794.9

MotorVehicles100.1101.8113.4126.7126.9124.2126.9129.1128.6128.8

Furniture87.288.092.5101.0100.297.199.8105.7103.3101.2

OtherDurables85.182.783.184.786.786.388.692.791.590.3

Nondurables99.098.3102.9113.1115.7116.2117.6119.9122.1124.2

Food104.5107.9111.3122.8129.0130.7133.7137.7140.2143.1

Clothing&Shoes98.093.195.099.9102.5103.3104.2106.4106.5106.9

Gasoline&Oil75.464.385.9112.3101.295.887.579.588.793.7

Fuel77.762.180.9126.3108.3100.295.387.693.797.2 Services117.1119.4123.9130.7137.3142.6147.7152.6157.2161.8

Housing123.9127.4130.6138.3148.7156.7162.9168.0172.6177.5

Electricity108.5109.1113.9128.7136.2141.8148.9159.1162.8163.4

NaturalGas102.8103.0120.2151.2140.2138.0158.6183.6185.4180.4

Water&Sewer128.8132.9137.7143.9151.8159.3167.1175.1185.5195.1

Telephone72.270.769.166.864.863.161.861.058.957.3

Transportation109.0107.7112.7125.2134.2138.0143.0146.4149.9153.6

OtherServices117.1120.0123.2128.8135.4140.0145.0151.9157.6162.3

Table 10. Percent Change in Implicit Price Deflators

2019202020212022202320242025202620272028

GDP1.71.34.57.13.62.42.92.92.32.4

Consumption1.41.14.16.63.82.52.92.92.22.1

Durables-1.0-0.95.66.5-0.8-2.12.42.1-2.4-1.9

MotorVehicles0.81.611.411.70.2-2.12.11.8-0.40.1

Furniture0.70.95.19.2-0.8-3.12.85.9-2.3-2.0

OtherDurables-2.3-2.80.51.92.3-0.42.74.7-1.4-1.2

Nondurables-0.1-0.74.69.92.30.51.21.91.91.7 Food1.03.33.110.35.01.32.33.01.82.1

Clothing&Shoes-1.3-5.12.15.22.50.80.92.10.20.4

Gasoline&Oil-3.4-14.733.530.8-9.9-5.3-8.7-9.211.55.7

Fuel-4.4-20.130.256.2-14.2-7.5-4.9-8.17.03.7

Services2.32.03.75.55.13.93.53.43.02.9

Housing3.42.92.55.97.65.44.03.12.82.8

Electricity0.20.64.313.05.84.15.06.82.30.4

NaturalGas-1.50.216.725.8-7.3-1.615.015.71.0-2.7

Water&Sewer3.23.23.64.55.54.94.94.85.95.2

Telephone-5.0-2.1-2.3-3.3-3.0-2.6-2.1-1.2-3.5-2.6

Transportation2.0-1.24.711.17.22.93.62.32.42.4

OtherServices2.22.52.74.65.13.43.64.83.72.9

Personal Income Billions Current Dollars

PersonalIncome18363.219620.121419.522088.923402.524669.325892.527364.928830.530192.9

Wages&Salaries11446.611596.412557.013436.714190.215019.915759.216545.617315.918108.8

OtherLaborIncome1470.81472.11534.71548.31643.91762.21870.81970.82059.52156.0

NonfarmIncome1522.01547.71739.71777.61877.71960.72027.72229.22348.62419.6

FarmIncome33.846.375.595.971.345.248.050.569.284.8

RentalIncome688.4738.1772.3870.3989.11056.91097.11145.91171.51204.0

Dividends1346.51403.51700.51839.21930.91981.92015.72114.52202.82226.4

InterestIncome1603.51509.01480.31634.91892.01964.62012.42156.52423.82695.4

TransferPayments3147.14228.84653.74139.24268.04538.94912.25180.55425.45669.7

PersonalSocialInsuranceTax774.1791.0852.8939.5995.61042.11083.11120.21157.71206.2

Percent Change, Annual Rate

PersonalIncome4.86.89.23.15.95.45.05.75.44.7

Table 12. Personal Consumption Expenditures (Current Dollars)

2025Q12025Q22025Q32025Q42026Q12026Q22026Q32026Q42027Q12027Q22027Q32027Q42028Q12028Q22028Q32028Q4

Consumer Expenditures by Type Billions Current Dollars

Consumerspendingon…

allgoods&services20461.620640.920979.021230.821506.421741.321960.722178.522411.122655.122900.723162.323429.823699.523962.924230.7

durablegoods2216.12253.52337.12368.42397.32417.02440.72461.22482.12504.32526.72552.62579.82608.52635.82662.4 furnitureandappliances496.1499.8518.2534.4540.0543.1548.3553.4558.1562.8565.1569.8576.3583.2592.3600.3 informationprocessingequipment319.6325.1341.1351.8349.7350.4349.8349.4350.4352.5355.1357.4359.8361.6362.6363.6 motorvehiclesandparts750.0775.7785.4768.1781.4788.7800.0808.6817.7825.7833.4842.9853.2864.5874.8883.7 otherdurablegoods193.6195.1206.5212.9215.9218.3220.2222.8223.5225.0227.1229.9232.9235.9238.2241.3 nondurables4175.04174.74233.04283.54314.44339.84362.94384.84423.54462.54495.04531.54568.74604.24637.44671.5 clothing&shoes534.1541.1554.8565.1576.8580.4589.2590.0591.9597.5606.5608.8614.2621.6631.5632.0 fueloil&coal29.727.826.225.223.122.722.021.522.222.623.023.123.223.223.223.2 gasoline&motoroil405.6378.5370.2357.3344.6344.8341.5337.0356.5368.9375.8379.4381.1382.5383.4384.5 food1518.61522.41535.81561.01577.11586.61596.31606.71614.51625.41633.81646.61660.41672.91684.31695.6 othernondurablegoods1687.01704.91746.01774.91792.91805.21813.91829.61838.41848.01855.91873.61889.81904.01915.01936.1

Consumer Expenditures by Type Billions 2012 Dollars Consumerspendingon… allgoods&services15401.315456.515530.315567.115663.415749.015825.415898.015976.516062.116153.716249.116348.416451.016552.316649.8 durablegoods2344.42366.12383.02360.92398.52434.22470.52505.72546.52583.72621.22660.22700.32742.52784.92825.8 furnitureandappliances515.6512.5511.0513.4509.2513.0518.7525.7535.0543.2549.4557.0565.9575.0586.7596.8 informationprocessingequipment581.9571.6581.7584.5626.4642.1654.7663.2677.6690.9705.7717.1728.1740.9753.4765.0 motorvehiclesandparts597.2620.1616.3593.5604.5610.9619.7626.9635.5641.9648.2655.3662.9671.2679.2685.9 otherdurablegoods253.7255.6263.7264.9265.1269.7272.8277.8280.1283.1286.8291.6296.9302.1306.2311.6 nondurables3569.63581.33590.83600.13614.13625.93634.93643.23650.73660.93673.03685.63698.93713.03726.63739.6 clothing&shoes519.5525.6529.2531.8542.1546.5553.6554.4555.6561.9569.1570.7575.2581.6590.3590.6 fueloil&coal30.129.027.627.526.125.725.324.924.524.224.124.124.023.923.823.7 gasoline&motoroil434.0430.1431.2431.4432.9431.0429.2427.5422.4418.6415.7413.4411.4409.6407.8406.0 food1146.01146.41148.51150.61153.31155.71156.91157.71159.11161.21163.81166.21168.81171.71174.21176.4 othernondurablegoods1405.91415.51419.51423.91425.51432.01434.71442.31450.41455.31460.21470.01477.61484.11488.71499.9

Real Consumer Expenditures Annual Growth Rate Consumerspendingon… allgoods&services0.51.41.91.02.52.22.01.82.02.22.32.42.52.52.52.4 durablegoods-3.73.72.9-3.76.56.16.15.86.76.05.96.16.26.46.36.0 furnitureandappliances1.5-2.4-1.21.9-3.33.04.55.57.26.34.65.66.66.68.37.1 informationprocessingequipment-2.5-6.97.31.931.910.48.15.39.08.18.86.76.27.26.96.4

motorvehiclesandparts-11.216.3-2.4-14.07.64.35.94.75.64.14.04.44.75.14.94.0 otherdurablegoods-2.73.013.41.70.37.14.87.43.44.35.36.97.57.25.67.2 nondurables2.11.31.11.01.61.31.00.90.81.11.31.41.51.51.51.4

clothing&shoes7.04.72.82.08.03.25.30.50.94.65.21.13.24.56.10.2

fueloil&coal48.9-13.9-17.5-2.1-18.4-6.3-6.4-5.2-6.4-4.4-1.6-1.2-1.4-1.4-2.2-1.5 gasoline&motoroil0.9-3.51.00.31.4-1.8-1.7-1.6-4.7-3.5-2.7-2.2-1.9-1.8-1.7-1.8 food1.00.10.70.70.90.90.40.30.50.70.90.90.91.00.80.8

othernondurablegoods1.32.81.11.20.51.80.82.12.31.41.32.72.11.81.23.1

Table 13. Personal Consumption Expenditures

Consumer Expenditures by Type Billions Current Dollars

Consumerspendingon…

allgoods&services14437.514225.716113.917690.818822.819825.320828.121846.722782.323830.7 durablegoods1523.61616.91990.32078.02142.62167.42293.82429.12516.42621.6 furnitureandappliances346.7379.3450.8475.5480.4486.0512.1546.2564.0588.0 informationprocessingequipment180.8213.5254.2266.8290.3311.1334.4349.8353.9361.9 motorvehiclesandparts545.0546.7697.3726.4750.0728.6769.8794.7829.9869.0 otherdurablegoods135.8130.5172.2182.0185.6193.3202.0219.3226.4237.1 nondurables3009.23089.83510.13861.03981.34075.94216.64350.54478.14620.5 clothing&shoes414.1368.0470.6492.8510.1522.7548.8584.1601.2624.8 fueloil&coal23.820.024.732.927.925.827.222.322.723.2 gasoline&motoroil328.7238.4361.1481.7439.3414.0377.9342.0370.2382.9 food1083.21198.91291.91395.81444.01481.91534.41591.71630.11678.3 othernondurablegoods1159.31264.51361.91457.81560.01631.61728.21810.41854.01911.2

Consumer Expenditures by Type Billions 2012 Dollars Consumerspendingon… allgoods&services13185.712851.613979.014403.414767.815175.215488.815784.016110.416500.4 durablegoods1740.61863.62173.22131.32214.32287.32363.62452.22602.92763.4 furnitureandappliances397.8431.1487.3470.8479.5500.5513.1516.6546.2581.1 informationprocessingequipment265.6342.8413.8441.0509.0561.4580.0646.6697.8746.8 motorvehiclesandparts544.2537.2615.0573.5591.2586.4606.8615.5645.2674.8 otherdurablegoods175.0174.7227.5237.8239.8254.2259.5271.3285.4304.2 nondurables3038.23141.83411.13415.13441.93507.33585.53629.63667.53719.5 clothing&shoes422.5395.5495.3493.1497.8506.0526.5549.2564.3584.5 fueloil&coal30.632.230.526.125.725.828.525.524.223.8 gasoline&motoroil435.8370.5420.4428.9434.2432.1431.7430.1417.5408.7 food1036.91110.81160.81136.81119.71133.91147.91155.91162.61172.8 othernondurablegoods1098.11186.71267.11295.11331.81375.21416.21433.61459.01487.6

Real Consumer Expenditures Annual Growth Rate

Consumerspendingon…

allgoods&services2.1-2.58.83.02.52.82.11.92.12.4 durablegoods3.37.116.6-1.93.93.33.33.86.16.2 furnitureandappliances2.58.413.0-3.41.94.42.50.75.76.4 informationprocessingequipment18.029.120.76.615.410.33.311.57.97.0

motorvehiclesandparts-1.7-1.314.5-6.83.1-0.83.51.44.84.6

otherdurablegoods5.3-0.230.24.60.86.02.14.65.26.6 nondurables3.03.48.60.10.81.92.21.21.01.4

clothing&shoes2.5-6.425.2-0.41.01.64.14.32.83.6

fueloil&coal-0.35.2-5.3-14.6-1.30.210.7-10.6-4.9-1.7

gasoline&motoroil-0.4-15.013.52.01.2-0.5-0.1-0.4-2.9-2.1 food2.77.14.5-2.1-1.51.31.20.70.60.9

othernondurablegoods4.58.16.82.22.83.33.01.21.82.0

Billions Current Dollars

BusinessFixedInvestment2993.72870.53079.13492.83831.64034.94228.34327.44383.74477.3

ProducersDur.Equipment1240.91109.51188.61317.71425.81505.91647.61695.81719.41752.1

NonresidentialStructures677.9624.7628.3756.1884.1913.3891.9883.8897.6929.1

Non-FarmBuildings372.3365.4365.8460.7560.2583.5567.9550.5556.7574.1

Commercial174.6185.4191.8233.4250.5232.6222.2238.0266.5290.2

Industrial80.575.181.6124.5193.1231.3224.6183.2153.7138.4

OtherBuildings117.2105.092.3102.9116.6119.5121.0129.3136.4145.4 Utilities144.6145.8144.3147.7159.5168.8168.9159.4155.4172.2

Mines&Wells117.468.370.393.7103.597.394.6115.5126.9122.2

Billions 2012 Dollars

BusinessFixedInvestment2926.52791.02959.23165.13355.13476.13566.43587.63630.13679.7

ProducersDur.Equipment1279.51150.11227.01280.51324.91369.41441.51449.91487.11517.0

NonresidentialStructures580.9527.7513.8532.5590.2610.7588.7573.2566.4570.8

Non-FarmBuildings297.1283.9266.6276.8315.4328.2316.1300.6292.7290.4

OtherBuildings90.077.964.362.867.568.066.970.372.174.9

Utilities139.9137.3130.7122.9128.5136.7137.3127.4120.8130.3

Mines&Wells111.168.480.998.3103.297.088.5106.3119.1117.9

Annual Growth Rate

BusinessFixedInvestment3.8-4.66.07.06.03.62.60.61.21.4

ProducersDur.Equipment1.0-10.16.74.43.53.45.30.62.62.0

NonresidentialStructures2.3-9.2-2.63.610.83.5-3.6-2.6-1.20.8

Non-FarmBuildings1.3-4.4-6.13.814.04.0-3.7-4.9-2.6-0.8

Commercial1.63.9-3.3-1.80.2-7.0-4.94.86.63.5

Industrial5.6-9.53.324.245.020.4-3.6-19.8-18.4-12.4

OtherBuildings-1.8-13.5-17.5-2.47.60.7-1.65.02.63.8

Utilities6.1-1.9-4.8-6.04.66.40.5-7.2-5.27.8

Mines&Wells-0.3-38.418.221.64.9-6.0-8.720.112.1-1.0

Federal Government Receipts and Expenditures

Receipts3704.33767.34423.85120.84834.05116.45673.65907.26158.26408.4

PersonalTaxandNontaxReceipts1701.11740.92124.92606.42261.42394.32577.82547.62742.82863.0

Corp.ProfitsTaxAccruals210.5225.2334.1401.5445.1489.6473.0467.8473.2474.0

IndirectBusinessTaxandNontaxAccruals174.9155.3180.6201.6174.2178.4481.7675.2650.3667.5

ContributionsforSocialInsurance1409.51435.01543.01688.01801.31878.31959.12036.32104.42192.6

Expenditures4748.16708.07262.66141.16500.46949.87310.87633.97963.38284.5

PurchasesGoods&Services1419.51523.01603.21641.01762.61867.61943.72014.52065.52092.8

NationalDefense849.5885.0908.7930.01002.11070.41127.11180.41205.61215.8 Other570.0638.1694.5711.0760.5797.2816.6834.1859.9877.0

TransferPayments3011.44331.84859.04056.14138.24348.84613.24825.85047.25261.4

ToPersons2328.03365.43653.32985.53065.33264.13562.83786.73994.24217.8

ToForeigners43.450.658.987.883.786.951.539.339.840.0 GrantsinAidtoState&LocalGov't608.9878.71110.1948.3950.7963.2960.9962.5974.1962.6 NetInterest539.3494.8552.5703.7907.81054.21092.41164.81229.31299.6

SubsidieslessSurplusofGov'tEntities71.0692.0599.6122.5105.0102.3111.4105.8105.1105.3 Surplus(+)orDeficit(-)-1043.8-2940.8-2838.8-1020.3-1666.4-1833.4-1636.0-1726.7-1805.1-1876.1

State and Local Government Receipts and Expenditures

Receipts2788.53081.13586.53690.13700.83854.83984.64109.84253.54372.6

PersonalTax/NontaxReceipts1929.51944.02215.72449.52476.62596.52722.62813.62927.43043.8 CorporateProfits497.5504.4580.2638.5594.3641.4690.4731.6776.3810.1

IndirectBusinessTaxandNontaxAccruals73.373.7116.1162.4163.5165.3156.3144.7146.4146.6

ContributionsforSocialInsurance20.720.022.322.821.326.727.328.329.530.6

FederalGrants-In-Aid608.9878.71110.1948.3950.7963.2960.9962.5974.1962.6

Expenditures2994.33132.33341.23601.83762.33917.34076.44216.24362.54487.0

PurchasesGoods&Services2366.52476.62600.32812.72947.93122.03265.53379.63506.83629.4

TransferPayments755.31030.41274.51136.91135.01166.41161.21169.51189.51186.8

InterestReceived227.7214.7206.1169.7204.4192.7180.0185.7193.1200.8

NetSubsidies14.18.921.313.430.632.826.45.40.80.8

DividendsReceived6.56.26.36.66.96.97.27.37.67.9

Surplus(+)orDeficit(-)-205.8-51.2245.488.3-61.6-62.5-91.8-106.4-109.0-114.4

Billions of Dollars

Table 16. U.S. Exports and Imports of Goods and Services

2019202020212022202320242025202620272028

NetExportsGoods&Services-577.3-626.2-860.0-958.9-797.3-903.1-964.8-678.4-583.1-571.6

CurrentAccount-442.0-593.5-858.6-993.1-928.0-1185.3-1301.8-772.9-655.6-612.2

Exports-Goods&Services2539.42151.12555.43017.43052.53180.23251.13377.93569.53751.5

MerchandiseBalance-857.3-912.9-1083.2-1174.6-1057.5-1215.4-1586.2-1327.1-1271.4-1281.9

Food,Feed&Beverage131.0139.3164.5179.9161.9165.0159.8175.7186.5196.2

IndustrialSuppliesExclPetroleum526.4451.1617.6810.9719.6715.3701.4670.4727.7793.5

MotorVehicles&Parts163.1129.4146.4163.0180.0171.6160.8170.7177.6183.9

CapitalGoods,Excl.MVP550.7463.4521.5573.2602.6645.3723.0809.1840.3847.9

ComputerEquipment46.941.246.749.949.068.688.465.267.271.3

Other377.8350.1394.8428.8439.8451.7492.2601.4624.5622.9

ConsumerGoods,Excl.MVP205.0174.2221.8244.4259.0258.6243.9218.5225.6253.0

OtherConsumer68.564.475.493.798.8103.3104.7109.6115.6121.9

Services894.6729.5808.2952.31030.51121.11157.31224.11296.21355.0

Billions of Dollars

Imports-Goods&Services3116.72777.33415.53976.33849.84083.34215.94056.44152.64323.1

Merchandise2516.72305.12839.63257.03096.13261.03362.83164.43226.03356.7

Food,Feed&Beverage151.6155.4183.3209.5201.5217.1232.5232.1234.4240.7

Petroleum&Products207.4125.2216.2309.0259.6251.9204.1164.6199.1229.6

IndustrialSuppliesExclPetroleum311.5298.4420.0494.8405.6401.0421.9417.2407.4416.3

MotorVehicles&Parts375.3309.9346.3399.0459.4475.4460.0476.6493.1507.4

CapitalGoods,Excl.MVP679.1647.1763.6870.1865.0967.91051.1947.3944.3994.4

ComputerEquipment130.8145.8169.5179.8155.6216.0278.5224.6227.8237.5

Other485.5456.4552.6642.6654.1689.2712.6652.7643.7682.6

ConsumerGoods,Excl.MVP655.3640.7768.1839.1757.5803.5832.0765.7783.2797.7

OtherConsumer136.5128.4142.1135.5147.5144.2161.2160.8164.4170.7

Services600.0472.2575.9719.3753.7822.3853.1891.9926.7966.4

Billions 2012 Dollars

NetExportsGoods&Services-891.6-918.4-1236.4-1368.4-1251.6-1371.5-1453.4-1234.5-1224.6-1315.4

ExportsG&S2575.72237.52382.52561.52632.32718.42743.32832.32951.73050.5

ImportsG&S3467.23155.93618.93929.93883.84089.94196.74066.84176.34365.9

Exports & Imports % Change

ExportsG&S0.1-15.318.818.11.24.22.23.95.75.1

ImportsG&S-0.5-10.923.016.4-3.26.13.2-3.82.44.1

RealExportsG&S0.5-13.16.57.52.83.30.93.24.23.3

RealImportsG&S1.2-9.014.78.6-1.25.32.6-3.12.74.5

Sean Snaith, Ph.D., is the director of the University of Central Florida’s Institute for Economic Forecasting and a nationally recognized economist in the field of business and economic forecasting.

Snaith is the recipient of multiple awards for the accuracy of his forecasts, his research and his teaching. He has served as a consultant for local governments and multinational corporations such as Compaq, Dell and IBM. Before joining UCF’s College of Business, he held teaching positions at Pennsylvania State University, American University in Cairo, the University of North Dakota and the University of the Pacific.

Snaith is frequently interviewed in international, national and regional media. He has been quoted in The Wall Street Journal, USA Today, The New York Times, The Economist and The Guardian and has appeared on CNBC, Fox Business Network, The Nightly News with Brian Williams, Al Jazeera, the BBC and CBC, China Central TV, Sky News, Nippon TV and the Business News Network, based in Toronto.

Snaith is a sought-after speaker known for his engaging and humorous presentations. He has built a national reputation for his unique ability to explain complex subject matter in a digestible manner. He earned praise from one business editor for having “an uncanny knack of making economics not only understandable but interesting.”

Snaith is a member of several economic organizations and national economic forecasting panels, including The Wall Street Journal’s Economic Forecasting Survey, the Associated Press’ Economy Survey, CNNMoney.com’s Survey of Leading Economists, USA Today’s Survey of Top Economists, Federal Reserve Bank of Philadelphia’s Survey of Professional Forecasters, Bloomberg and Reuters.

Snaith holds a B.S. in Economics from Allegheny College and an M.A. and Ph.D. in Economics from Pennsylvania State University.

Sean M. Snaith, PhD

Director, Institute for Economic Forecasting

P407.823.1451 Essnaith@ucf.edu ief@ucf.edu

ucf_ief

ucf.ief

ucf.ief

linkedin.com/company/institutefor-economic-forecasting/

Turn static files into dynamic content formats.

Create a flipbook
Issuu converts static files into: digital portfolios, online yearbooks, online catalogs, digital photo albums and more. Sign up and create your flipbook.