Despite the Onset of Geopolitical, Policy, and Tropical Storm Seasons, Florida’s Economy Should Continue to Grow.
It is June in Florida, and that of course means the start of another hurricane season. Florida was impacted by several tropical storms/hurricanes, and while they can wreak havoc on the areas hard hit by the wind, rainfall, and storm surges that accompany these seasonal weather events, they tend not to have large and lasting statewide economic consequences.
Locally, the pattern of economic impact is consistent across time with regards to the effects on the jobs market and economies of impacted areas, and the macro impacts tend to last a period of months rather than years.
State government has been enjoying a windfall of tax revenue the past several years and that has allowed rainy day funds to rise to $4.4 billion, which could allow the state to ameliorate any potential impacts from hurricanes.
Longer effects could come from the potential of any storms leading to further challenges in the homeowner’s insurance markets, a persistent problem that has exacerbated the housing affordability challenges the state has been facing.
Policy-wise the debated changes at the state level to both sales and property taxes in Florida did not move forward, and a budget has been sent to the Governor that contains an increase of 2% over the previous year.
Nationally, the “big, beautiful bill” is currently in the Senate awaiting modification and passage as the latest continuing resolution slowly makes its
way through the dysfunctional budgeting process in Washington, DC.
They say that beauty is in the eye of the beholder, and I am struggling to see the beautiful part of a spending bill that will add trillions of dollars to an existing national debt of $37 trillion that comes with an interest payment burden of over $1 trillion per year.
The near-term consequences for Florida’s economy are not an immediate threat, but the continuing failure to address the out-of-control spending in our nation’s capital could have significant consequences for Florida’s economy in the years that lay ahead. The burden of such high interest payments every year could show up first by limiting the federal government’s ability to fund discretionary projects such as partnering with the state on much needed transportation infrastructure projects.
It appears that DOGE was unable to bring about the needed changes to a bureaucracy that is deep and entrenched. A discouraging outcome— to say the least—leaves me wondering what it will take to bring about the needed changes.
Geopolitics seems to be the greatest risk as the war between Israel and Iran continues to escalate alongside calls for the United States to get involved in yet another foreign war. The threat of a large-scale war involving the U.S. poses in my mind the greatest risk to the economy in Florida. Disruption of shipping lanes, and a massive blow
to global oil markets could rattle the economy on multiple fronts, and while not necessarily leading to a recession, there would be multiple adverse economic consequences of escalating the conflict. Perhaps we will get lucky this hurricane season, and maybe cooler heads will prevail in the Middle East, but I am increasingly worried that a debt crisis may be the only way that we see any significant changes to the spending problem in Washington, DC. There are a lot of storms brewing that could have severe consequences for our nation and Florida’s economies.
FLORIDA’S HOUSING MARKET
Inventories Rising, Sales Slowing, and Prices Down
The April 2025 single-family home report released by Florida Realtors shows a market for existing housing with a rising level of inventories, shrinking the shortage that was responsible for sparking rapid price appreciation during 20212023. The median price has been pushed to $154,934 above the peak price of the housing bubble in June 2006. The median sales price for single-family homes decreased slightly more than $17,200 from April 2024, year-over-year, and now stands at $412,734—a year-over-year price appreciation of -4.0%. Price depreciation in the townhome/condominium market continues with a decrease in the median sales price of $20,000 year-over-year, registering at $315,000 in April of this year. This price change represents a 6.0% decrease in median prices year-over-year.
Inventories of single-family homes in April are up from 4.1 months of supply a year ago to 5.6 months of supply this year. This indicates an inventory balance that is slightly skewed in favor of the buyers in the single-family market,
according to the Florida Realtors report.1 From April 2024 to April 2025, inventories of condominiums rose from 6.8 months to 10.3 months, indicating that the condo market has fully shifted from a seller’s market to a buyer’s market. There is balance in the existing singlefamily homes market, but condo markets have now fully swung in favor of buyers.
Distressed sales of single-family homes in the form of short sales remain at extremely low levels, showing little impact on higher mortgage rates, prices, and homeowners insurance costs. They have increased from 30 in April 2024 to 40 in April 2025, an increase of 33.3% year-over-year, but at still historically low levels. Foreclosure/ REO sales have decreased year-over-year by 30.4% versus April 2024, decreasing from 224 to 156 in April of this year; levels of foreclosures remain quite low. Traditional sales are down 4.3% year-over-year versus April 2024, as high prices and homeowners’ insurance rates propagate affordability challenges that are partially offset by rising levels of inventories and slightly lower mortgage rates.
Distressed sales of condos in the form of short sales are still at extremely low levels, just 4, in April 2025. Foreclosure/REO sales are down 43.4% from April 2024 and remain at a low level of just 30. Traditional sales of condos are down 14.7% in April 2025 when compared to April 2024.
In April 2025, the percentage of closed sales of single-family homes that were cash transactions stood at 28.3%. For condos, that figure is much higher, as 54.3% of all closings were cash transactions. The condo market’s share of cash transactions decreased by 0.6 percentage points year-over-year, while the single-family housing market’s share of cash transactions increased by
1 According to Florida Realtors, the benchmark for a balanced market (favoring neither buyer nor seller) is 5.5 months of inventory. Numbers above that indicate a buyers’ market, numbers below a sellers’ market. Other real estate economists suggest a 6-to-9month inventory as being a balanced market.
1.8 percentage points. This is occurring amidst a still-tight market for mortgages. 2
Figure 1 depicts the monthly realtor sales of existing singlefamily homes, as well as the 12-month moving average of these sales. The smoother moving average line evens out the seasonality and other statistical noise inherent in monthly housing market data. Sales had been on a strong upward path over the past postpandemic, and the 12-month moving average and monthly sales vastly exceeded their peak value during the housing bubble. Over the past two years, the 12-month moving average has sharply declined, but in recent months, it has started to flatten out. This reflects affordability issues easing in the face of slower price appreciation over the past year; a rising inventory of houses for sale; slight easing in mortgage credit markets; stabilizing homeowners insurance premiums; and lower mortgage rates for those able to get loans. The short-lived COVID-19 plunge in sales during January and May pulled down the moving average in 2020, but the immediate post-shutdown rebound was strong, fueled by pent-up demand and then record-low mortgage rates.
Source:FloridaRealtors
The housing market in Florida is still challenged by the burden of high prices and higher insurance premiums despite somewhat lower mortgage rates. Both economic growth and job growth in Florida are forecasted to slow as the U.S. economy decelerates. More baby boomers continue to
2 The Mortgage Credit Availability Index (MCAI), put out by the Mortgage Bankers Association, increased by 2.1% to 105.1 in May from April 2024. The increase in the index in May from April indicates that mortgage lending standards loosened slightly. The index is benchmarked to 100 in March 2012. Relative to that month, mortgages in January 2025 were 1.0% less available. In 2006, the value of this same index approached 900 and at the start of 2020, the index was near 185. Despite lower mortgage rates, financing is not available to all comers.
1.
reach the end of their working lives, and this bodes well for continued population growth via the immigration of retirees, as well as job seekers to Florida. We expect sales to remain under pressure, as increases in inventories will help keep downward pressure on prices in an environment with sustained strength in the demographic drivers of housing demand. Housing demand had some relief from higher mortgage rates that had hit 8.0% at their recent peak, with the possibility of the Federal Reserve Bank continuing interest rate cuts in the second half of the year. Also, any relief from recent surges in homeowners’ insurance rates will help support this demand.
Figure 2 displays median sales prices for existing single-family homes. Median sales prices have continued to climb since bottoming out in 2011. The double-digit pace of price increases in 2016 and 2017, which eased in 2018 and 2019, resumed in 2020. Over the past year, the 12-month moving average of median sales prices has risen by just $41.67.
Low inventories of existing homes for sale and lagging housing starts growth since 2016 contributed to the environment where home prices rose at a rapid pace. This was exacerbated by those who had refinanced mortgages at sub-3.0% levels and were hesitant to sell when current rates are
Figure
$500,000
$450,000
$400,000
$350,000
$300,000
$250,000
$200,000
$150,000
$100,000
$50,000
$0
near 7.0%, but they may be adjusting to the new reality of housing finance. The slowing of housing demand will result in a mild slowdown in housing starts. Some softness in the housing market will be a feature of Florida’s economy over the next few years barring any significant dip in mortgage rates as inventories continue to rise.
This period of unsustainable multi-year price appreciation ended several years ago. The likelihood of economic slowdown, coupled with relatively higher mortgage rates, and rising inventories has led to a softening of prices. The economic conditions will lead to some price depreciation, but not anything like the 2008-09 collapse in prices.
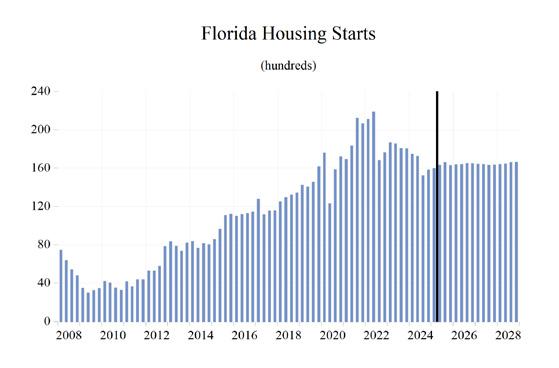
Housing starts in 2028 are expected to increase to over 165,000, falling from 183,675 in 2023. Lower interest rates should support this sector of the economy after higher rates had a dampening effect on home construction activity.
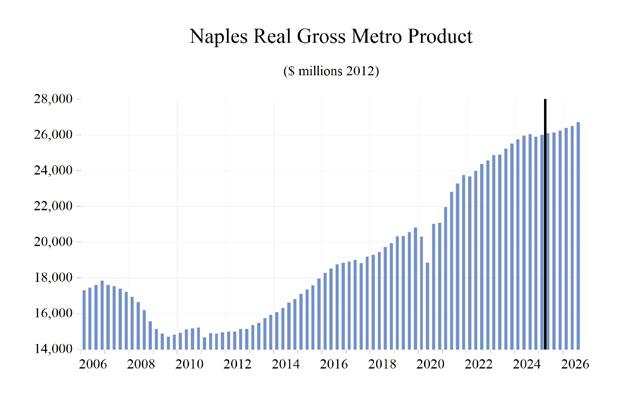
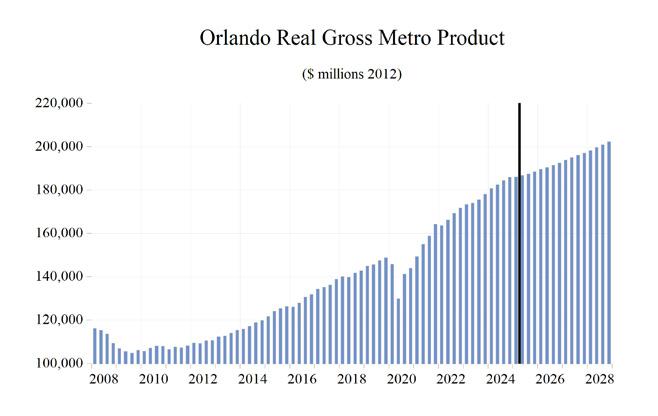
GROSS STATE PRODUCT
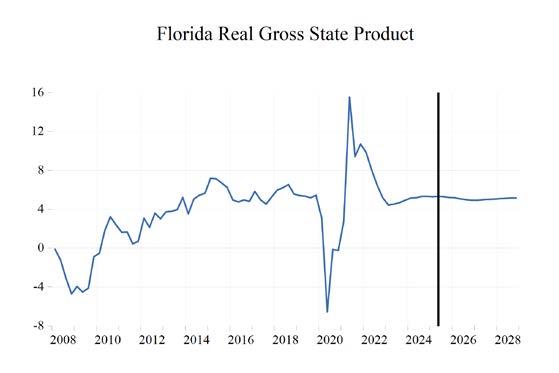
Lockdowns caused a contraction in real Gross State Product (GSP) in 2020 of 1.4% year-overyear. This decline was smaller than both annual declines that occurred during the Great Recession (3.9% in 2008 and 5.5% in 2009). However, the
second quarter’s year-over-year decline in 2020 was steeper than any quarter during the Great Recession. Fortunately, the COVID-19 recession, while much deeper than the previous recessions, was very short-lived at just two months. Florida’s decision to avoid heavy-handed and lengthy restrictions on the economy allowed the state to come roaring back in 2021 when growth hit 9.4 percent.
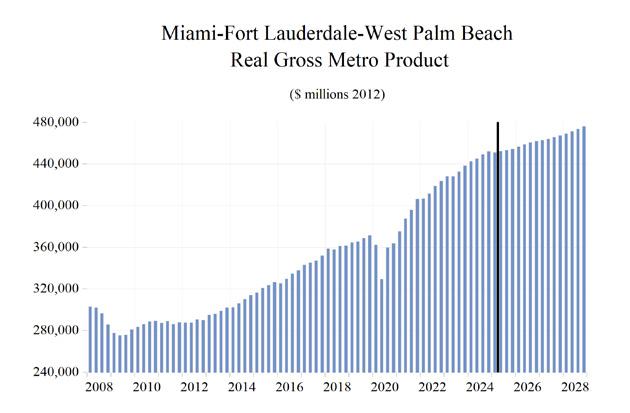
During 2025-2028, Florida’s real GSP is expected to grow by an average of 1.8% annually. This growth will include a 2025 deceleration to 1.7% from 3.6% in 2024. The 1.8% average growth from 2025 through 2028 will be a slower pace for growth compared to the prior four years (when growth averaged 5.8%), and this is due to an anticipated slowdown in the U.S. economy. This projected average rate of growth for Florida’s economy over the 2025-2028 period is higher than the average of our forecasted real GDP growth for the U.S. economy (1.6%) over the same time frame.
Housing prices have soared since the bottom of the housing crisis. During the crisis, median existing-home prices fell to a low of $122,200 but now stand at $412,734. This price appreciation significantly improved household balance sheets in Florida. With the price appreciation to date, Florida has long since recovered the aggregate housing value lost during the housing market collapse and has soared past the lofty levels at the peak of the housing bubble, but higher mortgage rates and a slowing economy led to partial decline in prices. Fortunately for homeowners, but not for potential buyers, any further price declines will not be anything like the price collapse of 2008-09.
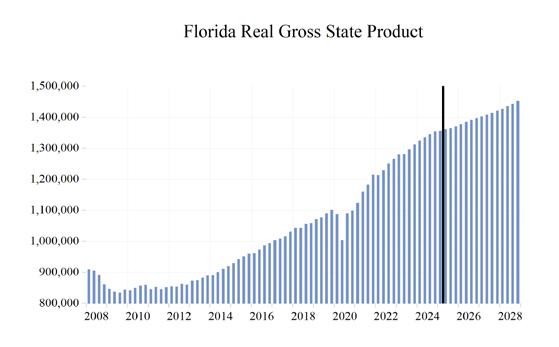
In 2017, Florida’s economy broke the $1-trillion threshold with a nominal (not adjusted for
inflation) Gross State Product (GSP) of $1.003 trillion, which increased to $1.29 trillion in 2021. The GSP reached $1.47 trillion in 2022 and hit $1.60 trillion in 2023. We expect Florida’s GSP to rise to $1.80 trillion in 2025, $1.90 trillion in 2026, $1.98 trillion in 2027 and $2.07 trillion in 2028.
Real GSP (adjusted for inflation) exceeded $1.1 trillion in 2021 and will climb to nearly $1.46 trillion in 2028.
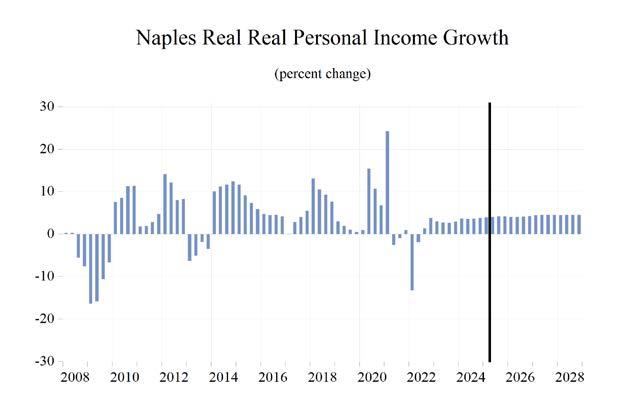
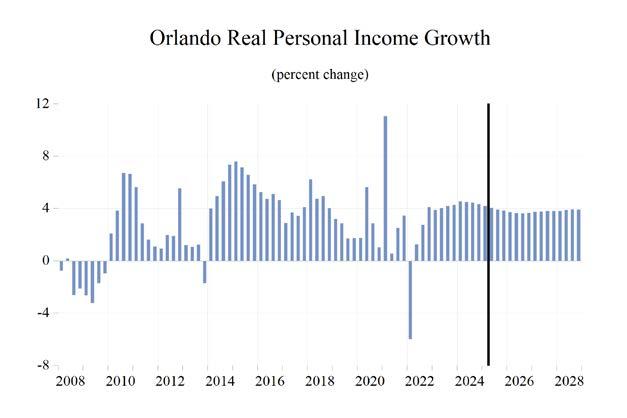
PERSONAL INCOME, RETAIL SALES, AND AUTO SALES
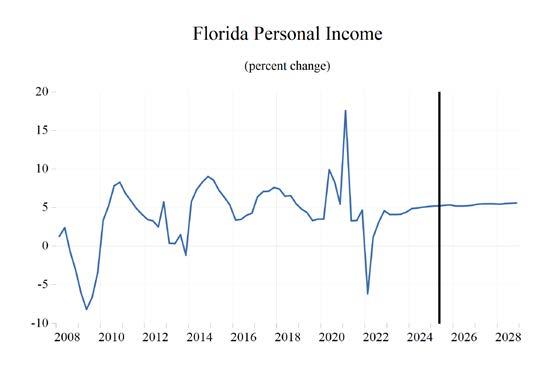
Nominal personal income growth surged to 6.5% (thanks to COVID stimulus and bonus unemployment payments) in 2020 and 11.3% in 2021, amid further federal stimulus spending and tax credits. Nominal personal income will be slightly above $2.0 trillion in 2028, marking an increase in personal income of over $1.0 trillion from its Great Recession low point in 2009.
Thanks to rising inflation, real personal income contracted by 1.7% in 2022 but rose by 3.0% in 2023. Growth was 3.2% in 2024 and is expected to be 1.7% in 2025, 2.6% in 2026, 3.9% in 2027, and 3.4% in 2028. Real personal income growth during 2025-2028 will average 2.9% in Florida, weighed down a bit by slower growth and some persistent inflation in the near term, but still 0.5 percentage points higher than our forecast for the U.S.
Real disposable income growth, because of surging inflation, turned negative at -3.8% in 2022. Average growth in Florida during 2025-2028 will be 3.2% with inflation steadily declining, accompanied by still-solid wage and salary growth supported by Florida’s durable labor market.
Financial markets experienced a strong rebound from the COVID-19 induced financial downturn, thanks in large part to the Federal Reserve
Bank’s resumption of the financial crisis zerointerest-rate policy, quantitative easing, and the other federal stimulus programs. The Dow Jones Industrial Average fell to 18,214 in March 2020 but then surged to a new record high of 36,953 in January 2022. The market declined as the Fed commenced its fight against inflation, causing financial markets to decline from those highs to the Dow falling under 34,000. Recently with the Fed starting to cut interest rates, the market hit a new all-time high above 45,000 but has declined significantly in the early months of 2025 with DOGE and tariff uncertainty spooking financial markets. Once again, the rebound has been relatively rapid as after hitting 36,611 in April, the Dow has recovered to 42,172.
Home equity in Florida was slow to recover unlike financial asset wealth following the Great Recession. Housing prices have been climbing over the past five years, and current median prices have greatly exceeded the once heady highs seen during the housing bubble. The housing market did not suffer the pandemic pain that financial markets experienced during the COVID-19 recession, nor will it during any economic slowing in the next few years. Home prices will fall slightly if this slowdown is worse than anticipated, but to date, large price declines have not materialized in a housing market where inventories are rising, with the Fed putting interest rate cuts on hold for the past six months.
Housing may not be as large a driver in the economy over the next few years, as housing starts have dipped from their post-pandemic highs. However, housing will still be an important economic factor as builders work to replenish, albeit at this diminished pace, inventories as Florida’s population continues to grow, supporting housing demand.
Retail spending was hurt in the short run by the public health shutdowns and the effective collapse of the tourism industry in Florida from the pandemic response. Retail spending in the
first quarter of 2020 contracted by 12.4% at an annual rate, followed by a 7.9% contraction for the second quarter. Spending levels exploded after the short, deep recession and a series of economic lockdowns, fully countering the first half of the year’s plunge, and driving full-year growth into positive territory for the year. In 2021, retail sales grew robustly compared to 2020, rising 18.9% year over year. Sales came back down to Earth from the post-lockdown growth, and after a few quarters of weak growth from an erosion of consumers’ purchasing power and a slowing economy, growth will average 3.7% during 2025-2028, hitting 3.6% in the final year of our forecast.
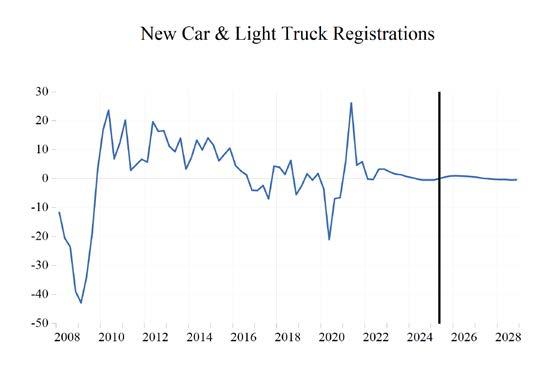
Consumers began to purchase light vehicles at a faster pace after the Great Recession ended, releasing several years of pent-up demand, and continued to do so through 2016, though at a considerably slower pace. The 2020 COVID recession once again caused a contraction of new passenger car and truck registrations of 5.1% year-over-year in the fourth quarter of 2020, versus the fourth quarter of 2019. This contraction was not as sharp or as persistent as the one that took place during the Great Recession. Supply chain disruptions injected chaos into light vehicle markets, and prices for both new and used vehicles soared in the wake of these problems. New cars were selling for thousands above sticker price and used vehicle inflation at one point hit 40% year-over-year. The rate of vehicle inflation has declined significantly, but prices remain elevated above pre-pandemic levels and interest rates on auto loans remain high for now. Tariff uncertainty has boosted sales in the near term as consumers try to beat potential tariff-induced price increases.
Pent-up demand and the economic recovery boosted registrations coming out of the COVID recession, and vehicle registration growth in Florida surged in 2021, rising to 11.6%. Registration growth in Florida during 2025-
2028 will average 0.1%. Over this period, high interest rates on auto loans and high auto prices, potentially further impacted by tariffs, will decelerate the growth in the number of new registrations in 2025 to -1.1%. In 2028, Florida’s new passenger car and truck registrations will be slightly over 1.38 million.
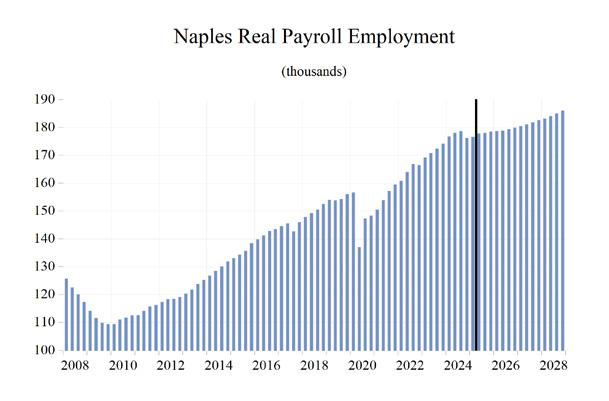
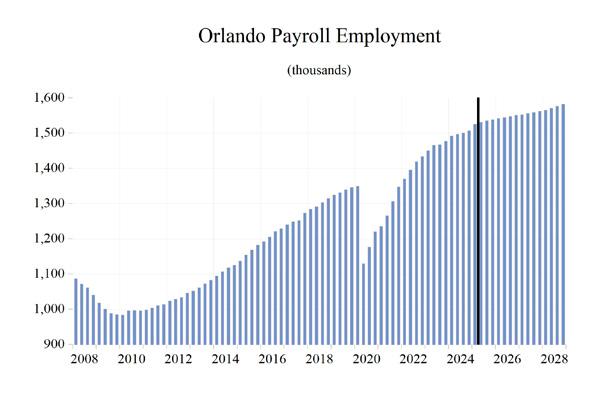
EMPLOYMENT
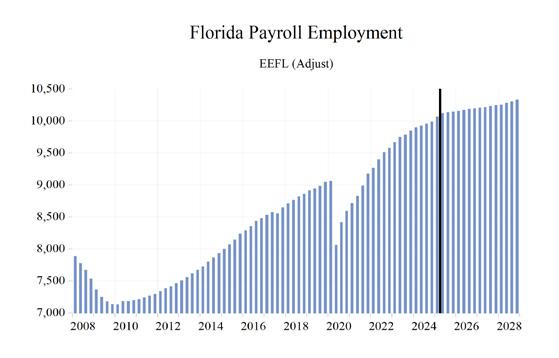
Business payrolls were devastated by the illconceived COVID-19 lockdowns, as layoffs happened in a massive, but thankfully short-lived, wave. In Florida, total business payrolls surpassed their pre-pandemic levels late in 2021, as Florida ended ill-advised lockdowns much sooner than most other states. Since then, the strength of Florida’s labor market has exceeded that of the national job market, and it will continue to do so throughout the remainder of our forecast horizon in 2028.
The COVID-19 lockdowns, closures, and travel restrictions were followed by aggressive federal spending and monetary policies to counter the devastating effects of shutting down the economy. This added fuel to an economy that was roaring back to life and had a strong impact on the labor market.
Job growth plummeted in March and April because of lockdowns, contributing to a 4.9% year-over-year contraction in 2020, but Florida’s decision to open the economy and avoid further lockdowns caused job growth to roar back to 4.6% in 2021, accelerating to 5.7% in 2022.
In 2024, the effects of the slowing economy impacted job growth. Total payroll jobs rose by 3.4% in 2023 and then decelerated to 1.8% growth in 2024 and 2025. The deceleration will resume to 0.6% in 2026 and 0.5% in 2027, before ticking up 0.7% in 2028. Florida’s labor market will continue to outperform the national economy each year through 2028.
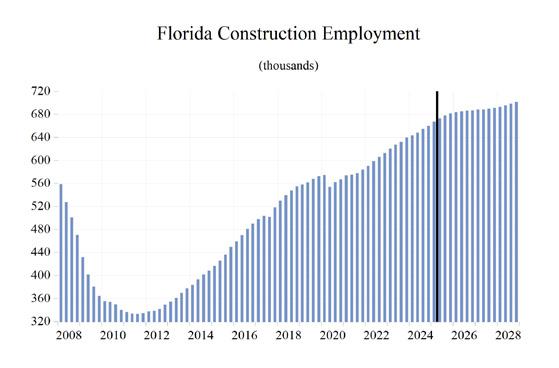
Construction job growth turned slightly negative in 2020 but increased in 2021, with housing starts rising amid depleted inventories and as large-scale public works projects carried on uninterrupted by COVID. Construction job growth fell to -0.1% in 2020 and then recovered to 2.4% in 2021. Job growth rose further to 4.2% in 2022 and grew by 4.6% in 2023, and then by 3.4% in 2024. Job growth will tick up to 3.5% in 2025 before easing to 1.6% in 2026, and 0.5% in 2027 then rise to 1.1% in 2028. Average annual job growth during 2025-2028 will be 1.7%. Construction employment will average 697,474 in 2028.
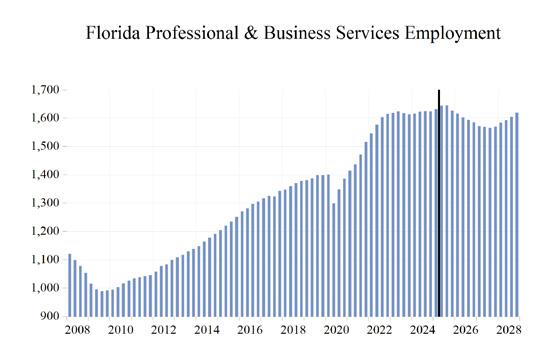
The Professional and Business Services sector, one of the fastest-growing sectors coming out of the COVID recession, is in for a deceleration as the economic slowdown develops. Job growth in this sector is expected to average -0.3% during 2025-2028. Growth in this sector fell to -2.3% in 2020 due to the pandemic and lockdowns. Growth surged to 7.4% in 2021 and then to 8.6% in 2022. It slowed to 2.1% in 2023 and continued to trend lower at 0.2% in 2024. In 2025, growth should be 0.9%; then after a couple of years of job losses of 2.3% and 1.9% in 2026 and 2027, growth resumes at 2.0% in 2028.
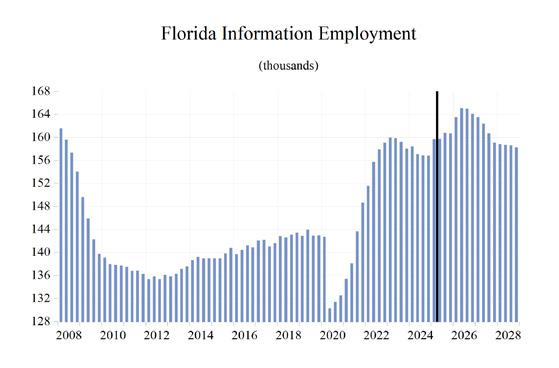
The Information sector is a mix of high-tech ventures, including computer programming and software development, but job growth in this sector has long been weighed down by the unraveling of the traditional print media. Structural and technological changes in the gathering and dissemination of information have decimated the print industry. Sources of growth within the information sector in Florida such as software development, data processing and hosting, wireless telecommunications, and content creation have offset the loss of jobs in traditional print media and publishing. Job growth dropped to -6.2% in 2020, recovered to 5.4% in 2021, and hit 10.3% in 2022—boosted by the roll-out of 5G wireless services. Job growth slowed to 2.1% in 2023 before it slid to -1.2% in 2024. Growth
should come in at 1.9% in 2025 and 2.6% in 2026 and then contract by 1.8% in 2027 and 1.7% in 2028. The projected growth rate will average 0.2% during 2025-2028.
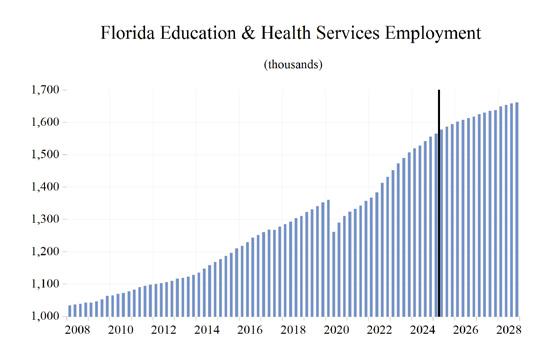
The Education and Health Services sector in Florida has grown consistently, even during the worst part of the 2007-2009 Great Recession. However, the pandemic hit this sector hard, as schools closed and most elective procedures, screenings, and wellness checks were postponed; employment contracted by 2.4% in 2020. The state’s growing population, with a larger share of older residents with a higher demand for health services, has supported growth in this sector and will continue to do so. Job growth will continue, though at a decelerated pace, through the next several years. During 2025-2028, employment in this sector is expected to continue to expand at an average rate of 1.9 percent.
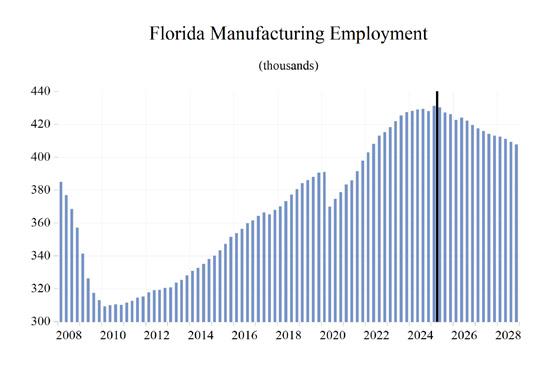
During 2016-2019, Manufacturing job growth averaged 2.9% in Florida, as trade policies helped level the playing field for U.S. manufacturers. The economic environment for the manufacturing sector is increasingly uncertain as slower economic growth looms over the U.S. and the “Tariff Tango” in Washington, DC is in full swing. After job losses of 2.2% in manufacturing in 2020, the economy and manufacturing in Florida came back to life. Job growth accelerated to 2.9% in 2021 and rose by 5.2% in 2022. After that year’s burst, job growth decelerated to 3.2% in 2023 and then slowed to 1.3% in 2024; the sector will once again lose jobs from 2025 through 2028. Average job growth during 2025-2028 will be -1.1 percent.
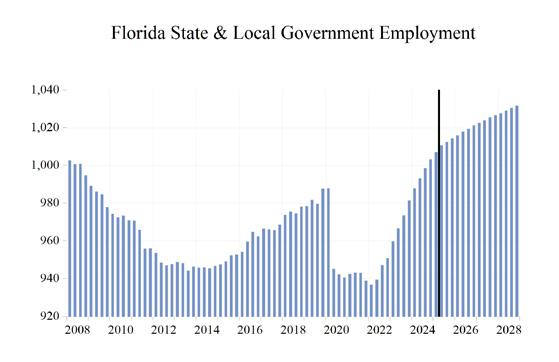
The State and Local Government sector in Florida is enjoying higher revenues from increased property values and state sales tax revenues that continue to exceed forecasts. As housing prices soared during 2020-22, property tax revenues rose as well. Though housing price growth has slowed, there will not be a repeat of the local government budget shortfalls after the housing market crashed, which led to job losses in this sector that
persisted for six years from 2009 through 2014.
As Florida’s population and economy continue to grow, the demand for state and local government services continues to rise as well. To meet this demand, growth in state and local government employment will be necessary but not to the levels seen during the housing boom, despite DOGE arriving in Tallahassee. Average job growth in State and Local Government during 2025-2028 will be 0.8%, after annual growth hit 2.8% in 2023 and slowed to 2.6% in 2024. The slowing economy and softening housing market may eventually put some pressure on both sales and property tax revenue growth, but this should not result in any severe budgetary issues or layoffs in the sector.
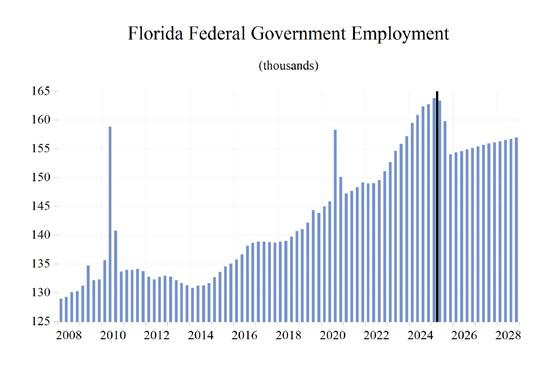
Federal Government employment growth, which was boosted by the decennial census hiring, turned negative in 2021 after the temporary hiring surge during the 2020 census year ended. However, historic deficits, a national debt of over $37.0 trillion, and an increasing debt service burden along with any DOGE spending cuts that may stick will become considerable factors going forward and, as job growth in the Federal Government sector in Florida will average -0.7% during 2025-2028.
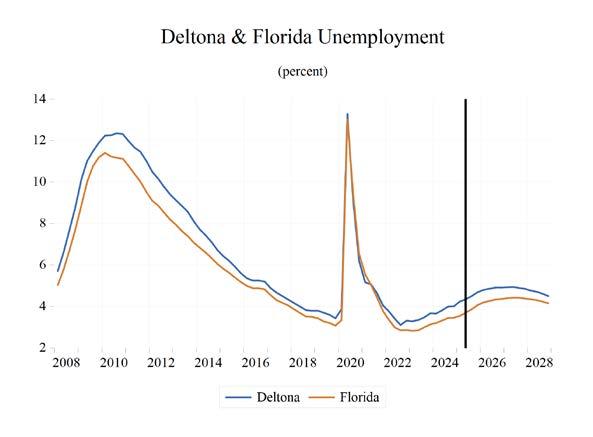
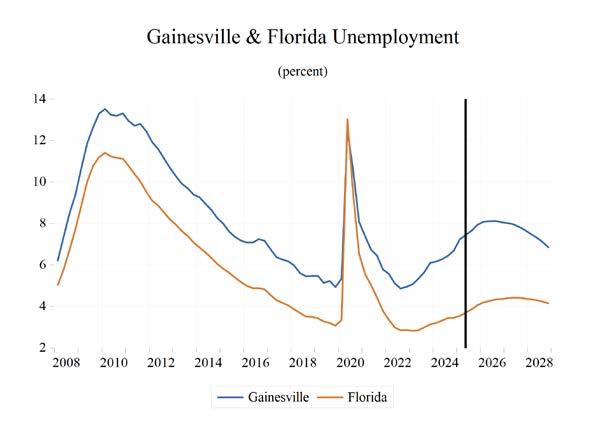
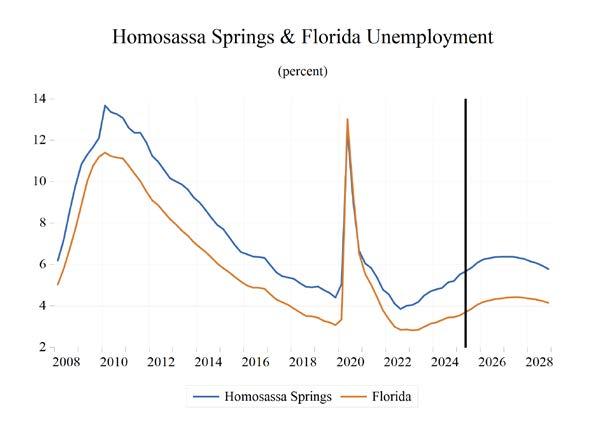
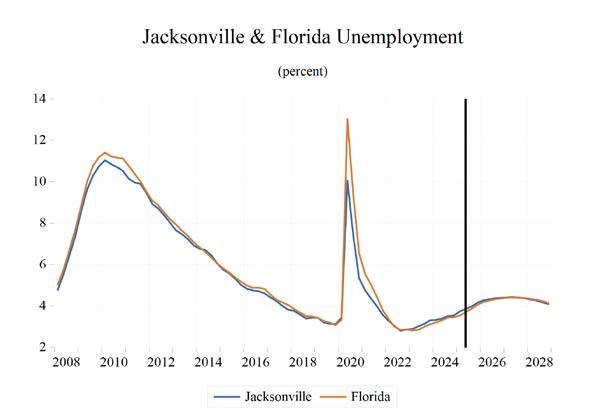
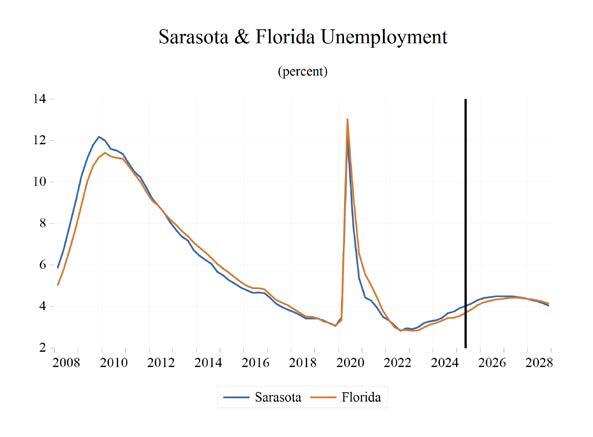
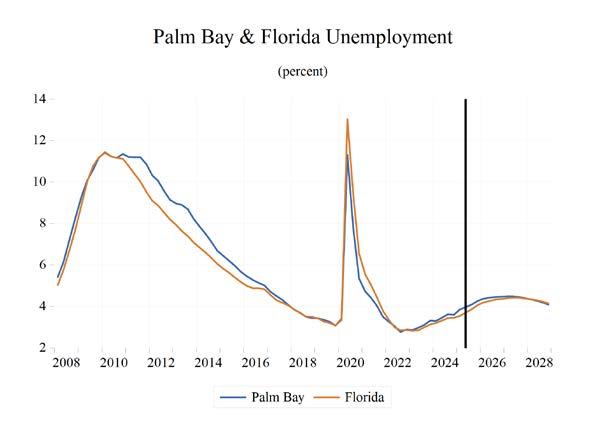
UNEMPLOYMENT
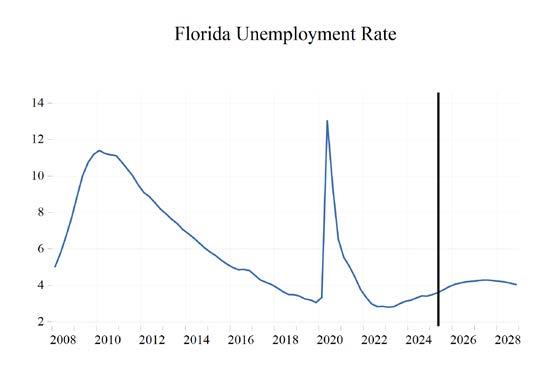
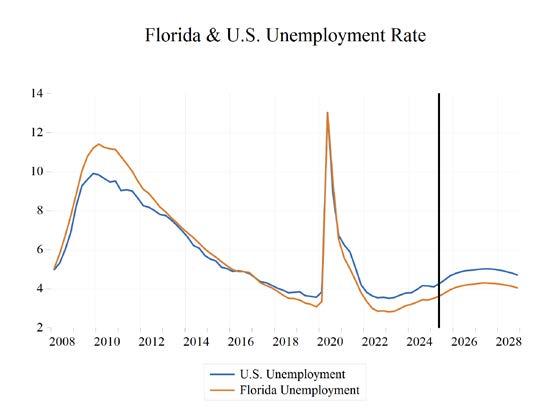
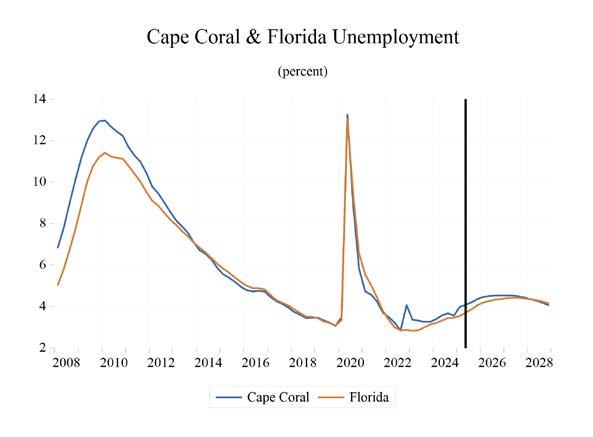
The unemployment rate in Florida has fallen from its May 2020 peak of 14.2% and stands at 3.7% as of April 2025. When unemployment spiked to 14.2% in May 2020, it was 2.9 percentage points higher than the peak level of unemployment from the Great Recession. This unprecedented spike in unemployment transpired over just three months, while it took two-and-a-half years for the unemployment rate to peak in the Great Recession. The April 2025 unemployment rate is up 0.4 percentage points from a year ago and is 0.5 percentage points lower than the U.S. unemployment rate.
Both nationally and in Florida, the number of workers who are working part-time, but not by choice, and workers marginally attached to the labor force—defined as workers who are not currently employed or seeking employment but express a desire to work, are available for a job, and have searched for work within the past 12 months—spiked during the public health shutdowns. When adding these groups with discouraged workers—defined as workers who are currently not working and did not look for a job in the four weeks preceding the Bureau of Labor Statistics’ monthly survey of households—to the headline unemployment figure, U-3, we get the broadest measure of unemployment estimated by the BLS, known as U-6.
Looking at U-6, we see a labor market in Florida that remains the strongest in several decades. U-6 in Florida averaged 6.9% during the second quarter of 2024 through the first quarter of 2025. Meanwhile, the national rate of U-6 averaged 7.5% during the same period. U-6 unemployment in Florida during the second quarter of 2024 through the first quarter of 2025 was 5.2 percentage points below the U-6 rate in 2014, 9.1 percentage points lower than the 16% rate in 2012, and down 12.4 percentage points from its peak average rate of 19.3% in 2010 (the nation’s U-6 averaged 16.7% in 2010). As the national economy continues to slow, these numbers will begin drifting slightly higher in Florida in an environment of a slowing national economy.
An analysis of how U-6 behaves relative to the headline unemployment rate (U-3) continues to provide additional information to fully comprehend the health of the labor market. The gap between these two measures continues to narrow. The average spread between U-6 and U-3 during the second quarter of 2024 through the first quarter of 2025 was hovering at 3.6% at the national level. That gap was 3.7% for the second quarter of 2024 through the first quarter of 2025 in Florida.
Table 1. Annual Summary of the University of Central Florida's Forecast for Florida 202020212022202320242025202620272028
Personal Income and GSP
PersonalIncome(Bil.$)1220.81358.81436.11553.41645.31726.11817.71923.62025.1
Florida.(%ChYearago)6.511.35.78.25.94.95.35.85.3
U.S.(%ChYearago)6.89.23.15.95.44.64.95.14.7
PersonalIncome(Bil.2012$)1159.61230.31209.41246.21286.61308.01342.61394.41442.4
Florida.(%ChYearago)4.46.1-1.73.03.21.72.63.93.4
U.S.(%ChYearago)5.74.9-3.32.12.81.22.23.12.9
Disp.Income(Bil.2012$)1032.41083.41042.21105.91141.31165.51203.21249.71293.3
Florida.(%ChYearago)4.04.9-3.86.13.22.13.23.93.5
U.S.(%ChYearago)6.33.5-5.65.12.71.62.83.22.9
GSP(Bil.$)1142.01298.61465.31600.81705.81801.41886.21957.82038.3 (%ChYearago)0.713.712.89.26.65.64.73.84.1
GSP(Bil.2012$)1069.81170.51239.91292.81339.81363.21387.91411.61439.7 (%ChYearago)-1.49.45.94.33.61.71.81.72.0
Employment and Labor Force (Household Survey % Change Year Ago)
Employment-4.94.65.73.41.81.80.60.50.7
LaborForce-2.02.53.93.11.22.00.70.60.6
FLUnemploymentRate(%)8.14.73.03.03.33.74.24.34.2
U.S.UnemploymentRate(%)8.15.43.63.64.04.44.95.04.8
Nonfarm Employment (Payroll Survey % Change Year Ago)
TotalNonfarm
U.S.-5.82.94.32.21.31.00.20.20.3 Florida-4.94.65.73.41.81.80.60.50.7 Mining-3.7-0.92.83.6-1.21.10.42.20.6 Construction-0.12.44.24.63.43.51.60.51.1 Manufacturing-2.22.95.23.21.30.0-1.5-1.7-1.2 NondurableGoods-3.32.65.22.81.2-0.1-1.0-1.1-0.9 DurableGoods-1.73.15.23.41.30.1-1.8-1.9-1.3 Trans.Warehs.&Utility-3.25.25.12.21.21.10.51.0-0.5 WholesaleTrade-2.82.85.73.61.61.51.11.2-0.1 RetailTrade-4.74.04.01.70.90.6-0.31.0-1.0 FinancialActivities0.15.06.32.80.72.21.50.80.3 Prof.andBusinessServices-2.37.48.62.10.20.9-2.3-1.92.0 Edu&HealthServices-2.42.64.45.93.72.91.81.41.5 Leisure&Hospitality-19.711.110.54.71.82.12.21.30.3 Information-6.25.410.32.1-1.21.92.6-1.8-1.7 FederalGov't.4.9-1.21.13.64.0-0.7-3.40.70.5 State&LocalGov't.-2.8-1.30.22.82.61.60.70.60.5
Population and Migration
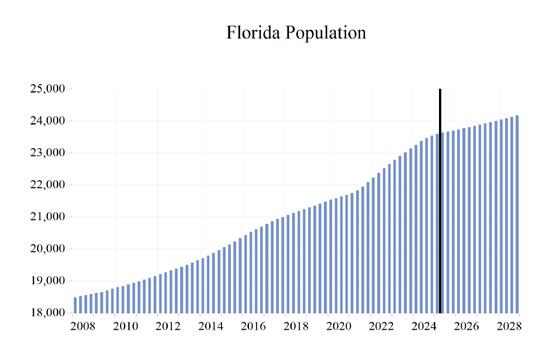
Population(ths)21614.021901.922447.322963.723409.023650.423789.923945.224109.9 (%ChYearago)1.11.32.52.31.91.00.60.70.7
NetMigration(ths)60.0109.5148.4122.8102.142.438.542.445.5 (%ChYearago)6.182.535.5-17.3-16.9-58.4-9.210.27.3
HousingStartsTot.Private(ths)157.6193.0193.7183.6164.7163.1164.7163.9165.4
HousingStartsSingleFamily(ths)111.5144.0133.7127.1123.8116.9113.3109.5106.1
HousingStartsMulti-Family(ths)46.149.059.956.540.946.251.454.559.3
(%ChYearago)1.25.49.66.13.03.32.92.22.1 Consumer Prices Housing
Table 2. Quarterly Summary of the University of Central Florida's Forecast for Florida*
2025Q12025Q22025Q32025Q42026Q12026Q22026Q32026Q42027Q12027Q22027Q32027Q42028Q1
Personal Income and GSP
PersonalIncome(Bil.$)1698.41720.31734.01751.71778.61806.11830.31855.91885.51911.51936.61960.71986.9
Florida.(%ChYearago)1.81.30.81.01.51.51.31.41.61.41.31.21.3
U.S.(%ChYearago)1.61.30.70.91.51.41.21.21.41.21.11.11.3
PersonalIncome(Bil.2012$)1307.61304.41307.21312.91324.31337.61348.51360.11375.71388.31401.31412.21424.4
Florida.(%ChYearago)0.9-0.30.20.40.91.00.80.91.10.90.90.80.9
U.S.(%ChYearago)0.7-0.30.10.40.80.80.60.71.00.70.70.60.8
Disp.Income(Bil.2012$)1158.11155.71171.61176.61187.01198.81208.41218.71232.91244.21255.91265.81277.1
Florida.(%ChYearago)0.8-0.21.40.40.91.00.80.91.20.90.90.80.9
U.S.(%ChYearago)0.7-0.31.10.40.90.80.60.71.00.70.70.60.8
GSP(Bil.$)1757.31797.41815.61835.31859.61876.11895.11913.91930.71949.11965.91985.72005.6
(%ChYearago)1.02.31.01.11.30.91.01.00.91.00.91.01.0
GSP(Bil.2012$)1355.61361.51365.11370.51377.91384.51391.71397.51402.81408.41414.31420.81427.0
(%ChYearago)0.10.40.30.40.50.50.50.40.40.40.40.50.4
Employment and Labor Force (Household Survey % Change Year Ago)
Employment0.80.50.20.10.10.10.10.10.10.10.10.10.1
LaborForce1.20.60.10.10.20.20.20.20.20.20.20.10.1
FLUnemploymentRate(%)3.53.63.84.04.14.14.24.24.34.34.34.34.2
U.S.UnemploymentRate(%)4.14.34.54.74.84.94.95.05.05.05.05.04.9
Nonfarm Employment (Payroll Survey % Change Year Ago)
TotalNonfarm
U.S.0.30.30.10.00.10.10.10.10.00.00.00.10.1
Florida0.80.50.20.10.10.10.10.10.10.10.10.10.1
Mining1.20.1-0.1-0.2-0.20.40.60.50.70.70.20.2-0.1 Construction1.10.80.80.60.30.20.20.10.20.00.20.20.3
Manufacturing0.7-0.2-0.7-0.2-0.80.3-0.4-0.6-0.5-0.4-0.4-0.2-0.2 NondurableGoods0.20.1-0.6-0.2-0.3-0.1-0.4-0.4-0.2-0.3-0.3-0.3-0.1
DurableGoods1.0-0.3-0.8-0.2-1.10.5-0.4-0.8-0.6-0.5-0.5-0.2-0.2 Trans.Warehs.&Utility0.50.50.0-0.10.00.20.40.30.40.20.1-0.2-0.6 WholesaleTrade0.70.30.30.00.30.30.50.40.50.2-0.1-0.10.2 RetailTrade0.40.5-0.3-0.4-0.30.20.30.10.40.30.3-0.2-1.2 FinancialActivities1.10.50.30.50.60.20.30.10.30.20.1-0.10.5
Prof.andBusinessServices0.50.70.1-1.2-0.6-0.8-0.6-0.6-0.8-0.2-0.20.20.9
Edu&HealthServices0.60.80.60.50.50.40.30.30.50.30.30.20.7 Leisure&Hospitality1.30.40.31.10.50.30.50.50.10.10.40.5-0.9 Information1.80.00.60.01.80.9-0.1-0.5-0.3-0.7-1.0-1.0-0.1 FederalGov't.0.7-0.3-2.2-3.60.20.20.20.20.20.20.10.10.1
State&LocalGov't.0.40.30.20.20.20.20.10.20.10.10.10.10.1
Population and Migration
Population(ths)23,597.523,634.723,668.123,701.423,735.423,770.723,807.423,845.923,885.523,925.223,965.024,005.224,045.6 (%ChYearago)0.20.20.10.10.10.10.20.20.20.20.20.20.2
NetMigration(ths)58.939.635.635.636.337.639.141.042.142.442.442.843.2
(%ChYearago)-22.5-32.8-10.20.02.23.54.04.82.90.60.10.90.8
HousingStartsTot.Private(ths)159.8163.2166.1163.0164.0164.3165.4165.0164.5164.1163.5163.7164.1
HousingStartsSingleFamily(ths)116.2117.2117.7116.3114.7113.8112.7111.8110.8109.8108.9108.2107.2
HousingStartsMulti-Family(ths)43.646.048.446.849.350.552.753.253.754.254.555.557.0
Housing Consumer Prices
(%ChYearago)0.91.30.70.60.80.60.60.70.50.50.30.60.5
*Quarterlyatanannualrate
Table 3. Employment Quarterly* 2025Q12025Q22025Q32025Q42026Q12026Q22026Q32026Q42027Q12027Q22027Q32027Q42028Q1
Florida Payroll Employment (Thousands)
TotalNonfarm10,068.010,120.210,140.510,147.210,159.810,171.210,186.310,197.210,207.010,218.510,231.510,244.010,255.5
Manufacturing431.1430.4427.2426.2422.7424.1422.3419.6417.6415.9414.1413.1412.4
DurableGoods297.2296.3293.9293.2290.0291.5290.3288.0286.4285.0283.6283.0282.5
WoodProducts14.714.814.615.415.516.016.116.216.316.516.716.817.0
Computer&Electronics48.648.548.748.848.848.949.049.049.149.149.149.048.8
TransportationEquipment56.556.054.854.153.754.454.754.754.554.253.853.653.4 Nondurables134.0134.1133.3133.1132.7132.5132.0131.6131.2130.9130.5130.1130.0 Foods39.439.439.539.639.639.739.739.739.839.839.839.940.0
Non-Manufacturing9,636.99,689.89,713.39,721.09,737.19,747.29,764.09,777.79,789.49,802.79,817.49,830.99,843.1 Mining5.85.85.85.85.75.85.85.85.95.95.95.95.9 Construction667.3672.8678.0681.9684.0685.5686.9687.4688.5688.8689.9691.5693.3 Trans.Warehs.&Utility2,006.52,017.02,017.72,015.62,015.42,020.02,028.12,033.62,041.62,045.92,048.32,045.12,033.5 WholesaleTrade401.2402.5403.8403.9405.2406.3408.3409.8412.0412.8412.4411.9412.6 RetailTrade1,162.71,168.61,165.21,160.81,157.31,159.31,163.31,164.81,169.21,172.21,175.31,172.51,158.7 Information159.7159.8160.8160.7163.5165.1165.0164.1163.5162.4160.7159.1158.9 Prof.&Bus.Services1,632.71,644.31,645.91,626.91,616.51,603.61,594.61,585.11,572.11,568.91,566.41,570.11,584.6 Admin.&Support765.6769.0772.0767.5763.3756.5749.4743.5737.6737.1735.7733.6733.0 Prof.Sci&Tech137.5138.0138.6139.0139.4139.7140.0140.3140.3140.2140.2140.1140.5 Mgmt.ofCo.729.7737.4735.3720.3713.8707.4705.2701.3694.2691.5690.5696.4711.0 FinancialActivities699.4702.6704.5708.2712.4713.5715.6716.5718.9720.0720.8720.3723.9 RealEstate&Rent469.7471.1471.6475.2479.0480.4482.7483.5485.5486.3487.0486.5489.3 Fin.&Insurance229.8231.5233.0233.0233.4233.1232.9233.1233.4233.8233.8233.8234.6 Edu.&HealthService1,564.91,577.21,586.31,594.51,601.81,607.91,612.41,617.81,625.11,630.31,634.91,637.71,649.0 EducationServices211.0212.2213.8213.4212.9211.0210.1210.3211.6212.9214.3215.9218.7 HealthServices1,354.01,365.01,372.51,381.11,388.91,396.91,402.31,407.51,413.51,417.41,420.61,421.91,430.3 Leisure&Hospitality1,341.81,346.81,350.81,366.01,372.91,377.71,384.31,391.71,393.61,395.71,401.31,407.81,395.0 OtherServices387.8389.5391.0393.0394.4395.6396.9399.2402.2405.0407.7410.6415.0 Government1,170.91,174.01,172.31,168.41,170.41,172.61,174.41,176.41,177.91,179.71,181.31,182.71,184.0 FederalGov't.163.9163.4159.8154.1154.4154.6154.9155.2155.4155.7155.9156.2156.4 State&LocalGov't1,007.11,010.61,012.51,014.31,016.01,017.91,019.51,021.21,022.51,024.01,025.41,026.61,027.6
*Quarterlyatanannualrate
202020212022202320242025202620272028
Florida Payroll Employment (Thousands)
TotalNonfarm8,533.98,928.29,439.69763.779,943.010,119.010,178.610,225.310,294.5
Manufacturing378.6389.7409.9423.2428.6428.7422.1415.2410.2
DurableGoods259.5267.5281.4291.1294.9295.1290.0284.5280.7
WoodProducts14.014.315.215.214.714.915.916.616.9
Computer&Electronics44.344.345.547.148.048.748.949.148.6 TransportationEquipment48.350.754.057.057.555.354.454.052.8
Nondurables119.1122.2128.5132.1133.7133.6132.2130.7129.5 Foods33.634.235.737.539.339.539.739.840.1
Non-Manufacturing8,155.38,538.59,029.79,340.69,514.49,690.29,756.59,810.19,884.3 Mining5.55.45.65.85.75.85.85.95.9
Construction564.6577.9602.4630.2651.9675.0685.9689.7697.5 Trans.Warehs.&Utility1,740.51,831.31,925.61,968.61,992.22,014.22,024.32,045.22,034.3 WholesaleTrade347.0356.7377.0390.6396.8402.9407.4412.3411.9 RetailTrade1,042.91,085.01,128.11,147.41,157.91,164.31,161.21,172.31,160.3 Information134.3141.5156.1159.3157.3160.2164.4161.4158.6 Prof.&Bus.Services1,359.11,460.21,585.71,619.01,622.21,637.51,599.91,569.41,601.0 Admin.&Support602.5651.2710.6739.9755.8768.5753.2736.0729.3
Prof.Sci&Tech111.8115.6125.9134.3136.4138.3139.8140.2140.1 Mgmt.ofCo.644.8693.4749.3744.7730.0730.7706.9693.2731.5
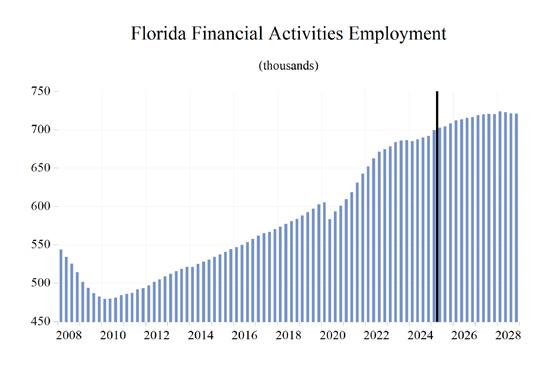
FinancialActivities595.9625.6665.3683.7688.7703.7714.5720.0722.3
RealEstate&Rent408.2429.2454.3465.4466.3471.9481.4486.3488.3
Fin.&Insurance187.7196.5211.0218.3222.4231.8233.1233.7234.1
Edu.&HealthService1,305.31,339.11,398.61,480.71,536.21,580.81,610.01,632.01,655.8 EducationServices168.3178.0191.8203.5211.3212.6211.1213.7220.7
HealthServices1,137.01,161.11,206.91,277.21,324.91,368.21,398.91,418.31,435.1
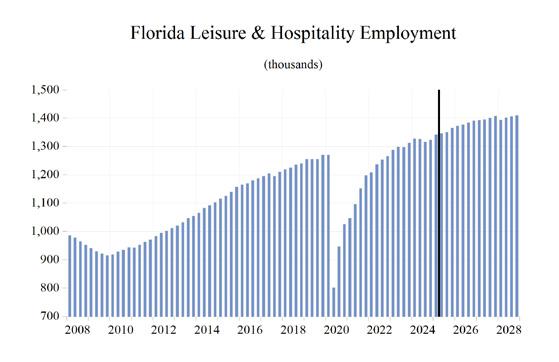
Leisure&Hospitality1,011.51,123.41,241.61,299.91,323.61,351.41,381.61,399.61,403.6
OtherServices334.9344.1355.6368.0379.6390.3396.5406.4418.9 Government1,103.81,090.11,093.31,125.51,157.11,171.41,173.41,180.41,186.4
FederalGov't.149.9148.1149.7155.1161.4160.3154.8155.8156.7
State&LocalGov't954.0942.0943.5970.3995.71,011.11,018.71,024.61,029.7
Billions Current Dollars
PersonalIncome1698.41720.31734.01751.71778.61806.11830.31855.91885.51911.51936.61960.71986.9
Wages&Salaries754.7764.5772.2781.7793.0802.4812.2822.8833.3844.0854.5864.5874.9
OtherLaborIncome152.5154.9157.3158.8161.0162.4164.0165.8167.9169.5171.2173.1175.5
Nonfarm88.590.491.992.695.196.298.098.999.499.9100.4101.2101.5
Farm1.21.61.11.21.31.31.41.51.51.61.71.81.8
PropertyIncome471.9476.4476.4479.0483.4495.7503.5512.0521.9531.8540.5548.4556.0
TransferPayments343.6347.7351.2355.4363.8368.1372.3377.1384.9389.4393.7398.4406.0
SocialInsurance118.3119.5120.4121.4123.3124.4125.6126.6128.0129.2129.9131.2133.3
Billions 2012 $
PersonalIncome1307.61304.41307.21312.91324.31337.61348.51360.11375.71388.31401.31412.21424.4
Wages&Salaries581.0579.7582.1585.9590.5594.3598.4603.0608.0613.0618.3622.7627.2 OtherLaborIncome117.4117.5118.6119.0119.9120.3120.9121.5122.5123.1123.9124.7125.8 Nonfarm68.168.569.369.470.871.272.272.572.572.572.672.972.8 Farm0.91.30.90.90.91.01.01.11.11.21.21.31.3
PropertyIncome363.3361.2359.1359.0359.9367.1371.0375.2380.8386.2391.1395.0398.6
TransferPayments264.5263.6264.7266.4270.9272.6274.3276.3280.8282.8284.9286.9291.0 SocialInsurance91.190.690.891.091.892.192.592.893.493.894.094.595.6
NewPassengerCar&TruckRegistrations1457.31416.61311.41291.81286.01301.31328.71348.71350.51356.81362.01362.91368.7
RetailSales(Billions$)524.8534.2531.2533.2538.0544.3551.8559.3566.3573.8580.4586.7591.4
RealRetailSales(Billions2012$)404.1405.1400.4399.7400.6403.1406.5409.9413.2416.8420.0422.6424.0
*Quarterlyatanannualrate
Billions Current Dollars
PersonalIncome1220.81358.81436.11553.41645.31726.11817.71923.62025.1
Billions 2012 $
FLORIDA NEWS SUMMARIES
$18B proposed in Senate budget for transportation, economic development
• The Florida Senate’s proposed $117 billion budget prioritizes disaster funding, transportation infrastructure, and housing affordability, including $13 billion for transportation projects and $1 billion for emergency management.
• Housing initiatives feature prominently, with nearly $183 million allocated to the SHIP Program, $150 million each for the Hometown Heroes and CDBG-DR programs, and over $71 million for affordable apartment development under SAIL.
• The plan includes strategic investments across multiple agencies, such as new funding for cultural grants, security upgrades, and equipment replacements, alongside a 4% pay raise for state workers and increased reserves to bolster emergency preparedness and reduce state debt.
Source: Florida Politics, March 28, 2025
Medicaid cuts could put a $3 billion hole in Florida’s economy, study predicts
• Proposed federal Medicaid cuts could trigger significant economic fallout in Florida,
including an estimated 33,000 job losses—half within health care—and a $3 billion decline in the state’s economic output over the next decade.
• The ripple effects of reduced federal funding would stretch beyond health care, impacting other industries and potentially forcing closures of nursing homes and community clinics that serve low-income residents.
• F lorida’s state and local governments could also lose approximately $177 million in tax revenue, making it harder to fund core public services like education and infrastructure.
Source: WUSF NPR, April 8, 2025
Governor Ron DeSantis Announces Infrastructure and Workforce Development Investments Through the Job Growth Grant Fund
• Governor Ron DeSantis awarded over $14.5 million through the Florida Job Growth Grant Fund to support infrastructure enhancements and workforce development, with a focus on bolstering key sectors like aerospace, aviation, and manufacturing.
• Indian River State College and Miami Dade College will receive funding to launch advanced training programs in industrial manufacturing and aircraft maintenance, helping meet regional workforce demands and accelerate job placement.
• Infrastructure investments in Sebring and Wakulla County will improve transportation efficiency and expand industrial capacity, positioning these regions for long-term economic growth and business attraction.
Source: Office of the Governor, April 23, 2025
Here’s how Florida is already feeling the effect of Trump’s tariffs
• F lorida businesses are grappling with rising import tariffs, prompting many to increase prices, delay expansion plans, or seek short-term strategies like bulk buying and foreign trade zones to absorb extra costs.
• Industries such as manufacturing, construction, and hospitality are particularly vulnerable, as they rely heavily on imported materials like steel, lumber, coffee, and tea, all now subject to steep duties.
• Uncertainty around shifting tariff policies are causing hesitation among small business owners who may struggle to plan ahead, and many, like TeBella Tea Company, are already experiencing financial strain and cautious consumer spending.
Source: Tampa Bay Times, May 24, 2025
Tallahassee-based WeatherStem collaborates with Disney in new monitoring partnership
• WeatherStem, a Florida weather technology company known for its real-time alert systems, has partnered with Disney SyncLink Technology to develop a global weather monitoring network—dubbed the “Disney Mesonet.” The system will provide real-time, hyper-local weather data across Disney’s global portfolio of theme parks, cruise lines, and resorts.
• The collaboration was initiated through the Florida Division of Emergency Management, which previously worked with WeatherStem to implement the Florida Severe Weather Mesonet, a statewide network of solar-powered weather stations supporting public safety and emergency response.
• Th is partnership aims to centralize and enhance Disney’s weather safety protocols, particularly for outdoor and marine operations. The initiative is expected to enhance disaster preparedness and improve beach and surf safety at Disneyaffiliated locations, highlighting Florida’s ongoing leadership in applied climate and safety technologies.
Source: Tallahassee Democrat, May 28, 2025
Royal Palm Square in Fort Myers set for demolition, new growth ahead
• The reimagined Royal Palm Square will feature new residential units, medical office space, a hotel, and commercial buildings, replacing the previously stalled retail and luxury apartment plans, creating a diverse economic base likely to attract millions in private investment to Fort Myers.
• The eastern half of the property is slated for demolition starting next month, setting the stage for phased redevelopment and job creation across healthcare, hospitality, and construction sectors, a timely revitalization of an underperforming commercial asset.
• With only three tenants currently operating in the square, including the 32-year-old Broadway Palm Theater, the redevelopment promises a major commercial boost, potentially increasing tenant occupancy by over 500% upon project completion and drawing more foot traffic into the area.
Source: WINK, April 4, 2025
Construction to begin on affordable housing communities in Fort Myers, East Naples
• DeAngelis Diamond and McDowell Housing Partners are investing over $75 million to construct 304 affordable housing units across Fort Myers and East Naples, directly supporting local construction jobs and longterm economic stability.
• Ekos Creekside’s 160 units and Ekos on Evans’ 144 units will prioritize residents earning up to 80% of the area median income, addressing the needs of the 54% of Collier County households earning $45,000 or less.
• The projects leverage diverse funding sources, including $3.75 million in Collier County surtax funds and federal Community Development Block Grant –Disaster Recovery dollars, amplifying the impact of Florida’s 4% Low Income Housing Tax Credit program and enhancing regional housing affordability.
Source: GulfShore Business, April 29, 2025
Cape Coral Considers Launching a Tourist Development Fund- Funded by Rental Registration Fees
• The proposed increase in Cape Coral’s residential rental registration fee from a onetime $35 to an annual $600 per unit could generate significant recurring revenue to fund tourism initiatives without using general taxpayer dollars.
• A ll proceeds from the new Tourist Development Fund would come exclusively from tourist-generated rental fees, enabling strategic investments in cultural venues, athletic facilities, and local attractions to stimulate long-term economic growth and increased visitor spending.
• In addition to boosting Cape Coral’s tourism economy, the increased fee would fund code enforcement targeting property upkeep, noise control, and absentee landlords, contributing to economic vitality through neighborhood stabilization and improved quality of life.
Source: Cape Coral Florida, May 21, 2025
Cape Coral considers $600 yearly fee for rental property owners
• Imposing a $600 annual fee on approximately 10,000 residential rental properties could generate over $6 million per year, fueling large-scale economic development projects like recreation centers, swimming pools, or a performing arts hall —amenities currently lacking in Cape Coral.
• The proposed 1,600% jump from a $35 onetime fee to a $600 recurring annual fee could increase rents by an estimated $50/month per unit, disproportionately affecting working-class families and potentially worsening the city’s 29.7% rental vacancy rate.
• City officials estimate that revenue from the proposed fee could help unlock $250 million to $500 million in tourism-enhancing infrastructure, positioning Cape Coral as a more competitive destination and stimulating local job creation and business investment.
Source: Gulfshore Business, May 22, 2025
Long Term Outlook for Cape Coral-Fort Myers, FL
June 2025 Forecast
Personal Income (Billions $)
202020212022202320242025202620272028
TotalPersonalIncome44.948.550.655.058.561.765.469.673.8
PctChgYearAgo8.38.04.48.76.45.56.06.46.1
WagesandSalaries14.616.518.620.021.222.223.324.726.1
NonwageIncome30.332.032.035.037.339.542.144.947.7
RealPersonalIncome(12$)43.744.542.844.546.147.248.750.953.0
PctChgYearAgo6.81.8-3.94.03.72.23.34.44.3
PerCapitaIncome(Ths)58.361.061.165.067.870.874.277.881.4
RealPerCapitaIncome(12$)56.856.051.752.653.554.255.356.958.5
AverageAnnualWage(Ths)54.357.862.164.867.269.873.076.379.3
PctChgYearAgo7.76.47.54.43.73.84.64.53.9
Establishment Employment (Place of Work, Thousands, SA)
TotalEmployment267.8283.8297.4306.8313.9316.8317.9322.0327.6
PctChgYearAgo-3.86.04.83.12.30.90.31.31.8
Manufacturing6.57.27.98.28.38.38.28.18.1 PctChgYearAgo-0.811.210.63.41.40.2-1.4-1.3-0.8 Nonmanufacturing261.3276.6289.5298.5305.5308.4309.6313.8319.6
PctChgYearAgo-3.85.94.63.12.30.90.41.41.8
Construction&Mining32.834.636.841.142.844.044.645.246.3 PctChgYearAgo0.55.46.611.74.02.81.31.42.5 Trade,Trans,&Utilities53.556.258.359.960.861.561.262.162.1 PctChgYearAgo-2.35.03.92.71.51.1-0.41.40.0 WholesaleTrade7.98.38.58.99.29.59.69.89.9 RetailTrade39.641.542.943.844.244.443.944.443.9 Trans,Wrhsng,&Util6.16.46.97.37.47.67.88.08.2 Information2.93.13.33.63.63.63.73.73.8 PctChgYearAgo0.97.68.76.50.8-0.53.30.91.0 FinancialActivities13.514.315.515.615.616.016.416.917.4 PctChgYearAgo-3.25.97.71.00.12.72.13.13.3 Prof&BusinessServices36.840.543.844.844.944.743.242.643.6 PctChgYearAgo-2.310.38.12.30.0-0.3-3.4-1.52.4 Educ&HealthServices30.632.133.334.535.636.837.538.439.3 PctChgYearAgo-2.44.73.93.63.23.41.92.22.4 Leisure&Hospitality37.241.342.641.142.240.541.542.443.0
PctChgYearAgo-14.711.03.1-3.52.9-4.02.22.21.5 OtherServices10.711.111.412.012.812.913.313.814.5
PctChgYearAgo-7.24.32.35.36.41.32.73.94.9 FederalGovernment2.62.42.42.52.62.62.42.42.5
PctChgYearAgo8.0-7.11.44.21.5-0.3-5.30.51.2 State&LocalGovernment40.841.142.043.444.745.845.946.447.1
PctChgYearAgo-0.60.72.23.33.02.60.11.11.6
Other Economic Indicators
Population(Ths)769.5795.4827.8846.4862.1870.7880.8894.1907.0
PctChgYearAgo2.43.44.12.21.91.01.21.51.4
LaborForce(Ths)335.2348.2361.1370.8375.8381.1385.4390.3395.1 PercentChange,YearAgo-0.63.93.72.71.41.41.11.31.2
UnemploymentRate(%)7.84.33.43.33.54.24.54.54.2
TotalHousingStarts11002.712099.211753.712695.714504.513208.811284.111019.111156.5
Single-Family6609.110674.29093.48544.810597.29537.57372.16698.96459.1
Multifamily4393.61425.02660.44150.93907.33671.33912.04320.24697.4
PROFILES
The Crestview MSA is comprised of Okaloosa and Walton counties and is located in the northwest corner of the state. Crestview is known as the “Hub City” because of the convergence of Interstate 10, State Road 85, U.S. Highway 90, the Florida Gulf & Atlantic Railroad and the Yellow River and Shoal River in or near the city.
QUICK FACTS
• Metro population estimate of 304,418 as of 2023 (ACS 5-Year Estimate) (U.S. Census Bureau).
• Okaloosa County population estimate of 218,464 as of 2023 (ACS 5-Year Estimate).
• Walton County population estimate of 86,354 as of 2023 (ACS 5-Year Estimate).
• Civilian labor force of 139,464 in December 2024 (FRED, U.S. Bureau of Labor Statistics).
• A n unemployment rate of 2.9% as of December 2024, not seasonally adjusted. This amounts to 3,986 unemployed people (FRED, U.S. Bureau of Labor Statistics).
OUTLOOK SUMMARIES
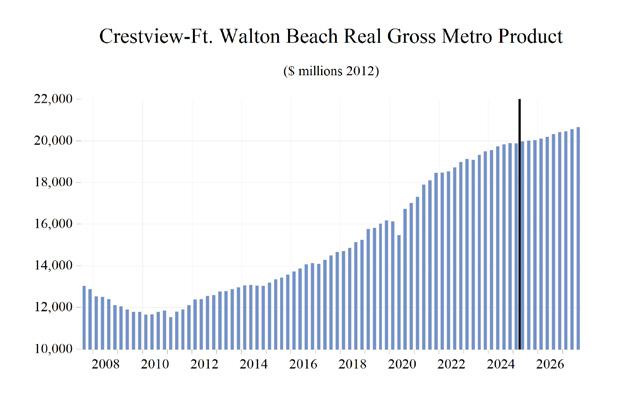
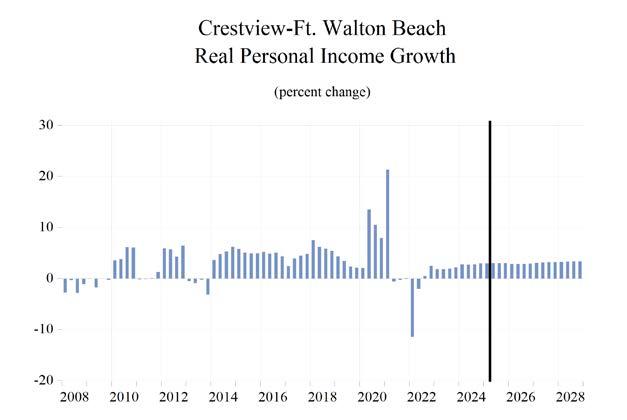
The studied economic indicators are predicted to show average levels of growth in the Crestview—Fort Walton Beach Metropolitan Statistical Area (MSA). Gross Metro Product for the MSA will come in at $20,465.85 million. The MSA will experience personal income growth of 5.6 percent, and real per capita income will be $63,100. Crestview will have the 3rd highest average annual growth rate at 4.5 percent, to $76,100. Crestview’s population will grow at an annual rate of 0.6 percent.
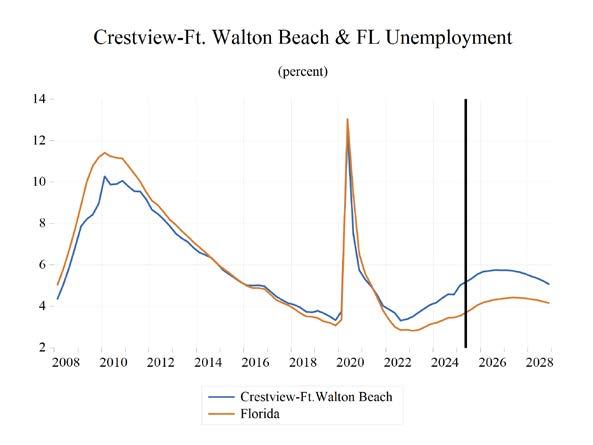
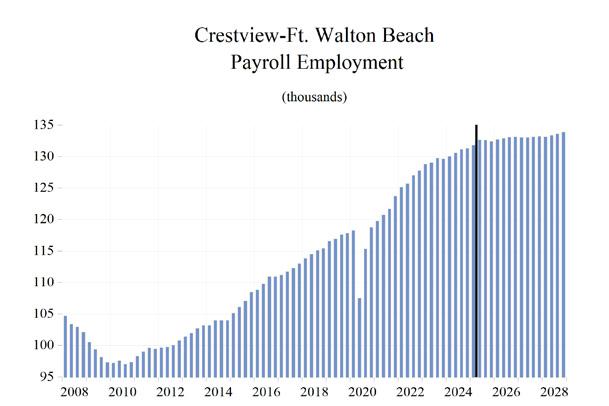
Crestview is expected to have the 3rd lowest employment growth rate at an average of 0.5 percent. The unemployment rate will be the 2nd lowest in the state at 3.8 percent.
The Financial sector will lead the MSA in average annual growth at 3.0 percent. The Other Services sector will follow at 2.5 percent. The Construction and Mining sector and the Professional and Business Services sector will see contractions in growth of -1.4 percent and -1.0 percent respectively.
METRO NEWS SUMMARIES
Okaloosa County will buy property for new tourism office and improve Cinco Bayou boat ramp
• The Okaloosa County Commission approved a $4.1 million package to purchase the former PNC Bank building in Cinco Bayou to serve as the new headquarters for the Tourist Development Department.
• The acquisition includes a 13,859-squarefoot, three-story building and two adjacent vacant lots, funded through a combination of tourism-related revenue sources, including $3.1 million from the Tourism Development budget and $750,000 from Cinco Bayou Tourism Development Tax funds.
• Community concerns raised during public meetings include issues related to security, traffic, and environmental preservation; officials have committed to addressing these through design and operational measures. A deed covenant between the county and the Town of Cinco Bayou will require mutual approval for any future land use changes, and officials emphasized the importance of preserving existing live oak trees on the property.
Source: NWF Daily News, March 5, 2025
City of Fort Walton Beach completes phase one of $8 million Landing Park renovations
• The $8 million renovation of Fort Walton Beach Landing is underway, with the first phase—focused on waterfront improvements— now complete. Key waterfront upgrades include a reinforced 700-foot seawall, a 10-foot-wide concrete boardwalk with aluminum handrails, bench seating, and new lighting fixtures.
• The second phase of the project involves interior park upgrades, including a new bandshell with tiered seating, replacement of restrooms, additional lighting, sidewalks, vendor electrical outlets, and a designated food truck area.
• The project is funded through a combination of grants and local revenue sources, including the Natural Resource Damage Assessment Grant, RESTORE Act funds, Okaloosa County taxes, and the city’s Community Redevelopment Agency, with no funding from the city’s General Fund.
Source: Get The Coast, March 25, 2025
New I-10 Exit Construction in Florida Continues
• The Florida Department of Transportation (FDOT) is continuing construction on the new I-10/P.J. Adams Interchange (Future Exit 53) and a related resurfacing project in Crestview.
• The resurfacing project spans from west of the Yellow River to mile marker 52 and from mile marker 54 to east of the Shoal River at mile marker 60, with shoulder gutters being installed to improve stormwater management and roadway safety.
• The resurfacing project is expected to be completed by mid-2025, while the interchange construction is projected to finish in late 2026.
Source: I-10 Exit Guide, April 2, 2025
FDOT to connect 1,300 Northwest Florida high school students with construction career opportunities
• The 5th Annual Northwest Florida Construction Career Days will take place on April 22– 23 at the Santa Rosa County Fairgrounds in Milton, offering over 1,300 high school students hands-on exposure to the transportation and construction industries.
• The event includes interactive experiences such as operating heavy equipment and learning about bridge inspections, paving, concrete work, traffic control, and engineering.
• The initiative supports FDOT District Three’s long-term workforce development strategy, addressing labor shortages amid billions of dollars in planned construction activity across Northwest Florida.
Source: Get The Coast, April 10, 2025
Williams International brings billion-dollar aerospace investment to Okaloosa County
• Williams International will invest over $1 billion to construct a one-million-square-foot aviation gas turbine engine manufacturing facility at Shoal River Industrial Park in Crestview, Okaloosa County. The project is expected to create more than 330 hightechnology jobs, making it one of the largest economic investments in Northwest Florida’s history.
• Construction will occur in three phases: the initial 250,000-square-foot facility is scheduled to begin later in 2025 and be completed by late 2026, with additional phases planned for 2028 and 2035–2036.
• The initiative was supported by a $3.2 million grant from the Florida Job Growth Grant Fund and involved collaboration among multiple state and local entities, including Triumph Gulf Coast, CareerSource Florida, and One Okaloosa EDC. Officials highlighted the project as a strategic win for Florida’s advanced manufacturing sector and a testament to longterm regional planning and public-private partnerships.
Source: Get The Coast, May 29, 2025
Long Term Outlook for Crestview-Fort Walton Beach-Destin, FL
June 2025 Forecast
Personal Income (Billions $)
202020212022202320242025202620272028
TotalPersonalIncome17.019.219.921.322.423.625.026.427.8
PctChgYearAgo6.713.53.47.14.95.55.95.75.2
WagesandSalaries7.88.79.49.810.310.811.311.912.5
NonwageIncome9.210.510.511.512.112.813.614.515.3
RealPersonalIncome(12$)17.118.317.518.118.518.919.520.220.9
PctChgYearAgo6.66.9-4.13.12.22.23.23.73.3
PerCapitaIncome(Ths)58.765.566.269.672.175.779.683.687.4
RealPerCapitaIncome(12$)59.262.158.258.959.560.562.164.065.7
AverageAnnualWage(Ths)57.961.864.365.868.270.874.377.981.4
PctChgYearAgo8.26.64.12.33.73.74.94.94.5
Establishment Employment (Place of Work, Thousands, SA)
TotalEmployment115.0121.5126.4129.3130.8132.4133.0133.1133.5
PctChgYearAgo-1.95.74.02.31.11.20.40.10.3
Manufacturing3.43.43.53.43.33.33.33.23.2
PctChgYearAgo8.7-0.94.7-4.0-3.00.1-1.0-1.5-0.7
Nonmanufacturing111.6118.1122.9125.9127.5129.1129.7129.9130.3 PctChgYearAgo-2.25.94.02.51.21.30.50.20.3 Construction&Mining7.07.37.88.18.38.28.28.07.8 PctChgYearAgo1.54.37.53.72.0-0.5-0.5-2.6-2.0 Trade,Trans,&Utilities20.421.522.422.923.023.323.323.523.2 PctChgYearAgo-3.35.24.02.30.61.10.30.5-1.1 WholesaleTrade1.71.92.02.12.22.22.32.32.3 RetailTrade16.417.117.718.218.318.318.318.318.0 Trans,Wrhsng,&Util2.32.52.72.62.62.72.82.82.9 Information0.91.01.21.11.11.01.11.11.1 PctChgYearAgo-3.714.521.9-6.2-6.1-1.64.90.2-0.7 FinancialActivities7.07.67.97.67.37.67.98.18.2
PctChgYearAgo-2.18.54.1-3.4-4.23.74.22.41.7 Prof&BusinessServices18.520.722.323.223.223.122.421.922.3
PctChgYearAgo2.912.08.04.10.0-0.8-2.7-2.41.9 Educ&HealthServices12.212.412.813.313.714.014.214.314.4
PctChgYearAgo-1.61.73.54.22.92.31.30.40.6
Leisure&Hospitality20.622.523.223.724.125.025.726.026.0
PctChgYearAgo-8.99.03.42.21.53.92.91.1-0.3 OtherServices4.24.34.24.34.74.84.95.05.1
PctChgYearAgo-2.31.8-2.74.27.32.22.92.22.6 FederalGovernment9.29.39.19.29.59.49.19.29.3
PctChgYearAgo3.50.8-1.61.33.1-1.4-3.31.30.9 State&LocalGovernment11.611.711.912.312.612.712.812.812.9
PctChgYearAgo-2.30.52.02.82.60.71.00.50.4
Other Economic Indicators
Population(Ths)288.7294.1300.9306.4310.3311.7313.7315.7317.5
PctChgYearAgo1.51.92.31.81.30.50.60.60.6
LaborForce(Ths)128.6134.8138.9142.0143.0146.7146.5146.5146.4
PercentChange,YearAgo-0.64.93.02.20.72.5-0.10.00.0
UnemploymentRate(%)5.83.52.62.73.13.63.93.93.6
TotalHousingStarts2965.23494.13701.45030.33863.13099.53052.23095.13123.4
Single-Family2406.43216.12749.92796.72630.82199.12122.02073.21975.5
Multifamily558.8278.0951.62233.61232.2900.4930.21021.91147.9
Short Term Outlook for Crestview-Fort Walton Beach-Destin, FL
June 2025 Forecast
Personal Income (Billions $)
2025:12025:22025:32025:42026:12026:22026:32026:42027:12027:22027:32027:42028:1
TotalPersonalIncome23.223.523.724.024.424.825.225.525.926.226.626.927.2
PctChgYearAgo4.95.85.65.75.35.76.26.36.15.65.55.55.2
WagesandSalaries10.610.710.810.911.111.311.411.611.711.812.012.112.2
NonwageIncome12.612.812.913.013.313.613.813.914.214.414.614.815.0
RealPersonalIncome(12$)18.818.818.919.019.219.419.619.719.920.120.320.420.6
PctChgYearAgo2.62.42.02.01.83.23.84.03.93.53.63.73.4
PerCapitaIncome(Ths)74.475.576.176.778.079.280.281.082.283.284.185.086.0
RealPerCapitaIncome(12$)60.560.460.560.761.362.062.462.763.363.864.364.665.1
AverageAnnualWage(Ths)69.870.471.071.973.073.874.775.676.677.578.479.380.2
PctChgYearAgo2.93.93.74.44.64.95.15.14.95.05.04.84.8
Establishment Employment (Place of Work, Thousands, SA)
TotalEmployment131.8132.7132.6132.4132.7132.9133.1133.1133.0133.1133.2133.2133.1
PctChgYearAgo1.41.61.10.90.70.20.40.50.20.10.00.10.1
Manufacturing3.33.33.33.33.33.33.33.33.23.23.23.23.2
PctChgYearAgo0.80.6-1.40.3-1.3-0.9-0.6-1.3-1.1-1.9-1.8-1.1-0.8
Nonmanufacturing128.5129.3129.3129.1129.4129.6129.8129.9129.8129.8129.9130.0129.9
PctChgYearAgo1.41.61.20.90.70.20.40.60.30.10.10.10.1
Construction&Mining8.28.28.38.38.38.28.28.18.18.08.07.97.9
PctChgYearAgo-1.7-0.8-0.10.80.5-0.2-0.8-1.6-2.2-2.7-2.8-2.6-2.4 Trade,Trans,&Utilities23.123.423.423.323.323.323.423.423.423.523.523.423.2
PctChgYearAgo0.61.81.21.00.8-0.30.20.50.80.60.40.1-1.0 WholesaleTrade2.22.22.32.32.32.32.32.32.32.32.32.32.3 RetailTrade18.218.418.418.318.218.318.318.318.318.318.318.318.0 Trans,Wrhsng,&Util2.72.72.72.72.72.72.82.82.82.82.82.82.8 Information1.01.01.01.11.11.11.11.11.11.11.11.11.1
PctChgYearAgo-4.0-6.10.53.54.15.85.24.62.10.5-0.6-1.3-1.5 FinancialActivities7.47.57.67.77.87.87.98.08.08.08.18.18.2
PctChgYearAgo1.84.64.73.85.34.14.03.42.82.72.21.92.0 Prof&BusinessServices23.123.223.122.822.722.522.322.222.021.921.921.922.1
PctChgYearAgo0.8-0.2-2.2-1.3-1.6-2.8-3.4-2.9-3.3-2.7-2.2-1.20.7 Educ&HealthServices13.914.014.114.114.214.214.214.214.314.314.314.314.4 PctChgYearAgo2.22.81.82.41.81.41.20.90.60.30.30.40.7 Leisure&Hospitality24.924.925.025.325.525.625.826.026.026.026.126.125.9
PctChgYearAgo3.63.35.13.42.62.93.32.81.91.30.90.5-0.5 OtherServices4.74.74.84.84.94.94.94.95.05.05.05.05.1
PctChgYearAgo1.30.93.33.33.93.02.52.02.02.12.42.42.7
FederalGovernment9.69.69.49.09.09.19.19.19.29.29.29.29.3
PctChgYearAgo1.91.8-2.6-6.4-5.9-5.5-2.91.21.41.41.21.11.0
State&LocalGovernment12.612.712.712.712.712.812.812.812.812.812.912.912.9
PctChgYearAgo0.60.90.50.71.11.00.90.80.60.40.40.40.4
Other Economic Indicators
Population(Ths)311.3311.6311.8312.2313.0313.5314.0314.5315.0315.5315.9316.4316.8
PctChgYearAgo0.70.50.30.30.50.60.70.70.60.60.60.60.6
LaborForce(Ths)146.2146.9146.8146.7146.6146.5146.5146.5146.5146.5146.5146.5146.4
PctChgYearAgo3.03.02.31.70.3-0.3-0.2-0.1-0.10.00.00.00.0
UnemploymentRate(%)3.43.53.63.83.93.93.93.93.93.93.93.83.7
TotalHousingStarts3053.23148.53143.23053.13063.92994.43013.83136.63088.03087.53085.13119.83111.0
Single-Family2147.22209.82238.12201.22161.42106.82104.12115.82118.02083.72056.32034.82006.1
Multifamily906.1938.7905.1851.8902.6887.6909.81020.8970.01003.81028.81084.91104.9
PROFILES
The Deltona–Daytona–Ormond Beach MSA is comprised of Volusia and Flagler Counties. It is located on the east coast of Florida and is notable for special events that occur throughout the year such as Bike Week. It is home to NASCAR headquarters and the Daytona International Speedway, which hosts popular races such as the Daytona 500.
QUICK FACTS
• Metro population estimate of 721,796 as of 2023 (ACS 5-Year Estimate) (U.S. Census Bureau).
• Volusia County population estimate of 721,796 as of 2023 (ACS 5-Year Estimate).
• Civilian labor force of 319,155 in December 2024 (FRED, U.S. Bureau of Labor Statistics).
• A n unemployment rate of 3.5% as of December 2024, not seasonally adjusted. This amounts to 11,260 unemployed people (FRED, U.S. Bureau of Labor Statistics).
OUTLOOK SUMMARIES
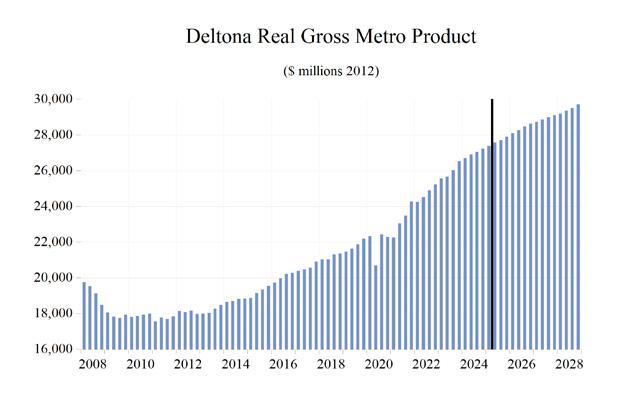
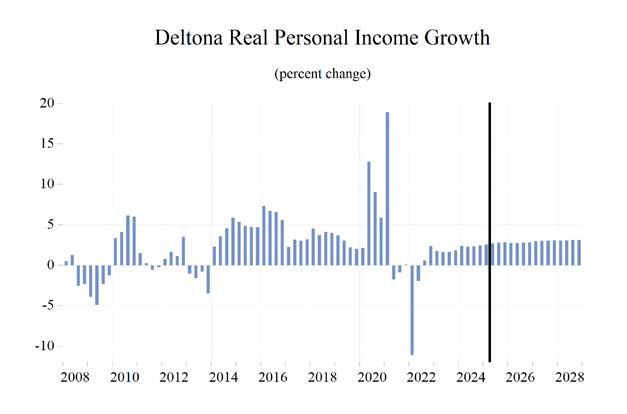
Growth in the economic indicators studied in this forecast is expected to be moderate for the Deltona—Daytona—Ormond Beach Metropolitan Statistical Area (MSA). Gross Metro Product in the Deltona MSA will be $28,598.80 million. Per capita income levels will come in at $50,800, with average per personal income growth of 5.5 percent annually. The average annual wage will grow at a rate of 4.3 percent, driving the average annual real wage to increase to the 4th lowest in the state at $64,700. We expect population growth of 0.9 percent per year.
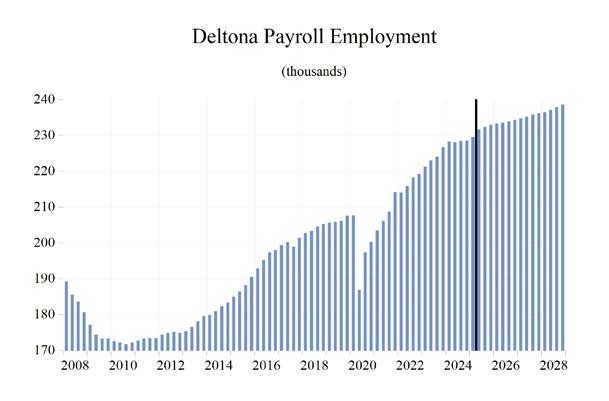
The Deltona—Daytona—Ormond Beach MSA labor market will experience an average employment growth of 1.0 percent, with an unemployment rate of 4.7 percent.
The Other Services sector will experience the fastest growth rate in this MSA with an annual growth rate of 3.4 percent. The Information sector will follow at 2.6 percent. Deltona will see the largest contraction in growth in the Manufacturing sector at -1.3 percent.
METRO NEWS SUMMARIES
Deltona Commissioners Plan to Manage Growth and Preserve Green Spaces
• Deltona commissioners have approved initial steps for a new zoning overlay aimed at curbing overdevelopment and preserving green space in the city’s fast-growing southeast region.
• The initiative, called Keep Deltona Wild, would impose additional development rules to protect rural areas and improve infrastructure resilience against flooding.
• Officials see the plan as a way to balance residential growth with long-term economic goals, including tax base diversification and sustainable land use.
Source: WESH 2, March 5, 2025
Deltona townhouse development on pause after residents raise flooding concerns
• A developer plans to transform 36.5 acres in northwest Deltona into a mixed-use district with retail, offices, and apartments.
• The project is expected to generate millions in new tax revenue, while reducing residents’ reliance on Orlando for jobs.
• The Deltona City Commission tabled a request to rezone almost 36.5 vacant acres adjacent to the newer of the Amazon fulfillment centers.
Source: WESH, March 19, 2025
Deltona pans mixed-use project
• Deltona commissioners rejected final approval of the $100M Synergy mixed-use project, citing concerns over traffic impact and infrastructure strain near the proposed site on North Normandy Boulevard.
• The development plan included 320 apartments and 271,000 sq. ft. of industrial, commercial, and flex space, designed to align with the city’s long-term live-work-play economic goals.
Deltona -Daytona Beach - Ormond Beach MSA
Long Term Outlook for Deltona-Daytona Beach-Ormond Beach, FL
June 2025 Forecast
Personal Income (Billions $)
202020212022202320242025202620272028
TotalPersonalIncome32.436.437.941.343.846.248.751.454.3
PctChgYearAgo5.212.14.39.06.05.45.55.65.5
WagesandSalaries9.510.711.712.613.414.114.915.616.5
NonwageIncome22.925.726.228.830.432.133.935.837.8
RealPersonalIncome(12$)32.134.133.134.735.936.637.739.140.5
PctChgYearAgo3.06.5-3.25.13.32.12.93.73.7
PerCapitaIncome(Ths)48.152.753.556.959.161.764.667.670.6
RealPerCapitaIncome(12$)47.649.546.647.848.548.950.051.452.7
AverageAnnualWage(Ths)47.851.053.855.958.360.563.266.068.9
PctChgYearAgo6.96.85.54.04.33.74.44.54.4
Establishment Employment (Place of Work, Thousands, SA)
TotalEmployment198.1208.1216.9223.8228.4231.7233.8235.5237.5
PctChgYearAgo-4.05.14.23.22.01.50.90.70.9
Manufacturing10.711.512.513.012.812.512.412.312.2
PctChgYearAgo-6.27.88.34.3-1.5-2.3-0.9-1.2-0.8 Nonmanufacturing187.4196.6204.4210.8215.6219.2221.4223.2225.4
PctChgYearAgo-3.94.94.03.12.31.71.00.81.0 Construction&Mining14.114.314.714.915.115.215.515.515.7
PctChgYearAgo-1.02.02.41.31.80.22.10.30.9 Trade,Trans,&Utilities38.942.543.844.545.246.346.346.746.5 PctChgYearAgo-1.59.43.11.61.62.30.01.0-0.6 WholesaleTrade4.95.25.75.96.26.36.46.56.6 RetailTrade30.231.832.733.333.634.334.034.434.1 Trans,Wrhsng,&Util3.75.65.55.45.55.75.85.85.8 Information2.01.81.91.91.91.92.02.12.1 PctChgYearAgo-16.0-9.01.01.80.1-0.37.81.31.4 FinancialActivities9.09.79.910.010.210.711.011.211.2 PctChgYearAgo4.46.92.61.21.65.12.81.20.8 Prof&BusinessServices23.023.425.125.826.026.325.725.225.7 PctChgYearAgo-1.71.57.33.00.61.0-2.1-2.11.9 Educ&HealthServices39.440.542.244.346.647.848.549.350.3 PctChgYearAgo-2.32.94.14.95.22.61.41.62.0
Leisure&Hospitality27.831.033.834.734.935.035.836.336.5
PctChgYearAgo-15.311.58.82.90.60.12.31.40.4 OtherServices8.07.97.77.98.38.58.99.19.5
PctChgYearAgo-8.6-0.7-2.73.04.83.13.63.13.7 FederalGovernment1.61.51.51.51.61.61.51.51.5
PctChgYearAgo5.4-5.80.10.65.00.5-2.7-0.4-0.3 State&LocalGovernment23.623.923.925.125.725.926.126.326.5
PctChgYearAgo1.01.4-0.35.32.10.90.80.70.6
Other Economic Indicators
Population(Ths)674.0689.7709.5726.4740.6748.7754.2760.9768.7
PctChgYearAgo1.72.32.92.42.01.10.70.91.0
LaborForce(Ths)289.5298.5308.8318.3322.7330.2332.3334.4336.2
PercentChange,YearAgo-1.83.13.53.11.42.30.60.60.5
UnemploymentRate(%)8.14.73.43.43.94.44.94.94.7
TotalHousingStarts5937.67122.78063.06874.85825.76085.36492.56316.36283.4
Single-Family4631.56566.96175.75462.75096.75151.25113.84897.34757.6
Multifamily1306.2555.91887.31412.0729.0934.11378.71419.01525.8
Short Term Outlook for Deltona-Daytona Beach-Ormond Beach, FL
June 2025 Forecast
Personal Income (Billions $)
2025:12025:22025:32025:42026:12026:22026:32026:42027:12027:22027:32027:42028:1
TotalPersonalIncome45.346.046.446.947.748.449.149.750.451.151.852.553.2
PctChgYearAgo4.85.55.65.65.15.45.75.85.85.65.65.65.5
WagesandSalaries13.814.014.214.414.614.714.915.115.315.515.715.916.1
NonwageIncome31.531.932.232.633.133.734.134.535.135.636.136.537.1
RealPersonalIncome(12$)36.636.536.736.937.237.637.938.138.538.939.339.640.0
PctChgYearAgo2.52.12.01.91.62.93.33.53.73.53.73.83.7
PerCapitaIncome(Ths)60.861.461.962.563.464.365.065.766.567.368.068.769.5
RealPerCapitaIncome(12$)49.048.848.949.149.449.950.250.450.851.251.651.852.2
AverageAnnualWage(Ths)59.860.160.761.462.162.863.564.365.065.766.467.067.8
PctChgYearAgo3.34.03.73.93.94.44.74.84.64.64.54.34.4
Establishment Employment (Place of Work, Thousands, SA)
TotalEmployment229.7231.7232.4233.0233.3233.6233.9234.3234.7235.3235.8236.2236.4
PctChgYearAgo0.61.61.71.91.60.80.70.60.60.70.80.80.7 Manufacturing12.612.512.512.512.412.512.412.412.312.312.212.212.2
PctChgYearAgo-3.1-2.5-1.9-1.5-1.4-0.7-0.4-1.1-0.7-1.4-1.5-1.1-0.8
Nonmanufacturing217.1219.2219.9220.5220.9221.2221.5222.0222.4223.0223.6224.0224.2
PctChgYearAgo0.81.81.92.11.80.90.70.60.70.80.90.90.8 Construction&Mining14.915.115.315.415.515.515.515.515.515.515.515.615.6
PctChgYearAgo-1.8-0.1-0.13.03.82.51.50.60.40.20.20.30.5 Trade,Trans,&Utilities45.946.546.446.346.246.246.346.446.646.746.846.846.4
PctChgYearAgo2.23.42.31.30.6-0.6-0.20.31.01.11.10.7-0.4 WholesaleTrade6.26.36.36.46.46.46.46.56.56.56.66.66.6 RetailTrade34.134.534.434.234.034.034.134.134.234.334.534.434.0 Trans,Wrhsng,&Util5.65.75.75.85.85.85.85.85.85.85.85.85.8 Information1.91.91.91.92.02.02.12.12.12.12.12.12.1
PctChgYearAgo-2.9-2.30.04.37.89.27.96.53.21.40.40.00.3 FinancialActivities10.510.710.810.911.011.011.011.111.111.211.211.211.2
PctChgYearAgo3.75.25.26.34.83.12.11.51.21.31.31.01.2 Prof&BusinessServices26.126.326.426.226.025.825.625.525.225.225.125.225.4
PctChgYearAgo0.02.31.8-0.1-0.4-2.1-3.1-2.7-3.0-2.3-1.9-1.00.7
Educ&HealthServices47.447.748.048.248.348.448.548.749.049.249.449.650.0
PctChgYearAgo2.22.82.43.21.91.51.21.11.31.61.81.82.1
Leisure&Hospitality34.634.935.035.435.635.735.836.136.136.236.436.536.2
PctChgYearAgo-1.5-0.30.61.72.82.22.51.81.41.31.41.30.3
OtherServices8.48.58.68.78.88.88.98.99.09.19.29.29.4
PctChgYearAgo1.02.24.15.05.13.92.92.52.63.03.43.43.8
FederalGovernment1.61.61.61.51.51.61.61.51.51.51.51.51.5
PctChgYearAgo4.61.8-0.5-3.6-4.0-4.4-2.70.4-0.2-0.5-0.5-0.4-0.3
State&LocalGovernment25.825.925.926.026.026.126.126.226.226.326.326.426.4
PctChgYearAgo0.4-0.21.71.70.90.80.80.80.70.70.70.60.6
Other Economic Indicators
Population(Ths)746.2748.2749.6750.8752.0753.4754.9756.4758.1759.6761.7764.0765.8
PctChgYearAgo1.41.21.00.80.80.70.70.70.80.80.91.01.0
LaborForce(Ths)328.0330.6331.0331.3331.7332.0332.5333.1333.6334.1334.6335.1335.5
PctChgYearAgo1.82.52.52.61.10.40.50.60.60.60.60.60.6
UnemploymentRate(%)4.24.44.54.74.84.94.94.94.94.94.94.84.8
TotalHousingStarts5800.56075.76227.06238.26318.46451.56605.26594.96374.46325.16288.06277.86270.8
Single-Family5017.05157.65216.25214.35134.35135.95117.45067.64968.44910.64868.54841.94798.7
Multifamily783.6918.11010.81023.91184.11315.61487.81527.41406.01414.51419.41436.01472.0
PROFILES
The Broward County MSA is located in Southeastern Florida. It is estimated to be the second-most populous county in the State of Florida and the 18th most populous county in the United States.
QUICK FACTS
• Metro population estimate of 1,962,531 as of 2023 (ACS 5-Year Estimate) (U.S. Census Bureau).
• Broward County population estimate of 1,962,531 as of 2023 (ACS 5-Year Estimate).
• Civilian labor force of 1,085,153 in December 2024 (FRED, U.S. Bureau of Labor Statistics).
• A n unemployment rate of 2.9% as of December 2024, not seasonally adjusted. This amounts to 31,278 unemployed people (FRED, U.S. Bureau of Labor Statistics).
OUTLOOK SUMMARIES
The Fort Lauderdale—Pompano Beach area is expected to show below-average levels of growth in the economic indicators. The area has the 5th highest Gross Metro Product at $141,867.83 million. Personal income is expected to grow an average of 4.8 percent annually, the 2nd lowest rate in the state. It will experience an average real per capita income level of $54,500. Average annual wage growth will be 4.2 percent, and the annual wage level is expected to be $86,900 (4th highest). Fort Lauderdale is expected to average a population growth of 0.2 percent each year (3rd lowest).
Employment is expected to grow at a growth rate of 0.6 percent, while unemployment is expected to be 3.9 percent (4th lowest).
Fort Lauderdale’s fastest growing sector is expected to be the Education and Health Services sector, which will experience 1.8 percent average annual growth, followed by Other Services sector, which will grow at an average of 1.7 percent annually. The Professional and Business Services sector will see the largest contraction at -0.8 percent.
METRO NEWS SUMMARIES
New Fort Lauderdale apartment will offer ‘luxury’ affordable housing to city’s workforce
• A ffiliated Development has broken ground on The Era, a luxury workforce housing project in Fort Lauderdale offering 400 units, over half reserved for residents earning 80– 120% of the area median income, with preference for first responders and government workers.
• The project is backed by tax incentives from Fort Lauderdale and Broward County, along with $80M in financing, enabling rents up to $700 below market while still providing high- end amenities like a resort-style pool, coworking space, sauna, and rooftop deck.
• Slated for completion in 2027, The Era aims to address South Florida’s worsening housing crisis and is part of a broader effort by Affiliated to expand attainable housing across the region.
Source: Miami Herald, March 25, 2024
What are the plans for the old Sears at Broward Mall?
• The former Sears building at Broward Mall has remained abandoned since redevelopment plans stalled following their 2019 approval; the pandemic and permit delays left the site unfinished and neglected.
• Originally planned by Seritage Growth Properties for retail and entertainment, the site was sold in November 2023 to Midtown Group for $28 million.
• M idtown Group is now exploring a mixeduse redevelopment, with community interest focused on quality dining and lifestyle options; a formal proposal is expected by late 2025, with potential city approval in 2026.
Source: NBC Miami, April 22, 2025
Omni Fort Lauderdale hotel now accepting reservations ahead of September 2025 opening
• Opening this September, the new 29-story Omni Fort Lauderdale Hotel is now accepting reservations. It will offer 801 rooms, six dining venues, a full-service spa, and 120,000 square feet of event space directly connected to the expanded Broward County Convention Center.
• The $450M project was developed through a public-private effort and is expected to generate over 3,000 jobs while enhancing Fort Lauderdale’s catering to business and leisure travelers.
• Signature features include a rooftop pool deck, the Mokara Spa, and dining spots like Barchetta Italian Chophouse and the Ibis Sky Lounge.
Source: PR Newswire, April 30, 2025
Long Term Outlook for Fort Lauderdale-Pompano Beach-Deerfield Beach, FL (Division of Miami MSA)
June 2025 Forecast
Personal Income (Billions $)
202020212022202320242025202620272028
TotalPersonalIncome110.5122.1129.0139.3146.9153.1160.3168.9177.3
PctChgYearAgo6.110.55.78.05.54.24.75.45.0
WagesandSalaries52.058.664.769.173.276.380.184.288.3
NonwageIncome58.463.564.370.273.876.880.284.689.0
RealPersonalIncome(12$)96.4102.099.4103.4106.3107.3109.5113.2116.8
PctChgYearAgo4.05.8-2.54.02.81.02.03.43.2
PerCapitaIncome(Ths)56.962.965.469.472.074.678.382.486.3
RealPerCapitaIncome(12$)49.752.550.451.552.152.353.555.356.9
AverageAnnualWage(Ths)63.968.972.575.278.781.284.988.992.6
PctChgYearAgo7.87.85.33.84.53.24.54.84.2
Establishment Employment (Place of Work, Thousands, SA)
TotalEmployment810.9846.0889.2914.0926.2936.0940.2943.3949.0
PctChgYearAgo-6.44.35.12.81.31.10.40.30.6
Manufacturing27.628.630.231.232.032.131.731.331.1
PctChgYearAgo-4.83.55.83.12.80.1-1.1-1.3-0.9
Nonmanufacturing783.3817.5859.0882.9894.2903.9908.4911.9917.9
PctChgYearAgo-6.44.45.12.81.31.10.50.40.7
Construction&Mining49.049.049.652.555.255.156.056.557.2
PctChgYearAgo-1.90.01.25.95.2-0.31.70.91.4 Trade,Trans,&Utilities185.8193.7201.9205.1205.0208.4208.6210.2208.6
PctChgYearAgo-4.94.34.21.60.01.60.10.8-0.8 WholesaleTrade49.750.652.553.553.955.556.357.257.3 RetailTrade103.0106.0108.5108.8108.7110.8110.0110.5108.7 Trans,Wrhsng,&Util33.137.140.942.842.442.042.342.642.5 Information18.819.920.420.520.019.720.520.320.1
PctChgYearAgo-5.26.02.80.3-2.3-1.33.6-0.9-0.7 FinancialActivities63.966.271.473.673.874.475.676.276.5
PctChgYearAgo-1.33.67.93.10.30.81.70.80.4 Prof&BusinessServices147.0157.8170.8172.9173.6171.3167.5164.6168.2 PctChgYearAgo-4.27.48.21.30.4-1.4-2.2-1.82.2 Educ&HealthServices108.1111.0115.1120.2122.5125.6128.1130.1132.2 PctChgYearAgo-3.82.73.64.51.92.52.01.51.6
Leisure&Hospitality76.285.193.797.298.7101.4103.6104.6104.6
PctChgYearAgo-21.811.610.23.71.52.72.11.00.0 OtherServices31.933.134.335.636.938.238.238.839.6
PctChgYearAgo-15.43.63.73.93.43.60.01.52.1 FederalGovernment7.47.17.27.57.87.77.57.67.7
PctChgYearAgo5.8-4.61.74.33.8-0.9-2.61.51.3
State&LocalGovernment95.294.694.697.7100.6102.1102.8103.0103.1
PctChgYearAgo-4.2-0.60.03.33.01.50.70.20.1
Other Economic Indicators
Population(Ths)1940.01940.31971.52007.42039.92051.42047.82048.72054.4
PctChgYearAgo0.00.01.61.81.60.6-0.20.00.3
LaborForce(Ths)1012.81021.51051.51078.51086.11108.11114.91118.61121.8
PercentChange,YearAgo-1.60.92.92.60.72.00.60.30.3
UnemploymentRate(%)9.34.92.92.83.23.64.04.14.0
TotalHousingStarts4447.53377.22687.62489.71793.22839.14154.24999.75532.1
Single-Family1418.61548.51114.3851.6766.1880.11067.21146.81218.6
Multifamily3028.91828.71573.31638.11027.01959.03087.03852.94313.5
Short Term Outlook for Fort Lauderdale-Pompano Beach-Deerfield Beach, FL (Division of Miami MSA)
June 2025 Forecast
2025:12025:22025:32025:42026:12026:22026:32026:42027:12027:22027:32027:42028:1
Personal Income (Billions $) TotalPersonalIncome151.0152.7153.7155.0157.3159.3161.1163.4165.7167.8169.9171.9174.1
PctChgYearAgo1.51.10.60.50.71.92.53.03.33.33.63.43.2
PerCapitaIncome(Ths)73.674.474.975.676.877.878.779.881.081.982.983.984.9
RealPerCapitaIncome(12$)52.452.252.352.452.953.353.654.154.655.155.555.956.3
AverageAnnualWage(Ths)80.180.881.482.483.584.485.386.487.488.489.490.491.3
PctChgYearAgo2.43.73.23.54.24.44.74.84.84.84.94.64.4
Establishment Employment (Place of Work, Thousands, SA)
TotalEmployment933.2936.5937.4936.9938.5939.8940.9941.5942.1942.9943.7944.5945.7
PctChgYearAgo1.11.11.01.00.60.40.40.50.40.30.30.30.4
Manufacturing32.232.232.032.031.731.931.831.631.531.431.331.231.2
PctChgYearAgo0.91.1-0.5-0.9-1.4-1.0-0.7-1.1-0.8-1.6-1.6-1.2-0.9
Nonmanufacturing901.0904.3905.4904.9906.7907.9909.1909.9910.6911.5912.4913.3914.5
PctChgYearAgo1.11.11.01.10.60.40.40.50.40.40.40.40.4
Construction&Mining54.754.955.255.455.755.956.156.256.356.456.556.756.9
PctChgYearAgo1.1-0.4-1.90.11.82.01.61.31.10.80.70.90.9 Trade,Trans,&Utilities208.8208.7208.3207.7207.8208.3209.0209.4210.1210.4210.4210.0208.7
PctChgYearAgo1.72.01.71.1-0.5-0.20.30.81.11.00.70.3-0.6 WholesaleTrade55.655.455.655.655.956.156.456.757.057.257.257.257.3 RetailTrade111.1111.3110.7110.1109.8109.9110.2110.1110.4110.5110.7110.3108.8 Trans,Wrhsng,&Util42.142.042.042.042.142.242.442.642.642.642.642.542.6 Information19.619.719.819.920.320.520.620.520.520.420.220.120.1
PctChgYearAgo-3.8-1.7-0.40.53.54.43.63.01.0-0.7-1.7-2.1-1.9 FinancialActivities74.074.374.474.875.375.575.775.976.176.276.376.376.7 PctChgYearAgo-0.40.40.82.31.81.61.81.41.01.00.80.60.7 Prof&BusinessServices170.8172.1172.2170.1169.0167.9167.0166.1164.8164.5164.3164.8166.3 PctChgYearAgo-1.3-1.1-1.5-1.5-1.1-2.4-3.0-2.4-2.5-2.0-1.6-0.81.0 Educ&HealthServices124.4125.4126.0126.6127.4128.0128.4128.8129.5130.0130.4130.7131.6
PctChgYearAgo2.52.62.03.02.32.01.91.81.71.61.61.41.6
Leisure&Hospitality100.8101.2101.4102.4103.0103.3103.7104.2104.3104.4104.7105.1104.1
PctChgYearAgo1.91.73.53.82.22.12.41.81.31.00.90.9-0.2 OtherServices38.438.238.138.138.138.138.238.338.538.738.839.039.4
PctChgYearAgo5.54.03.81.1-0.7-0.10.20.51.01.41.71.82.2 FederalGovernment7.97.97.77.47.57.57.57.67.67.67.77.77.7
PctChgYearAgo3.02.0-2.2-6.1-5.5-4.4-2.01.91.61.51.41.41.4 State&LocalGovernment101.6102.0102.3102.5102.6102.8102.9102.9102.9103.0103.0103.0103.0
PctChgYearAgo1.81.81.41.01.00.80.60.50.30.20.20.10.1
Other Economic Indicators
Population(Ths)2052.22051.72051.22050.62049.02048.02047.52046.82047.32048.32049.22050.12051.6
PctChgYearAgo1.10.70.30.1-0.2-0.2-0.2-0.2-0.10.00.10.20.2
LaborForce(Ths)1102.31109.21110.31110.71113.01114.61115.41116.41117.31118.21119.11119.81120.6
PctChgYearAgo1.72.22.02.21.00.50.50.50.40.30.30.30.3
UnemploymentRate(%)3.43.53.63.83.94.04.14.14.14.14.14.14.1
TotalHousingStarts2458.92673.63011.23212.53623.53981.44383.94628.04822.44969.75049.35157.55300.4
Single-Family765.6847.2920.9986.51023.81057.01082.81105.31123.71138.61153.31171.51190.2
Multifamily1693.31826.42090.32226.02599.72924.43301.13522.73698.73831.03895.93986.14110.1
PROFILES
The Gainesville MSA is comprised of Alachua and Gilchrist Counties and is located in the central north portion of the state. This metro is home to the University of Florida and the Florida Museum of Natural History, Florida’s official natural history museum.
QUICK FACTS
• Metro population estimate of 350,203 as of 2023 (ACS 5-Year Estimate) (U.S. Census Bureau).
• A lachua County population estimate of 285,994 as of 2023 (ACS 5-Year Estimate).
• Gilchrist County population estimate of 18,494 as of 2023 (ACS 5-Year Estimate).
• Civilian labor force of 151,629 in December 2024 (FRED, U.S. Bureau of Labor Statistics).
• A n unemployment rate of 3.1% as of December 2024, not seasonally adjusted. This amounts to 4,754 unemployed people (FRED, U.S. Bureau of Labor Statistics).
OUTLOOK SUMMARIES
The Gainesville Metropolitan Statistical Area (MSA) will see low levels of growth in the studied economic indicators. Gainesville will have a Gross Metro Product of $19,168.83 million. Per capita income will be $48,300, with personal income growth at 4.9 percent. Average annual wage growth of 4.3 percent (5th highest) will help drive the average real annual wage to $71,900. Population growth will be 0.3 percent (4th lowest).
Gainesville will see the lowest average annual employment growth out of any of the MSAs studied with a mere 0.4 percent rate and will experience an unemployment rate of 4.5 percent.
The Information sector will see the largest annual growth at 2.8 percent. The Financial sector will follow with a growth rate of 2.0 percent. The two sectors experiencing the largest contraction will be the Federal and Manufacturing sectors, seeing contractions of -2.1 percent and -1.6 percent respectively.
METRO NEWS SUMMARIES
Florida Museum public exhibits close for expansion; plan is to reopen in late 2026
• The Florida Museum of Natural History in Gainesville has closed its public exhibitions, including the popular Butterfly Rainforest, as it embarks on a major expansion that will update its facilities and add new exhibit and educational spaces, with plans to reopen in late 2026.
• W hile Powell Hall undergoes renovations, the museum will maintain community engagement through off-site programming at local libraries, farmers markets, and schools, ensuring continued public access to science education.
• The expansion includes a new west wing for the Thompson Earth Systems Institute, updated classrooms, a larger Collectors Shop, and a new exhibit space focused on environmental science and interactive learning.
Source: Florida Museum of Natural History, March 24, 2025
Gilbane Development Company and CBRE Investment Management Announce New Purpose-Built Student Housing Project in Gainesville, Florida
• Gilbane Development Company and CBRE Investment Management have secured financing for Zaya, a luxury purpose-built student housing project near the University of Florida in Gainesville, featuring 352 units and 702 beds with top- tier amenities like rooftop pickleball, private en-suite baths, and study spaces on every floor.
• Designed to balance vibrant city life and academic focus, the development will include three outdoor courtyards, coworking lounges, a coffee bar, and proximity to Butler Plaza— Florida’s largest retail power center—enhancing convenience and lifestyle options for students.
• With construction already underway and a target completion date of summer 2027, Zaya represents a major investment in Gainesville’s student housing market and is part of a broader six-campus partnership between Gilbane and CBRE aimed at elevating student living nationwide.
Source: Gilbane Development Company, March 25, 2025
‘Such a relief’: Florida Department of Environmental Protection shuts down Gainesville crematorium
• The Florida Department of Environmental Protection has officially ordered Forest Meadows Funeral Home in Gainesville to shut down its crematory unit following repeated community complaints and a documented failure to meet state carbon monoxide emission standards in 2023.
• Residents near the facility, including Dan Randall, expressed relief over the closure, citing years of unpleasant odors and health concerns, with some families previously considering relocation due to fears over air quality and emissions.
• The funeral home must disconnect power and gas to the unit, pay $1,625 in penalties, and cannot resume cremation operations without applying for a new Air General Permit, marking a significant regulatory and community resolution.
Source: WCJB, April 10, 2025
Availability of CDBG and HOME Programs for Outside Agency Funding
• The City of Gainesville began accepting applications on April 29 for fiscal year 2026 funding through the federal Community Development Block Grant (CDBG) and HOME Investment Partnerships (HOME) programs, which provide financial support for initiatives benefiting low- to moderate-income residents.
• Eligible projects must align with the city’s funding priorities, including affordable housing, homelessness support, job training, nutritional aid, and services for at- risk children and seniors; the application window closes May 12, 2025.
• Funding is contingent on annual appropriations from the U.S. Department of Housing and Urban Development (HUD) and is intended to support programs running from October 1, 2025, through September 30, 2026.
Source: City of Gainesville, April 25, 2025
City Gives Neighbors Free ADU Plans and Announces Groundbreaking
• Gainesville has launched a new initiative to expand affordable housing by offering residents free professionally designed plans for accessory dwelling units (ADUs), which can be built on most residential properties in compliance with local zoning and design standards.
• To showcase the program’s potential, the city is constructing two ADU prototypes—one attached and one detached—on city-owned property, with a public groundbreaking ceremony held on April 30, and plans made available at no cost to all interested homeowners.
• Supported by $400,000 in city funding and additional subsidies through federal and local programs, the initiative prioritizes flexible housing for low-income renters, including veterans and individuals facing housing instability, while helping homeowners create multigenerational living spaces or rental income opportunities.
Source: City of Gainesville, April 28, 2025
Long Term Outlook for Gainesville, FL
June 2025 Forecast
Personal Income (Billions $)
202020212022202320242025202620272028
TotalPersonalIncome15.817.317.719.119.820.821.822.924.0
PctChgYearAgo7.19.42.57.74.04.84.95.24.8
WagesandSalaries8.29.09.610.310.711.311.812.412.9
NonwageIncome7.68.38.18.89.19.510.010.611.2
RealPersonalIncome(12$)16.316.615.816.316.616.817.217.718.3
PctChgYearAgo7.31.7-4.33.11.41.52.23.23.0
PerCapitaIncome(Ths)46.350.150.553.655.157.560.263.266.1
RealPerCapitaIncome(12$)47.848.045.245.946.046.647.548.950.2
AverageAnnualWage(Ths)54.357.259.862.764.867.070.273.676.7
PctChgYearAgo8.55.34.54.93.33.44.94.74.3
Establishment Employment (Place of Work, Thousands, SA)
TotalEmployment151.0156.2160.1163.6165.1167.8167.5167.3167.4
PctChgYearAgo-3.53.42.52.20.91.6-0.2-0.10.1
Manufacturing5.35.55.75.55.25.15.05.04.9 PctChgYearAgo-5.94.14.4-4.1-4.6-3.0-0.6-1.6-1.2 Nonmanufacturing145.8150.7154.4158.1159.9162.7162.5162.4162.5 PctChgYearAgo-3.43.42.52.41.11.8-0.2-0.10.1 Construction&Mining7.47.47.17.27.37.47.57.57.5 PctChgYearAgo2.4-0.3-4.00.91.22.21.1-0.10.3 Trade,Trans,&Utilities22.323.524.024.224.224.724.424.223.8 PctChgYearAgo-2.85.42.30.70.31.7-1.1-0.6-1.9 WholesaleTrade3.33.43.53.63.53.53.53.53.5 RetailTrade15.215.816.116.116.316.516.115.915.5 Trans,Wrhsng,&Util3.84.34.44.54.54.74.84.84.7 Information1.61.92.11.91.82.02.12.02.0 PctChgYearAgo-9.417.110.6-9.6-3.510.23.2-1.4-1.0 FinancialActivities6.96.86.96.96.76.87.17.27.3
PctChgYearAgo-4.2-1.82.3-1.0-2.01.63.61.91.0 Prof&BusinessServices16.118.318.919.018.117.717.116.717.0
PctChgYearAgo1.613.53.50.2-4.7-2.1-3.4-2.41.9 Educ&HealthServices27.327.828.730.932.533.333.533.433.4 PctChgYearAgo-1.71.63.47.55.32.50.5-0.10.0
Leisure&Hospitality14.415.816.917.217.417.818.018.218.3
PctChgYearAgo-16.39.87.11.80.82.21.41.30.5 OtherServices4.64.74.85.04.95.15.15.25.3
PctChgYearAgo-8.22.03.43.3-0.72.21.51.41.9 FederalGovernment5.04.95.05.25.45.24.94.94.9
PctChgYearAgo6.1-1.10.84.33.5-3.5-4.5-0.3-0.2 State&LocalGovernment40.139.739.940.841.642.842.842.942.9
PctChgYearAgo-2.6-1.20.52.31.93.00.00.20.1
Other Economic Indicators
Population(Ths)341.0344.7350.4355.9359.9361.2362.0363.0363.9
PctChgYearAgo1.11.11.61.61.10.30.20.30.2
LaborForce(Ths)158.1162.6165.2169.1169.7174.0173.6173.1172.5
PercentChange,YearAgo-2.52.91.62.40.32.5-0.2-0.3-0.3 UnemploymentRate(%)5.84.13.13.33.84.44.74.64.2 TotalHousingStarts2191.92456.92863.71841.31895.51565.21793.01923.11940.9
Single-Family1138.41543.01374.51246.31178.41147.61201.11137.11092.4
Multifamily1053.5913.91489.2595.0717.1417.6591.9786.0848.4
Short Term Outlook for Gainesville, FL
June 2025 Forecast
Personal Income (Billions $)
2025:12025:22025:32025:42026:12026:22026:32026:42027:12027:22027:32027:42028:1
TotalPersonalIncome20.520.720.921.021.421.721.922.222.522.823.123.323.6
PctChgYearAgo4.35.05.14.84.44.65.15.55.45.15.15.14.9
WagesandSalaries11.111.211.311.511.611.711.912.012.212.312.412.512.7
NonwageIncome9.49.59.59.69.89.910.110.210.410.510.710.810.9
RealPersonalIncome(12$)16.816.816.816.817.017.217.317.417.517.717.817.918.1
PctChgYearAgo1.91.71.51.10.92.22.73.13.33.13.33.33.1
PerCapitaIncome(Ths)56.757.457.858.359.159.960.661.362.162.863.664.265.0
RealPerCapitaIncome(12$)46.646.546.546.647.047.447.747.948.448.749.149.449.7
AverageAnnualWage(Ths)66.166.667.268.169.169.870.671.572.373.274.074.775.6
PctChgYearAgo2.53.33.54.24.54.95.05.04.74.84.84.64.5
Establishment Employment (Place of Work, Thousands, SA)
TotalEmployment167.3168.2168.1167.6167.6167.5167.5167.5167.4167.3167.3167.3167.2
PctChgYearAgo2.12.11.60.60.2-0.4-0.4-0.1-0.1-0.1-0.1-0.1-0.1
Manufacturing5.15.15.15.15.05.15.15.05.05.04.94.94.9
PctChgYearAgo-2.7-3.9-3.3-2.0-1.1-0.3-0.2-0.9-0.9-1.9-2.0-1.6-1.3
Nonmanufacturing162.2163.1163.0162.5162.5162.4162.4162.5162.4162.3162.4162.3162.3
PctChgYearAgo2.32.31.80.70.2-0.4-0.40.0-0.10.00.0-0.1-0.1
Construction&Mining7.37.47.57.57.57.57.57.57.57.57.57.57.5
PctChgYearAgo0.81.13.63.52.61.10.50.10.0-0.1-0.2-0.2-0.1 Trade,Trans,&Utilities24.624.824.724.624.524.424.324.324.324.324.224.123.9
PctChgYearAgo2.02.31.70.8-0.4-1.6-1.5-1.0-0.6-0.5-0.4-0.8-1.8 WholesaleTrade3.43.53.53.53.53.53.53.53.63.63.53.53.5 RetailTrade16.516.616.516.416.216.116.116.016.016.015.915.815.6 Trans,Wrhsng,&Util4.64.74.74.74.74.84.84.84.84.84.84.74.8 Information2.02.02.02.02.12.12.12.12.12.12.02.02.0
PctChgYearAgo15.316.36.44.12.94.13.32.70.2-1.2-2.1-2.4-2.1 FinancialActivities6.86.86.96.97.07.17.17.27.27.27.27.27.3
PctChgYearAgo0.61.51.33.23.83.53.73.32.52.11.71.21.4
Prof&BusinessServices17.717.817.817.517.417.217.016.916.716.716.716.716.9
PctChgYearAgo-3.9-1.1-0.6-2.9-2.2-3.7-4.1-3.4-3.5-2.7-2.1-1.10.7 Educ&HealthServices33.133.433.433.433.533.533.533.533.533.533.433.433.5
PctChgYearAgo3.42.92.41.31.10.30.20.30.1-0.1-0.1-0.30.0 Leisure&Hospitality17.717.817.817.917.918.018.018.118.118.218.318.418.2
PctChgYearAgo1.43.42.12.01.41.21.71.41.21.21.21.40.3 OtherServices5.05.15.15.15.15.15.15.15.25.25.25.25.3
PctChgYearAgo2.02.62.02.42.31.31.21.11.21.41.61.62.0
FederalGovernment5.35.35.25.04.94.94.94.94.94.94.94.94.9
PctChgYearAgo-1.4-2.0-3.2-7.6-6.4-6.6-4.4-0.5-0.4-0.3-0.2-0.2-0.2
State&LocalGovernment42.842.842.842.742.742.842.842.942.942.942.942.942.9
PctChgYearAgo5.33.32.41.1-0.1-0.2-0.10.30.30.30.20.00.1
Other Economic Indicators
Population(Ths)361.0361.2361.2361.2361.5361.8362.2362.4362.6362.8363.1363.3363.5
PctChgYearAgo0.60.40.20.10.10.20.30.30.30.30.20.30.3
LaborForce(Ths)173.5174.3174.2174.0173.8173.6173.5173.4173.3173.2173.0172.9172.7
PctChgYearAgo2.93.02.41.90.2-0.4-0.4-0.3-0.3-0.3-0.3-0.3-0.3
UnemploymentRate(%)4.24.34.44.64.64.74.74.74.64.64.54.44.3
TotalHousingStarts1620.81479.81564.61595.61643.71737.11853.91937.41936.11925.51914.91915.91922.7 Single-Family1067.41137.21184.61201.21208.21222.41199.81174.11158.21141.81129.01119.51106.2
Multifamily553.4342.6380.1394.4435.5514.7654.1763.3777.9783.7785.9796.3816.5
PROFILES
The Homosassa Springs MSA is located in the central northwest portion of the state. Located in Citrus County, Homosassa Springs is a censusdesignated place named after the warm spring in its wildlife state park—famous for attracting manatees..
QUICK FACTS
• Metro population estimate of 166,696 as of 2023 (ACS 5-Year Estimate) (U.S. Census Bureau).
• Citrus County population estimate of 166,696 as of 2023 (ACS 5-Year Estimate).
• Civilian labor force of 48,850 in December 2024 (FRED, U.S. Bureau of Labor Statistics).
• A n unemployment rate of 4.8% as of December 2024, not seasonally adjusted. This amounts to 2,355 unemployed people (FRED, U.S. Bureau of Labor Statistics).
OUTLOOK SUMMARIES
The Homosassa Springs Metropolitan Statistical Area (MSA) is expected to see low levels of growth in most of the economic indicators. Homosassa’s expected Gross Metro Product will be $5,456.78 million, the 2nd lowest in the state. Personal income growth of 6.0 percent will put the MSA’s per capita income level at $43,600, ranking 4th lowest against other MSAs. Average annual wage growth of 3.9 percent (2nd slowest) will push the average real annual wage up to $58,500, the lowest in the state. Population growth will reach 1.0 percent. Employment growth is expected to average 0.9 percent annually. Homosassa’s unemployment rate will come in at 6.1 percent, the 2nd highest in the state of Florida.
The fastest growing sector in the Homosassa Springs MSA will be the Other Services sector, which will see an average annual growth rate of 1.5 percent. The Construction and Mining sector will come in at a growth rate of 1.4 percent. The Federal sector will see the largest contraction in growth, at -1.4 percent.
METRO NEWS SUMMARIES
Waffle House eyes first county location
• Waffle House has submitted plans to open its first Citrus County restaurant at 6921 State Road 44 in Crystal River, marking a notable expansion for the 24/7 comfort food chain.
• The Georgia-based company intends to renovate an existing building just west of County Road 486, introducing its well-known brand to a new local market.
• With over 1,900 locations across 25 states, Waffle House’s arrival reflects steady regional growth and consumer demand for round-theclock dining, particularly in areas where the chain is valued for its reliability during extreme weather events.
Source: Citrus County Chronicle, April 16, 2025
SECO Energy Foundation Awards $23,160 to United Way of Citrus County
• GROW Financial Security Class, aimed at helping ALICE (Asset Limited, Income Constrained, Employed) households build essential life and financial skills.
• The grant will fund two free 11-week class cohorts open to all Citrus County residents, covering topics such as budgeting, credit building, resume writing, and cost-effective cooking. It involves partnerships with CareerSource, Truist, Habitat for Humanity, and others.
• The initiative reflects growing regional efforts to strengthen economic stability and workforce readiness among working families, positioning financial literacy as a tool for long-term community resilience.
Source: Citrus County Chronicle, May 7, 2025
Spectrum Launches Gigabit Broadband, Mobile, TV and Voice Services in Citrus County, Florida
• Spectrum has expanded its services to nearly 3,100 homes and small businesses in Citrus County, offering internet speeds up to 1 Gbps as part of a $7 billion national rural broadband initiative.
• The expansion supports remote work, education, and telehealth, addressing a key infrastructure gap in underserved areas and earning praise from local leaders and Rep. Gus Bilirakis.
• Spectrum’s offerings include broadband, mobile, and TV services with no data caps or contracts, enhancing connectivity across rural Citrus County.
Source: Charter Communications, May 14, 2025
Citrus County Summer Job Fair returns with plenty of hot jobs
• CareerSource Citrus Levy Marion will host a Summer Job Fair on Tuesday, June 10, from 3–5 p.m. at the College of Central Florida’s Wilton Simpson Citrus Campus in Lecanto, featuring immediate openings across industries.
• The event is free and open to all job seekers, with employers including AutoZone, the Citrus County School District, Florida Department of Juvenile Justice, and The Villages Operating Company hiring for entry-level and experienced roles.
• Organizers report a strong local job market and urge attendees to bring resumes, dress professionally, and be ready for on-the-spot interviews. The event supports continued labor force participation and workforce mobility in the region.
Source: Citrus County Chronicle, May 21, 2025
Homosassa Springs MSA Industry Location Quotients
Long Term Outlook for Homosassa Springs, FL
June 2025 Forecast
Personal Income (Billions $)
202020212022202320242025202620272028
TotalPersonalIncome6.47.27.37.98.38.89.39.910.4
PctChgYearAgo8.611.81.57.85.45.96.26.15.6
WagesandSalaries1.41.71.81.81.92.02.12.22.3
NonwageIncome5.05.55.56.06.46.87.27.68.1
RealPersonalIncome(12$)6.87.06.66.87.07.27.57.88.1
PctChgYearAgo8.53.1-5.73.02.82.63.54.13.8
PerCapitaIncome(Ths)41.445.344.747.048.651.053.656.358.9
RealPerCapitaIncome(12$)44.044.440.740.941.241.942.944.245.5
AverageAnnualWage(Ths)44.749.451.351.153.254.857.259.762.1
PctChgYearAgo6.210.33.9-0.44.23.04.24.44.1
Establishment Employment (Place of Work, Thousands, SA)
TotalEmployment32.133.435.035.936.136.536.937.137.4
PctChgYearAgo-3.84.14.92.40.61.21.10.60.8
Manufacturing0.50.60.60.60.50.50.50.50.5
PctChgYearAgo1.37.71.72.8-13.0-1.3-2.00.10.5
Nonmanufacturing31.532.834.435.335.536.036.436.636.9
PctChgYearAgo-3.94.05.02.40.81.21.20.60.8
Construction&Mining3.03.13.43.33.33.33.43.43.4
PctChgYearAgo0.33.59.1-2.5-1.60.03.50.91.1 Trade,Trans,&Utilities7.27.37.67.67.77.87.97.97.9
PctChgYearAgo-2.72.43.2-0.22.31.00.70.9-0.4 WholesaleTrade1.01.01.11.11.11.11.21.21.2 RetailTrade5.05.15.25.25.45.45.45.45.3 Trans,Wrhsng,&Util1.21.21.31.31.31.31.31.41.4 Information0.30.30.30.30.30.30.30.30.3
PctChgYearAgo-7.5-7.35.10.2-8.0-1.03.5-2.0-1.1 FinancialActivities1.31.41.51.61.61.61.71.71.7
PctChgYearAgo-0.810.96.75.12.22.82.3-0.2-0.3 Prof&BusinessServices3.23.64.03.93.83.93.83.73.9
PctChgYearAgo-0.111.212.0-0.8-3.00.7-2.6-0.64.0 Educ&HealthServices7.37.27.17.57.77.98.08.08.1
PctChgYearAgo-6.0-0.4-1.15.22.32.31.80.40.9
Leisure&Hospitality4.24.65.15.45.45.45.55.65.6
PctChgYearAgo-8.410.19.25.70.10.32.31.00.1 OtherServices0.90.91.01.11.11.11.11.11.2
PctChgYearAgo-9.39.510.85.0-0.41.00.91.32.6
FederalGovernment0.20.20.20.20.20.20.20.20.2
PctChgYearAgo-7.3-13.45.26.25.84.9-3.3-2.4-4.9
State&LocalGovernment4.14.14.34.44.54.54.64.64.7
PctChgYearAgo-2.21.53.23.61.71.60.91.11.4
Other Economic Indicators
Population(Ths)155.1158.7163.1167.2170.4172.2173.8175.5177.3
PctChgYearAgo2.02.32.82.51.91.01.01.01.0
LaborForce(Ths)49.450.752.453.753.854.755.055.455.6
PercentChange,YearAgo-1.52.63.42.50.31.60.60.60.5
UnemploymentRate(%)8.35.54.14.45.05.86.36.36.0
TotalHousingStarts896.01846.91623.72170.52433.31923.21393.71325.51296.5
Single-Family856.21834.01621.22168.92423.81907.21361.71275.71240.9
Multifamily39.813.02.41.69.516.132.149.855.5
Short Term Outlook for Homosassa Springs, FL
June 2025 Forecast
Personal Income (Billions $)
2025:12025:22025:32025:42026:12026:22026:32026:42027:12027:22027:32027:42028:1
TotalPersonalIncome8.68.78.88.99.19.39.49.59.79.810.010.110.2
PctChgYearAgo5.36.06.16.05.66.06.56.66.56.05.95.95.7
WagesandSalaries2.02.02.02.12.12.12.12.22.22.22.22.32.3
NonwageIncome6.66.76.86.97.07.27.37.47.57.67.77.87.9
RealPersonalIncome(12$)7.27.27.27.37.37.47.57.67.77.77.87.97.9
PctChgYearAgo3.02.62.42.32.13.64.14.24.33.94.04.13.8
PerCapitaIncome(Ths)50.250.851.251.752.553.354.054.655.356.056.657.257.9
RealPerCapitaIncome(12$)41.941.741.842.042.442.843.143.343.844.144.444.745.0
AverageAnnualWage(Ths)54.354.554.955.656.356.857.458.158.859.460.060.661.3
PctChgYearAgo2.42.93.03.63.84.14.54.54.34.74.64.24.2
Establishment Employment (Place of Work, Thousands, SA)
TotalEmployment36.236.536.636.736.836.936.936.937.037.137.237.237.2
PctChgYearAgo0.91.41.01.41.61.11.00.80.60.50.60.70.7
Manufacturing0.50.50.50.50.50.50.50.50.50.50.50.50.5
PctChgYearAgo1.3-2.4-3.5-0.5-3.3-2.3-1.5-1.00.2-0.10.00.40.5
Nonmanufacturing35.736.036.136.236.336.436.436.536.536.636.736.736.7
PctChgYearAgo0.91.51.11.41.71.21.00.80.60.50.60.70.7
Construction&Mining3.23.23.33.33.33.43.43.43.43.43.43.43.4
PctChgYearAgo-3.3-1.10.63.94.44.03.32.41.70.90.50.60.6
Trade,Trans,&Utilities7.77.87.87.87.87.97.97.97.97.97.97.97.9
PctChgYearAgo0.12.21.00.91.20.20.50.81.01.01.00.8-0.3 WholesaleTrade1.11.11.11.11.11.21.21.21.21.21.21.21.2 RetailTrade5.45.45.45.45.45.45.45.35.45.45.45.45.3 Trans,Wrhsng,&Util1.31.31.31.31.31.31.41.41.41.41.41.41.4 Information0.30.30.30.30.30.30.30.30.30.30.30.30.3 PctChgYearAgo-2.8-1.60.30.03.74.63.42.4-0.2-1.9-2.9-3.0-2.4 FinancialActivities1.61.61.61.71.71.71.71.71.71.71.71.71.7
PctChgYearAgo2.13.42.43.33.52.62.31.00.2-0.3-0.3-0.30.1
Prof&BusinessServices3.93.93.93.83.83.83.73.73.73.73.73.83.8
PctChgYearAgo0.51.00.60.8-2.1-3.0-3.1-2.2-2.1-1.1-0.11.02.9
Educ&HealthServices7.87.87.97.98.08.08.08.08.08.08.08.08.1
PctChgYearAgo2.52.71.82.22.92.11.30.80.50.20.40.50.8
Leisure&Hospitality5.45.45.45.45.55.55.55.55.55.65.65.65.5
PctChgYearAgo1.20.0-0.20.22.32.42.61.81.21.10.90.9-0.1
OtherServices1.11.11.11.11.11.11.11.11.11.11.11.11.1
PctChgYearAgo-0.40.51.72.32.21.00.40.10.41.01.72.12.7
FederalGovernment0.20.20.20.20.20.20.20.20.20.20.20.20.2
PctChgYearAgo8.17.510.7-5.6-4.2-4.8-3.6-0.4-0.9-1.9-2.6-4.2-4.8
State&LocalGovernment4.54.54.64.64.64.64.64.64.64.64.64.74.7
PctChgYearAgo2.51.61.40.70.80.80.90.90.91.01.21.31.4
Other Economic Indicators
Population(Ths)171.6172.0172.3172.7173.2173.6174.0174.4174.9175.3175.7176.2176.6
PctChgYearAgo1.31.10.90.80.90.91.01.01.00.91.01.01.0
LaborForce(Ths)54.554.754.754.854.955.055.155.255.355.355.455.555.5
PctChgYearAgo1.82.01.01.50.70.50.70.70.60.70.60.60.5
UnemploymentRate(%)5.55.75.96.16.26.36.46.46.46.46.36.36.2
TotalHousingStarts2180.12008.01853.81651.01474.11410.71362.61327.61341.21327.91318.61314.31304.9 Single-Family2166.21993.31837.11632.11451.11382.61325.61287.31293.91279.01268.21261.81251.2
Multifamily14.014.716.718.923.128.136.940.347.348.950.452.553.7
PROFILES
The Jacksonville MSA is comprised of Baker, Clay, Duval, Nassau, and St. Johns counties. It is located on the northeast coast of Florida and is home to several major U.S. military bases, such as the Jacksonville Naval Air Station, shipyards, the University of North Florida, and the Jacksonville International Airport.
QUICK FACTS
• Metro population estimate of 1,713,240 as of 2023 (ACS 5-Year Estimate) (U.S. Census Bureau).
• Baker County population estimate of 28,186 as of 2023 (ACS 5-Year Estimate).
• Clay County population estimate of 232,439 as of 2023 (ACS 5-Year Estimate).
• D uval County population estimate of 1,030,822 as of 2023 (ACS 5-Year Estimate).
• Nassau County population estimate of 101,501 as of 2023 (ACS 5-Year Estimate).
• St. Johns County population estimate of 320,110 as of 2023 (ACS 5-Year Estimate).
• Civilian labor force of 842,067 in December 2024 (FRED, U.S. Bureau of Labor Statistics).
• A n unemployment rate of 3.0% as of December 2024, not seasonally adjusted. This amounts to 25,480 unemployed people (FRED, U.S. Bureau of Labor Statistics).
OUTLOOK SUMMARIES
The Jacksonville Metropolitan Statistical Area (MSA) is expected to see above-average growth in most of the economic indicators, relative to the other MSAs studied. Jacksonville’s expected Gross Metro Product will be $113,092.45 million. Personal income growth of 5.5 percent will put the MSA’s per capita income level at $57,000. Average annual wage growth of 4.2 percent will push the average real annual wage to $82,200. Population growth will be 1.1 percent. Employment growth is expected to average 0.9 percent annually. Jacksonville’s unemployment rate will come in at 4.2 percent.
The fastest growing sector in the Jacksonville MSA will be the Other Services sector, which will see an average annual growth rate of 2.6 percent. The Education and Health Services sector will come in at a growth rate of 2.0 percent. The Information and Manufacturing sectors will see respective contractions in growth of -2.9 percent, and -1.5 percent.
METRO NEWS SUMMARIES
Jacksonville, Florida, shopping center sells after a year on market
• A f ully leased shopping center in Jacksonville, Florida, part of the Avenues Walk development, sold for $8.3 million to a Canadian corporation led by Basil Thompson, CEO of Enviro World Corp., marking an international investment in local retail real estate.
• The 63,103-square-foot property was previously acquired for $5.55 million by Roshan Hospitality in December 2023, reflecting a rapid resale and notable value appreciation in under 16 months.
• A nchored by long-term tenants like Dollar Tree and new additions such as PickleRage, the property also includes zoning for an additional 10,000 square feet of development near Chuck E. Cheese, positioning it for future expansion.
Source: CoStar, March 29, 2025
UF’s Florida Semiconductor Institute in Jacksonville to grow the statewide ecosystem
• The University of Florida’s Florida Semiconductor Institute (FSI) is launching research operations in Jacksonville this fall, with plans for a permanent facility aimed at advancing semiconductor technology, creating over 10,000 high-wage jobs, and driving innovation across Florida’s economy.
• With $80 million in combined funding, including a $45 million Advanced Technology Center, FSI will foster public-private partnerships, accelerate tech commercialization,
and support national security research, particularly aligning with Jacksonville’s strong military presence.
• The institute will also play a central role in workforce development, aiming to meet a projected 25% growth in Florida’s semiconductor sector by 2030, and will integrate with UF’s academic programs in AI, engineering, and computer science to equip talent for future industry needs.
Source: UF News, March 31, 2025
Regency Square Mall sold to real estate company in pursuit of mall for 6 years, council member says
• A fter years of decline and community frustration, Jacksonville’s Regency Square Mall has been sold to Backwater Development. This real estate firm had been pursuing the property for six years and plans to redevelop it into a mixed-use space with housing, retail, and entertainment.
• City Councilman Ken Amaro welcomed the sale, calling it “well overdue” and highlighting past issues like poor maintenance and resident complaints that signaled the mall’s deterioration and the urgent need for revitalization.
• The redevelopment is seen as a strategic step toward revitalizing Jacksonville’s Arlington area, with hopes for a vibrant, inclusive community hub that promotes economic growth and quality of life.
Source: First Coast News, April 10, 2025
Newly constructed industrial distribution center in Jacksonville, FL sold for $53.75M
• Imeson Commerce Center, a newly built 422,136-square-foot industrial distribution facility in Jacksonville, was sold for $53.75 million to CIP Real Estate, highlighting investor demand for premium logistics properties in strategic markets.
• The facility, fully leased to RoadOne IntermodaLogistics, features high-end infrastructure such as 81 dock-high doors and 103,000 square feet of air- conditioned warehouse space—an uncommon asset in Jacksonville’s industrial sector.
• L ocated within the city’s premier logistics hub near major transportation routes and JAXPORT, the property underscores Jacksonville’s growing role as a critical logistics and distribution center with sustained market strength.
Source: JLL, April 14, 2025
A glimpse at the self-driving, autonomous shuttles coming to Jacksonville, Florida
• Jacksonville is set to become the first U.S. city to launch a fully autonomous shuttle system as part of its public transit network, following the Jacksonville Transportation Authority’s purchase of 100 driverless vehicles from German manufacturer Holon, which will also establish a $100 million plant in the city.
• The new Autonomous Innovation Center, unveiled on April 17, will serve as the operational hub for the shuttles, which use advanced technologies like lidar, radar, and GPS to navigate without human drivers, reflecting Florida’s supportive legal framework for autonomous vehicles.
• Jacksonville joins a growing list of Florida cities piloting autonomous transit, but stands out for its ambition to scale the system citywide with permanent infrastructure and full fare-paying service integration.
Source: Florida Times-Union, April 23, 2025
Long Term Outlook for Jacksonville, FL
June 2025 Forecast
Personal Income (Billions $)
202020212022202320242025202620272028
TotalPersonalIncome88.499.0104.1111.9118.6124.3131.0138.9146.6
PctChgYearAgo8.411.95.27.56.04.85.46.05.6
WagesandSalaries44.048.654.357.661.263.967.170.774.6
NonwageIncome44.450.449.854.357.460.463.968.172.0
RealPersonalIncome(12$)87.792.091.093.696.798.2100.9105.0108.9
PctChgYearAgo6.75.0-1.12.83.31.52.74.03.8
PerCapitaIncome(Ths)54.760.161.764.867.369.672.776.479.8
RealPerCapitaIncome(12$)54.255.954.054.254.855.056.057.759.2
AverageAnnualWage(Ths)60.964.368.971.274.576.880.384.087.7
PctChgYearAgo6.95.67.13.44.63.14.54.64.4
Establishment Employment (Place of Work, Thousands, SA)
TotalEmployment706.0735.9771.4791.5805.0815.0819.5825.6833.7
PctChgYearAgo-2.54.24.82.61.71.20.60.71.0
Manufacturing32.532.734.435.836.335.835.234.634.2 PctChgYearAgo-0.30.94.94.21.5-1.4-1.6-1.7-1.2 Nonmanufacturing673.6703.1737.0755.7768.7779.2784.3791.0799.5 PctChgYearAgo-2.64.44.82.51.71.40.70.81.1
Construction&Mining46.248.250.250.753.055.155.856.256.8 PctChgYearAgo-0.54.24.21.14.53.91.40.61.2 Trade,Trans,&Utilities155.3160.4167.5169.7171.8174.2175.3177.6177.4 PctChgYearAgo-1.43.34.51.31.31.40.71.3-0.1 WholesaleTrade26.527.028.829.630.030.430.730.930.8 RetailTrade78.081.283.284.986.887.387.288.487.9 Trans,Wrhsng,&Util50.852.255.655.255.056.457.558.358.7 Information10.511.413.514.614.414.314.213.512.8 PctChgYearAgo4.49.118.67.5-0.8-0.9-0.9-4.9-4.8 FinancialActivities66.970.073.275.575.072.072.773.974.8 PctChgYearAgo0.74.54.63.2-0.7-4.01.01.61.3 Prof&BusinessServices108.3115.6123.8121.4120.9122.7121.2120.4124.6 PctChgYearAgo-1.36.77.1-2.0-0.41.5-1.2-0.63.4 Educ&HealthServices109.2112.1117.6125.4131.1136.0138.2139.9141.6
PctChgYearAgo-0.32.64.96.64.63.71.61.21.3
Leisure&Hospitality73.881.286.791.392.594.496.197.197.1
PctChgYearAgo-15.110.06.85.31.32.11.81.00.0 OtherServices26.227.227.328.229.229.730.231.232.4
PctChgYearAgo-4.63.80.43.43.61.71.73.23.8 FederalGovernment19.219.019.019.520.320.119.419.519.6
PctChgYearAgo2.9-0.90.02.84.1-1.0-3.60.70.6 State&LocalGovernment58.058.158.159.460.460.761.161.762.2
PctChgYearAgo-1.80.10.02.31.60.50.61.00.9
Other Economic Indicators
Population(Ths)1616.71646.01687.01727.91763.61785.01800.91818.21838.4
PctChgYearAgo1.81.82.52.42.11.20.91.01.1
LaborForce(Ths)775.6799.3827.8848.4856.0875.2883.4892.3900.8
PercentChange,YearAgo-0.73.13.62.50.92.20.91.01.0 UnemploymentRate(%)6.64.23.03.13.53.94.34.44.2 TotalHousingStarts15397.220940.320778.118952.514948.614059.015438.815825.015756.7
Single-Family12640.515870.714379.212916.112769.111475.311930.211877.711504.9
Multifamily2756.85069.66398.96036.42179.62583.73508.53947.34251.8
Short Term Outlook for Jacksonville, FL
June 2025 Forecast
Personal Income (Billions $)
2025:12025:22025:32025:42026:12026:22026:32026:42027:12027:22027:32027:42028:1
TotalPersonalIncome122.2123.9124.9126.1128.1130.1132.0133.8136.0138.0139.8141.7143.7
PctChgYearAgo4.35.24.84.84.85.05.76.16.26.06.05.85.7
WagesandSalaries62.863.764.264.965.966.767.568.469.470.371.272.173.1
NonwageIncome59.460.260.661.262.263.464.465.466.767.768.669.670.6
RealPersonalIncome(12$)98.198.098.298.699.5100.5101.4102.3103.5104.5105.5106.4107.4
PctChgYearAgo1.91.81.21.11.42.63.33.84.04.04.14.03.8
PerCapitaIncome(Ths)68.769.569.970.471.472.373.274.175.176.076.877.678.5
RealPerCapitaIncome(12$)55.155.054.955.055.455.956.256.657.157.558.058.358.7
AverageAnnualWage(Ths)75.876.577.178.079.079.980.781.682.683.684.585.486.4
PctChgYearAgo2.43.63.03.44.24.44.74.74.64.64.74.64.6
Establishment Employment (Place of Work, Thousands, SA)
TotalEmployment811.2816.1816.5816.2817.3818.6820.4821.9823.3824.8826.3827.9829.8
PctChgYearAgo1.31.51.21.00.80.30.50.70.70.80.70.70.8
Manufacturing36.036.035.735.635.335.435.235.034.834.734.534.434.4
PctChgYearAgo-0.2-0.5-2.7-2.3-1.8-1.6-1.3-1.7-1.3-2.0-2.0-1.6-1.3
Nonmanufacturing775.2780.2780.8780.6782.0783.2785.1786.9788.5790.1791.8793.4795.4
PctChgYearAgo1.41.61.41.20.90.40.50.80.80.90.90.80.9
Construction&Mining54.555.055.355.555.755.855.956.056.156.156.256.356.5 PctChgYearAgo4.74.53.43.02.11.51.10.80.70.60.50.70.8 Trade,Trans,&Utilities173.4174.5174.5174.3174.4174.8175.7176.4177.2177.6177.9177.8177.1
PctChgYearAgo1.21.71.60.90.60.20.71.21.61.61.30.80.0 WholesaleTrade30.330.530.530.530.630.630.730.830.931.030.930.930.9 RetailTrade87.487.787.386.986.787.087.487.688.088.488.788.687.6 Trans,Wrhsng,&Util55.856.356.756.957.157.357.658.058.258.358.358.458.6 Information14.414.314.314.214.314.314.214.013.813.613.413.113.0
PctChgYearAgo0.3-0.2-2.2-1.3-1.0-0.3-1.0-1.3-3.2-4.7-5.6-6.1-5.9 FinancialActivities71.972.171.972.072.472.572.973.173.573.874.074.274.7
PctChgYearAgo-4.9-4.6-4.3-2.20.70.61.31.51.61.71.61.41.7 Prof&BusinessServices121.7123.1123.5122.3121.9121.3121.0120.7120.1120.2120.4121.1122.6 PctChgYearAgo1.21.81.61.30.1-1.5-2.1-1.4-1.5-0.9-0.50.42.2 Educ&HealthServices134.7135.9136.4137.0137.6138.1138.4138.8139.4139.7140.1140.2141.1
PctChgYearAgo4.04.23.92.92.21.61.51.31.31.21.21.01.3 Leisure&Hospitality93.894.294.495.395.695.996.396.796.896.997.297.696.6
PctChgYearAgo1.51.52.33.02.01.72.01.51.21.01.00.9-0.2
OtherServices29.629.729.829.930.030.130.330.530.831.131.331.632.0
PctChgYearAgo1.71.11.42.61.31.41.72.22.63.13.43.53.9 FederalGovernment20.620.520.019.319.319.419.419.419.519.519.519.519.6
PctChgYearAgo2.71.5-2.1-6.2-6.0-5.7-3.20.70.70.70.70.60.6
State&LocalGovernment60.660.760.760.860.861.061.261.361.561.661.861.962.0
PctChgYearAgo0.80.80.40.10.50.40.70.91.01.01.00.90.9
Other Economic Indicators
Population(Ths)1778.81783.01787.21791.11795.01798.81802.91807.11811.11815.81820.61825.41830.8
PctChgYearAgo1.61.31.11.00.90.90.90.90.90.91.01.01.1
LaborForce(Ths)869.9876.1877.0877.8880.2882.3884.4886.8889.0891.2893.4895.5897.6
PctChgYearAgo2.12.52.22.31.20.70.91.01.01.01.01.01.0
UnemploymentRate(%)3.73.94.04.24.34.34.44.44.44.44.44.44.3
TotalHousingStarts13177.513886.914501.714670.015028.115327.615628.715770.715851.015863.815809.215775.815741.0
Single-Family10961.311401.811724.911813.111851.411928.711957.411983.311977.811928.111848.711756.111631.1
Multifamily2216.22485.12776.82856.93176.63398.93671.23787.43873.23935.83960.54019.74109.9
PROFILES
The Lakeland–Winter Haven MSA is comprised only of Polk County. It is located in the westerncenter of the state and is heavily agriculturally based, especially in citrus. Lakeland is the home to Legoland Florida and is also the location of Publix Supermarket headquarters. Each year the Detroit Tigers host spring training at Joker Marchant Stadium. Lakeland is also home to Florida Polytechnic University, the newest member of the State University System.
QUICK FACTS
• Metro population estimate of 818,330 as of 2023 (ACS 5-Year Estimate) (U.S. Census Bureau).
• Polk County population estimate of 818,330 as of 2023 (ACS 5-Year Estimate).
• Civilian labor force of 344,188 in December 2024 (FRED, U.S. Bureau of Labor Statistics).
• A n unemployment rate of 3.8% as of December 2024, not seasonally adjusted. This amounts to 12,931 unemployed people (FRED, U.S. Bureau of Labor Statistics).
OUTLOOK SUMMARIES
The studied economic indicators are predicted to show mixed levels of growth in the Lakeland Metropolitan Statistical Area (MSA). Gross Metro Product for the MSA will come in at $35,073.98 million. Despite experiencing the 2nd highest personal income growth rate at 6.4 percent, the per capita income of this MSA will be the lowest of all the areas studied at $39,000. The average annual wage will grow at an annual rate of 4.5 percent (4th highest) for an average annual wage of $67,600. Lakeland’s population will grow at an annual rate of 1.9 percent (2nd highest).
Employment growth is expected to average 1,1 percent, and Lakeland will experience a moderately high unemployment rate of 5.0 percent compared to the other MSAs.
The Other Services sector will lead the MSA in average annual growth at 3.3 percent. The Education and Health Services sector will follow at 2.4 percent. The Professional and Business Services sector along with the Manufacturing sector will see respective contractions in growth of -0.3 percent and -1.0 percent.
METRO NEWS SUMMARIES
The who’s who and what’s what of Lakeland’s economy: Meet the top employers and industries
• The top 10 leading industries driving the Lakeland metropolitan area’s economy, using data from the Lakeland Economic Development Council (LEDC) are the Aviation, Medical device packaging, Healthcare and life sciences, Supply chain and logistics, Data centers, Financial services, Software and IT, Flavor and essences, Corporate headquarters, and Value-added manufacturing industries.
• Lakeland hosts the annual SUN ‘n FUN Aerospace Expo and has over 60 enterprises which use Lakeland as their flight zone thanks to the Lakeland International Airport. Notably, Lakeland also continues to be a leading innovator in sterilization and device packaging with companies like Avantor and SteriPack driving job growth.
• The Lakeland Regional Health and Watson Clinic employ 20,000 people together. Assure Infusions, a pharmaceutical manufacturing company, also opened a 60,000- squarefoot facility for medical fluids. Thanks to companies like Amazon, Pepsi, Rooms To Go, and Walmart have opened area warehouses employing over 12,500 people.
Source: LALToday, March 14, 2025
Altman Joint Venture secures $16 million for Lakeland logistics development
• The 202,000-square-foot development, Apex Logistics at Lakeland, has acquired $16 million
in construction financing. The developer, Altman Logistics Properties, partnered with FRP Development Corp. and secured financing from Seacoast Bank to redevelop the 22.5-acre site.
• The redevelopment involves replacing the recently demolished office building with sitework set to start in the first quarter of this year and vertical construction starting later this year. The targeted completion date is early 2026.
• The site sits in a prime location for logistics operations as it sits 50 miles from both Tampa Bay and Orlando. The redevelopment is joined by other expansion projects such as Apex Logistics Park at Signature Grand and Apex Logistics Park at Delray.
Source: TBBW, March 18, 2025
Lakeland business, airport prepare for hundreds of thousands of visitors for SUN ‘n FUN
• Thousands of visitors came to Lakeland for the SUN ‘n FUN Aerospace Expo which took place April 1st, and businesses have been looking forward to this annual event. The Expo contributes tens of millions of dollars to Lakeland’s economy.
• A my Wiggins, president and CEO of the Lakeland Chamber of Commerce, explained the large investments made to their airports to boost this event, with her calling it the Super Bowl of Lakeland for 51 years.
• D uring the week of the event, they have an airplane landing nearly every minute to 30 seconds. Due to how busy it gets; the FAA provides 63 air traffic controllers across the nation to help direct air traffic.
Source: WFLA, April 1, 2025
IFF Unveils Cutting-Edge Citrus Innovation Center in Florida
• The International Flavors & Fragrances Inc. (NYSE: IFF) announced the opening of the Citrus Innovation Center in Lakeland located at Florida Polytechnical University. The center will have cutting-edge technology to research applications in food and beverage, fine fragrance, body care, and fabric & home care.
• The center will have direct access to industry experts and will support approximately 40 jobs with the opportunity for job rotations, professional development, and training for future growth and innovation.
• The facility was built with an environmental footprint in mind and holds a LEED silver certification, a solar array system to meet the entire site’s power needs, and the use of reclaimed water.
Source: Business Wire, April 9, 2025
‘Economic disaster’: Polk County tourism agency lashes out at bills to cut tourism marketing
• Visit Central Florida director Mark Jackson is calling it an “economic disaster waiting to happen” at the Polk County Tourist Development Council meeting regarding provisions in bills HB 1221 and HB 7033.
• These provisions would eliminate local tourist development councils across Florida and would repurpose tourist development tax money to go toward property tax breaks rather than for marketing purposes.
• In Polk County, tourism development taxes were $25 million but the new bills would redirect this money outside of capital investments for sports leagues, an industry that has acted as a buffer for the local economy for years in face of nationwide economic downturns. It would also cut $1.6 million in arts and cultural events and potentially derail nine proposed hotel properties.
Source: The Lakeland Ledger, April 24, 2025
Long Term Outlook for Lakeland-Winter Haven, FL
June 2025 Forecast
Personal Income (Billions $)
202020212022202320242025202620272028
TotalPersonalIncome29.833.134.036.438.541.044.046.849.3
PctChgYearAgo10.711.12.77.05.86.67.26.55.3
WagesandSalaries12.413.615.116.016.817.818.920.021.0
NonwageIncome17.419.518.920.421.623.325.026.828.3
RealPersonalIncome(12$)30.531.630.431.032.033.034.536.037.3
PctChgYearAgo9.93.6-3.71.83.13.34.54.53.5
PerCapitaIncome(Ths)40.643.642.743.944.946.648.951.353.5
RealPerCapitaIncome(12$)41.641.638.337.437.337.538.439.540.5
AverageAnnualWage(Ths)51.553.456.658.560.862.965.869.172.4
PctChgYearAgo6.23.76.03.53.93.54.65.04.8
Establishment Employment (Place of Work, Thousands, SA)
TotalEmployment239.3254.1265.3272.0275.7280.9286.3288.2288.5
PctChgYearAgo1.46.24.42.61.31.91.90.60.1
Manufacturing17.918.219.619.719.819.819.519.219.0
PctChgYearAgo-0.61.67.60.60.40.2-1.4-1.7-1.1
Nonmanufacturing221.4235.9245.7252.4255.9261.1266.8269.0269.5
PctChgYearAgo1.56.64.12.71.42.02.20.80.2
Construction&Mining15.015.315.316.016.616.817.217.217.1
PctChgYearAgo4.52.4-0.44.93.31.82.3-0.4-0.5 Trade,Trans,&Utilities66.173.774.474.875.877.979.780.780.1
PctChgYearAgo8.011.41.00.51.32.92.31.3-0.7 WholesaleTrade11.211.311.511.812.312.412.812.912.8 RetailTrade29.331.532.332.733.033.834.134.533.9 Trans,Wrhsng,&Util25.730.930.630.330.531.732.933.333.4 Information1.82.02.42.42.42.52.62.52.5 PctChgYearAgo-6.99.722.3-1.0-0.74.44.5-2.3-3.1 FinancialActivities14.114.716.416.615.816.216.816.816.7
PctChgYearAgo5.94.412.01.2-4.92.33.50.3-0.7 Prof&BusinessServices32.935.438.039.339.539.339.038.439.0 PctChgYearAgo1.47.57.33.50.5-0.5-0.7-1.61.5 Educ&HealthServices34.535.337.139.441.542.944.245.045.5 PctChgYearAgo0.32.45.16.25.33.62.91.91.1
Leisure&Hospitality21.424.126.226.926.626.727.828.428.6
PctChgYearAgo-13.112.88.62.6-1.30.54.32.10.5
OtherServices6.87.37.78.08.08.38.68.89.1
PctChgYearAgo-4.16.84.84.10.14.33.52.52.7
FederalGovernment1.41.31.31.41.51.61.61.51.5
PctChgYearAgo13.6-9.13.46.46.89.3-3.5-2.1-2.8
State&LocalGovernment27.426.826.927.528.428.829.429.629.6
PctChgYearAgo-0.1-2.00.22.53.11.32.10.8-0.1
Other Economic Indicators
Population(Ths)734.2760.0794.8827.6856.1879.5897.9912.0922.0
PctChgYearAgo2.83.54.64.13.42.72.11.61.1
LaborForce(Ths)324.8334.9345.3355.3358.4365.6367.5369.2370.6
PercentChange,YearAgo3.93.13.12.90.92.00.50.50.4
UnemploymentRate(%)9.25.23.63.74.24.75.15.24.9
TotalHousingStarts9130.212392.211445.111666.310061.29583.08579.37848.37698.7
Single-Family7096.410246.39157.48942.78769.97169.66847.56483.36221.4
Multifamily2033.82145.92287.72723.61291.32413.41731.71365.01477.3
Short Term Outlook for Lakeland-Winter Haven, FL
June 2025 Forecast
Personal Income (Billions $)
2025:12025:22025:32025:42026:12026:22026:32026:42027:12027:22027:32027:42028:1
TotalPersonalIncome40.040.741.342.042.843.744.445.045.846.547.247.748.4
PctChgYearAgo5.66.86.87.27.07.17.47.27.16.56.36.15.7
WagesandSalaries17.317.617.918.218.518.819.119.419.619.920.220.420.6
NonwageIncome22.723.123.423.824.324.925.325.726.226.627.027.427.8
RealPersonalIncome(12$)32.732.833.133.433.834.334.735.035.535.936.336.536.9
PctChgYearAgo3.33.43.23.53.54.64.94.84.94.54.44.33.8
PerCapitaIncome(Ths)45.946.546.847.348.048.749.349.850.551.151.652.152.7
RealPerCapitaIncome(12$)37.537.437.537.737.938.338.638.839.139.439.739.940.1
AverageAnnualWage(Ths)62.262.663.163.864.765.466.166.967.868.769.670.471.3
PctChgYearAgo2.73.73.53.94.14.64.84.84.75.05.35.25.2
Establishment Employment (Place of Work, Thousands, SA)
TotalEmployment277.0280.4282.5283.6284.8285.9287.0287.8288.2288.2288.2288.1288.1
PctChgYearAgo0.91.92.22.72.82.01.61.51.20.80.40.10.0
Manufacturing19.819.819.819.719.519.619.519.419.319.219.119.119.1
PctChgYearAgo0.50.1-0.30.4-1.5-1.2-1.2-1.7-1.4-2.1-2.0-1.5-1.1
Nonmanufacturing257.2260.5262.7263.9265.2266.2267.4268.4269.0269.0269.0269.0269.0
PctChgYearAgo0.92.02.42.83.12.21.81.71.41.00.60.20.0
Construction&Mining16.516.817.017.117.217.217.317.317.217.217.117.117.1 PctChgYearAgo-0.32.11.93.44.42.71.60.70.3-0.3-0.7-0.9-1.0 Trade,Trans,&Utilities76.677.978.578.779.079.479.980.480.780.880.780.680.2
PctChgYearAgo1.73.33.13.33.12.01.92.12.11.71.00.3-0.6 WholesaleTrade12.212.412.512.612.712.712.812.912.912.912.912.912.9 RetailTrade33.533.933.933.833.834.034.234.334.434.534.534.433.9 Trans,Wrhsng,&Util30.931.632.132.332.632.733.033.233.333.433.333.333.4 Information2.42.52.52.52.62.62.62.62.62.62.52.52.5
PctChgYearAgo4.94.34.93.45.75.63.63.00.1-1.9-3.3-4.2-4.2 FinancialActivities15.816.116.416.616.716.716.816.816.916.916.816.816.8
PctChgYearAgo-1.82.53.55.35.64.02.71.71.10.60.1-0.4-0.3 Prof&BusinessServices38.939.439.639.339.239.138.938.838.538.438.338.338.6 PctChgYearAgo-0.9-1.40.00.20.7-0.8-1.6-1.2-1.8-1.8-1.7-1.20.3 Educ&HealthServices42.442.843.143.543.744.044.344.644.945.045.145.145.4
PctChgYearAgo4.03.82.93.63.22.92.82.62.62.21.71.21.2 Leisure&Hospitality26.226.526.827.227.527.727.928.228.328.328.528.628.4
PctChgYearAgo-3.1-0.12.13.04.94.44.23.52.82.31.91.50.3 OtherServices8.18.38.48.58.68.68.68.78.88.88.98.99.0
PctChgYearAgo1.03.35.67.55.73.72.72.02.22.62.72.52.7
FederalGovernment1.61.61.61.61.61.61.61.61.51.51.51.51.5
PctChgYearAgo15.112.68.71.4-3.8-4.8-4.2-1.1-1.4-1.8-2.3-2.7-2.8
State&LocalGovernment28.528.728.829.029.229.329.429.629.629.629.629.629.6
PctChgYearAgo1.71.31.11.22.12.12.12.01.61.10.50.1-0.1
Other Economic Indicators
Population(Ths)871.7877.2882.1886.9891.7896.3900.0903.7907.2910.7913.8916.2918.6
PctChgYearAgo3.12.82.62.42.32.22.01.91.71.61.51.41.3
LaborForce(Ths)363.6365.9366.3366.6367.0367.2367.7368.1368.6369.0369.4369.7370.1
PctChgYearAgo1.82.31.92.00.90.40.40.40.40.50.50.40.4
UnemploymentRate(%)4.54.64.85.05.15.15.25.25.25.25.25.15.0
TotalHousingStarts10044.09652.49520.39115.38796.98725.98507.78286.57952.47873.77804.07763.27726.4 Single-Family7386.37176.67132.96982.56844.66906.56855.36783.66603.36511.36436.16382.56305.7
Multifamily2657.62475.92387.42132.81952.21819.41652.51502.91349.11362.41367.91380.71420.8
PROFILES
The Miami-Fort-Lauderdale-West Palm Beach MSA is comprised of Miami-Dade County, Broward County, and Palm Beach County. Home to the most populous county in the state of Florida and seventh in the United States, it is located on the southeast coast of Florida. Miami hosts many sports teams including the Miami Dolphins, the Miami Heat, the Florida Marlins, and the Florida Panthers, as well as many institutions of higher education including the University of Miami and Florida International University.
QUICK FACTS
• Metro population estimate of 6,183,199 as of 2023 (ACS 5-Year Estimate) (U.S. Census Bureau).
• M iami Dade County population estimate of 2,686,867 as of 2023 (ACS 5-Year Estimate).
• Broward County population estimate of 1,962,531 as of 2023 (ACS 5-Year Estimate).
• Palm Beach County population estimate of 1,533,801 as of 2023 (ACS 5-Year Estimate).
• Civilian labor force of 3,241,598 in December 2024 (FRED, U.S. Bureau of Labor Statistics).
• A n unemployment rate of 2.8% as of December 2024, not seasonally adjusted. This amounts to 89,218 unemployed people (FRED, U.S. Bureau of Labor Statistics).
OUTLOOK SUMMARIES
The Miami—Fort Lauderdale—Palm Beach area is expected to show below-average levels of growth in the economic indicators. The area has the highest Gross Metro Product of the MSAs studied at an average level of $462,531.98 million. Personal income is expected to grow an average of 4.9 percent annually (3rd lowest rate), and the average real per capita income level of $64,600 (5th highest). The average annual wage growth will be 4.1 percent. The average annual wage level is expected to be 3rd highest in the state at $90,100. Miami’s population is expected to
grow at an average rate of only 0.1 percent each year, ranking 2nd lowest amongst MSAs studied. Employment is expected to grow at a below-average rate of 0.6 percent each year, while unemployment is expected to be at an average rate of 3.8 percent (3rd lowest).
Miami’s fastest growing sector is expected to be the Other Services sector, which will experience 3.3 percent average annual growth, followed by the Education and Health Services sector, which will grow at an average of 2.4 percent. The Manufacturing and Professional and Business Services sector will see the largest contraction at -1.2 and -0.8 percent respectively.
METRO NEWS SUMMARIES
$2.6B project with 5,720 apartments proposed in Miami-Dade
• Developer Michael Swerdlow has proposed a $2.64 billion redevelopment project in MiamiDade’s Little River neighborhood that would add 5,720 affordable and workforce apartments on 35+ acres of county-owned land, along with commercial space, a potential Tri-Rail station, and 250,000 square feet of green space.
• The plan includes a 99-year lease agreement with Miami-Dade County and aims to transform existing public housing sites while ensuring current residents can remain onsite during phased construction; an additional 2,100 market-rate units and nearly 300,000 square feet of retail are planned on adjacent private land.
• County staff estimates the lease deal could generate $9.56 billion in payments over its lifespan, with strong local hiring and minority business participation commitments included in the agreement, which is pending final commission approval.
Source: South Florida Business Journal, March 6, 2025
The Weekly Dirt: Examining DOGE’s potential South Florida sell-off
• Elon Musk’s Department of Government Efficiency (DOGE) is directing the sale of over 400 federal properties nationwide, including several in South Florida—such as the FBI’s
Miramar HQ and the historic David W. Dyer Federal Building in Miami—raising concerns about potential disruptions to the region’s already fragile office market.
• The sell-off, part of a broader effort to reduce government operating costs by an estimated $430 million annually, may offer prime redevelopment opportunities for developers, particularly in high-value urban sites like Brickell Bay Plaza, which could support a 48-story tower.
• However, the GSA’s sale process gives first priority to public uses like shelters and local governments before properties hit the private market, potentially delaying or limiting immediate development prospects despite high investor interest.
Source: The Real Deal, March 9, 2025
South Florida CRE Update – April 2025
• M iami remains a national commercial real estate hotspot, ranking second in CBRE’s 2025 U.S. Investor Intentions Survey, with strong investor interest in multifamily and industrial assets, though rising operating costs and interest rate uncertainty remain key challenges.
• Major South Florida developments include SG Holdings’ $3 billion Little River mixeduse project, Midtown Park Residences by Proper, and PMG’s 659-unit condo tower in Park West, while Amazon’s record lease in Wynwood and increased industrial activity reflect continued tenant demand.
• Despite a softening in certain sectors like office and retail, South Florida’s CRE market shows resilience, with smaller deals gaining traction, port activity rebounding, and new sectors like data centers attracting major investment, positioning the region for steady growth in 2025.
Source: CityBiz, April 4, 2025
Miami-Dade city approves its 1st Live Local Act project
• South Miami has approved its first project under Florida’s Live Local Act, greenlighting Bindor LLC’s 21-story mixed-use development, The Alexander, which will include 236 apartments—95 of which will be designated as workforce housing—and 1,708 square feet of retail space.
• The project bypassed traditional zoning restrictions thanks to the state law, which allows developers to increase density on commercial or industrial sites if 40% of units are reserved for households earning up to 140% of the area median income.
• L ocated near the South Miami Metrorail Station, The Alexander will feature transitfriendly amenities like a public plaza, coworking lounge, rooftop deck, and pools, with construction expected to begin in Q2 2026.
Source: South Florida Business Journal, April 7, 2025
What’s the cost to Florida’s economy of Canadian tariffs and canceling spring break? | Opinion
• F lorida’s economy, especially in South Florida, is feeling pressure from a decline in Canadian tourism. This is due, in part, to political tensions and rising travel costs, compounded by Canadian government-funded billboards criticizing U.S. tariffs.
• The loss of Canadian visitors, who traditionally make up over 1 million annual tourists and form a crucial part of the winter “snowbird” economy, is straining small businesses and restaurants, even as cities like Miami Beach see stable hotel occupancy thanks to a shift away from chaotic spring break crowds.
• W hile Florida’s tourism appeal remains strong, reliance on seasonal visitors makes the state vulnerable to geopolitical and cultural shifts.
Source: Miami Herald, April 8, 2025
Long Term Outlook for Miami-Fort Lauderdale-Pompano Beach, FL
June 2025 Forecast
Personal Income (Billions $)
202020212022202320242025202620272028
TotalPersonalIncome398.4447.2482.6521.3551.0574.1601.7635.0666.1
PctChgYearAgo4.212.27.98.05.74.24.85.54.9
WagesandSalaries167.6192.0213.5228.8243.2253.8266.2279.1292.0
NonwageIncome230.9255.2269.2292.5307.8320.3335.6355.8374.2
RealPersonalIncome(12$)347.7373.4371.8386.8398.6402.5411.2425.8439.0
PctChgYearAgo2.17.4-0.44.13.01.02.23.63.1
PerCapitaIncome(Ths)65.173.077.582.185.288.292.697.8102.6
RealPerCapitaIncome(12$)56.861.059.760.961.661.863.365.667.6
AverageAnnualWage(Ths)65.471.775.578.381.784.287.992.196.0
PctChgYearAgo8.09.75.33.74.43.04.44.74.2
Establishment Employment (Place of Work, Thousands, SA)
TotalEmployment2551.22661.42812.92908.52962.02999.73013.53017.53027.9
PctChgYearAgo-6.44.35.73.41.81.30.50.10.3
Manufacturing87.589.894.698.9102.0102.2100.498.797.4
PctChgYearAgo-4.42.75.44.63.10.1-1.8-1.7-1.3
Nonmanufacturing2463.82571.62718.32809.52860.02897.52913.12918.82930.5
PctChgYearAgo-6.54.45.73.41.81.30.50.20.4
Construction&Mining140.2140.7145.5153.4159.7163.7166.3166.9168.3
PctChgYearAgo-2.00.43.45.44.12.51.50.40.9 Trade,Trans,&Utilities585.1606.6636.4652.0659.9672.3675.6680.7675.4 PctChgYearAgo-5.53.74.92.51.21.90.50.8-0.8 WholesaleTrade143.1147.7153.9159.1162.4166.1168.3170.5170.5 RetailTrade310.1319.6330.9335.3336.4341.5340.5342.4337.4 Trans,Wrhsng,&Util131.9139.2151.7157.6161.2164.6166.9167.9167.5 Information47.650.555.856.254.754.055.554.754.0 PctChgYearAgo-6.76.210.40.7-2.6-1.32.8-1.5-1.3 FinancialActivities188.1197.0210.4217.4220.2221.9224.1224.4223.7 PctChgYearAgo-0.94.86.83.41.30.81.00.1-0.3 Prof&BusinessServices436.7468.3509.3518.3520.7518.3506.3495.2503.7 PctChgYearAgo-3.47.28.71.80.5-0.5-2.3-2.21.7 Educ&HealthServices397.0408.2426.1449.0463.0477.4486.6491.7497.2 PctChgYearAgo-3.22.84.45.43.13.11.91.01.1 Leisure&Hospitality256.7289.7321.8339.1347.8350.3357.2361.0361.1 PctChgYearAgo-23.112.911.15.42.60.72.01.10.0 OtherServices107.0109.2111.3114.4117.8119.6120.7123.1126.2 PctChgYearAgo-11.22.02.02.73.01.50.92.02.5 FederalGovernment36.135.335.436.137.436.735.736.136.4 PctChgYearAgo4.6-2.20.42.03.4-1.7-2.81.10.9 State&LocalGovernment269.4266.1266.2273.6278.8283.3285.1285.0284.6 PctChgYearAgo-4.5-1.20.02.81.91.60.60.0-0.1
Other Economic Indicators
Population(Ths)6122.46125.06228.96351.16467.36512.96499.46492.16494.3
PctChgYearAgo-0.10.01.72.01.80.7-0.2-0.10.0 LaborForce(Ths)2992.93069.13179.93269.53310.23353.43368.23377.73385.4 PercentChange,YearAgo-4.42.53.62.81.21.30.40.30.2 UnemploymentRate(%)8.55.12.82.52.93.33.84.04.0
TotalHousingStarts20091.920709.819762.018057.313309.817237.720436.821731.522998.3 Single-Family7511.48261.66912.65540.25545.05585.86793.77108.47031.4
Multifamily12580.412448.312849.412517.17764.811651.913643.114623.115966.9
Short Term Outlook for Miami-Fort Lauderdale-Pompano Beach, FL
June 2025 Forecast
Personal Income (Billions $)
2025:12025:22025:32025:42026:12026:22026:32026:42027:12027:22027:32027:42028:1
TotalPersonalIncome566.4572.7576.2581.2589.6597.9605.2614.1623.4631.2638.9646.4654.5
PctChgYearAgo3.84.54.34.24.14.45.05.75.75.65.65.35.0
WagesandSalaries249.9252.6254.9257.8261.5264.6267.6271.0274.3277.6280.8283.9287.0
NonwageIncome316.5320.1321.3323.4328.1333.3337.7343.2349.1353.7358.1362.5367.5
RealPersonalIncome(12$)403.4401.7401.9403.0406.2409.6412.5416.4420.8424.1427.7430.7434.1
PctChgYearAgo1.51.20.70.50.72.02.73.33.63.53.73.43.2
PerCapitaIncome(Ths)86.987.988.589.390.692.093.294.696.097.298.499.6100.8
RealPerCapitaIncome(12$)61.961.761.761.962.463.063.564.164.865.365.966.366.9
AverageAnnualWage(Ths)83.283.884.585.486.587.488.389.490.591.692.693.694.6
PctChgYearAgo2.33.53.13.34.04.24.64.74.64.84.84.74.5
Establishment Employment (Place of Work, Thousands, SA)
TotalEmployment2989.92999.73004.43004.83009.53013.43015.33015.93016.23017.13018.03018.73020.6
PctChgYearAgo1.31.41.21.10.70.50.40.40.20.10.10.10.1
Manufacturing102.9102.7101.7101.4100.5100.8100.499.799.398.898.498.298.0
PctChgYearAgo1.50.9-0.6-1.2-2.3-1.8-1.3-1.7-1.3-2.0-2.0-1.6-1.3
Nonmanufacturing2886.92897.12902.72903.32908.92912.62914.82916.22917.02918.22919.62920.62922.6
PctChgYearAgo1.31.41.31.20.80.50.40.40.30.20.20.20.2
Construction&Mining162.5163.2164.3165.0165.7166.2166.5166.5166.7166.7166.9167.2167.5
PctChgYearAgo3.42.71.52.62.01.91.40.90.60.30.20.40.4 Trade,Trans,&Utilities671.4672.8672.8672.2672.7674.6676.9678.3680.5681.3681.4679.8676.1
PctChgYearAgo2.12.22.01.20.20.30.60.91.11.00.70.2-0.6 WholesaleTrade165.9165.8166.3166.4167.2167.8168.7169.3170.3170.7170.6170.4170.7 RetailTrade341.5342.7341.6340.3339.5340.2341.0341.1342.0342.5343.1341.9337.5 Trans,Wrhsng,&Util164.0164.3164.8165.4166.0166.6167.1167.8168.1168.1167.7167.5167.9 Information53.853.854.254.255.155.755.755.555.355.054.554.054.0
PctChgYearAgo-3.7-1.5-0.60.72.63.52.82.30.4-1.3-2.2-2.7-2.5 FinancialActivities221.5221.7221.7222.6223.8224.0224.3224.3224.6224.6224.5224.0224.7
PctChgYearAgo0.50.60.41.51.01.11.20.80.40.30.1-0.10.0 Prof&BusinessServices516.8520.4521.0514.8511.7507.8504.5501.1496.6495.2494.1494.9499.1
PctChgYearAgo-0.50.0-0.5-0.9-1.0-2.4-3.2-2.7-2.9-2.5-2.1-1.20.5 Educ&HealthServices472.5476.2479.1481.8484.4486.4487.3488.5490.3491.4492.4492.8495.8
PctChgYearAgo3.03.33.13.02.52.11.71.41.21.01.00.91.1
Leisure&Hospitality349.0349.3349.8353.2355.0356.4357.9359.5359.8360.1361.3362.8359.2
PctChgYearAgo0.1-0.11.01.91.72.02.31.81.41.01.00.9-0.2 OtherServices119.5119.3119.5119.9120.2120.5120.7121.3122.0122.7123.4124.1125.3
PctChgYearAgo1.71.41.31.60.51.01.01.21.51.82.22.32.6 FederalGovernment37.737.436.635.335.535.735.835.936.036.136.136.236.3
PctChgYearAgo1.90.4-2.8-6.2-5.7-4.5-2.11.61.21.11.01.01.0
State&LocalGovernment282.3283.1283.8284.3284.8285.3285.2285.2285.1285.1285.0284.9284.7
PctChgYearAgo1.71.81.91.20.90.80.50.30.1-0.1-0.1-0.1-0.1
Other Economic Indicators
Population(Ths)6514.86513.86512.76510.36505.46500.86497.26494.16492.76492.46492.06491.66492.1
PctChgYearAgo1.40.90.50.1-0.1-0.2-0.2-0.2-0.2-0.1-0.10.00.0
LaborForce(Ths)3341.53357.53358.03356.33362.63367.93369.83372.43374.63376.83378.83380.63382.5
PctChgYearAgo1.11.41.21.40.60.30.40.50.40.30.30.20.2
UnemploymentRate(%)3.13.23.43.63.73.83.93.94.04.04.04.04.0
TotalHousingStarts15561.516972.218151.718265.519374.620094.020987.321291.221508.021671.721737.722008.722379.1 Single-Family4873.15391.45862.36216.46489.46738.66911.37035.57105.07123.77112.47092.77057.0
Multifamily10688.411580.812289.412049.112885.213355.414076.014255.714403.014548.014625.414916.015322.2
PROFILES
The Miami-Miami Beach-Kendall MSA is located in the southeastern section of the state of Florida. Miami-Dade is estimated to be the most populous county in Florida and the seventh-most populous county in the United States.
QUICK FACTS
• Metro population estimate of 2,688,237 as of 2023 (ACS 5-Year Estimate) (U.S. Census Bureau).
• Maimi Dade County population estimate of 2,688,237 as of 2023 (ACS 5-Year Estimate).
• Civilian labor force of 1,382,619 in December 2024 (FRED, U.S. Bureau of Labor Statistics).
• A n unemployment rate of 2.5% as of December 2024, not seasonally adjusted. This amounts to 34,659 unemployed people (FRED, U.S. Bureau of Labor Statistics).
OUTLOOK SUMMARIES
The Miami-Dade—Kendall area is expected to show below-average levels of growth in the economic indicators. The area has a Gross Metro Product of $206,049.10 million, the 3rd highest of all the MSAs studied. Personal income is expected to grow an average of 4.9 percent annually. This will lead to an average real per capita income level of $58,000. Average annual wage growth will be 4.1 percent (5th lowest), and the average annual wage level is expected to be $90,400 (2nd highest). Miami-Dade County is the only MSA expected decline in population with an average -0.2 percent population contraction each year.
Employment is expected to grow at an average rate of 0.6 percent (5th lowest), while unemployment is expected to be 3.4 percent (lowest in the state).
Miami Dade’s fastest growing sectors are expected to be the Other Services sector and Construction and Mining sector, which will both experience 1.7 percent average annual growth. The Manufacturing and Professional and Business Services sectors will see the largest contractions at -1.3 and -0.8 percent respectively.
METRO NEWS SUMMARIES
Major Miami project moves forward with developer’s pledge to protect workers from heat
• The Swerdlow Group’s proposal is part of a multibillion-dollar plan to redevelop over 60 acres of public land, making it one of the largest redevelopment projects in Miami’s history, with the potential to reshape the local economy.
• The project includes the construction of more than 5,000 mixed-income housing units, the introduction of big-box retail stores, and a new Tri-Rail station, signaling significant long-term job creation and increased commercial activity.
• Community advocates requested a $1 million grant fund to prevent the displacement of local businesses, underscoring the anticipated economic disruption alongside opportunities from incoming national retailers like Home Depot.
Source: WLRN Public Media, March 11, 2025
Miami Beach’s Spring Break Rules Leave Businesses Feeling the
• Business owners like David Wallack of Mango’s Tropical Cafe report that March profits historically covered multiple months of mortgage payments, highlighting the significant economic blow caused by the city’s spring break restrictions.
• The crackdown includes economically significant measures such as a $100 flat fee for parking and a $532 nonresident towing rate, which may deter tourism-related spending and negatively impact local business traffic during the peak spring break weeks.
• Despite complaints, hotel occupancy in 2024 increased compared to 2023, and according to the Miami Beach Police Department, businesses “did a little better” economically, suggesting mixed but possibly improving business outcomes under the new regulations.
Source: Miami New Times, March 15, 2025
Balfour Beatty mobilizes to begin construction on Grand Hyatt Miami Beach in the US
• Balfour Beatty is leading the nearly $385 million construction of the 996,130-squarefoot, 17-story Grand Hyatt Miami Beach, which will anchor the Miami Beach Convention Center District and significantly boost the local hospitality economy.
• The project will feature 800 guestrooms, substantial convention and meeting space, and ground-floor retail, positioning the hotel as a major driver of tourism, business travel, and retail foot traffic.
• The development is expected to create employment for over 500 workers at peak construction and is scheduled for completion in late 2027, contributing to sustained economic activity and job growth in South Florida’s construction and service sectors.
Source: Balfour Beatty, April 29, 2025
New ‘bulldozing’ bill threatens South Beach’s Art Deco soul, city leaders say
• The expanded Live Local Act continues to incentivize developers by easing zoning restrictions for projects that include at least 40% workforce and affordable housing units, potentially accelerating high-density residential development across Miami Beach.
• D ue to the preemption of local zoning laws, new developments could legally rise to the height of nearby buildings within a onemile radius, which in some areas allows for structures up to 50 stories tall, raising concerns about large-scale gentrification and the erosion of the city’s low-rise character.
• The Senate version of the bill only protects buildings individually listed on the National Register of Historic Places, potentially leaving hundreds of smaller Art Deco and Miami Modern apartment buildings, many occupied by long-time residents, vulnerable to demolition and redevelopment.
Source: WLRN Public Media, April 29, 2025
Miami Beach plans to lure Israeli and Jewishowned firms
• In a unanimous vote, Miami Beach commissioners directed the Economic Development Department to launch an initiative specifically targeting the attraction of Israeli and Jewish-owned companies, marking a strategic step toward international business expansion.
• With recent growth in private equity, hedge funds, and tech firms, the city aims to strengthen its business base by attracting Israeli companies known for innovation in technology, health, and sustainability, sectors that represent high-value, scalable economic contributions
• Following Israeli Tech Week and reports from the United States Israel Business Alliance citing Florida as a rising hub for Israelifounded firms, Miami Beach is leveraging this momentum to position itself as a premier U.S. destination for international tech expansion and investment.
Source: Miami Today, May 14, 2025
Florida Bill Threatens $3.8B Statewide Tourism Industry
• In 2023 and 2024, Miami-Dade County collected $61 million through the Tourist Development Tax (TDT), which helped generate $3.8 billion statewide—highlighting the significant fiscal impact the proposed legislation could jeopardize.
• M iami’s tourism economy generated over $2 billion in state tax revenue in 2024 alone and supports more than 200,000 jobs across sectors like hospitality, transportation, and the arts, demonstrating the direct economic dependence on sustained tourism funding.
• The tourism sector’s contributions translate to an average tax saving of $2,200 per household in Florida, underscoring the broader financial benefits to residents that could be lost if the TDT is repealed.
Source: Miami New Times, May 28, 2025
Long Term Outlook for Miami-Miami Beach-Kendall, FL (Division of Miami-Fort Lauderdale MSA)
June 2025 Forecast
Personal Income (Billions $)
202020212022202320242025202620272028
TotalPersonalIncome152.0173.7188.4202.0214.9225.7237.1249.5260.8
PctChgYearAgo1.614.38.57.26.45.05.05.24.5
WagesandSalaries74.685.796.5103.2110.2115.3121.0126.6131.9 NonwageIncome77.387.991.998.8104.7110.5116.1122.9128.9
RealPersonalIncome(12$)132.6145.0145.1149.9155.5158.3162.0167.3171.9
PctChgYearAgo-0.49.40.13.33.71.82.43.32.7
PerCapitaIncome(Ths)56.564.969.272.675.678.883.288.092.3
RealPerCapitaIncome(12$)49.354.253.353.954.755.256.959.060.8
AverageAnnualWage(Ths)65.372.176.478.882.284.688.392.496.3 PctChgYearAgo7.210.46.03.04.32.94.44.74.2
Establishment Employment (Place of Work, Thousands, SA)
TotalEmployment1136.91181.11255.71302.91334.21356.31364.41362.61362.4
PctChgYearAgo-6.93.96.33.82.41.70.6-0.10.0 Manufacturing40.440.843.445.947.347.346.445.644.9
PctChgYearAgo-4.71.16.35.73.30.0-2.0-1.8-1.3 Nonmanufacturing1096.51140.21212.31257.01286.91308.91318.01317.11317.4
PctChgYearAgo-7.04.06.33.72.41.70.7-0.10.0 Construction&Mining53.452.554.257.259.862.863.763.663.7
PctChgYearAgo-1.6-1.73.45.54.55.11.4-0.20.3 Trade,Trans,&Utilities287.8295.8311.3320.5327.3335.1337.9340.1337.3
PctChgYearAgo-6.22.85.23.02.12.40.80.7-0.8 WholesaleTrade70.773.676.679.581.983.684.986.086.1 RetailTrade132.5136.6142.3145.7146.5149.1149.0149.7147.2 Trans,Wrhsng,&Util84.785.692.395.398.9102.3104.0104.4104.0 Information19.020.623.923.823.022.923.422.922.4
PctChgYearAgo-7.58.216.1-0.6-3.2-0.42.1-2.0-2.0 FinancialActivities80.885.190.294.096.496.897.196.495.2 PctChgYearAgo-1.45.36.04.22.50.40.4-0.7-1.3 Prof&BusinessServices175.0185.6205.3210.0212.4213.9209.4203.7206.0 PctChgYearAgo-3.96.110.62.31.20.7-2.1-2.71.1 Educ&HealthServices186.7193.5204.0215.0221.7228.1233.0234.7236.4 PctChgYearAgo-2.83.75.45.43.12.92.20.70.7 Leisure&Hospitality106.3122.6138.4147.5153.6154.7157.6159.0158.7 PctChgYearAgo-27.115.312.96.54.10.71.90.9-0.2 OtherServices45.846.647.448.249.850.351.052.053.3
PctChgYearAgo-9.51.81.71.83.21.11.31.92.5 FederalGovernment21.521.321.221.522.321.921.421.521.7
PctChgYearAgo4.6-0.9-0.11.03.9-1.7-2.60.80.6 State&LocalGovernment120.2116.6116.4119.5120.7122.4123.6123.2122.7
PctChgYearAgo-3.0-3.0-0.22.71.01.41.0-0.3-0.4
Other Economic Indicators
Population(Ths)2688.02677.52722.52783.02843.82866.42849.62835.52825.2
PctChgYearAgo-0.4-0.41.72.22.20.8-0.6-0.5-0.4 LaborForce(Ths)1273.71323.31378.01418.41445.81456.81460.81460.81459.8 PercentChange,YearAgo-7.63.94.12.91.90.80.30.0-0.1
UnemploymentRate(%)8.15.52.71.92.42.83.43.73.8
TotalHousingStarts8848.710186.210667.410538.97846.310027.09836.79473.49904.6 Single-Family2058.82435.12420.91481.11933.81831.92122.02162.12083.2 Multifamily6789.97751.18246.49057.85912.48195.17714.77311.37821.4
Short Term Outlook for Miami-Miami Beach-Kendall, FL (Division of Miami-Fort Lauderdale MSA)
June 2025 Forecast
Personal Income (Billions $)
2025:12025:22025:32025:42026:12026:22026:32026:42027:12027:22027:32027:42028:1
TotalPersonalIncome222.1225.0226.8229.1232.5235.5238.4242.0245.3248.0250.9253.7256.6
PctChgYearAgo2.32.11.61.11.22.32.73.33.43.33.43.02.8
PerCapitaIncome(Ths)77.478.479.280.181.482.683.785.186.487.488.589.690.7
RealPerCapitaIncome(12$)55.155.055.255.556.156.657.157.758.358.859.359.760.2
AverageAnnualWage(Ths)83.684.284.885.886.987.888.789.790.891.993.094.095.0
PctChgYearAgo2.23.33.03.23.94.34.64.64.64.84.94.74.5
Establishment Employment (Place of Work, Thousands, SA)
TotalEmployment1351.21355.01358.61360.21363.01365.11365.01364.51363.81363.11362.31361.41361.1
PctChgYearAgo1.81.81.71.20.90.70.50.30.1-0.1-0.2-0.2-0.2
Manufacturing47.847.647.146.946.546.646.446.145.945.745.445.345.2
PctChgYearAgo2.10.6-1.0-1.6-2.8-2.0-1.4-1.8-1.4-2.1-2.1-1.7-1.4
Nonmanufacturing1303.41307.51311.61313.31316.61318.51318.61318.41317.91317.41316.91316.11315.9
PctChgYearAgo1.81.91.81.31.00.80.50.40.1-0.1-0.1-0.2-0.2
Construction&Mining62.562.663.063.363.663.863.863.763.663.563.563.563.5 PctChgYearAgo6.75.84.03.91.81.91.20.50.0-0.3-0.4-0.2-0.2 Trade,Trans,&Utilities333.8334.9335.6335.9336.4337.5338.5339.2340.2340.5340.3339.5337.8
PctChgYearAgo2.62.82.71.40.80.80.91.01.10.90.50.1-0.7 WholesaleTrade83.383.583.883.984.484.785.185.485.986.186.186.086.2 RetailTrade148.8149.4149.3148.9148.6149.0149.3149.3149.6149.8149.9149.3147.4 Trans,Wrhsng,&Util101.7102.0102.5103.0103.4103.8104.1104.5104.6104.6104.3104.1104.3 Information22.922.923.022.923.323.523.423.323.223.022.822.522.5
PctChgYearAgo-2.1-0.6-0.11.11.82.72.01.7-0.3-1.9-2.8-3.2-3.1 FinancialActivities97.096.796.696.897.297.297.296.996.896.696.395.996.0
PctChgYearAgo1.10.60.00.10.20.60.60.1-0.4-0.7-0.8-1.0-0.9 Prof&BusinessServices213.0214.5215.1212.9211.9210.2208.5206.8204.7203.9203.1203.2204.6
PctChgYearAgo0.71.11.00.1-0.5-2.0-3.1-2.9-3.4-3.0-2.6-1.8-0.1
Educ&HealthServices225.4227.2229.1230.7232.1233.1233.3233.7234.3234.6234.9234.9236.1
PctChgYearAgo2.43.03.12.93.02.61.81.31.00.70.70.50.8
Leisure&Hospitality154.4154.2154.3155.9156.6157.3157.9158.5158.6158.6159.1159.6158.0
PctChgYearAgo1.00.20.71.01.42.02.31.71.30.80.80.7-0.4 OtherServices50.350.250.450.650.851.051.051.351.651.952.152.452.9
PctChgYearAgo1.00.90.81.91.01.61.41.41.61.82.12.22.6 FederalGovernment22.422.321.921.121.321.321.421.421.521.521.521.621.6
PctChgYearAgo1.90.2-2.8-5.9-5.3-4.3-2.11.41.00.70.70.70.6
State&LocalGovernment121.7122.1122.7123.0123.5123.7123.6123.5123.4123.3123.2123.0122.9
PctChgYearAgo0.81.22.21.51.41.30.80.4-0.1-0.3-0.3-0.4-0.4
Other Economic Indicators
Population(Ths)2871.02868.22865.12861.32856.42851.62847.12843.22839.72836.92834.12831.32828.6
PctChgYearAgo1.71.00.50.0-0.5-0.6-0.6-0.6-0.6-0.5-0.5-0.4-0.4
LaborForce(Ths)1453.91458.41458.21456.71459.21461.51461.21461.21461.11460.91460.71460.41460.1
PctChgYearAgo0.80.80.70.80.40.20.20.30.10.00.0-0.1-0.1
UnemploymentRate(%)2.52.72.93.13.23.33.43.53.63.73.73.83.8
TotalHousingStarts9724.010218.710356.59808.99933.19834.09885.99693.89541.69449.49399.19503.69656.8
Single-Family1638.11789.11912.01988.42051.52112.32150.32173.92181.22173.42156.72137.02111.7
Multifamily8085.88429.78444.57820.57881.67721.77735.77519.97360.57276.07242.47366.67545.1
PROFILES
The Naples–Immokalee–Marco Island MSA is comprised of Collier County only. Located on the southwest coast of Florida, it is notable for numerous recreation and leisure activities, and is a popular retirement destination. This region is sometimes referred to as the “Crown Jewel of Southwest Florida.”
QUICK FACTS
• Metro population estimate of 404,310 as of 2023 (ACS 5-Year Estimate) (U.S. Census Bureau).
• Collier County population estimate of 404,310 as of 2023 (ACS 5-Year Estimate).
• Civilian labor force of 192,640 in December 2024 (FRED, U.S. Bureau of Labor Statistics).
• A n unemployment rate of 2.9% as of December 2024, not seasonally adjusted. This amounts to 5,561 unemployed people (FRED, U.S. Bureau of Labor Statistics).
OUTLOOK SUMMARIES
The Naples—Marco Island Metropolitan Statistical Area (MSA) is expected to show strong performance in most of the economic indicators studied in this forecast. Gross Metro Product will come in at $26,908.70 million. Personal income growth of 5.9 percent will lead to the highest per capita income level in the state at $112,500. Average annual wage growth of 3.8 percent (lowest among MSAs studied) will push the average annual wage level to $81,700. The Naples—Marco Island MSA will experience a population growth of 0.9 percent.
The Naples area will experience an employment growth rate of 1.0 percent. However, the area will have a moderate unemployment rate of 4.4 percent. The Information sector will lead Naples with the highest average annual growth rate of 4.0 percent. This is followed by the Other Services sector at 3.0 percent. The Professional and Business Services sector and Trade, Transport, and Utility sector will both grow by just 0.2.
METRO NEWS SUMMARIES
Collier to pay $3.84M to expand office space needs
• Collier County will spend $3.84 million to purchase 15 office suites near its East Naples government complex to house the Community & Human Services Division (CHS). The move will save about $108,000 annually in rental costs and provide room for future expansion, enabling the cohabilitation of human, housing, and veteran services.
• The purchase provides long-term financial and operational benefits by reducing reliance on leases, securing a stable asset, and ensuring CHS can meet employee and service needs for the next 20 years.
• Th is acquisition follows other infrastructure investments by the county, such as the Supervisor of Elections building and the new $11.7M Heritage Bay Government Services Center, designed to provide consolidated public services and function post-hurricane.
Source: Gulfshore Business, March 3, 2024
Ritz-Carlton-branded Naples condo project on track for 2026 opening
• The Ritz-Carlton Residences, Naples has reached its structural “topping off” milestone, with four of its five planned buildings now structurally complete. The project remains on track to receive a temporary certificate of occupancy in early 2026.
• L ocated on a 6-acre waterfront site, the development includes 128 luxury residences, with 75% of units already sold, totaling around $475 million in sales. Homes start at $5.2 million, and offerings include three to five-bedroom layouts aswell as penthouses.
• A menities will include a 22-slip marina, a 28,000-square-foot private club, spa, fitness center, business lounge, and park features, making the development one of the most expansive and high-end residential offerings in Naples.
Source: Gulfshore Business, April 3, 2024
FGCU study: Agriculture will continue to be a big economic driver in Southwest Florida
• A griculture contributes over $2 billion to Southwest Florida’s economy and employs about 19,000 people, but faces significant challenges including land loss to urbanization, rising labor costs, regulatory burdens, and environmental pressures. Smaller farms are at greater risk, while larger and more innovative operations may endure.
• Labor shortages and land scarcity are the top concerns, with reliance on the costly H-2A visa program growing due to lack of local labor. Other issues include climate variability, rising input cost, and unfair trade practices like foreign dumping and subsidies.
• Opportunities lie in adopting tech-driven, urban, and alternative farming methods, expanding niche and local food markets, and investing in workforce development programs. Though the footprint may shrink, experts believe agriculture will adapt and remain a critical part of the region’s economic fabric.
Source: Naples Daily News, April 3, 2025
Construction to begin on affordable housing communities in Fort Myers, East Naples
• DeAngelis Diamond and McDowell Housing Partners will begin construction this summer on two affordable housing communities, Ekos on Evans in Fort Myers, which will offer 144 units, and Ekos Creekside in East Naples, with 160 units, totaling over $75 million in construction value.
• The projects are funded through Florida Housing’s 4% Low Income Housing Tax Credit program, with additional support from Lee County’s disaster recovery funds and $3.75 million in surtax financing approved by Collier County for the Naples site.
• Community leaders view the developments as vital for meeting demand among lower- income households, especially in Collier County, where over half of working households earn $45,000 or less. Construction is expected to finish by early 2027.
Source: Gulfshore Business, April 29, 2025
Collier County’s March tourism data shows continuing softness in market
• Collier County tourism revenue slightly rebounded in March to over $7 million, though overall metrics showed softening: visitor numbers fell 3.6% year-over-year, average daily rates dropped 13.5%, and international visitation, including Canadian tourists, declined amid economic concerns.
• Officials cited the timing of Easter and broader economic uncertainty as factors, with some event planners delaying commitments. Despite that, short-term group bookings for late 2025 and destination weddings show promising growth, especially for luxury and naturefocused markets.
• L ooking ahead, Southwest Florida International Airport is reporting strong summer capacity growth, with double-digit increases in available seats and Porter Airlines expanding Toronto service, signaling potential recovery in Canadian travel to the region.
Source: Gulfshore Business, May 21, 2025
Long Term Outlook for Naples-Immokalee-Marco Island, FL
June 2025 Forecast
Personal Income (Billions $)
202020212022202320242025202620272028
TotalPersonalIncome41.546.949.854.457.961.064.668.972.9
PctChgYearAgo4.613.26.19.26.55.45.96.65.7
WagesandSalaries9.010.411.512.413.213.714.415.216.0
NonwageIncome32.536.538.342.044.747.350.253.756.9
RealPersonalIncome(12$)40.042.241.742.744.345.246.748.950.7
PctChgYearAgo5.15.5-1.02.23.82.13.24.73.9
PerCapitaIncome(Ths)109.4120.7124.0132.4139.1145.7152.7161.0168.8
RealPerCapitaIncome(12$)105.5108.5104.0103.9106.3108.0110.3114.1117.5
AverageAnnualWage(Ths)60.866.869.571.874.376.980.183.586.3
PctChgYearAgo9.29.94.03.23.53.44.24.13.4
Establishment Employment (Place of Work, Thousands, SA)
TotalEmployment147.4155.3164.5171.7177.4177.8179.3181.5184.6
PctChgYearAgo-4.75.46.04.33.30.20.81.31.7
Manufacturing4.95.15.35.65.86.16.16.06.0
PctChgYearAgo5.13.24.95.14.13.70.0-0.5-0.4
Nonmanufacturing142.4150.2159.2166.1171.6171.7173.2175.5178.6
PctChgYearAgo-5.05.46.04.33.30.10.91.31.7 Construction&Mining17.218.119.420.721.121.621.922.222.6 PctChgYearAgo-2.75.67.16.52.22.41.31.11.9 Trade,Trans,&Utilities28.329.430.932.333.233.333.233.533.4 PctChgYearAgo-3.13.85.34.52.70.3-0.51.1-0.3 WholesaleTrade4.85.05.46.16.66.86.97.07.0 RetailTrade21.421.922.623.223.423.222.923.122.9 Trans,Wrhsng,&Util2.12.52.93.03.23.43.43.43.4 Information1.21.21.31.41.51.61.71.81.8 PctChgYearAgo-11.30.73.36.411.56.65.42.41.4 FinancialActivities8.79.410.210.610.510.911.111.211.4
PctChgYearAgo-0.88.67.84.0-0.33.02.01.61.6 Prof&BusinessServices17.419.021.021.821.922.021.621.322.0
PctChgYearAgo0.39.210.53.90.70.5-2.2-1.23.5 Educ&HealthServices22.823.825.026.427.728.128.629.229.9
PctChgYearAgo-0.54.15.45.34.91.51.92.12.3
Leisure&Hospitality25.527.829.330.332.130.731.432.032.6
PctChgYearAgo-14.78.75.53.36.1-4.32.22.11.6
OtherServices7.78.08.38.69.29.49.710.010.4
PctChgYearAgo-7.63.73.93.47.11.73.43.13.9 FederalGovernment0.80.70.70.70.70.70.70.70.7
PctChgYearAgo7.0-8.70.00.00.0-1.6-2.73.02.8
State&LocalGovernment12.812.813.113.413.613.413.413.613.8
PctChgYearAgo-5.80.02.22.61.3-1.50.31.31.4
Other Economic Indicators
Population(Ths)378.8388.9401.5410.7416.5418.9423.2428.3431.7
PctChgYearAgo1.82.73.32.31.40.61.01.20.8
LaborForce(Ths)163.6167.8174.9181.3186.0189.8191.9194.1196.3
PercentChange,YearAgo-1.72.64.23.72.62.01.11.21.1
UnemploymentRate(%)7.74.03.13.03.44.04.54.54.4
TotalHousingStarts4181.15933.44781.53965.43341.74531.15415.05507.55596.1
Single-Family3136.74245.63511.23017.12522.02898.13389.63441.43381.1
Multifamily1044.31687.71270.3948.3819.71633.02025.42066.02215.0
Short Term Outlook for Naples-Immokalee-Marco Island, FL
June 2025 Forecast
Personal Income (Billions $)
2025:12025:22025:32025:42026:12026:22026:32026:42027:12027:22027:32027:42028:1
TotalPersonalIncome60.160.861.361.963.064.265.266.167.468.569.570.471.4
PctChgYearAgo5.45.45.35.44.95.56.46.87.06.66.56.45.9
WagesandSalaries13.513.713.814.014.214.314.514.714.915.115.315.515.7
NonwageIncome46.647.247.548.048.949.950.751.452.553.454.254.955.7
RealPersonalIncome(12$)45.245.145.245.445.946.547.047.448.148.649.249.650.0
PctChgYearAgo3.02.11.71.71.43.14.04.44.84.64.64.64.1
PerCapitaIncome(Ths)143.6145.3146.3147.6149.7152.0153.8155.5158.0160.0162.1163.8165.9
RealPerCapitaIncome(12$)108.1107.7107.9108.1109.0110.1110.8111.4112.7113.6114.6115.3116.3
AverageAnnualWage(Ths)76.176.577.077.978.979.780.581.482.383.183.884.585.3
PctChgYearAgo2.93.73.53.73.74.14.54.54.34.34.23.83.6
Establishment Employment (Place of Work, Thousands, SA)
TotalEmployment176.7177.9178.1178.4178.7178.9179.5180.0180.5181.1181.9182.6183.1
PctChgYearAgo0.0-0.1-0.31.21.10.60.80.91.01.21.41.51.4
Manufacturing6.16.16.16.16.06.16.16.16.06.06.06.06.0
PctChgYearAgo5.24.42.92.6-0.30.00.2-0.10.2-0.7-0.8-0.6-0.4
Nonmanufacturing170.6171.8172.0172.4172.6172.9173.4173.9174.5175.1175.9176.6177.1
PctChgYearAgo-0.2-0.2-0.41.21.20.60.80.91.11.31.41.51.5
Construction&Mining21.421.621.721.821.921.922.022.022.122.122.222.322.4
PctChgYearAgo1.92.11.93.62.21.21.20.80.90.91.01.31.4
Trade,Trans,&Utilities33.333.533.333.233.033.133.233.333.433.533.633.633.3
PctChgYearAgo0.91.2-0.4-0.4-0.8-1.2-0.30.41.11.31.20.8-0.2 WholesaleTrade6.86.86.86.86.86.86.96.97.07.07.07.07.0
RetailTrade23.223.323.223.022.922.923.023.023.123.123.223.122.9 Trans,Wrhsng,&Util3.33.33.43.43.43.43.43.43.43.43.43.43.4 Information1.61.61.61.61.71.71.71.71.81.81.81.81.8 PctChgYearAgo11.94.15.25.63.95.85.96.04.33.11.70.70.5 FinancialActivities10.710.910.910.911.011.111.111.111.211.211.311.311.4
PctChgYearAgo2.63.21.94.42.81.81.81.61.51.61.71.61.9 Prof&BusinessServices21.922.122.222.021.821.621.521.421.221.221.321.421.7
PctChgYearAgo0.10.80.30.9-0.3-2.2-3.3-2.9-2.7-1.5-0.80.22.1
Educ&HealthServices27.928.028.128.328.428.528.728.829.029.129.329.429.7
PctChgYearAgo1.81.31.01.81.81.81.92.02.22.22.22.02.3
Leisure&Hospitality30.530.730.731.031.231.331.531.631.831.932.132.432.2
PctChgYearAgo-6.0-5.9-4.4-0.52.21.92.62.01.82.02.12.41.5
OtherServices9.29.49.49.59.69.79.79.89.910.010.010.110.3
PctChgYearAgo1.90.61.13.44.33.43.02.72.72.93.33.64.0
FederalGovernment0.70.70.70.70.70.70.70.70.70.70.70.70.7
PctChgYearAgo0.60.4-2.2-5.2-5.6-5.0-2.22.22.73.03.13.02.9
State&LocalGovernment13.413.413.413.313.413.413.413.513.513.513.613.613.7
PctChgYearAgo-1.8-1.9-2.50.1-0.20.00.40.91.01.21.41.41.4
Other Economic Indicators
Population(Ths)418.2418.7419.0419.7421.0422.4424.0425.5426.8427.9428.7429.6430.4
PctChgYearAgo0.90.60.40.40.70.91.21.41.41.31.11.00.8
LaborForce(Ths)188.2190.0190.3190.6191.1191.6192.1192.7193.3193.8194.4194.9195.4
PctChgYearAgo1.32.01.83.11.60.80.91.11.11.21.21.11.1
UnemploymentRate(%)3.83.94.14.34.44.44.54.54.54.64.54.54.5
TotalHousingStarts3851.74411.14880.34981.05226.35396.75597.25440.05531.35507.95489.35501.55529.5 Single-Family2568.52826.43040.63156.83255.23377.23447.13479.03476.83445.83426.23417.13396.2
Multifamily1283.21584.71839.71824.31971.12019.42150.01961.02054.42062.12063.22084.42133.3
PROFILES
The North Port-Sarasota-Bradenton MSA is located in Sarasota County in the southwest segment of the state. North Port encompasses fourteen miles of highway I-75 within its boundaries and it has two international airports within 45 minutes.
QUICK FACTS
• Metro population estimate of 910,108 as of 2023 (ACS 5-Year Estimate) (U.S. Census Bureau).
• Sarasota County population estimate of 469,013 as of 2023 (ACS 5-Year Estimate).
• Manatee County population estimate of 441,095 as of 2023 (ACS 5-Year Estimate).
• Civilian labor force of 394,100 in December 2024 (FRED, U.S. Bureau of Labor Statistics).
• A n unemployment rate of 3.2% as of December 2024, not seasonally adjusted. This amounts to 12,793 unemployed people (FRED, U.S. Bureau of Labor Statistics).
OUTLOOK SUMMARIES
The North Port Metropolitan Statistical Area (MSA) is expected to show average levels of growth in the economic indicators. The Gross Metro Product of the MSA will have an average level of $49,575.00 million. Personal income is expected to grow an average of 5.6 percent annually. The area will see an average real per capita income level of $63,300. Average annual wage growth will be 4.1 percent, while the average real annual wage level is expected to be $75,200. North Port is expected to average a population growth of 1.1 percent each year. Employment is expected to grow at an average rate of 0.9 percent each year, while unemployment is expected to be at 4.3 percent, which is slightly higher than the state’s average rate.
North Port’s fastest growing sector is expected to be the Education and Health Services sector, which will experience a 2.5 percent average annual growth, followed by the Other Services sector, which will grow at an average of 1.7 percent. It will see the
Information sector and the Manufacturing sector both contract by -1.1 percent.
METRO NEWS SUMMARIES
New Benderson Business Park projected to bring 1,500 jobs to North Port
• Benderson Development has invested $60 million into the North Port Business Park, expected to create 1,500 new jobs, including 500 positions in already-leased space, supporting the city’s transition from a commuter suburb to a self-sustaining economic hub.
• The six-building campus will offer 678,000 square feet of Class A Dock High industrial space with modern infrastructure (e.g., 30foot ceilings, ESFR sprinklers), attracting national firms like Lansing Building Products and Wharton-Smith to establish operations in North Port.
• North Port experiences an estimated $700 million annually in retail leakage due to 90% of residents commuting outside the city for work and services, signaling major untapped potential for retail, entertainment, and hospitality developers to meet growing local demand.
Source: Herald-Tribune, March 3, 2025
Norh port breaks ground on new Utilities building
• The new North Port Utilities administration building and field office is scheduled for completion by fall 2026, consolidating dispersed staff into one facility to improve operational efficiency and service delivery citywide.
• The project replaces the former Price Boulevard facility, which was damaged in September 2022 by Hurricane Ian, reflecting the city’s investment in resilient infrastructure to support long-term economic stability.
• Strategically located between the Willow Creek and the upcoming Waters at North Port developments, the new facility will support growing utility demands tied to ongoing residential and commercial expansion in the region.
Source: North Port Florida, March 4, 2025
Two Sarasota apartment projects clear preliminary hurdle
• The Temple Beth redevelopment and Ringling Boulevard mixed-use projects would add a combined 310 multifamily units to Sarasota, including 15 designated attainable housing units, supporting housing supply and affordability in high-demand areas.
• The Ringling Boulevard project includes 3,100 square feet for a Tony Harper’s Pizza & Clam Shack, its first location outside New York, and 800 square feet of retail space, promoting local dining and job creation along a key downtown corridor.
• The proposed SRQ Hotel 3 will add 60 rooms to Sarasota-Bradenton International Airport’s lodging options, completing a triad of airport hotels and enhancing capacity to support tourism, business travel, and airport-area development.
Source: Your Observer, April 18, 2025
City hosts construction kickoff for Price widening
• North Port has launched its largest infrastructure project to date, the 2.8-mile widening of Price Boulevard, designed to boost traffic capacity, emergency access, and future development opportunities along a key eastwest corridor.
• The project, awarded in March 2025 and scheduled to begin major construction by May 19, 2025, is expected to reach substantial completion by late 2027, providing a longterm economic catalyst for residential and commercial growth.
• Made possible by a 2022 voter-approved referendum, the initiative reflects strong community backing for infrastructure spending to support population growth, enhance safety, and improve overall mobility, critical for attracting new business and development.
Source: North Port Florida, April 25, 2025
Zoning approval paves way for region’s first Bucee’s
• Charlotte County approved zoning changes for Benderson Development’s 653-acre project, allowing for 3,859 residential units (including 245 single-family and 3,614 multifamily), 655,000 sq. ft. of commercial space, 50,000 sq. ft. of office use, and 350 hotel rooms, positioning the site as a major economic driver in Southwest Florida.
• The development will include Southwest Florida’s first Buc-ee’s, with 80–120 fueling pumps, replacing 20 multifamily units per pump in the traffic equivalency matrix, showcasing a unique planning strategy to manage commercial traffic while anchoring the commercial zone, West Village.
• To offset ecological impact, Benderson committed $3 million toward scrub jay habitat mitigation and designated 226.55 acres for preservation and recreation, balancing large- scale development with environmental stewardship near critical natural resources like the Peace River.
Source: Gulfshore Business, May 28, 2025
Long Term Outlook for North Port-Sarasota-Bradenton, FL
June 2025 Forecast
Personal Income (Billions $)
202020212022202320242025202620272028
TotalPersonalIncome53.959.762.568.272.776.180.585.790.3
PctChgYearAgo6.110.74.79.16.64.75.76.55.4
WagesandSalaries16.418.820.922.524.125.226.427.829.2
NonwageIncome37.540.941.645.848.651.054.057.961.1
RealPersonalIncome(12$)51.755.253.054.656.857.659.362.064.2
PctChgYearAgo5.36.8-4.03.13.91.53.04.53.6
PerCapitaIncome(Ths)64.168.969.774.277.780.383.988.592.4
RealPerCapitaIncome(12$)61.563.859.159.560.660.861.964.065.7
AverageAnnualWage(Ths)54.959.663.665.368.270.473.676.879.9
PctChgYearAgo7.58.66.72.64.43.44.44.44.0
Establishment Employment (Place of Work, Thousands, SA)
TotalEmployment297.5313.0327.4342.5351.7355.4357.5360.4363.9
PctChgYearAgo-4.15.24.64.62.71.00.60.81.0 Manufacturing16.417.818.518.718.518.518.418.218.0
PctChgYearAgo-4.28.73.81.0-0.8-0.2-0.7-1.1-0.7
Nonmanufacturing281.1295.2308.9323.8333.2336.9339.2342.3345.9
PctChgYearAgo-4.15.04.64.82.91.10.70.91.1 Construction&Mining26.527.428.931.432.232.933.333.433.7 PctChgYearAgo0.23.55.58.62.52.31.20.30.8 Trade,Trans,&Utilities58.061.463.766.168.168.768.969.969.7 PctChgYearAgo-3.35.83.83.83.10.90.21.4-0.3 WholesaleTrade8.49.210.110.510.710.811.011.211.2 RetailTrade42.844.445.747.749.149.549.349.949.4 Trans,Wrhsng,&Util6.87.77.87.98.38.48.68.89.0 Information3.33.44.04.44.74.64.74.64.5 PctChgYearAgo-5.14.116.011.56.2-1.82.0-2.3-2.2 FinancialActivities15.616.717.918.518.919.419.419.419.2 PctChgYearAgo1.66.67.33.42.22.40.3-0.3-0.7 Prof&BusinessServices41.345.446.848.249.349.948.747.949.0
PctChgYearAgo-3.710.13.02.92.51.2-2.4-1.72.2 Educ&HealthServices54.956.058.061.264.566.467.969.471.1 PctChgYearAgo-1.82.03.75.45.42.92.32.32.4 Leisure&Hospitality39.142.946.949.349.047.748.549.349.6 PctChgYearAgo-15.29.69.45.1-0.6-2.71.81.60.6 OtherServices14.014.414.715.616.216.516.616.917.3
PctChgYearAgo-4.72.72.16.14.21.60.52.02.6 FederalGovernment2.12.02.02.12.22.12.12.12.1
PctChgYearAgo4.5-4.31.23.73.4-1.8-3.60.60.5 State&LocalGovernment26.325.726.027.127.928.629.029.329.7
PctChgYearAgo-0.5-2.41.04.23.22.31.51.21.1
Other Economic Indicators
Population(Ths)841.6866.3897.0918.8936.4947.8958.3968.3977.5
PctChgYearAgo2.12.93.52.41.91.21.11.00.9
LaborForce(Ths)349.9361.4374.4391.6399.1408.9411.8415.4419.0
PercentChange,YearAgo-1.63.33.64.61.92.50.70.90.8
UnemploymentRate(%)7.34.03.03.13.64.14.54.54.2 TotalHousingStarts10114.813944.514689.314509.114685.112245.410373.19757.39697.1
Single-Family8073.911574.110870.010514.110828.09458.78174.57582.07324.0
Multifamily2040.82370.43819.43995.03857.12786.72198.62175.32373.2
Short Term Outlook for North Port-Sarasota-Bradenton, FL
June 2025 Forecast
Personal Income (Billions $)
2025:12025:22025:32025:42026:12026:22026:32026:42027:12027:22027:32027:42028:1
TotalPersonalIncome75.076.076.477.278.579.981.182.383.985.286.487.588.6
PctChgYearAgo4.54.94.74.74.75.26.16.76.86.66.56.25.7
WagesandSalaries24.725.125.325.625.926.326.626.927.327.628.028.328.7
NonwageIncome50.350.951.151.652.653.654.555.456.657.558.459.160.0
RealPersonalIncome(12$)57.657.557.557.858.359.159.660.261.161.762.462.963.4
PctChgYearAgo2.21.51.11.11.32.73.74.34.74.54.64.43.8
PerCapitaIncome(Ths)79.480.380.581.182.383.584.585.586.988.089.190.091.0
RealPerCapitaIncome(12$)61.160.860.660.761.161.762.162.663.363.864.364.765.1
AverageAnnualWage(Ths)69.570.170.771.572.473.274.074.875.676.477.278.078.8
PctChgYearAgo2.63.83.43.64.14.44.74.64.44.44.44.44.3
Establishment Employment (Place of Work, Thousands, SA)
TotalEmployment353.6355.7356.1356.2356.5357.1357.9358.6359.3360.0360.8361.5362.1
PctChgYearAgo1.20.90.91.20.80.40.50.70.80.80.80.80.8
Manufacturing18.518.518.518.518.318.418.418.318.218.218.118.118.1
PctChgYearAgo-1.2-0.50.40.5-1.0-0.6-0.4-0.9-0.6-1.4-1.4-1.0-0.7 Nonmanufacturing335.1337.2337.6337.7338.2338.7339.5340.3341.1341.8342.7343.4344.0
PctChgYearAgo1.31.00.91.20.90.40.60.80.90.90.90.90.9
Construction&Mining32.632.933.133.233.333.333.433.433.433.433.433.533.5 PctChgYearAgo1.92.12.03.22.11.40.80.50.40.30.20.30.4 Trade,Trans,&Utilities68.668.968.868.668.668.769.069.369.669.870.070.069.5 PctChgYearAgo1.41.20.90.0-0.1-0.30.41.01.61.71.41.0-0.2 WholesaleTrade10.810.810.910.810.910.911.011.011.111.211.211.211.2 RetailTrade49.549.749.549.349.149.249.449.549.749.850.049.949.3 Trans,Wrhsng,&Util8.38.38.48.58.58.68.78.78.88.88.98.99.0 Information4.64.64.64.64.74.74.74.74.74.64.64.54.5 PctChgYearAgo-3.9-2.9-0.30.01.82.62.01.5-0.6-2.2-3.1-3.5-3.3 FinancialActivities19.319.419.419.419.419.419.419.419.419.419.319.319.3 PctChgYearAgo2.21.82.03.60.80.10.2-0.1-0.2-0.1-0.3-0.5-0.4 Prof&BusinessServices49.950.250.249.549.248.848.648.348.047.947.848.048.4
PctChgYearAgo3.01.50.7-0.4-1.3-2.8-3.1-2.4-2.5-1.9-1.5-0.71.0 Educ&HealthServices65.766.366.667.067.467.768.168.568.969.369.669.970.6
PctChgYearAgo3.22.92.72.92.62.22.22.22.32.32.32.12.4
Leisure&Hospitality47.547.647.648.048.248.448.648.949.049.249.449.749.3
PctChgYearAgo-4.2-3.7-2.7-0.21.51.62.11.91.71.61.61.50.4
OtherServices16.516.516.516.516.516.616.616.716.816.917.017.117.2
PctChgYearAgo1.71.21.81.50.40.30.40.81.41.92.22.32.7
FederalGovernment2.22.22.12.12.12.12.12.12.12.12.12.12.1
PctChgYearAgo2.8-0.6-3.6-5.7-5.7-5.6-3.30.60.60.60.60.60.5
State&LocalGovernment28.328.628.728.828.828.929.029.129.229.329.429.529.5
PctChgYearAgo2.52.52.02.31.91.31.31.31.21.21.21.11.1
Other Economic Indicators
Population(Ths)943.6946.3949.2952.0954.3956.8959.7962.7965.0967.3969.4971.6973.8
PctChgYearAgo1.41.21.11.11.11.11.11.11.11.11.00.90.9
LaborForce(Ths)406.4409.7409.8409.7410.6411.3412.2413.2414.1415.0415.9416.8417.6
PctChgYearAgo2.22.52.42.71.00.40.60.80.90.90.90.90.9
UnemploymentRate(%)3.94.04.14.34.44.54.54.54.54.54.44.44.3
TotalHousingStarts12991.012608.112087.411295.110827.310450.610211.810002.79864.19771.79704.39689.09674.8 Single-Family9907.39660.89348.68918.28543.48268.58030.37855.77719.57608.47527.17472.77397.7
Multifamily3083.72947.32738.82377.02284.02182.12181.42146.92144.62163.32177.22216.32277.1
PROFILES
Comprised of Marion County only, the Ocala MSA is located northwest of the Orlando area and is in the center of the state. The second largest national forest in Florida, the Ocala National Forest, and Silver Springs are two main outdoor attractions in the area.
QUICK FACTS
• Metro population estimate of 409,959 as of 2023 (ACS 5-Year Estimate) (U.S. Census Bureau).
• Marion County population estimate of 409,959 as of 2023 (ACS 5-Year Estimate).
• Civilian labor force of 150,624 in December 2024 (FRED, U.S. Bureau of Labor Statistics).
• A n unemployment rate of 3.8% as of December 2024, not seasonally adjusted. This amounts to 5,707 unemployed people (FRED, U.S. Bureau of Labor Statistics).
OUTLOOK SUMMARIES
The Ocala Metropolitan Statistical Area (MSA) is expected to show strong levels of growth in its economic indicators. Ocala’s Gross Metro Product is $14,026.93 million. Personal income is expected to grow by 6.8 percent, the highest rate in the state, and Ocala will have a per capita income level of $42,000 (2nd lowest). The average annual wage growth of 4.7 percent (once again the highest in the state) will lead to an average annual wage of $63,900 (3rd lowest). Population growth will average 2.0 percent each year, the fastest out of any of the MSAs studied. Employment is expected to grow faster than any other MSA studied at a rate of 1.6 percent annually. The unemployment rate is estimated to average 5.0 percent.
The Other Services sector will lead Ocala at an average annual growth rate of 4.2 percent. This is followed by the Financial sector which will expand
at a rate of 3.9 percent. The Manufacturing sector is expected to see a contraction of -1.1 and the Federal sector is expected to contract by -0.6 percent.
METRO NEWS SUMMARIES
Ocala development: Major project including residential, commercial could be coming
• A 250-acre mixed-use development in southwest Ocala is moving forward, with KAS Ocala LLC planning to submit rezoning applications for residential, commercial, and hotel use—marking one of the area’s largest land activations in nearly two decades.
• The project’s proximity to I-75 and the expanding Southwest 44th Avenue bypass positions it as a potential economic growth hub, supporting future retail, hospitality, and housing demand in a fast-developing corridor.
• If approved, the development could significantly boost regional real estate values and commercial activity, signaling confidence in Ocala’s long-term growth and infrastructure- led expansion strategy.
Source: Ocala Star Banner, March 1, 2025
Florida legislature bills would likely remove FPA protections in Marion County
• Senate Bill 1118 and House Bill 1209 propose stripping local governments of zoning authority, allowing developers to bypass Marion County’s Farmland Preservation Area (FPA) protections and obtain automatic administrative approvals for qualifying developments.
• If passed, the bills could open hundreds of thousands of agricultural acres statewide to residential and commercial development, posing long-term risks to land values, rural economies, and local planning autonomy.
• Critics warn of major economic and governance implications, including unchecked density, loss of public input, and weakened local control over growth—potentially destabilizing land-use markets and infrastructure planning in rural regions.
Source: Ocala StarBanner, March 5, 2025
A Ocala leaders advocate for farm land preservation amid rapid development
• Ocala leaders and conservation groups are calling for urgent land preservation efforts as rapid development continues to consume farmland across Marion County.
• With Florida losing green space daily, officials like Agriculture Commissioner Wilton Simpson are backing conservation funding to protect agricultural and water resources.
• Economic advocates stress that preserving farmland supports long-term industry stability, especially in equine, agriculture, and tourism sectors vital to Marion County’s economy.
Source: WCJB, May 20, 2025
Long Term Outlook for Ocala, FL
June 2025 Forecast
Personal Income (Billions $)
202020212022202320242025202620272028
TotalPersonalIncome15.417.217.619.120.421.723.424.926.5
PctChgYearAgo8.711.62.18.86.46.67.66.86.1
WagesandSalaries5.05.66.16.67.17.58.08.69.0
NonwageIncome10.411.611.412.513.314.215.316.417.4
RealPersonalIncome(12$)16.216.916.116.617.217.818.719.620.4
PctChgYearAgo8.34.2-4.43.23.73.34.94.84.3
PerCapitaIncome(Ths)40.844.644.146.247.348.951.654.456.9
RealPerCapitaIncome(12$)42.743.640.440.140.040.241.342.743.9
AverageAnnualWage(Ths)46.750.352.554.657.159.362.265.368.6 PctChgYearAgo7.07.84.44.04.63.84.95.15.0
Establishment Employment (Place of Work, Thousands, SA)
TotalEmployment106.8111.1116.2120.3123.1125.8128.7130.2131.1
PctChgYearAgo-1.64.14.63.62.32.22.31.20.6
Manufacturing9.59.910.39.99.59.49.49.29.1
PctChgYearAgo2.34.94.0-3.8-3.9-1.2-0.8-1.3-1.0 Nonmanufacturing97.3101.1105.8110.4113.5116.4119.4121.0121.9 PctChgYearAgo-2.04.04.64.32.92.52.61.40.8
Construction&Mining8.78.99.49.610.310.711.011.111.1 PctChgYearAgo2.23.25.52.27.33.72.60.60.7 Trade,Trans,&Utilities26.228.329.930.730.931.532.232.732.5 PctChgYearAgo0.87.85.82.50.52.12.31.5-0.6 WholesaleTrade4.14.34.54.75.05.05.25.35.2 RetailTrade16.517.719.119.819.920.320.420.620.2 Trans,Wrhsng,&Util5.66.36.36.26.06.26.66.97.1 Information0.50.50.60.80.80.70.80.80.8 PctChgYearAgo-17.10.014.327.9-1.1-4.59.52.71.0 FinancialActivities3.94.04.34.44.54.75.05.15.2 PctChgYearAgo-1.54.57.41.31.84.56.13.01.8 Prof&BusinessServices9.910.611.111.110.911.010.910.811.1 PctChgYearAgo3.77.24.6-0.1-1.10.4-0.4-0.82.7 Educ&HealthServices18.218.218.720.221.021.722.422.723.2 PctChgYearAgo-2.70.02.97.74.23.33.01.71.8 Leisure&Hospitality11.712.613.414.215.015.215.816.116.1 PctChgYearAgo-13.48.36.06.35.31.64.01.7-0.1 OtherServices3.23.33.63.84.14.34.54.74.9
PctChgYearAgo-0.22.19.07.98.03.85.53.83.6 FederalGovernment0.90.80.80.90.91.00.90.90.9
PctChgYearAgo18.4-6.82.19.25.24.2-3.0-0.9-2.5
State&LocalGovernment14.213.913.914.715.115.515.815.916.0
PctChgYearAgo-2.2-2.40.55.22.73.11.40.90.6
Other Economic Indicators
Population(Ths)378.5386.4398.9414.5430.7443.6452.5458.8465.2
PctChgYearAgo2.02.13.23.93.93.02.01.41.4
LaborForce(Ths)142.7147.0151.8156.5158.9163.4165.0166.5167.8
PercentChange,YearAgo0.23.03.33.11.62.81.00.90.8
UnemploymentRate(%)7.25.03.63.74.24.75.25.25.0
TotalHousingStarts3602.95686.26327.15190.26606.86075.14333.13917.43837.0
Single-Family3587.15455.25207.55047.56243.35805.34091.03640.73542.3
Multifamily15.8231.01119.5142.7363.6269.7242.2276.7294.7
Short Term Outlook for Ocala, FL
June 2025 Forecast
Personal Income (Billions $)
2025:12025:22025:32025:42026:12026:22026:32026:42027:12027:22027:32027:42028:1
TotalPersonalIncome21.121.521.922.322.723.223.623.924.424.825.125.525.9
PctChgYearAgo5.76.46.77.57.57.87.97.47.26.76.66.66.2
WagesandSalaries7.37.47.67.77.98.08.18.28.48.58.68.78.8
NonwageIncome13.814.114.314.614.915.215.515.716.016.316.516.817.0
RealPersonalIncome(12$)17.617.717.918.118.318.618.819.019.319.519.719.920.1
PctChgYearAgo3.43.03.03.84.05.35.45.05.14.74.74.74.4
PerCapitaIncome(Ths)48.148.749.149.850.651.352.052.653.454.154.755.356.0
RealPerCapitaIncome(12$)40.140.040.140.440.841.241.541.742.242.542.943.143.5
AverageAnnualWage(Ths)58.658.959.560.261.161.862.563.364.164.965.866.667.4
PctChgYearAgo3.23.93.94.14.34.85.15.15.05.15.25.15.2
Establishment Employment (Place of Work, Thousands, SA)
TotalEmployment124.2125.5126.3127.2127.9128.5129.1129.5129.9130.1130.4130.5130.6
PctChgYearAgo1.82.02.12.93.02.42.21.81.51.31.00.80.6
Manufacturing9.59.49.49.49.39.49.49.39.39.39.29.29.2
PctChgYearAgo-0.4-1.1-1.4-1.8-1.6-0.6-0.1-0.7-0.6-1.5-1.7-1.4-1.0
Nonmanufacturing114.7116.0116.9117.8118.6119.1119.7120.1120.6120.9121.1121.3121.4
PctChgYearAgo2.02.32.43.33.42.62.42.01.71.51.21.00.7
Construction&Mining10.610.710.810.910.911.011.011.011.111.111.111.111.1
PctChgYearAgo5.23.61.94.23.62.92.31.51.10.70.40.30.3
Trade,Trans,&Utilities30.931.531.731.932.032.232.332.532.732.732.832.732.5
PctChgYearAgo0.31.72.53.83.52.02.01.92.11.81.40.8-0.4
WholesaleTrade4.95.05.15.15.25.25.25.25.35.35.35.25.2 RetailTrade20.120.420.420.420.320.420.520.520.620.620.620.520.2 Trans,Wrhsng,&Util5.96.16.36.46.56.66.76.76.86.96.97.07.1 Information0.70.70.70.70.80.80.80.80.80.80.80.80.8
PctChgYearAgo-10.4-2.1-5.40.58.510.59.79.36.43.31.30.1-0.1 FinancialActivities4.64.64.74.84.94.95.05.05.15.15.15.15.2
PctChgYearAgo2.83.94.86.47.56.45.94.63.73.32.72.32.2
Prof&BusinessServices10.911.011.011.011.010.910.910.910.810.810.810.911.0
PctChgYearAgo1.1-0.50.10.70.9-0.4-1.1-1.0-1.5-1.0-0.70.01.6
Educ&HealthServices21.421.621.822.022.222.322.422.522.622.722.822.923.0
PctChgYearAgo2.83.03.53.74.03.32.72.21.91.81.71.51.8
Leisure&Hospitality15.115.115.215.515.715.815.916.016.116.116.116.216.0
PctChgYearAgo1.30.71.52.94.04.34.33.32.52.01.41.1-0.2
OtherServices4.24.34.34.44.54.54.64.64.74.74.74.84.8
PctChgYearAgo1.53.35.35.26.65.85.14.34.04.03.73.63.8
FederalGovernment1.01.01.00.90.90.90.90.90.90.90.90.90.9
PctChgYearAgo11.37.13.7-4.6-4.9-4.9-2.80.80.2-0.5-1.3-1.9-2.4
State&LocalGovernment15.515.515.615.615.715.715.815.815.915.915.915.916.0
PctChgYearAgo3.34.12.52.71.51.51.31.21.11.00.80.70.6
Other Economic Indicators
Population(Ths)439.5442.5445.1447.4449.7451.9453.5455.1456.5458.0459.5461.2462.8
PctChgYearAgo3.53.22.82.52.32.11.91.71.51.31.31.41.4
LaborForce(Ths)162.1163.5163.8164.1164.5164.7165.1165.5165.9166.3166.7167.0167.3
PctChgYearAgo2.82.92.62.91.50.80.80.90.90.90.90.90.9
UnemploymentRate(%)4.54.64.85.05.15.25.25.25.35.35.25.25.1
TotalHousingStarts6936.36325.45790.25248.34686.24356.44189.64100.53967.43926.43895.63880.43856.6 Single-Family6702.36038.05499.34981.74461.74150.63930.43821.13692.23649.93619.43601.53571.6
Multifamily234.0287.4290.9266.6224.5205.8259.2279.3275.2276.5276.2278.9285.0
PROFILES
The Orlando–Kissimmee–Sanford MSA is comprised of Lake, Orange, Osceola and Seminole Counties. Located in the southern center of the state, this area is home to numerous tourist attractions such as Walt Disney World, Universal Studios and Sea World. It is also home to the Orlando Magic and the Orlando City Soccer Club. Orlando hosts many conventions utilizing some of the biggest hotels in the country and America’s second largest convention center. The University of Central Florida, the nation’s second largest university, and many other places of higher education also reside in the MSA.
QUICK FACTS
• Metro population estimate of 2,817,933 as of 2023 (ACS 5-Year Estimate) (U.S. Census Bureau).
• Lake County population estimate of 424,462 as of 2023 (ACS 5-Year Estimate).
• Orange County population estimate of 1,471,416 as of 2023 (ACS 5-Year Estimate).
• Osceola County population estimate of 437,784 as of 2023 (ACS 5-Year Estimate).
• Seminole County population estimate of 484,271 as of 2023 (ACS 5-Year Estimate).
• Civilian labor force of 1,464,081 in December 2024 (FRED, U.S. Bureau of Labor Statistics).
• A n unemployment rate of 3.0% as of December 2024, not seasonally adjusted. This amounts to 44,143 unemployed people (FRED, U.S. Bureau of Labor Statistics).
OUTLOOK SUMMARIES
The Orlando—Kissimmee Metropolitan Statistical Area (MSA) is expected to show above-average growth in the economic indicators studied in this forecast. The MSA’s Gross Metro Product level will be $193,543.33 million, the 4th highest among MSAs studied. Average annual wage growth of 4.2
percent will push the average annual wage level to $77,800. The per capita income level of $49,500 will be boosted by personal income growth of 5.8 percent. Population growth will average 1.1 percent annually.
The Orlando MSA will experience the 3rd highest employment growth rate averaging 1.2 percent annually. Orlando’s unemployment rate should average 3.9 percent, the 5th lowest in the state.
The Construction and Mining sector is expected to be the fastest growing sector in the area, averaging 2.6 percent growth annually. The Other Services sector will follow at an annual growth rate of 2.2 percent. Manufacturing will contract at -0.5 percent, whereas the Professional and Business Services sector will see a -0.1 percent growth annually.
METRO NEWS SUMMARIES
Foundry Commercial plans $95M Industrial Project on Edgewood’s Western edge
• In Q3 of 2025 a $95 million, six-building commercial and industrial flex space development on 41 acres at 4881 S. Orange Blossom Trail.
• The project repurposes one of the last large vacant tracts in Edgewood, boosting the city’s commercial property share to 18% and aiming to prevent residential tax hikes
• Designed for light assembly, storage, and showroom use, the 107K–80K sq. ft. buildings will include truck courts and extensive landscape buffering to blend with the surrounding residential area.
Source: Orlando Business Journal, March 17, 2025
Florida Overhaul to Abolish the property tax?
• F lorida lawmakers are exploring a potential overhaul to eliminate property taxes, a move that could drastically impact funding for essential services like schools, police, and fire departments.
• The idea has gained political momentum but raises concerns about how to replace the billions in lost revenue without increasing other taxes.
• Gov. Ron DeSantis has called for cities and counties to report financial issues to the Florida Department of Governmental Oversight and Efficiency (DOGE) as part of the broader reform effort.
Source: Orlando SentinnelSentinel, March 7, 2025
Orlando ready for world stage with upcoming Club World Cup
• Orlando will host seven FIFA Club World Cup matches this June across two venues, positioning the city as a global sports destination and boosting its international economic visibility.
• The event is expected to stimulate local tourism and hospitality sectors, with collaboration from Visit Orlando, hotel groups, and civic leaders to maximize economic impact.
• F IFA announced a $1 million investment into Orlando’s soccer infrastructure, reinforcing long-term economic benefits through sports development and global exposure.
Source: Orlando City SC, April 11, 2025
City of Orlando considering a new citywide permit for after-midnight operators
• The City of Orlando is exploring a new Conditional Use Permit for businesses operating after midnight outside the Downtown Entertainment Area, aimed at reducing noise and disturbances near residential zones.
• Unlike downtown’s permit, the new version won’t require metal detectors or off-duty police, and would apply only to new establishments serving alcohol within 300 feet of residential properties.
• E xisting businesses are exempt unless they undergo major changes, such as shifting use or significant renovations; the proposal is still in early review stages.
Source: Bungalower, April 16, 2025
Orlando grows, public buses lag, officials call for transit-oriented developments
• Orlando’s continued population boom — nearly 76,000 new residents in a year — is outpacing public transit infrastructure, straining labor mobility and threatening long-term economic sustainability.
• Regional officials and economic leaders are advocating for transit-oriented developments (TODs) to align future housing and job growth around transit hubs, addressing affordability and workforce access in tandem.
• Without major infrastructure investment or dedicated transit funding, rising property costs, uneven access, and declining bus ridership could hinder productivity, limit labor force participation, and exacerbate regional inequality.
Source: Orlando Business Journal, May 2, 2025
Winter Garden to negotiate lease for new children’s museum on undeveloped land
• Winter Garden commissioners approved lease negotiations with nonprofit Eight Waves to develop a 52,250-square-foot children’s museum on city-owned land at 271 E. Plant St., aiming for a 2029 opening.
• The proposed three-story museum and parking garage would include interactive literacy- based exhibits and preserve a nearby historic home by relocating it to the site.
• E xpected to attract 30,000 visitors annually, the museum would be the city’s first and expand Eight Waves’ mission of supporting under-resourced children and families.
Source: Orlando Business Journal, June 27, 2025
-Kissimmee -Sanford MSA
Long Term Outlook for Orlando-Kissimmee-Sanford, FL
June 2025 Forecast
Personal Income (Billions $)
202020212022202320242025202620272028
TotalPersonalIncome128.5142.9150.9162.8173.5183.7193.9205.7217.3
PctChgYearAgo7.711.25.67.96.65.95.66.15.6
WagesandSalaries70.981.091.298.6105.8111.9118.0124.3130.8
NonwageIncome57.661.959.764.267.771.875.981.586.5
RealPersonalIncome(12$)124.8131.4129.3133.6138.8142.4146.6152.6158.4
PctChgYearAgo6.25.4-1.63.43.92.62.94.13.8
PerCapitaIncome(Ths)47.952.754.056.658.961.464.367.670.6
RealPerCapitaIncome(12$)46.548.546.346.547.147.648.650.151.5
AverageAnnualWage(Ths)58.062.564.767.170.372.876.179.582.8
PctChgYearAgo8.57.83.53.64.93.54.54.54.2
Establishment Employment (Place of Work, Thousands, SA)
TotalEmployment1218.91288.61404.31465.01499.31532.61546.11557.51573.7
PctChgYearAgo-8.75.79.04.32.32.20.90.71.0 Manufacturing48.550.352.052.653.253.252.852.452.2
PctChgYearAgo-1.73.83.31.11.10.0-0.7-0.8-0.3 Nonmanufacturing1170.41238.21352.41412.51446.11479.51493.31505.11521.5
PctChgYearAgo-9.05.89.24.42.42.30.90.81.1 Construction&Mining83.183.387.490.994.399.0101.5102.7104.6
PctChgYearAgo-3.60.24.94.03.84.92.51.21.8 Trade,Trans,&Utilities235.1246.6261.5269.2272.4276.0278.7283.5283.8
PctChgYearAgo-4.54.96.03.01.21.31.01.70.1 WholesaleTrade44.746.850.352.753.353.954.555.555.7 RetailTrade140.5145.2150.2154.0155.6156.5156.8159.4158.9 Trans,Wrhsng,&Util49.954.661.062.563.565.667.468.669.2 Information24.124.926.826.927.428.229.329.129.0
PctChgYearAgo-5.83.27.90.41.73.13.8-0.6-0.4 FinancialActivities77.483.689.590.891.293.794.694.894.5 PctChgYearAgo-1.28.07.11.50.42.80.90.2-0.3 Prof&BusinessServices218.4239.2271.7284.8290.1293.4287.3282.6289.3 PctChgYearAgo-7.19.513.64.81.91.1-2.1-1.62.4 Educ&HealthServices157.4163.9173.4185.4193.0198.5202.0205.2208.6
PctChgYearAgo-1.54.15.86.94.12.81.81.61.7 Leisure&Hospitality202.5224.5266.0282.7288.3298.0306.1310.9312.6
PctChgYearAgo-26.610.918.56.32.03.42.71.60.5 OtherServices47.048.351.053.355.457.357.758.960.5
PctChgYearAgo-8.22.85.54.54.13.30.82.02.6 FederalGovernment15.215.315.816.517.016.916.617.017.3
PctChgYearAgo3.60.33.74.23.0-0.5-1.82.22.0
State&LocalGovernment110.3108.8109.2111.9116.9118.4119.5120.5121.4
PctChgYearAgo-2.4-1.40.42.54.51.30.90.80.7
Other Economic Indicators
Population(Ths)2681.22711.82794.12874.22947.32989.73014.73044.03075.7
PctChgYearAgo1.21.13.02.92.51.40.81.01.0
LaborForce(Ths)1353.41365.21455.71513.11534.51585.91607.71625.61643.0
PercentChange,YearAgo-2.50.96.63.91.43.41.41.11.1
UnemploymentRate(%)10.54.83.02.93.33.74.04.13.9
TotalHousingStarts23723.027899.625775.325249.721316.628137.228827.028115.628342.8
Single-Family15080.317069.316079.717175.615102.517687.518637.318414.417972.1
Multifamily8642.610830.49695.68074.26214.010449.810189.79701.210370.7
Short Term Outlook for Orlando-Kissimmee-Sanford, FL
June 2025 Forecast
Personal Income (Billions $)
2025:12025:22025:32025:42026:12026:22026:32026:42027:12027:22027:32027:42028:1
TotalPersonalIncome180.1182.9184.7187.0189.8192.6195.1198.1201.4204.4207.2210.0212.9
PctChgYearAgo5.26.36.05.95.45.35.66.06.16.16.26.05.7 WagesandSalaries109.7111.3112.5114.2115.9117.2118.7120.3121.8123.5125.1126.7128.2
NonwageIncome70.471.672.272.874.075.476.477.979.580.982.183.384.7
RealPersonalIncome(12$)141.9141.9142.5143.4144.6145.9147.1148.6150.3151.9153.4154.7156.1
PctChgYearAgo2.92.92.42.21.92.93.23.63.94.14.34.13.9
PerCapitaIncome(Ths)60.461.261.762.463.264.064.765.566.467.268.068.769.5
RealPerCapitaIncome(12$)47.647.547.647.848.148.548.749.149.650.050.350.651.0
AverageAnnualWage(Ths)71.772.473.073.974.975.776.477.378.279.180.080.881.7
PctChgYearAgo2.84.03.53.74.44.54.64.54.44.64.64.54.4
Establishment Employment (Place of Work, Thousands, SA)
TotalEmployment1524.81531.41535.51538.81541.61544.41547.81550.71552.81555.61559.01562.61565.0
PctChgYearAgo2.22.32.32.11.10.80.80.80.70.70.70.80.8
Manufacturing53.353.353.053.052.753.052.952.652.552.452.352.352.4
PctChgYearAgo-0.1-0.1-0.30.4-1.1-0.7-0.3-0.7-0.3-1.0-1.0-0.6-0.3
Nonmanufacturing1471.51478.01482.41485.81488.91491.41494.91498.01500.31503.21506.61510.31512.6
PctChgYearAgo2.22.42.42.21.20.90.80.80.80.80.80.80.8
Construction&Mining97.798.599.5100.3100.9101.3101.7101.9102.3102.5102.8103.2103.7 PctChgYearAgo4.85.04.75.23.32.92.21.71.41.21.11.31.4 Trade,Trans,&Utilities275.3276.1276.2276.5276.8277.9279.5280.7282.3283.3284.1284.1283.0 PctChgYearAgo1.11.51.31.50.50.71.21.52.01.91.71.20.3 WholesaleTrade53.953.853.954.054.254.454.755.055.355.555.555.555.7 RetailTrade156.6156.9156.4156.1155.9156.5157.3157.7158.6159.3160.0159.9158.3 Trans,Wrhsng,&Util64.965.465.966.466.867.167.568.068.368.568.668.769.1 Information28.028.128.428.429.029.429.529.429.429.229.028.828.9 PctChgYearAgo2.54.43.02.43.74.63.83.31.2-0.5-1.4-1.8-1.6 FinancialActivities93.493.693.894.294.694.594.794.794.894.894.894.694.9 PctChgYearAgo3.43.12.52.21.31.01.00.50.30.30.1-0.10.1 Prof&BusinessServices292.6294.4294.8291.6289.9287.8286.4284.9282.8282.4282.2283.0285.9 PctChgYearAgo1.31.41.30.4-0.9-2.2-2.9-2.3-2.5-1.9-1.5-0.71.1 Educ&HealthServices196.9198.1199.1200.0200.9201.7202.4203.1204.2205.0205.6206.1207.6
PctChgYearAgo3.53.32.42.22.01.81.61.61.71.61.61.51.7
Leisure&Hospitality295.2296.6298.0302.2303.9305.1306.8308.6309.3309.9311.4313.1310.4
PctChgYearAgo2.02.54.64.42.92.93.02.11.81.61.51.40.4 OtherServices57.257.257.357.457.557.657.758.058.458.759.159.460.0
PctChgYearAgo3.83.53.22.70.60.70.81.01.52.02.32.42.7 FederalGovernment17.217.216.916.316.516.616.616.716.816.917.017.117.2
PctChgYearAgo1.51.6-1.1-4.0-4.3-3.6-1.32.42.22.22.12.12.0
State&LocalGovernment118.1118.3118.5118.8119.1119.4119.6119.9120.1120.4120.6120.8121.0
PctChgYearAgo2.41.60.70.50.80.90.90.90.90.80.80.80.7
Other Economic Indicators
Population(Ths)2981.42986.92992.32998.33004.63011.23018.03025.23032.73040.23047.73055.43063.1 PctChgYearAgo2.01.61.20.90.80.80.90.90.91.01.01.01.0
LaborForce(Ths)1573.11585.11590.41595.01600.81605.61609.91614.51619.01623.41627.81632.11636.4
PctChgYearAgo2.93.43.63.61.81.31.21.21.11.11.11.11.1
UnemploymentRate(%)3.53.63.73.94.04.04.14.14.14.14.14.14.0
TotalHousingStarts26664.928150.629069.728663.628925.928869.128904.828608.328335.228116.227964.228046.728122.9 Single-Family16611.417491.718189.518457.218565.518677.518669.718636.518561.218451.218355.218289.918129.5
Multifamily10053.510658.910880.210206.510360.410191.610235.19971.89774.09664.99609.09756.89993.3
PROFILES
The Palm Bay–Melbourne–Titusville MSA is comprised of Brevard County only. Typically known as “Florida’s Space Coast”, this area is home to the Kennedy Space Center. Located in the central part of Florida’s east coast, the region is home to Cape Canaveral Air Force Base, Patrick Air Force Base, and government contractors such as Harris Corporation. Like much of Florida, this area is growing fast; Port Canaveral is now a leading cruise ship port.
QUICK FACTS
• Metro population estimate of 643,979 as of 2023 (ACS 5-Year Estimate) (U.S. Census Bureau).
• Brevard County population estimate of 643,979 as of 2023 (5-Year Estimate) (U.S. Census Bureau).
• Civilian labor force of 301,837 in December 2024 (FRED, U.S. Bureau of Labor Statistics).
• A n unemployment rate of 3.2% as of December 2024, not seasonally adjusted. This amounts to 9,530 unemployed people (FRED, U.S. Bureau of Labor Statistics).
OUTLOOK SUMMARIES
The Palm Bay—Melbourne—Titusville Metropolitan Statistical Area (MSA) will show moderate growth in the studied economic indicators when compared to other MSAs. The MSA will have a Gross Metro Product of $35,979.78 million. Personal income growth will average 5.8 percent, leading to a per capita income level of $53,000. Annual wage growth will average 4.3 percent (5th highest), leading to an average annual wage of $80,200. Population growth will have an average annual rate of 0.7 percent.
Palm Bay will experience employment growth that will average 0.9 percent. Palm Bay’s unemployment rate will hover around 4.3 percent.
The Other Services sector will lead the way in Palm Bay with an average annual growth rate of 3.1 percent. The Financial sector will follow with a
growth rate of 2.7 percent. The Federal along with the Manufacturing sectors will contract by -0.9 percent and -1.2 percent respectively.
METRO NEWS SUMMARIES
Brevard County development valued at $1B poised for launch at I-95 interchange
• The Emerald Lakes development, which is valued at over $1 billion in Palm Bay, is a 1,600-acre real estate project under Zons Development, who partnered with Blake Investment Partners to get the project underway.
• According to Paul Paluzzi, a managing partner at Zons Development, “Considering where we’re at, it’s like a giant launch pad that’s taken 12 years to get to the point of where it’s at now, and it’s turnkey – we’re ready to launch.”
• They are now deciding the types of properties they will build on the site, be it retail, entertainment, corporate headquarters, or multifamily housing. 2.8-million square feet of non-residential development has already been completed with work on utilities starting in April.
Source: Orlando Business Journal, March 18, 2025
Economic Development Commission of Florida’s Space Coast Connecting Industrial and Academic Communities
• The Economic Development Commission (EDC) of Florida’s Space Coast has a goal of supporting innovation and entrepreneurship. During the first quarter of this year, they were involved in opportunities for academic connectivity between Florida Universities and Space Park Leicester.
• The University of Leicester in the UK is known for itsndustry collaborations and partnerships. This type of trans-Atlantic partnership for the Space Coast plays a vital role in collaborative research initiatives.
• At a recent meeting they addressed the collaborative initiatives between the US and UK and how the Space Park model can be used and replicated. They also discussed the space economy for both civil and defense uses along with their expectations for growing strategic partnerships.
Source: Space Coast Daily, April 15, 2025
Space Coast Economic Development Commission Impact Report Highlights Value of Future Bowen Aquarium to Brevard Economy
• The Brevard Zoo, operated by the Economic Development Commission (EDC) of Florida’s Space Coast, may have a future addition in the form of the Bowen Aquarium and Conservation Center.
• The EDC performed an analysis which highlights the synergistic relationship between economic development and tourism, both of which are core elements of Florida’s Space Coast. They found that this project will have an annual economic impact of over $128 million in local sales.
• The project will generate over $43 million in local labor income and support over 1,000 jobs. The site will be located on a 14-acre site in Port Canaveral and the Bowen Aquarium will showcase the Indian River Lagoon.
Source: Space Coast Daily, April 18, 2025
New NASA Budget Proposal Will Hit The Space Coast Hard
• NASA is experiencing a 24.3% reduction in funding, going from $24.8 billion to $18.8 billion. This budget cut threatens programs and jobs at places like Florida’s Kennedy Space Center.
• One program on the chopping block is NASA’s Space Launch System (SLS) and the Orion crew capsule after Artemis III in 2027. The Artemis initiative’s goal is to return humans to the moon, and the SLS plays a key role in this.
• O verruns and delays are cited as reasons for the budget cut as the SLS has cost $23 billion since 2010 and about $4 billion per launch. Replacing this will be commercial launch services if they can be ready in two years. In 2023, NASA activities in Florida supported 35,000 jobs and these cuts may drastically lower the $8.2 billion in economic impact.
Source: Talk of Titusville, May 3, 2025
Brevard County axes economic fund, raising fears for space industry future
• Brevard County commissioners voted to end the North Brevard Economic Development zone to reallocate money to the county’s general fund. The zone had previously existed for over a decade with the purpose of encouraging economic development in northern Brevard County communities.
• Th is move may negatively impact Space Florida as talks of relocating NASA headquarters to Florida are now in question as the Mayor of Titusville claimed the zone was one of a few tools that would fund the state to attract space companies. As such, the City of Titusville is scrambling to make up for these lost funds.
• Critics of the zone claimed that the funding wasn’t going primarily towards the space industry. There is now a concern that private space companies may look to other states as Florida incentives vanish. The loss of the development has an estimated cost of $50 million for Titusville.
Source: Fox 35 Orlando, May 27, 2025
Long Term Outlook for Palm Bay-Melbourne-Titusville, FL
June 2025 Forecast
Personal Income (Billions $)
202020212022202320242025202620272028
TotalPersonalIncome31.234.335.738.741.043.546.048.651.3
PctChgYearAgo7.710.04.08.65.86.05.95.75.4
WagesandSalaries13.614.916.317.718.819.921.022.023.1
NonwageIncome17.619.419.421.122.223.625.026.628.2
RealPersonalIncome(12$)30.831.830.931.932.933.834.936.237.5
PctChgYearAgo6.43.4-2.93.23.12.73.23.73.6
PerCapitaIncome(Ths)51.155.456.359.862.265.468.972.375.6
RealPerCapitaIncome(12$)50.551.448.749.249.950.852.253.855.3
AverageAnnualWage(Ths)58.861.965.568.772.174.978.482.085.4
PctChgYearAgo6.85.25.84.95.03.94.74.54.2
Establishment Employment (Place of Work, Thousands, SA)
TotalEmployment228.3238.2245.8254.3257.8262.6264.6265.3267.2
PctChgYearAgo-2.34.33.23.51.41.90.70.30.7 Manufacturing28.629.831.634.135.435.935.134.333.7
PctChgYearAgo4.73.96.18.03.81.4-2.1-2.3-1.7 Nonmanufacturing199.7208.4214.2220.1222.4226.8229.4230.9233.4
PctChgYearAgo-3.34.42.82.81.02.01.20.71.1 Construction&Mining16.317.617.718.517.517.217.517.517.6 PctChgYearAgo5.48.60.44.5-5.2-1.81.60.10.4 Trade,Trans,&Utilities37.239.040.040.040.441.541.842.442.3 PctChgYearAgo-2.64.82.50.01.02.80.91.3-0.2 WholesaleTrade5.25.55.75.55.45.55.86.06.2 RetailTrade27.628.428.828.929.330.129.930.229.9 Trans,Wrhsng,&Util4.45.25.55.65.75.86.16.26.3 Information2.42.42.93.23.23.23.33.23.2 PctChgYearAgo-14.53.218.510.4-0.90.43.5-2.0-1.2 FinancialActivities8.78.58.38.88.99.19.59.79.9 PctChgYearAgo0.5-1.5-3.06.40.92.33.92.42.0 Prof&BusinessServices36.938.640.240.540.641.140.239.640.7 PctChgYearAgo4.84.63.90.80.41.0-2.0-1.52.6 Educ&HealthServices35.336.237.339.140.442.343.343.744.2 PctChgYearAgo-7.52.72.94.73.54.52.41.01.1 Leisure&Hospitality24.427.028.729.930.330.931.832.332.5 PctChgYearAgo-14.610.56.34.31.32.02.81.60.6 OtherServices10.310.711.111.411.511.912.312.613.0
PctChgYearAgo-5.54.03.43.20.72.93.72.63.2 FederalGovernment6.76.86.76.87.17.06.86.86.8
PctChgYearAgo4.61.1-1.01.53.6-0.3-3.2-0.10.0
State&LocalGovernment21.521.321.321.922.422.622.923.023.2
PctChgYearAgo-2.5-0.6-0.12.82.20.91.10.70.8
Other Economic Indicators
Population(Ths)609.9619.5634.0648.1659.2664.7668.0672.3677.8
PctChgYearAgo1.31.62.32.21.70.80.50.60.8
LaborForce(Ths)280.7288.4293.8303.3305.4312.6315.0317.4319.7
PercentChange,YearAgo-0.12.71.93.20.72.40.80.80.7
UnemploymentRate(%)7.04.23.03.13.54.04.44.54.2
TotalHousingStarts4614.15400.25280.45917.74773.64604.74754.04918.94917.1
Single-Family3214.14294.84244.14969.73920.83836.43771.13693.83591.2
Multifamily1400.01105.41036.3948.0852.8768.3982.91225.01325.9
Short Term Outlook for Palm Bay-Melbourne-Titusville, FL
June 2025 Forecast
Personal Income (Billions $)
2025:12025:22025:32025:42026:12026:22026:32026:42027:12027:22027:32027:42028:1
TotalPersonalIncome42.643.343.744.345.045.846.446.947.748.349.049.650.3
PctChgYearAgo5.46.36.36.05.65.86.16.05.95.65.65.65.5
WagesandSalaries19.519.820.020.320.620.821.121.321.621.922.122.422.6
NonwageIncome23.123.523.724.024.424.925.325.626.126.526.827.227.6
RealPersonalIncome(12$)33.733.633.834.034.434.835.135.335.736.036.336.637.0
PctChgYearAgo3.02.92.72.32.13.33.73.73.83.53.73.83.6
PerCapitaIncome(Ths)64.365.165.766.567.568.569.470.171.171.972.873.574.4
RealPerCapitaIncome(12$)50.850.650.851.151.552.152.552.753.253.654.054.354.7
AverageAnnualWage(Ths)74.074.575.276.177.178.078.879.880.781.682.583.384.2
PctChgYearAgo3.44.24.04.14.24.74.94.94.64.64.64.34.3
Establishment Employment (Place of Work, Thousands, SA)
TotalEmployment260.6262.8263.4263.8264.2264.6264.7264.7264.8265.1265.4265.8266.1
PctChgYearAgo1.52.12.11.91.40.70.50.30.20.20.30.40.5 Manufacturing36.136.135.735.635.335.335.134.834.634.434.234.134.0
PctChgYearAgo2.92.20.6-0.1-2.3-2.0-1.7-2.3-1.9-2.6-2.5-2.1-1.8
Nonmanufacturing224.4226.7227.7228.2228.9229.3229.6229.9230.2230.7231.2231.7232.1
PctChgYearAgo1.22.12.32.22.01.10.90.70.60.60.70.80.8
Construction&Mining17.017.217.317.417.517.517.517.517.517.517.517.517.5
PctChgYearAgo-7.3-2.2-0.53.52.81.91.10.40.30.1-0.10.00.1 Trade,Trans,&Utilities41.041.641.741.641.641.841.942.042.242.442.542.542.2
PctChgYearAgo2.43.32.82.61.70.30.60.91.41.51.41.10.0 WholesaleTrade5.45.55.65.75.75.85.95.96.06.06.16.16.1 RetailTrade29.930.330.230.029.929.930.030.030.130.230.230.229.8 Trans,Wrhsng,&Util5.75.85.96.06.06.16.16.16.26.26.26.26.3 Information3.23.13.23.23.33.33.33.33.33.23.23.23.2
PctChgYearAgo1.8-1.3-0.51.53.45.13.52.2-0.5-2.0-2.6-2.8-2.4 FinancialActivities9.09.19.19.29.49.49.59.69.69.79.79.89.9
PctChgYearAgo-0.32.62.64.54.63.63.93.52.72.62.32.12.4 Prof&BusinessServices41.041.241.240.840.640.340.139.939.639.639.639.840.2
PctChgYearAgo1.71.41.1-0.1-0.9-2.2-2.7-2.2-2.4-1.8-1.3-0.41.4
Educ&HealthServices41.542.142.542.943.143.343.443.443.643.743.843.844.1
PctChgYearAgo3.95.55.13.63.82.72.01.31.11.01.00.91.1
Leisure&Hospitality30.730.830.931.331.631.731.932.132.132.232.432.532.3
PctChgYearAgo1.80.72.62.93.03.03.12.31.81.61.61.50.4
OtherServices11.611.811.912.112.212.312.312.412.512.612.712.812.9
PctChgYearAgo0.42.33.55.75.24.03.12.42.22.42.72.93.3
FederalGovernment7.17.27.16.86.86.86.86.86.86.86.86.86.8
PctChgYearAgo1.92.3-1.1-4.2-4.4-5.1-3.30.2-0.1-0.2-0.2-0.10.0
State&LocalGovernment22.422.622.722.722.822.922.922.922.923.023.023.123.1
PctChgYearAgo0.80.61.41.01.61.20.90.80.70.60.70.70.8
Other Economic Indicators
Population(Ths)663.2664.5665.4665.9666.9667.7668.3669.3670.5671.6672.8674.2675.6
PctChgYearAgo1.20.90.70.60.60.50.40.50.50.60.70.70.8
LaborForce(Ths)310.6312.8313.4313.8314.3314.6315.2315.9316.5317.1317.7318.3318.8
PctChgYearAgo2.12.62.52.31.20.60.60.70.70.80.80.80.7
UnemploymentRate(%)3.94.04.14.34.44.44.54.54.54.54.54.44.3
TotalHousingStarts4347.54521.24783.34766.84720.04723.24779.04793.94954.14924.04898.94898.64897.9 Single-Family3660.53817.63940.93926.53882.73777.73730.13694.13746.33703.53672.53653.13621.3
Multifamily687.0703.5842.4840.3837.4945.51049.01099.71207.91220.51226.31245.51276.6
PROFILES
The Panama City MSA, known for its beaches and recreational fishing vessels, is located in the Northwest portion of the state. Panama City is the largest City between Tallahassee and Pensacola. This area is the more populated of two principal cities of the Panama City-Lynn Haven MSA and it is the county seat of Bay County.
QUICK FACTS
• Metro population estimate of 216,371 as of 2023 (ACS 5-Year Estimate) (U.S. Census Bureau).
• Bay County population estimate of 216,371 as of 2023 (ACS 5-Year Estimate).
• Civilian labor force of 93,169 in December 2024 (FRED, U.S. Bureau of Labor Statistics).
• A n unemployment rate of 3.0% as of December 2024, not seasonally adjusted. This amounts to 2,834 unemployed people (FRED, U.S. Bureau of Labor Statistics).
OUTLOOK SUMMARIES
The Panama City Metropolitan Statistical Area (MSA) will show average levels of growth in the studied economic indicators when compared to other MSAs. The MSA will have a Gross Metro Product of $11,684.60 million. Personal income growth will average 6.1 percent (3rd highest), leading to a per capita income level of $46,900 (5th lowest). Average annual wage growth will average 4.2 percent, leading to an average annual wage of $66,100 (5th lowest). Population growth will average 1.9 percent annually (2nd highest).
Employment growth will be at an average rate of 1.4 percent (2nd highest). Additionally, Panama City’s unemployment rate will hover around 4.3 percent, which is slightly below average in the state.
The Other Services sector will lead the way in Panama City with an average annual growth rate of
3.5 percent. The Information sector will follow with a growth rate of 3.1 percent. The Manufacturing sector will contract by -1.0 percent and the Federal sector will grow by just 0.1 percent.
METRO NEWS SUMMARIES
Florida State University announces plan to build ‘FSU Health’ hospital in Panama City Beach
• F lorida State University is moving forward with plans to build a $414 million acute care hospital in Panama City Beach under the FSU Health name. Backed by bond financing approved by both the FSU Board of Trustees and the Florida Board of Governors, the project aims to expand health care access in Bay and Walton counties.
• In partnership with Tallahassee Memorial HealthCare, the facility will offer up to 180 beds in its first phase, offering services such as emergency medicine, general surgery, diagnostic imaging, and specialized care in cardiac, orthopedic, and neurological fields.
• Beyond patient care, the hospital will function as a teaching and research hub through an Academic Clinical Collaboration Agreement, supporting FSU’s graduate medical education programs and helping to train the next generation of health care professionals. Construction is expected to begin soon, with the hospital projected to open in 2028.
Source: Florida State University News, March 26, 2024
‘First step’: Panama City Beach accepts $5 million HUD grant for water redundancy project
• Panama City Beach accepted a $5 million federal grant from the U.S. Department of Housing and Urban Development to help fund a $9.7 million transmission line along Philip Griffitts Sr. Parkway, marking the first phase of a broader water redundancy project to strengthen the city’s infrastructure.
• The transmission line will improve the city’s ability to transport water across its service area, increasing system flexibility during emergencies and supporting future growth. Future phases will extend this system east toward Chip Seal Parkway.
• The full project also includes new pumping stations, system expansions, and technology upgrades, such as a new West End Water Supply Station, expanded storage at the McElvey facility, and additional radar equipment to detect underground issues, all designed to improve water reliability and system resilience.
Source: Panama City News Herald, April 19, 2024
Naval Support Activity Panama City acquires neighboring Barefoot Palms development
• Naval Support Activity Panama City has acquired the 8.4-acre Barefoot Palms site at no cost, after more than two decades of interest in the property. The land will serve as an Antiterrorism/Force Protection buffer for the base, enhancing the security of sensitive mission operations.
• The property was formerly part of a golf driving range, later sold to a developer who foreclosed after partially building eight townhomes. Bay County managed the site under a state lease and worked with the Navy to finalize the longanticipated transfer.
• The land transfer marks a major milestone in long-term defense planning, giving the Navy greater control over its surrounding environment. Officials say the property provides strategic flexibility for future development while eliminating security vulnerabilities tied to private ownership nearby.
Source: Panama News Herald, May 11, 2025
‘Proud of the product’: Panama City Beach Skate Park opens at Frank Brown Park
• Panama City Beach celebrated the grand opening of its new $1.4 million skate park near Frank Brown Park on May 8, offering about 10,000 square feet of beginner- and intermediate-level features for skaters, scooters, bikers, and rollerbladers.
• Built by New Line Skateparks in just 18 weeks, the project finished ahead of schedule and is designed to accommodate continuous flow for multiple users, opening just in time for the summer season.
• The new park complements a more advanced skate park at Publix Sports Park, providing more skating options in PCB and drawing praise from city officials for its accessibility and design.
Source: Panama News Herald, May 12, 2025
Long Term Outlook for Panama City, FL June 2025 Forecast
202020212022202320242025202620272028
Personal Income (Billions $)
TotalPersonalIncome9.610.710.911.712.513.314.115.015.8
PctChgYearAgo7.811.41.97.56.86.36.56.35.1
WagesandSalaries4.24.75.05.35.76.06.46.77.0
NonwageIncome5.46.05.96.46.87.37.88.38.7
RealPersonalIncome(12$)9.710.19.69.910.310.611.011.511.9
PctChgYearAgo6.64.6-5.23.14.13.03.84.43.2
PerCapitaIncome(Ths)47.852.051.353.355.056.759.161.964.5
RealPerCapitaIncome(12$)48.349.445.345.245.445.446.147.448.5
AverageAnnualWage(Ths)50.553.755.657.359.961.864.467.570.7
PctChgYearAgo5.56.33.63.04.63.14.24.84.7
Establishment Employment (Place of Work, Thousands, SA)
TotalEmployment80.283.886.689.591.593.495.596.596.4
PctChgYearAgo-3.34.43.43.32.32.12.31.00.0
Manufacturing3.23.23.33.53.63.63.63.53.5
PctChgYearAgo-0.61.33.13.83.50.6-1.3-1.7-1.4
Nonmanufacturing77.080.583.386.087.989.891.993.093.0
PctChgYearAgo-3.44.53.43.32.22.12.41.10.0
Construction&Mining7.07.07.47.67.98.28.48.38.3
PctChgYearAgo0.70.05.43.53.53.42.5-0.3-0.9 Trade,Trans,&Utilities16.116.717.317.518.018.218.619.018.8
PctChgYearAgo-0.34.13.41.02.81.32.31.8-0.9 WholesaleTrade2.32.42.52.72.82.93.03.13.1 RetailTrade12.012.412.912.913.213.313.513.713.4 Trans,Wrhsng,&Util1.81.91.91.91.92.02.12.22.2 Information0.60.60.70.80.80.80.90.90.9
PctChgYearAgo-15.3-2.62.716.74.72.09.21.5-0.3 FinancialActivities4.65.25.45.35.25.45.65.75.6 PctChgYearAgo5.012.23.4-1.5-1.22.93.51.4-0.1 Prof&BusinessServices10.310.410.811.811.611.411.511.511.8
PctChgYearAgo-10.80.43.79.4-1.5-1.90.80.03.0 Educ&HealthServices10.010.510.811.011.411.812.212.412.5
PctChgYearAgo0.55.32.42.33.92.93.71.90.8
Leisure&Hospitality12.213.514.114.514.815.315.916.216.1
PctChgYearAgo-8.410.94.82.91.53.94.01.6-0.8 OtherServices2.22.22.32.32.52.72.82.82.9
PctChgYearAgo-4.82.21.91.58.85.33.62.92.1 FederalGovernment3.93.94.04.24.44.54.44.44.4
PctChgYearAgo4.21.52.03.65.42.2-2.50.9-0.1
State&LocalGovernment10.110.410.611.011.311.611.811.811.7
PctChgYearAgo-4.92.82.04.12.52.61.30.3-0.7
Other Economic Indicators
Population(Ths)200.5205.2212.0219.1227.1234.0239.2242.8244.7
PctChgYearAgo-0.82.43.33.33.73.02.21.50.8
LaborForce(Ths)91.895.397.4100.2101.9104.6105.6106.5107.5
PercentChange,YearAgo-1.93.82.22.91.62.70.90.90.9
UnemploymentRate(%)6.34.02.93.03.43.94.34.54.3
TotalHousingStarts1760.72950.62237.72397.22484.52400.82227.92082.52059.5
Single-Family1348.91568.42128.11985.32102.61729.31463.11311.41219.5
Multifamily411.91382.2109.6411.9381.9671.5764.8771.1840.1
Short Term Outlook for Panama City, FL
June 2025 Forecast
Personal Income (Billions $)
2025:12025:22025:32025:42026:12026:22026:32026:42027:12027:22027:32027:42028:1
TotalPersonalIncome13.013.213.413.513.814.014.314.514.714.915.115.315.5
PctChgYearAgo6.26.46.46.26.16.36.76.76.66.46.36.15.4
WagesandSalaries5.85.96.06.16.26.36.46.56.66.76.86.96.9
NonwageIncome7.27.37.47.47.67.77.98.08.18.28.48.58.6
RealPersonalIncome(12$)10.610.610.610.710.811.011.111.211.311.411.611.711.7
PctChgYearAgo3.83.02.82.52.63.84.34.44.44.34.44.33.5
PerCapitaIncome(Ths)56.156.656.957.458.158.859.460.060.861.562.362.963.5
RealPerCapitaIncome(12$)45.645.345.345.445.745.946.246.446.947.247.647.948.0
AverageAnnualWage(Ths)61.361.561.962.563.464.064.765.466.267.068.068.869.6
PctChgYearAgo3.03.33.03.03.34.14.64.74.54.75.05.15.1
Establishment Employment (Place of Work, Thousands, SA)
TotalEmployment92.193.193.894.494.995.395.796.196.396.596.596.596.3 PctChgYearAgo1.41.82.42.83.02.32.01.81.51.30.90.40.0
Manufacturing3.63.63.63.63.63.63.63.53.53.53.53.53.5
PctChgYearAgo2.71.6-0.1-1.7-1.7-1.4-0.9-1.4-1.2-1.9-2.1-1.7-1.4
Nonmanufacturing88.589.590.290.891.391.792.192.592.893.093.093.092.8
PctChgYearAgo1.31.82.53.03.22.42.11.91.61.51.00.50.0
Construction&Mining8.08.18.28.38.38.38.48.48.48.38.38.38.3
PctChgYearAgo1.73.23.35.44.52.91.70.80.30.0-0.6-1.0-1.1 Trade,Trans,&Utilities17.918.218.318.418.418.518.718.818.919.019.018.918.8
PctChgYearAgo0.30.61.13.13.22.12.02.02.42.31.70.9-0.6 WholesaleTrade2.82.92.92.93.03.03.03.03.13.13.13.13.1 RetailTrade13.113.313.413.413.413.513.613.613.713.713.713.613.5 Trans,Wrhsng,&Util2.02.02.02.12.12.12.12.12.22.22.22.22.2 Information0.80.80.80.80.90.90.90.90.90.90.90.90.9 PctChgYearAgo4.1-1.72.33.49.110.49.28.24.82.20.2-1.2-1.3 FinancialActivities5.35.45.45.55.55.65.65.65.75.75.75.75.7
PctChgYearAgo0.72.84.43.84.93.63.12.41.91.81.30.60.4 Prof&BusinessServices11.211.411.511.511.511.511.511.511.411.511.511.511.7
PctChgYearAgo-3.9-2.3-1.0-0.42.40.9-0.10.1-0.5-0.10.00.42.0 Educ&HealthServices11.511.711.812.012.112.212.212.312.412.412.412.412.5
PctChgYearAgo1.82.93.33.44.84.03.22.72.42.21.81.21.0 Leisure&Hospitality15.115.215.315.615.815.916.016.116.216.216.216.216.0
PctChgYearAgo2.83.64.74.74.04.24.23.42.72.01.30.5-0.9
OtherServices2.62.72.72.72.72.72.82.82.82.82.82.92.9
PctChgYearAgo8.73.93.85.15.03.73.22.72.93.33.02.52.4
FederalGovernment4.54.64.54.34.44.44.44.44.44.44.44.44.4
PctChgYearAgo5.15.02.1-3.4-4.0-4.5-2.61.01.11.20.80.50.1
State&LocalGovernment11.511.611.611.711.711.811.811.811.811.811.811.811.7
PctChgYearAgo2.51.62.93.41.71.31.20.90.70.50.1-0.2-0.6
Other Economic Indicators
Population(Ths)231.7233.3234.7236.1237.5238.7239.8240.8241.7242.5243.2243.7244.1
PctChgYearAgo3.43.12.92.72.52.32.22.01.81.61.41.21.0
LaborForce(Ths)103.9104.7104.9105.0105.2105.4105.7105.9106.2106.4106.7106.9107.1
PctChgYearAgo2.62.72.82.81.30.70.70.80.91.01.00.90.9
UnemploymentRate(%)3.63.83.94.14.24.34.44.44.44.54.54.54.4
TotalHousingStarts2313.52431.22460.72397.92365.22240.02149.32157.12120.62097.12068.82043.72042.1
Single-Family1832.71739.31708.41636.91547.01471.01442.11392.21360.41327.71299.21258.41237.9
Multifamily480.8692.0752.3760.9818.2769.0707.2764.9760.1769.4769.6785.3804.2
PROFILES
The Pensacola–Ferry Pass–Brent MSA is comprised of Escambia County and Santa Rosa County. Located in the northwest corner of Florida bordering Alabama, the region is home to the Pensacola Naval Air Station, Blue Angels, and the National Museum of Naval Aviation. This area has been referred to as the “Cradle of Naval Aviation.”
QUICK FACTS
• Metro population estimate of 530,090 as of 2023 (ACS 5-Year Estimate) (U.S. Census Bureau).
• Escambia County population estimate of 326,928 as of 2023 (ACS 5-Year Estimate).
• Santa Rosa County population estimate of 203,162 as of 2023 (ACS 5-Year Estimate).
• Civilian labor force of 241,458 in December 2024 (FRED, U.S. Bureau of Labor Statistics).
• A n unemployment rate of 3.2% as of December 2024, not seasonally adjusted. This amounts to 7,652 unemployed people (FRED, U.S. Bureau of Labor Statistics).
OUTLOOK SUMMARIES
The Pensacola—Ferry Pass—Brent Metropolitan Statistical Area (MSA) will experience slow levels of economic growth in the studied indicators. Gross Metro Product will be $25,565.25 million. Personal income growth will be 4.9 percent, the 5th lowest rate in the state, with per capita income reaching $51,700. Average annual wage growth will be 4.0 percent (4th lowest), leading to an average annual wage of $70,500. Pensacola’s population will grow at an average annual rate of 0.6 percent.
Employment growth will average 0.5 percent, which is will rank 2nd lowest in the state. Meanwhile, Pensacola’s unemployment rate will be 4.3 percent.
The Other Services sector will be the fastest growing sector in Pensacola with a 2.0 percent average annual growth rate. The Leisure sector will grow at an annual
rate of 1.3 percent. The Information sector is expected to experience a contraction of -2.0 percent, followed by a contraction in Federal by -1.4 percent.
METRO NEWS SUMMARIES
New luxury apartments coming to downtown Pensacola at former ECUA sewer treatment plant
• Crest Residential has begun construction on The Romero, a 282-unit luxury apartment complex on 8 acres of the former ECUA sewage treatment site in downtown Pensacola, marking the first development under the West Main Master Plan.
• The site, formerly known as “Old Stinky,” was decommissioned in 2011 and remained undeveloped until the adoption of the West Main Master Plan, which was funded by Quint Studer and aimed to coordinate development across downtown parcels.
• Crest Residential purchased the land for $6.24 million in February 2025, acquiring 6 acres from The Dawson Company and 2 acres from Studer Properties. The Romero is expected to begin pre-leasing in spring 2026 and is part of a broader effort to increase housing supply in response to Pensacola’s ongoing housing crisis.
Source: Pensacola News Journal, March 4, 2025
Escambia awards nearly $3M for affordable housing projects
• The Escambia County Board of County Commissioners approved nearly $3 million in federal funding for two affordable housing projects aimed at serving low- to very lowincome residents, particularly those aged 50 to 60.
• A MR at Pensacola was awarded $2,536,987 to convert the former Henry T. McMillan school into 53 affordable housing units, with plans for 24-hour security and supportive services; future expansion may include additional housing
types. Catholic Charities received $427,778 to construct nine tiny homes at Trinity Village, a development for low- income seniors aged 55 and older.
• The funding is part of a $4.1 million allocation from the U.S. Department of Housing and Urban Development to the Escambia County HOME Consortium, which must be spent by 2030 and targets populations at risk of homelessness or housing instability.
Source: Pensacola News Journal, March 10, 2025
$236 Million, 6-Year Major Project Beginning To Totally Rebuild Entire I-10, Highway 29 Interchange
• The Florida Department of Transportation (FDOT) has launched a $236 million reconstruction project to fully rebuild the I-10 and Highway 29 interchange, with completion expected by summer 2030.
• Key changes involve removing the I-10 loop ramp to northbound Highway 29, adding extended two-lane ramps, and modifying the Highway 29 and Dairy Road intersection for improved access.
• The project includes constructing six new I-10 main lanes, building approximately a dozen new bridges, and converting or replacing several existing bridges, including those over North Palafox and CSX.
Source: NorthEscambia.com, April 1, 2025
GE Vernova’s $70 Million Expansion Strengthens Escambia County’s Role in Clean Energy
• GE Vernova has completed a $70 million expansion of its manufacturing facility in Escambia County, Florida, enhancing its role in the U.S. clean energy sector. The facility produces wind turbine components, including nacelles, which are used in renewable energy projects nationwide; approximately half of all wind turbines in the U.S. are manufactured at this site.
• The plant currently employs around 700 workers, nearly 20% of whom are military veterans, and future job growth could increase employment to over 1,000.
• The facility benefits from a strong local supply chain and supports regional logistics through its use of the Port of Pensacola. This investment aligns with federal efforts to boost domestic manufacturing and reinforces Pensacola’s strategic position in the national clean energy infrastructure.
Source: FloridaWest Economic Development Alliance, April 22, 2025
Escambia County moves forward with floodprone home buyout program to create green spaces
• Escambia County is implementing a voluntary buyout program to purchase and demolish 49 flood-prone homes damaged during Hurricane Sally in 2020, converting the properties into green spaces to mitigate future flooding.
• The program is supported by $18.5 million in federal grant funding, with over $1 million approved in the latest round to acquire four homes.
• The buyout process includes property appraisals, mortgage settlements, and a 90day demolition timeline following homeowner relocation. Once demolished, the properties will be permanently restricted from future residential development to preserve their function as floodwater management areas. County officials have not provided a definitive timeline for completing all 49 acquisitions, as each case progresses at a different pace.
Source: WEAR TV, May 1, 2025
Pensacola -Ferry Pass -Brent MSA Industry Location Quotients
Long Term Outlook for Pensacola-Ferry Pass-Brent, FL
June 2025 Forecast
Personal Income (Billions $)
202020212022202320242025202620272028
TotalPersonalIncome24.827.528.330.231.633.134.636.438.2
PctChgYearAgo8.810.63.16.54.74.64.65.35.1
WagesandSalaries10.511.412.413.113.814.415.015.716.4
NonwageIncome14.416.015.917.117.818.719.620.721.8
RealPersonalIncome(12$)25.526.425.626.226.827.127.728.629.5
PctChgYearAgo8.43.5-2.92.52.11.41.93.33.2
PerCapitaIncome(Ths)48.553.154.156.758.661.163.766.569.4
RealPerCapitaIncome(12$)49.750.948.849.249.650.150.952.253.5
AverageAnnualWage(Ths)52.856.059.361.064.066.169.071.974.8
PctChgYearAgo6.16.06.02.94.83.44.34.24.0
Establishment Employment (Place of Work, Thousands, SA)
TotalEmployment183.4188.1194.5199.7201.1203.1203.0203.9205.2
PctChgYearAgo-2.02.53.42.70.71.0-0.10.40.6 Manufacturing6.97.27.07.06.86.86.86.76.6
PctChgYearAgo-2.33.9-2.1-0.7-2.60.1-1.0-1.2-0.9 Nonmanufacturing176.5180.9187.5192.7194.2196.3196.2197.2198.6
PctChgYearAgo-2.02.53.62.80.81.10.00.50.7
Construction&Mining12.012.613.313.513.713.814.014.114.3
PctChgYearAgo-1.24.85.12.01.50.61.30.81.3 Trade,Trans,&Utilities33.534.735.536.336.436.436.236.636.5 PctChgYearAgo-0.73.62.22.30.20.0-0.51.0-0.3 WholesaleTrade5.76.06.46.66.36.46.46.46.4 RetailTrade23.524.124.224.724.824.724.524.724.5 Trans,Wrhsng,&Util4.34.74.85.15.35.35.35.55.6 Information1.71.71.81.81.81.81.81.71.6 PctChgYearAgo-5.32.07.9-0.5-2.4-0.90.6-3.8-3.9 FinancialActivities15.215.416.517.617.818.018.218.418.6 PctChgYearAgo1.91.37.46.41.50.71.21.21.1 Prof&BusinessServices24.525.526.025.524.825.124.323.924.2 PctChgYearAgo0.64.11.8-1.9-2.51.0-3.0-1.91.5 Educ&HealthServices30.330.631.533.033.534.434.634.835.2 PctChgYearAgo-1.41.03.04.71.52.60.60.71.0 Leisure&Hospitality22.824.126.126.826.827.427.928.228.2 PctChgYearAgo-11.65.98.32.8-0.12.21.81.00.2 OtherServices8.28.79.09.29.710.010.110.310.5 PctChgYearAgo1.45.93.53.05.42.61.01.82.4 FederalGovernment6.86.76.87.37.67.57.27.27.2
PctChgYearAgo2.9-1.31.56.44.8-1.0-4.5-0.10.0 State&LocalGovernment21.520.820.921.622.021.921.922.022.1
PctChgYearAgo-2.2-3.00.53.21.8-0.2-0.10.40.5
Other Economic Indicators
Population(Ths)512.1517.5524.0532.5539.2541.4542.9547.4551.5
PctChgYearAgo1.41.01.31.61.30.40.30.80.8
LaborForce(Ths)226.1229.9234.6240.0240.3245.6246.6247.6248.6
PercentChange,YearAgo-0.31.72.12.30.12.20.40.40.4
UnemploymentRate(%)6.54.33.03.13.54.14.44.44.1
TotalHousingStarts4152.93397.63574.42865.13391.23670.43188.63004.32963.9
Single-Family3866.63110.53258.62855.43316.43390.72855.12668.02605.8
Multifamily286.4287.1315.99.774.7279.7333.4336.3358.1
Short Term Outlook for Pensacola-Ferry Pass-Brent, FL
June 2025 Forecast
Personal Income (Billions $)
2025:12025:22025:32025:42026:12026:22026:32026:42027:12027:22027:32027:42028:1
TotalPersonalIncome32.633.033.233.533.934.434.835.235.736.236.637.137.6
PctChgYearAgo4.14.94.84.74.14.34.85.15.35.25.35.35.1
WagesandSalaries14.114.314.414.614.814.915.115.215.415.615.815.916.1
NonwageIncome18.418.718.818.919.219.519.820.020.320.620.921.121.4
RealPersonalIncome(12$)27.227.127.127.227.327.627.827.928.228.528.728.929.2
PctChgYearAgo1.81.51.21.00.71.92.42.83.23.13.43.53.3
PerCapitaIncome(Ths)60.260.961.361.862.663.464.164.765.566.266.967.568.3
RealPerCapitaIncome(12$)50.250.050.150.250.550.951.151.351.752.052.452.653.0
AverageAnnualWage(Ths)65.365.866.367.168.068.769.370.070.871.572.373.073.8
PctChgYearAgo2.83.63.53.74.14.34.44.34.14.24.44.34.3
Establishment Employment (Place of Work, Thousands, SA)
TotalEmployment202.4203.6203.5203.0202.9202.7203.0203.3203.5203.7204.0204.3204.5
PctChgYearAgo0.81.31.11.00.3-0.5-0.20.10.30.50.50.50.5 Manufacturing6.96.86.86.86.76.86.86.76.76.76.76.66.6
PctChgYearAgo0.10.7-0.50.1-1.6-0.9-0.6-1.0-0.7-1.5-1.5-1.2-0.9
Nonmanufacturing195.5196.8196.7196.2196.2195.9196.3196.6196.8197.1197.4197.6197.8
PctChgYearAgo0.81.31.21.00.3-0.4-0.20.20.30.60.60.60.5
Construction&Mining13.713.813.813.914.014.014.014.014.114.114.114.214.2
PctChgYearAgo1.20.6-0.31.11.81.41.30.90.80.80.70.80.9 Trade,Trans,&Utilities36.136.636.536.436.236.136.336.336.536.636.736.736.4
PctChgYearAgo-1.3-0.40.61.00.2-1.2-0.8-0.10.71.31.20.9-0.1 WholesaleTrade6.46.46.46.46.46.46.46.46.46.56.46.46.4 RetailTrade24.524.924.824.724.524.424.524.524.624.724.824.724.4 Trans,Wrhsng,&Util5.25.35.35.35.35.35.45.45.45.55.55.55.5 Information1.81.81.81.71.81.81.81.81.71.71.71.71.6
PctChgYearAgo2.0-0.2-3.3-1.9-0.21.30.70.4-1.9-3.5-4.6-5.1-5.0 FinancialActivities17.918.018.018.018.118.118.218.318.318.418.418.518.6
PctChgYearAgo0.01.00.41.31.20.91.41.31.21.31.11.11.4 Prof&BusinessServices25.125.325.224.824.624.324.324.224.023.923.823.924.0
PctChgYearAgo0.62.32.0-0.8-2.1-3.7-3.7-2.6-2.6-1.9-1.8-1.30.4 Educ&HealthServices34.134.434.534.534.634.534.634.634.834.834.934.935.1
PctChgYearAgo2.03.12.72.71.40.30.20.30.50.80.80.81.0 Leisure&Hospitality27.327.327.327.627.727.827.928.128.128.128.228.328.1
PctChgYearAgo2.31.62.12.91.81.82.11.61.21.11.00.90.0 OtherServices9.910.010.010.110.110.110.110.210.210.310.310.410.5
PctChgYearAgo1.82.62.53.51.70.80.70.81.21.82.12.12.5 FederalGovernment7.77.77.57.27.27.27.27.27.27.27.27.27.2
PctChgYearAgo2.32.0-1.6-6.4-6.4-6.5-4.2-0.5-0.30.0-0.10.00.0
State&LocalGovernment21.922.022.021.921.921.921.922.022.022.022.022.122.1
PctChgYearAgo0.0-0.10.0-0.60.0-0.3-0.20.10.30.50.50.40.5
Other Economic Indicators
Population(Ths)541.0541.4541.5541.5541.8542.4543.3544.3545.5546.7548.0549.2550.1
PctChgYearAgo0.70.50.30.10.20.20.30.50.70.80.90.90.9
LaborForce(Ths)244.3245.8246.1246.2246.4246.4246.7247.0247.3247.5247.8248.0248.2
PctChgYearAgo1.72.42.52.30.80.30.30.30.40.40.40.40.4
UnemploymentRate(%)3.94.04.24.34.44.44.54.54.54.44.44.34.2
TotalHousingStarts3790.73798.53645.83446.73368.23190.53084.93110.53036.23009.92988.62982.42969.4 Single-Family3571.33523.73337.73130.13013.02879.32765.32762.92701.42673.32653.52643.72623.7
Multifamily219.4274.8308.1316.6355.2311.2319.6347.6334.8336.7335.2338.7345.7
PROFILES
The Port St. Lucie MSA is a city on the Atlantic coast of southern Florida. Located in St. Lucie County, this municipality is the most populous in the county. Known for its Botanical Gardens and the waterways of the North Fork St. Lucie Aquatic Preserve which are home to manatees, river otters, egrets, and alligators.
QUICK FACTS
• Metro population estimate of 536,901 as of 2023 (ACS 5-Year Estimate) (U.S. Census Bureau).
• Martin County population estimate of 163,315 as of 2023 (ACS 5-Year Estimate).
• St. Lucie County population estimate of 373,586 as of 2023 (ACS 5-Year Estimate).
• Civilian labor force of 238,116 in December 2024 (FRED, U.S. Bureau of Labor Statistics).
• A n unemployment rate of 3.3% as of December 2024, not seasonally adjusted. This amounts to 7,925 unemployed people (FRED, U.S. Bureau of Labor Statistics).
OUTLOOK SUMMARIES
The Port St. Lucie Metropolitan Statistical Area (MSA) is expected to show average levels of growth in its economic indicators. Port St. Lucie’s Gross Metro Product will be $22,838.78 million. Personal income growth will be 5.5 percent, leading to a per capita income level of $61,600. Meanwhile, average annual wage growth will be 4.0 percent (3rd lowest), leading to an average annual wage of $66,800. Population growth will average 1.4 percent annually (5th highest).
Employment growth is expected to rank 4th highest in the state at an average of 1.2 percent annually. The unemployment rate is estimated to average 4.8 percent.
The Information sector will lead Port St. Lucie
at an average annual growth rate of 3.4 percent. Other Services sector will follow at 2.7 percent. The Federal sector and Professional and Business Services sector will contract by -2.6 percent and -1.2 percent respectively.
METRO NEWS SUMMARIES
Brooklyn Water Bagel Opens in Port St. Lucie with Two New Locations
• Brooklyn Water Bagel has opened two new locations in Port St. Lucie, including a corporate store and a franchise led by local TV personality Dean Tendrich, both now serving breakfast and lunch daily.
• K nown for its proprietary water filtration process that mimics New York’s baking water, the brand continues expanding its presence in Florida with consistent quality and authentic New York-style bagels.
• Tendrich’s location is the first in a 10-unit deal, signaling continued growth for the brand, which now holds more Florida locations than any other bagel chain in the state.
Source: PR Newswire, April 16, 2025
Costco gets ok for depot’s $128M 2nd phase
• Port St. Lucie approved tiered tax incentives for Costco Depot Phase 2, a $113.4 million expansion expected to create 115 full-time jobs paying 112% of the county average wage, adding over $6.4 million in annual payroll.
• D ue to rising demand, Phase 2’s 1 millionsquare-foot facility is being built alongside the 600,000-square-foot Phase 1, accelerating the development timeline and boosting regional economic impact.
• The incentive package includes 10 years of tiered ad valorem tax relief, impact fee mitigation, and fast-tracked permitting, with job creation benchmarks and refund clauses to ensure accountability.
Source Hometown News, April 22, 2025
GreenPointe Developers Opens New Market for Golf Course Living in Port St. Lucie
• Glynlea Country Club in Port St. Lucie will soon begin selling single-family homes starting in the $400,000s, offering smart home features and energy-efficient designs from builders Lennar and Perry Homes.
• The community will feature a championship golf course designed by PGA Tour Champion Jim Furyk, along with amenities like a Toptracer driving range, pickleball courts, and a pro shop.
• Future development includes a resort-style clubhouse campus with pools, a fitness center, casual dining, and access to broader recreational areas throughout the Wylder master-planned community.
Source: CBS 4 News, April 22, 2025
Port St. Lucie home to Accel and OCULUS, two exciting and innovative companies
• Accel International, a major wire and cable producer with clients like NASA and Boeing, operates a Port St. Lucie facility among its five U.S. sites. CEO Tony Oh emphasized the company’s commitment to innovation and employee homeownership.
• Oculus Surgical, with roots in Germany, is building a new 55,000-square-foot facility in Tradition. The company makes cutting-edge eye care products, including the Pentacam and WAVE overnight vision-correcting lenses.
• The St. Lucie Economic Development Commission continues its mission to grow industries like aerospace, life sciences, and advanced manufacturing through business retention and attraction efforts.
Source: HomeTown News, April 27, 2025
Long Term Outlook for Port St. Lucie, FL June 2025 Forecast
202020212022202320242025202620272028
Personal Income (Billions $)
TotalPersonalIncome30.433.535.439.241.844.146.649.251.8
PctChgYearAgo8.710.35.610.96.65.55.75.55.3
WagesandSalaries7.78.69.410.110.811.311.912.513.2
NonwageIncome22.725.026.029.131.132.834.736.738.6
RealPersonalIncome(12$)29.531.231.032.033.334.035.036.337.6
PctChgYearAgo3.06.1-0.83.33.92.23.03.63.4
PerCapitaIncome(Ths)61.766.267.572.375.077.680.784.387.9
RealPerCapitaIncome(12$)59.861.759.159.059.759.860.762.263.7
AverageAnnualWage(Ths)50.253.756.758.561.062.665.368.271.1
PctChgYearAgo6.67.15.53.14.32.74.34.54.3
Establishment Employment (Place of Work, Thousands, SA)
TotalEmployment151.5158.3165.5172.2175.7179.7181.4182.5184.1
PctChgYearAgo-2.24.44.54.12.02.30.90.60.9
Manufacturing7.47.78.18.58.78.68.68.68.6
PctChgYearAgo-1.74.35.64.12.1-0.2-0.3-0.5-0.2 Nonmanufacturing144.1150.5157.3163.7167.1171.1172.7174.0175.6
PctChgYearAgo-2.24.54.54.12.02.41.00.70.9
Construction&Mining12.312.813.614.414.915.515.815.815.9
PctChgYearAgo2.63.56.55.83.84.01.80.10.7 Trade,Trans,&Utilities31.032.734.936.137.038.538.739.038.9 PctChgYearAgo0.25.56.63.42.74.10.40.9-0.5 WholesaleTrade5.04.95.75.86.16.26.36.46.4 RetailTrade20.921.922.723.123.524.224.024.223.9 Trans,Wrhsng,&Util5.15.96.57.27.48.28.38.58.6 Information1.11.21.41.41.31.41.51.51.5
PctChgYearAgo-9.19.116.13.1-6.06.85.00.31.4 FinancialActivities6.06.16.26.66.46.46.66.76.7 PctChgYearAgo1.91.41.85.3-3.10.22.91.31.1 Prof&BusinessServices22.022.923.423.323.723.222.622.122.5
PctChgYearAgo5.84.52.0-0.51.6-1.9-2.5-2.21.8 Educ&HealthServices27.528.229.531.432.634.034.635.135.7
PctChgYearAgo-2.82.34.56.63.94.11.91.41.7 Leisure&Hospitality18.020.221.222.122.122.322.923.323.4
PctChgYearAgo-14.112.25.23.90.01.22.71.40.6 OtherServices7.17.57.98.38.58.89.09.29.5
PctChgYearAgo-6.26.05.04.93.53.12.52.23.0 FederalGovernment1.11.01.01.11.11.11.01.01.0
PctChgYearAgo4.8-7.02.57.40.7-3.0-5.9-0.8-0.8
State&LocalGovernment18.018.018.319.219.419.820.020.220.4
PctChgYearAgo-3.8-0.41.75.01.22.11.01.01.1
Other Economic Indicators
Population(Ths)492.2506.3524.6542.4557.8568.9577.6583.8589.4
PctChgYearAgo2.12.93.63.42.82.01.51.11.0
LaborForce(Ths)215.9222.6229.7237.5240.4245.7247.4249.1250.6
PercentChange,YearAgo-0.53.13.23.41.22.20.70.70.6
UnemploymentRate(%)7.54.73.33.43.84.44.95.04.8
TotalHousingStarts4961.67381.37272.96077.65510.05557.45133.04778.94725.3
Single-Family4574.86232.95100.25383.25128.14378.43855.33624.93484.4
Multifamily386.81148.42172.7694.4381.91178.91277.71154.01240.9
Short Term Outlook for Port St. Lucie, FL
June 2025 Forecast
Personal Income (Billions $)
2025:12025:22025:32025:42026:12026:22026:32026:42027:12027:22027:32027:42028:1
TotalPersonalIncome43.343.944.444.945.646.447.047.548.348.949.650.150.8
PctChgYearAgo5.25.75.65.55.35.65.95.95.85.45.45.55.3
WagesandSalaries11.111.311.411.511.711.812.012.112.312.412.612.712.9
NonwageIncome32.232.733.033.433.934.635.035.436.036.537.037.437.9
RealPersonalIncome(12$)33.933.934.034.234.635.035.235.435.836.136.536.837.1
PctChgYearAgo2.82.32.01.91.93.23.53.53.73.43.63.73.5
PerCapitaIncome(Ths)76.777.477.878.479.480.481.381.983.083.984.885.686.5
RealPerCapitaIncome(12$)60.159.759.759.860.160.660.961.161.662.062.462.763.1
AverageAnnualWage(Ths)62.162.462.763.464.364.965.666.467.167.968.669.370.0
PctChgYearAgo2.22.92.73.13.64.14.64.74.44.54.64.44.3
Establishment Employment (Place of Work, Thousands, SA)
TotalEmployment177.9179.6180.3180.9181.1181.2181.4181.6182.0182.3182.7183.1183.3
PctChgYearAgo2.42.72.11.81.80.90.60.40.50.60.70.80.7
Manufacturing8.78.78.68.68.68.68.68.68.68.68.68.68.6
PctChgYearAgo0.4-1.1-0.10.0-1.0-0.20.3-0.20.2-0.7-0.9-0.5-0.2 Nonmanufacturing169.2171.0171.7172.3172.6172.6172.8173.0173.4173.8174.2174.5174.7
PctChgYearAgo2.52.92.21.92.00.90.60.40.50.70.80.80.8 Construction&Mining15.315.515.615.715.815.815.815.815.815.815.815.815.9 PctChgYearAgo4.24.54.13.03.32.21.40.60.30.10.00.20.3 Trade,Trans,&Utilities38.138.638.738.738.638.638.738.839.039.139.139.138.8
PctChgYearAgo4.85.93.22.51.4-0.10.00.20.91.21.00.7-0.3 WholesaleTrade6.16.26.36.36.36.36.46.46.46.46.46.46.4 RetailTrade24.024.324.224.224.024.024.024.024.124.224.224.223.9 Trans,Wrhsng,&Util8.08.28.28.28.38.38.38.48.48.58.58.58.6 Information1.41.41.41.41.51.51.51.51.51.51.51.51.5 PctChgYearAgo7.812.61.85.65.26.04.63.91.50.4-0.2-0.30.1 FinancialActivities6.36.46.46.56.56.66.66.66.66.66.76.76.7
PctChgYearAgo-3.5-0.91.34.04.43.22.51.61.21.31.31.31.4 Prof&BusinessServices23.223.323.323.022.922.722.522.422.222.122.122.122.3
PctChgYearAgo0.4-1.8-3.1-2.9-1.1-2.6-3.2-2.9-3.2-2.4-2.0-1.00.7 Educ&HealthServices33.533.934.134.434.534.634.734.734.935.135.235.335.5
PctChgYearAgo3.94.54.33.83.01.91.51.11.31.41.51.51.7 Leisure&Hospitality22.122.222.422.722.822.923.023.123.123.223.323.423.2
PctChgYearAgo0.00.21.92.83.13.02.71.91.41.41.51.50.4
OtherServices8.68.88.88.99.09.09.09.19.19.29.29.39.4
PctChgYearAgo3.33.32.23.54.02.42.01.51.62.12.42.73.1 FederalGovernment1.11.11.11.01.01.01.01.01.01.01.01.01.0
PctChgYearAgo0.40.0-3.0-9.1-7.3-8.1-6.0-2.0-1.3-0.8-0.5-0.5-0.7
State&LocalGovernment19.719.819.819.919.920.020.020.120.120.220.220.320.3
PctChgYearAgo1.82.92.80.81.30.90.80.90.91.01.11.11.1
Other Economic Indicators
Population(Ths)565.0567.8570.3572.7575.0576.8578.4580.2581.7583.0584.5585.9587.3
PctChgYearAgo2.32.11.91.81.81.61.41.31.21.11.11.01.0
LaborForce(Ths)244.2245.8246.3246.6246.9247.2247.6248.1248.5248.9249.3249.7250.1
PctChgYearAgo2.42.71.82.01.10.50.50.60.60.70.70.70.6
UnemploymentRate(%)4.24.34.44.74.84.94.94.95.05.05.05.04.9
TotalHousingStarts5591.25643.85541.75452.85378.35181.15114.74858.04834.84789.84753.14737.84725.1 Single-Family4605.84447.54279.34181.24017.13851.53814.83737.73691.93639.63598.83569.23527.6
Multifamily985.41196.31262.41271.61361.21329.61299.81120.31142.81150.21154.41168.61197.5
PROFILES
The Punta Gorda MSA is located in the southwest segment of the state. Punta Gorda is the County seat of Charlotte County and the only incorporated municipality in the country. The city is known as one of the top sport-fishing destinations along with the water recreation in Charlotte Harbor.
QUICK FACTS
• Metro population estimate of 206,134 as of 2023 (ACS 5-Year Estimate) (U.S. Census Bureau).
• Charlotte County population estimate of 206,134 as of 2023 (ACS 5-Year Estimate).
• Civilian labor force of 78,214 in December 2024 (FRED, U.S. Bureau of Labor Statistics).
• A n unemployment rate of 3.8% as of December 2024, not seasonally adjusted. This amounts to 2,979 unemployed people (FRED, U.S. Bureau of Labor Statistics).
OUTLOOK SUMMARIES
The Punta Gorda Metropolitan Statistical Area (MSA) is expected to show moderate levels of growth in its economic indicators. Punta Gorda’s Gross Metro Product will be $7,677.15 million, ranking 4th lowest. Personal income growth will be 5.9 percent, leading to a per capita income level of $49,600. Average annual wage growth will be 4.3 percent (5th highest), leading to an average annual wage of $66,400. Population growth will average 1.3 percent annually.
Employment growth is expected to average 0.6 percent annually. The unemployment rate is estimated to average 5.1 percent, ranking 5th highest among MSAs studied.
The Information sector will lead Punta Gorda at an average annual growth rate of 2.7 percent. The Other Services sector will expand at an average rate of 2.1 percent. The Federal Government sector will see a contraction of -3.8 percent, followed by a contraction in the Professional and Business Services sector by -0.4 percent.
METRO NEWS SUMMARIES
Punta Gorda’s projects address City Hall, flooding, citywide improvements
• P unta Gorda is reallocating a portion of the $15.9 million originally intended for a new City Hall to other capital improvement projects, prioritizing public health, safety, and infrastructure. A $3.2 million project is planned for the Henry Street property, which will include amenities for the Hounds on Henry dog park and the future Peace River Wildlife Center, though $1.2 million in funding remains unsecured.
• The city will repair the historic City Hall and its annex, avoiding the previously proposed $20 million multistory expansion. The shared police and fire department building at 1410 Tamiami Trail will be renovated for exclusive fire department use, with a new police station planned; the current budget for fire department renovations is $6.95 million.
• F lood mitigation efforts include a $1.5 million engineering study for phase three of the Downtown Flooding Improvement project and a $300,000 swale regrading program targeting 38 properties. Hurricane-related damage has prompted repairs to the Laishley fishing pier ($1.07 million), with FEMA reimbursement pending, and other projects include dredging, drainage upgrades, and park improvements.
Source: Gulfshore Business, March 6, 2025
Charlotte County aviation training center on track for December finish
• Construction is progressing on Charlotte Technical College’s new aviation training facility at Punta Gorda Airport, with completion expected by December 2025.
• The facility will span 19,420 square feet and include a 10,000-square-foot hangar, classrooms, and labs equipped for hands-on
training with industry-standard tools and technologies. The center aims to prepare students for careers in aviation maintenance, including certification for Federal Aviation Administration (FAA) airframe and powerplant licenses.
• The project is funded by $5.75 million in state support and is located within the PGD Aviation Expansion Area. The aviation program began in 2018 with a $1.7 million grant from the Florida Job Growth Grant Fund and builds on Charlotte Technical College’s legacy as the county’s first vocational-trade school, established in 1980.
Source: Business Observer, March 11, 2025
Lane Valente Industries opens southern headquarters in Punta Gorda
• Lane Valente Industries (LVI) has opened its southern headquarters at Northup Drive Commerce Park near Punta Gorda Airport, following the completion of new construction on the site.
• The company purchased a 10-acre parcel in August 2022 for $1.53 million and developed two industrial flex buildings totaling 35,000 square feet, which are now fully leased. One of the first tenants, Herc Rentals, moved into a custom-built 14,000-square- foot facility on a 4-acre parcel within eight months of groundbreaking, demonstrating LVI’s clientfocused development strategy.
• LVI plans to hire 30 employees over the next year and will host a grand opening and job fair on April 24, in partnership with the Charlotte County Economic Development Office.
Source: Gulfshore Business, April 2, 2025
Naples construction firm readies for $44M PGD airport expansion
• DeAngelis Diamond, a Naples-based construction firm, will lead a $44 million terminal expansion project at Punta Gorda Airport (PGD), with construction beginning
in June 2025 and completion targeted for July 2027.
• The project will add over 50,000 square feet of new space and renovate more than 28,000 square feet of the existing Bailey Terminal. The expansion will increase the number of gates from seven to ten and aims to improve passenger experience and operational efficiency in response to rising demand—PGD served over 1.9 million passengers in 2024.
• DeAngelis Diamond previously completed PGD’s 2016 terminal expansion and has experience with multiple regional airports, including Southwest Florida International and Sarasota-Bradenton International.
Source: Business Observer, April 9, 2025
Charlotte County Planning & Zoning approves 653-acre development
• Charlotte County’s Planning and Zoning Board unanimously approved the 653-acre Harborview development project, which includes residential, commercial, and hotel components.
• The project, led by Benderson Development, will include 3,959 residential units, 50,000 square feet of office space, 655,000 square feet of commercial space, and 350 hotel rooms across three sections: North Village, East Village, and West Village. Environmental provisions include 226.55 acres of open space and 61.21 acres preserved for scrub jay and gopher tortoise habitats. The developer is coordinating with the Charlotte County School Board to create a school bus route that avoids Harborview Road.
• Buc-ee’s has expressed interest in establishing a large-scale gas station and convenience store within the development, which has drawn additional scrutiny from nearby residents.
Source: Gulfshore Business, April 16, 2025
Long Term Outlook for Punta Gorda, FL
June 2025 Forecast
Personal Income (Billions $)
202020212022202320242025202620272028
TotalPersonalIncome9.110.110.511.412.213.013.714.515.3
PctChgYearAgo8.710.83.88.67.06.45.75.85.6
WagesandSalaries2.32.73.03.33.53.73.94.14.3
NonwageIncome6.87.47.58.18.79.39.810.411.0
RealPersonalIncome(12$)8.89.69.49.610.010.310.711.111.5
PctChgYearAgo4.19.4-2.32.04.33.13.13.83.8
PerCapitaIncome(Ths)48.251.651.654.957.460.262.965.868.6
RealPerCapitaIncome(12$)46.649.346.446.347.247.948.950.151.3
AverageAnnualWage(Ths)47.752.454.957.759.961.864.868.071.0
PctChgYearAgo7.39.84.85.23.83.24.94.94.3
Establishment Employment (Place of Work, Thousands, SA)
TotalEmployment48.851.253.856.458.759.259.459.860.2
PctChgYearAgo-2.44.95.04.84.11.00.30.50.7
Manufacturing0.80.90.91.01.11.11.11.11.1
PctChgYearAgo-0.212.63.73.711.93.2-0.10.00.3
Nonmanufacturing48.050.352.855.457.658.158.358.659.1
PctChgYearAgo-2.54.85.04.84.00.90.30.60.7
Construction&Mining4.54.85.25.85.75.85.95.95.9 PctChgYearAgo3.77.58.710.9-2.32.61.1-0.50.2 Trade,Trans,&Utilities11.511.912.512.913.113.313.313.413.2 PctChgYearAgo-1.63.15.13.41.41.10.10.7-1.1 WholesaleTrade0.80.80.91.01.11.11.11.11.1 RetailTrade9.59.810.310.310.310.410.310.410.3 Trans,Wrhsng,&Util1.21.31.31.61.71.81.81.81.8 Information0.30.40.40.40.40.40.40.40.4 PctChgYearAgo-17.020.30.00.1-0.22.55.70.81.9 FinancialActivities2.22.32.32.42.42.52.52.62.6 PctChgYearAgo-3.55.0-0.72.63.60.92.01.31.4 Prof&BusinessServices4.55.26.06.36.76.86.66.46.6 PctChgYearAgo3.615.214.85.06.61.3-2.8-2.11.9 Educ&HealthServices9.59.49.510.110.510.911.011.111.3 PctChgYearAgo-3.4-1.00.95.55.03.40.71.41.7
Leisure&Hospitality6.97.57.88.19.08.58.78.88.9 PctChgYearAgo-11.38.64.44.310.9-5.61.91.50.9 OtherServices2.42.62.92.92.83.03.03.03.1 PctChgYearAgo4.87.98.31.2-2.64.90.11.42.1 FederalGovernment0.30.30.30.40.40.40.40.30.3
PctChgYearAgo10.4-14.25.626.50.0-4.2-6.9-2.9-1.3
State&LocalGovernment5.75.85.96.16.56.66.76.76.8
PctChgYearAgo-2.22.01.83.75.42.50.30.81.0
Other Economic Indicators
Population(Ths)189.1195.9203.4207.8212.5215.6218.0220.7223.7
PctChgYearAgo2.73.63.82.22.31.51.11.21.4
LaborForce(Ths)67.269.372.175.177.478.979.479.880.1 PercentChange,YearAgo0.03.14.14.13.12.00.60.50.4
UnemploymentRate(%)8.04.73.83.74.14.85.35.34.9
TotalHousingStarts2552.03975.65445.44118.54285.13406.63071.52879.62768.3
Single-Family2359.73260.14494.03814.53674.12703.42504.92307.22148.3
Multifamily192.3715.5951.4304.1611.0703.2566.7572.4620.0
Short Term Outlook for Punta Gorda, FL
June 2025 Forecast
Personal Income (Billions $)
2025:12025:22025:32025:42026:12026:22026:32026:42027:12027:22027:32027:42028:1
TotalPersonalIncome12.712.913.113.213.413.613.814.014.214.414.614.815.0
PctChgYearAgo5.96.36.56.65.85.75.85.75.75.65.86.05.8
WagesandSalaries3.63.73.73.73.83.83.93.94.04.14.14.24.2
NonwageIncome9.19.29.49.59.69.89.910.010.210.410.510.710.8
RealPersonalIncome(12$)10.310.310.310.410.510.610.710.810.911.011.111.211.3
PctChgYearAgo3.62.92.92.92.33.33.43.33.63.63.94.23.9
PerCapitaIncome(Ths)59.259.960.561.161.962.763.363.864.765.566.266.867.5
RealPerCapitaIncome(12$)47.947.847.948.148.548.849.049.249.650.050.350.650.9
AverageAnnualWage(Ths)61.261.461.962.763.764.565.166.066.967.768.469.169.9
PctChgYearAgo2.63.23.23.64.24.95.25.34.95.05.14.84.5
Establishment Employment (Place of Work, Thousands, SA)
TotalEmployment58.859.359.459.559.459.459.459.559.659.759.859.959.9
PctChgYearAgo0.40.51.02.11.00.10.10.10.30.60.60.70.6
Manufacturing1.11.11.11.11.11.11.11.11.11.11.11.11.1
PctChgYearAgo8.62.31.90.5-1.00.10.20.20.5-0.3-0.2-0.10.2
Nonmanufacturing57.758.258.358.458.358.258.358.458.558.658.758.858.8
PctChgYearAgo0.20.50.92.11.10.10.10.10.30.60.70.70.6
Construction&Mining5.75.85.95.95.95.95.95.95.95.95.95.95.9
PctChgYearAgo-1.42.63.46.23.51.40.2-0.6-0.7-0.5-0.5-0.3-0.2
Trade,Trans,&Utilities13.213.313.313.313.213.213.313.313.313.413.413.313.2
PctChgYearAgo0.40.81.31.70.5-0.5-0.10.30.80.90.70.2-0.9 WholesaleTrade1.11.11.11.11.11.11.11.11.11.11.11.11.1
RetailTrade10.310.410.410.410.310.310.410.410.410.410.510.410.3 Trans,Wrhsng,&Util1.81.81.81.81.81.81.81.81.81.81.81.81.8 Information0.40.40.40.40.40.40.40.40.40.40.40.40.4 PctChgYearAgo1.51.12.15.36.66.75.44.01.90.80.20.10.6 FinancialActivities2.42.52.52.52.52.52.52.52.52.52.62.62.6
PctChgYearAgo-2.0-1.42.94.23.72.01.60.91.01.31.41.51.8 Prof&BusinessServices6.86.86.86.76.76.66.66.56.56.46.46.46.5
PctChgYearAgo3.00.90.11.1-1.2-3.3-3.5-3.2-3.3-2.3-1.8-1.00.8 Educ&HealthServices10.910.910.911.011.011.011.011.011.111.111.211.211.3
PctChgYearAgo4.54.22.52.71.00.50.60.61.11.41.51.41.7
Leisure&Hospitality8.48.58.58.68.68.68.78.78.78.88.88.98.8
PctChgYearAgo-9.0-7.9-4.2-1.22.21.72.11.51.41.61.61.70.7
OtherServices2.93.03.03.03.02.93.03.03.03.03.03.03.0
PctChgYearAgo2.95.75.45.41.3-0.4-0.4-0.20.61.41.71.72.1
FederalGovernment0.40.40.40.40.40.40.40.40.30.30.30.30.3
PctChgYearAgo0.1-2.2-6.7-7.8-8.0-8.5-7.1-3.8-3.7-3.2-2.6-1.9-1.3
State&LocalGovernment6.66.66.66.66.66.76.76.76.76.76.76.76.8
PctChgYearAgo4.72.01.22.00.30.30.20.40.60.80.91.01.1
Other Economic Indicators
Population(Ths)214.6215.4216.0216.6217.1217.7218.3218.9219.6220.3221.0221.9222.6
PctChgYearAgo1.81.51.31.21.21.11.11.11.21.21.31.31.4
LaborForce(Ths)78.479.079.179.179.279.379.479.579.679.779.879.980.0
PctChgYearAgo1.62.01.92.31.10.40.40.50.50.60.50.50.5
UnemploymentRate(%)4.64.74.95.15.25.35.35.35.35.35.25.25.1
TotalHousingStarts3512.23488.23409.43216.43125.33099.93075.42985.52957.62896.32846.82817.82787.5 Single-Family2808.72747.52678.62578.72534.92529.72502.12452.72393.12326.32273.62235.72190.7
Multifamily703.5740.7730.8637.7590.4570.2573.3532.9564.5570.0573.2582.1596.9
PROFILES
The Sebastian MSA is located in central east Florida and is comprised of the Indian River County. Sebastian is home to Pelican Island, America’s first National Wildlife refuge, and is known for its Atlantic-facing beaches.
QUICK FACTS
• Metro population estimate of 169,795 as of 2023 (ACS 5-Year Estimate) (U.S. Census Bureau).
• Indian River County population estimate of 169,795 as of 2023 (ACS 5-Year Estimate).
• Civilian labor force of 68,629 in December 2024 (FRED, U.S. Bureau of Labor Statistics).
• A n unemployment rate of 3.6% as of December 2024, not seasonally adjusted. This amounts to 2,486 unemployed people (FRED, U.S. Bureau of Labor Statistics).
OUTLOOK SUMMARIES
The Sebastian Metropolitan Statistical Area (MSA) is expected to show mixed growth in the economic indicators studied in this forecast.
The MSA’s Gross Metro Product level will be $8,614.03 million, 5th lowest in the state. The per capita income level will be 2nd highest among MSAs studied at $96,300, boosted by personal income growth of 5.3. Average annual wage growth of 4.3 percent will lead the average annual wage level to $72,200. Population growth will be 0.6 percent.
The Sebastian MSA will experience an average employment growth rate of 0.8 percent annually. Sebastian’s unemployment rate should average 5.1 percent, the 4th highest in the state.
The Information sector is expected to be the fastest growing sector in the area, averaging 7.9 percent growth annually. The Financial sector will have an average annual growth rate of 2.6 percent. The Manufacturing sector is expected to contract by -1.3 percent.
METRO NEWS SUMMARIES
New U.S. Customs facility set to open in Vero Beach, possibly boosting local economy
• Vero Beach Regional Airport has almost completed the construction of a new customs facility. The project was led by Corporate Air and cost $3.5 million, with hopes that it will provide a new avenue for increased international travel and new business opportunities.
• The project also hopes to streamline private and chartered flights, which have seen a recent rise starting back in 2018, when it reported a 31% increase in private flights. Without the customs facility, international flights are hassled with having to stop elsewhere, sometimes costing an additional $5,000, and are unable to directly stop at the regional airport.
• The director of the Vero Beach Regional Airport, Todd Scher, stated that the facility is currently being designed around private aircraft, but is open to future expansions to increase that scope. The completion date for the customs facility is set for April 1st.
Source: WPTV West Palm Beach, March 20, 2025
Gov. DeSantis awards Vero Beach $11.3M for new wastewater treatment plant
• Vero Beach recently received a $13.3 million grant to fund a new wastewater treatment facility near the city’s airport. This project aims to replace their old wastewater treatment facility on 17th street bridge and will remove excess nitrogen and phosphorus. This marks the 4th grant that the proposed facility has received, totaling $37.6 million.
• Th is funding is part of a larger $399 million Florida initiative aimed at improving the state’s water quality and supply by reclaiming wastewater. Governor Ron Desantis stressed the vital role of Florida’s waterways and their need for protection. Of the total funding, $100 million will go to the Indian River Lagoon Program.
• The Indian River Lagoon plays a key economic and environmental role for not only Volusia County, but 6 other counties as well. The annual economic impact of the Lagoon is estimated to be $7.6 billion. As for the new wastewater treatment facility, construction already started in late 2024 with the final cost estimated at $150-170 million.
Source: Vero News, March 26, 2025
Three Corners: Two developers vie for multimillion Vero Beach project
• At the intersection of Indian River Boulevard and 17th street lies an out of service powerplant, and for the last 6 years the city has been planning ways to repurpose the location into a multi-million-dollar development project called Three Corners in Vero Beach.
• City officials have been searching for potential developers, and they are now considering ClearPath Service and Blue at Vero Beach. Both developers have submitted their proposals. SaDa Inc. was also a potential developer, but they decided not to enter the recent bid.
• The project claims to include restaurants, shops, a hotel, a large meeting hall, and a marina that could accommodate yachts up to 125 feet long. Community members are anxious about the project as some bring up traffic concerns while others are more concerned about which developer will be chosen.
Source: CBS 12 News, April 1, 2025
Piper Aircraft Navigates Tariff Threats, Avoids Layoffs
• Piper Aircraft faced a potential layoff involving 2/3 of its workforce, which they luckily avoided thanks to a collaboration between the company and government officials.
• U.S. Representative Mike Haridopolos was among those that worked with Piper Aircraft’s leadership and received praise from their CEO John Calcagno who touted this as an example of effective public-private partnership.
• The cause of this turmoil was the building pressure coming from tariffs on imports from Canada and Mexico as earlier this year, the 25% tariff was implemented. This significantly increased the cost of their key components, such as turboprop engines. To mitigate this, they considered layoffs which would impact about 1,500 employees in Vero Beach, which ultimately did not materialize.
Source: AVWeb, May 8, 2025
Treasure Coast real estate market cools. Is it a sign of Florida’s future? | Opinion
• The real estate analytical firm ResiClub released a report concluding that Indian River County communities have seen significant home price drops, ranking 5th in the nation for year-over-year price decreases.
• Some factors influencing this include climate concerns, such as hot weather and more frequent hurricanes, and rising insurance rates for cars and homes. Although Florida enjoyed continued population growth and development, they may begin to decline like California if the state faces enough negative factors.
• The “Pay for itself” model used for Florida’s growth may be flawed, as there should be no need for continued development if the tax revenues from previous developments were enough to pay for the services currently in use. In this sense, the continued developments may be described as a Ponzi Scheme.
Source: TC Palm, May 20, 2025
Long Term Outlook for Sebastian-Vero Beach, FL
June 2025 Forecast
Personal Income (Billions $)
202020212022202320242025202620272028
TotalPersonalIncome14.015.816.318.019.019.820.822.023.3
PctChgYearAgo5.813.13.210.05.54.45.06.05.7
WagesandSalaries2.83.13.53.73.94.14.34.54.7
NonwageIncome11.212.712.914.315.115.716.517.518.6
RealPersonalIncome(12$)14.014.814.815.415.816.016.417.017.7
PctChgYearAgo3.65.5-0.34.32.81.22.34.13.9
PerCapitaIncome(Ths)86.996.397.2105.3110.1114.8119.9126.1131.9
RealPerCapitaIncome(12$)87.290.187.890.291.992.994.597.6100.3
AverageAnnualWage(Ths)52.657.460.762.164.967.570.673.876.8
PctChgYearAgo7.19.15.62.34.64.04.64.54.0
Establishment Employment (Place of Work, Thousands, SA)
TotalEmployment52.253.956.958.959.559.860.160.661.3
PctChgYearAgo-4.13.35.53.61.00.60.50.81.1
Manufacturing2.22.12.42.83.13.13.03.02.9
PctChgYearAgo-6.8-3.116.814.610.2-0.2-1.3-1.7-1.8
Nonmanufacturing50.151.854.556.156.456.857.157.758.4
PctChgYearAgo-4.03.55.13.10.50.60.61.01.3
Construction&Mining4.54.54.84.95.15.25.25.35.3
PctChgYearAgo-0.21.36.62.53.01.51.70.50.9 Trade,Trans,&Utilities10.611.111.611.911.611.511.411.511.4
PctChgYearAgo-0.84.94.61.8-2.0-1.0-0.70.8-0.6 WholesaleTrade1.11.31.51.51.31.31.31.31.3 RetailTrade8.68.89.09.29.39.29.19.29.2 Trans,Wrhsng,&Util0.91.01.11.11.01.01.01.01.0 Information0.50.40.40.50.50.50.60.60.6
PctChgYearAgo-14.7-17.26.217.8-7.314.78.83.74.5 FinancialActivities2.83.03.13.03.13.23.33.43.4 PctChgYearAgo0.37.63.4-1.12.02.22.92.82.3 Prof&BusinessServices6.26.67.27.47.27.27.16.97.1
PctChgYearAgo-4.06.310.01.9-2.10.1-2.3-1.72.5 Educ&HealthServices10.610.611.011.612.212.712.813.013.2
PctChgYearAgo-2.00.33.15.75.14.01.21.31.5
Leisure&Hospitality7.17.68.38.78.58.28.38.58.6
PctChgYearAgo-14.97.39.24.6-1.7-4.31.92.01.5 OtherServices2.72.93.03.13.03.03.13.13.2
PctChgYearAgo-2.16.12.63.3-1.90.71.82.12.7
FederalGovernment0.40.40.40.40.40.40.40.40.4
PctChgYearAgo3.6-3.7-4.24.30.0-2.7-4.41.41.6
State&LocalGovernment4.74.74.74.74.84.94.95.05.0
PctChgYearAgo-3.4-0.5-0.90.82.72.20.10.81.2
Other Economic Indicators
Population(Ths)160.9164.3168.0170.7172.2172.4173.3174.7176.5
PctChgYearAgo1.82.12.31.60.90.10.50.81.0
LaborForce(Ths)61.963.065.767.767.968.669.069.569.8
PercentChange,YearAgo-1.71.84.33.10.31.00.60.60.5
UnemploymentRate(%)8.05.03.73.64.14.75.25.35.2
TotalHousingStarts1121.61546.01155.21491.0548.9434.4939.41198.01166.5
Single-Family1113.21541.81143.51233.8376.6347.8841.01060.21014.3
Multifamily8.44.211.7257.2172.386.698.3137.8152.3
Short Term Outlook for Sebastian-Vero Beach, FL
June 2025 Forecast
Personal Income (Billions $)
2025:12025:22025:32025:42026:12026:22026:32026:42027:12027:22027:32027:42028:1
TotalPersonalIncome19.519.719.920.020.320.721.021.221.621.922.222.522.8
PctChgYearAgo3.94.54.64.64.14.65.45.86.26.05.96.15.8
WagesandSalaries4.04.04.14.14.24.24.34.44.44.54.54.64.6
NonwageIncome15.515.715.815.916.116.416.716.817.217.417.717.918.2
RealPersonalIncome(12$)16.016.016.016.016.116.316.516.616.817.017.117.317.5
PctChgYearAgo1.61.21.01.00.62.23.03.54.03.94.04.23.9
PerCapitaIncome(Ths)113.3114.6115.4116.1117.6119.3120.8122.0123.9125.4126.9128.2129.8
RealPerCapitaIncome(12$)93.192.792.892.993.494.395.095.496.597.298.098.699.3
AverageAnnualWage(Ths)66.767.267.768.669.470.271.071.972.773.574.274.975.7
PctChgYearAgo3.54.34.14.14.14.54.94.84.74.74.54.34.1
Establishment Employment (Place of Work, Thousands, SA)
TotalEmployment59.659.960.059.960.060.160.260.360.460.660.760.961.0
PctChgYearAgo0.10.80.11.20.70.20.40.60.70.80.91.01.0
Manufacturing3.13.13.13.13.03.13.03.03.03.03.03.03.0
PctChgYearAgo2.2-0.2-1.7-1.1-2.1-1.2-0.7-1.2-0.8-2.0-2.1-1.9-1.8
Nonmanufacturing56.556.856.956.957.057.057.257.357.457.657.857.958.0
PctChgYearAgo0.00.90.21.30.90.30.50.70.80.91.01.11.1
Construction&Mining5.15.15.25.25.25.25.35.35.35.35.35.35.3
PctChgYearAgo0.02.30.83.12.61.81.31.10.90.60.40.30.5 Trade,Trans,&Utilities11.511.611.511.511.411.411.511.511.511.511.511.511.4
PctChgYearAgo-2.00.2-1.4-0.6-0.4-1.4-0.8-0.10.60.90.80.7-0.5 WholesaleTrade1.31.31.31.31.31.31.31.31.31.31.31.31.3 RetailTrade9.29.39.29.29.19.19.29.19.29.29.29.29.1 Trans,Wrhsng,&Util1.01.01.01.01.01.01.01.01.01.01.01.01.0 Information0.50.50.50.50.60.60.60.60.60.60.60.60.6
PctChgYearAgo19.321.05.814.37.910.19.28.25.23.73.02.93.4 FinancialActivities3.13.23.23.23.23.33.33.33.33.33.43.43.4 PctChgYearAgo1.51.51.94.03.22.43.13.12.82.92.82.72.7 Prof&BusinessServices7.27.37.37.27.17.17.07.06.96.96.97.07.0
PctChgYearAgo1.00.2-0.1-0.8-1.3-2.6-3.0-2.3-2.6-1.9-1.5-0.61.3 Educ&HealthServices12.612.612.712.712.812.812.812.912.913.013.013.013.1
PctChgYearAgo5.04.83.52.51.41.11.11.21.31.31.31.21.5
Leisure&Hospitality8.18.18.28.28.38.38.38.48.48.48.58.68.5
PctChgYearAgo-7.9-5.7-4.20.71.61.82.21.81.71.92.12.31.4 OtherServices3.03.03.03.13.13.13.13.13.13.13.13.23.2
PctChgYearAgo-1.70.70.53.42.71.81.51.21.51.92.32.62.9
FederalGovernment0.40.40.40.40.40.40.40.40.40.40.40.40.4
PctChgYearAgo0.3-0.1-4.1-6.7-7.2-6.8-3.90.50.91.41.71.61.6
State&LocalGovernment4.94.94.94.94.94.94.95.05.05.05.05.05.0
PctChgYearAgo3.32.31.81.40.0-0.10.00.70.70.70.91.01.2
Other Economic Indicators
Population(Ths)172.3172.3172.4172.5172.8173.1173.4173.8174.2174.5174.9175.4175.8
PctChgYearAgo0.30.10.00.10.30.50.60.70.80.80.90.91.0
LaborForce(Ths)68.268.768.868.868.969.069.169.269.369.469.569.669.7
PctChgYearAgo0.30.90.81.91.10.50.50.60.60.60.60.60.5
UnemploymentRate(%)4.54.64.85.05.15.25.35.35.35.45.45.35.3
TotalHousingStarts282.2377.0501.3576.9705.2880.71021.61150.01212.01204.71191.51183.71174.2
Single-Family195.0290.9413.9491.4614.9793.3925.41030.51077.31067.51053.31042.61028.9
Multifamily87.286.287.485.590.387.496.2119.4134.7137.2138.3141.1145.3
PROFILES
The Sebring MSA is comprised of Highlands County and located in the South-central portion of the state. Sebring is nicknamed “The City of the Circle” in reference to Circle Drive, the center of the Sebring Downtown Historic District. Sebring is the home of the Sebring International Raceway, created on a former airbase and it is currently known as the host of the host of the Mobil 1 Twelve Hours of Sebring, an annual WeatherTech SportsCar Championship Race.
QUICK FACTS
• Metro population estimate of 107,614 as of 2023 (ACS 5-Year Estimate) (U.S. Census Bureau).
• H ighlands County population estimate of 107,614 as of 2023 (ACS 5-Year Estimate).
• Civilian labor force of 36,830 in December 2024 (FRED, U.S. Bureau of Labor Statistics).
• A n unemployment rate of 4.5% as of December 2024, not seasonally adjusted. This amounts to 1,666 unemployed people (FRED, U.S. Bureau of Labor Statistics).
OUTLOOK SUMMARIES
The Sebring Metropolitan Statistical Area (MSA) is expected to have mixed levels of growth in its economic indicators. Sebring’s Gross Metro Product is the lowest among MSAs studied at $3,128.70 million. Personal income will grow by 5.7 percent, which will lead to a per capita income level of $43,200 (3rd lowest). Average annual wage growth of 4.3 percent will lead to an average annual wage of $62,800 (2nd lowest). Population growth will average 0.4 percent (5th lowest).
Employment growth is expected to be 0.9 percent annually. The unemployment rate is estimated to average 6.0 percent, the 3rd highest in the state.
The Education and Health Services sector will see the highest annual growth rate in Sebring at 1.9
percent. The Other Services sector will follow with a growth rate of 1.7 percent. The Information and Manufacturing sectors will contract at rates of -0.2 and -5.6 percent respectively.
METRO NEWS SUMMARIES
Sparta Road Development seeks Sebring’s utilities
• Green Group Development is proposing 40 single-family homes on Sparta Road and has requested Sebring water and sewer services, triggering a potential annexation agreement.
• Sebring City Council must approve utility extensions outside city limits, factoring in economic, environmental, and planning impacts tied to long-term growth.
• The project reflects broader regional trends where new housing developments seek urban utility access, linking infrastructure demands with future annexation and zoning strategy.
Source: Highlands News-Sun. April 15, 2025
Chase Bank Branch under construction in Sebring
• A new Chase bank branch is under construction on U.S. 27 North in Sebring, signaling continued commercial investment along one of the city’s busiest corridors.
• J PMorgan Chase acquired the property for $1.96 million in March 2025, further activating a 9.61-acre site previously eyed for big-box retail development.
• The branch joins recent additions like Chickfil-A and Tidal Wave Auto Spa, highlighting ongoing corridor densification and rising demand for consumer-facing financial services.
Source: Highlands News-Sun, May 23, 2024
Sebring to consider open containers for downtown businesses
• Sebring City Council is reviewing a proposed open container ordinance that would allow patrons to carry alcoholic beverages into Circle Park from nearby downtown businesses.
• The proposal, backed by the Community Redevelopment Agency and The 301, aims to boost foot traffic, tourism, and economic activity in the city’s core.
• If approved, the ordinance could enhance downtown vibrancy and support local hospitality businesses, aligning with postHGTV revitalization momentum..
Source: Highlands News-Sun, June 9, 2025
Long Term Outlook for Sebring, FL
June 2025 Forecast
Personal Income (Billions $)
202020212022202320242025202620272028
TotalPersonalIncome3.94.34.44.85.05.35.65.96.2
PctChgYearAgo7.79.52.28.55.16.06.15.85.0
WagesandSalaries1.21.31.41.51.61.71.81.92.0
NonwageIncome2.83.03.03.23.43.63.84.14.3
RealPersonalIncome(12$)4.24.44.24.34.44.54.74.95.0
PctChgYearAgo8.63.3-4.12.92.52.73.43.83.2
PerCapitaIncome(Ths)38.541.441.243.945.548.050.853.656.0
RealPerCapitaIncome(12$)41.742.339.539.940.341.242.544.045.2
AverageAnnualWage(Ths)46.448.651.254.156.558.761.464.266.7
PctChgYearAgo6.84.75.35.64.43.94.64.63.9
Establishment Employment (Place of Work, Thousands, SA)
TotalEmployment24.825.727.128.028.429.029.229.329.4
PctChgYearAgo-4.93.45.63.21.52.00.70.30.4
Manufacturing0.70.60.60.70.70.70.70.60.6
PctChgYearAgo2.2-9.86.18.78.4-0.2-6.1-8.0-8.0 Nonmanufacturing24.225.126.527.327.728.228.528.628.8 PctChgYearAgo-5.13.75.63.11.42.00.90.50.6 Construction&Mining1.61.71.81.91.92.02.02.02.0
PctChgYearAgo6.37.69.34.8-0.32.71.6-0.3-0.2 Trade,Trans,&Utilities5.55.65.95.96.06.16.16.16.0
PctChgYearAgo-4.02.64.30.10.92.3-0.20.4-1.0 WholesaleTrade0.80.80.80.80.80.90.90.90.9 RetailTrade3.83.94.14.14.14.24.24.24.1 Trans,Wrhsng,&Util0.90.91.01.01.01.01.01.01.0 Information0.10.20.20.20.20.20.20.20.2 PctChgYearAgo-8.436.8-8.45.7-5.91.51.8-2.9-1.3 FinancialActivities0.90.90.91.01.01.01.01.01.0 PctChgYearAgo-4.90.82.79.8-0.11.10.9-1.2-1.5 Prof&BusinessServices2.12.52.82.72.62.62.52.52.7 PctChgYearAgo-8.219.110.2-2.5-6.40.7-1.90.14.5 Educ&HealthServices6.16.16.56.87.17.37.47.57.6
PctChgYearAgo-3.51.35.44.94.02.91.71.21.7
Leisure&Hospitality3.13.23.53.73.73.83.93.83.8
PctChgYearAgo-12.52.99.74.62.30.32.6-0.2-1.3
OtherServices0.60.60.70.70.80.80.80.80.8
PctChgYearAgo-7.6-3.39.38.27.64.50.60.31.4 FederalGovernment0.30.30.30.30.30.30.30.30.3
PctChgYearAgo9.3-9.94.7-0.5-1.50.7-1.32.81.9
State&LocalGovernment3.83.93.94.14.24.34.34.44.4
PctChgYearAgo-5.51.40.84.12.62.11.10.81.1
Other Economic Indicators
Population(Ths)101.6103.6106.2108.3109.9110.4110.7111.0111.4
PctChgYearAgo0.72.02.52.01.40.50.20.30.4
LaborForce(Ths)33.734.435.636.536.637.137.137.036.8
PercentChange,YearAgo-3.02.33.32.80.31.2-0.1-0.2-0.4
UnemploymentRate(%)8.26.04.34.34.95.76.26.35.9
TotalHousingStarts356.7564.1630.5670.7673.3605.8490.0462.7452.5
Single-Family353.3549.3622.9629.9615.8521.8422.7384.4364.2
Multifamily3.414.87.640.857.583.967.378.388.3
Short Term Outlook for Sebring, FL
June 2025 Forecast
Personal Income (Billions $)
2025:12025:22025:32025:42026:12026:22026:32026:42027:12027:22027:32027:42028:1
TotalPersonalIncome5.25.35.35.45.55.65.75.75.85.96.06.06.1
PctChgYearAgo5.66.36.15.85.25.86.66.66.65.95.35.45.1
WagesandSalaries1.71.71.71.71.81.81.81.81.91.91.91.91.9
NonwageIncome3.53.63.63.63.73.83.93.94.04.04.14.14.2
RealPersonalIncome(12$)4.54.54.64.64.64.74.74.84.84.94.94.95.0
PctChgYearAgo3.32.92.52.11.83.44.24.34.53.83.53.63.2
PerCapitaIncome(Ths)47.147.848.248.749.550.551.351.852.653.353.954.555.1
RealPerCapitaIncome(12$)41.141.141.241.441.742.442.843.143.543.944.244.444.8
AverageAnnualWage(Ths)57.958.358.859.660.361.061.762.563.263.964.665.265.8
PctChgYearAgo3.44.04.04.24.14.64.94.94.84.84.64.34.2
Establishment Employment (Place of Work, Thousands, SA)
TotalEmployment28.829.029.129.129.129.229.229.229.229.229.329.329.3
PctChgYearAgo2.62.61.61.11.20.70.50.50.30.20.30.30.3
Manufacturing0.80.70.70.70.70.70.70.70.70.60.60.60.6
PctChgYearAgo5.90.9-2.7-4.5-6.0-5.5-6.0-6.9-7.1-8.4-8.6-8.2-7.9
Nonmanufacturing28.028.228.328.428.428.528.528.528.628.628.728.728.7
PctChgYearAgo2.52.61.71.31.40.90.70.70.50.40.50.50.4
Construction&Mining1.92.02.02.02.02.02.02.02.02.02.02.02.0
PctChgYearAgo3.24.20.82.72.31.91.50.90.2-0.4-0.6-0.6-0.5
Trade,Trans,&Utilities6.06.16.16.16.16.16.16.16.16.16.16.16.0
PctChgYearAgo4.13.11.40.50.5-0.7-0.4-0.10.50.50.40.1-0.9 WholesaleTrade0.80.90.90.90.90.90.90.90.90.90.90.90.9
RetailTrade4.24.24.24.24.24.24.24.24.24.24.24.24.1 Trans,Wrhsng,&Util1.01.01.01.01.01.01.01.01.01.01.01.01.0 Information0.20.20.20.20.20.20.20.20.20.20.20.20.2
PctChgYearAgo-0.71.32.23.23.03.30.90.1-2.1-3.2-3.2-3.1-2.5
FinancialActivities1.01.01.01.01.01.01.01.01.01.01.01.01.0
PctChgYearAgo-1.52.02.01.92.21.10.6-0.4-0.9-1.2-1.4-1.4-1.2
Prof&BusinessServices2.62.62.62.62.52.52.52.52.52.52.52.62.6
PctChgYearAgo0.51.01.40.1-1.5-2.5-2.4-1.1-1.1-0.20.51.43.3
Educ&HealthServices7.27.27.37.37.47.47.47.47.47.57.57.57.6
PctChgYearAgo3.83.32.22.22.41.81.31.21.11.11.41.31.6
Leisure&Hospitality3.73.73.83.83.83.93.93.93.93.83.83.83.8
PctChgYearAgo-1.11.40.30.72.93.02.91.70.6-0.3-0.6-0.6-1.5
OtherServices0.80.80.80.80.80.80.80.80.80.80.80.80.8
PctChgYearAgo8.05.42.62.42.20.9-0.1-0.4-0.40.00.60.91.5
FederalGovernment0.30.30.30.30.30.30.30.30.30.30.30.30.3
PctChgYearAgo1.62.53.7-4.8-3.8-3.4-0.83.03.03.12.72.22.0
State&LocalGovernment4.34.34.34.34.34.34.34.34.34.44.44.44.4
PctChgYearAgo2.41.92.71.41.31.21.11.00.80.80.90.91.1
Other Economic Indicators
Population(Ths)110.3110.4110.4110.5110.6110.6110.7110.7110.8110.9111.0111.1111.2
PctChgYearAgo0.90.60.40.20.20.20.20.20.20.20.30.30.4
LaborForce(Ths)36.937.137.137.137.137.137.037.037.037.037.036.936.9
PctChgYearAgo1.91.90.30.60.4-0.2-0.2-0.2-0.2-0.2-0.2-0.3-0.3
UnemploymentRate(%)5.45.65.86.06.26.26.36.36.36.36.36.26.1
TotalHousingStarts665.2622.0590.8545.2512.9492.8480.6473.8467.8463.6460.9458.4454.9
Single-Family574.8531.3505.7475.7448.8428.2412.4401.5393.6386.7380.9376.4370.7
Multifamily90.590.785.169.564.164.668.372.374.376.880.082.084.2
PROFILES
The Tallahassee MSA is comprised of Gadsden, Jefferson, Leon, and Wakulla Counties. It is located between Pensacola and Jacksonville on the Florida panhandle. Tallahassee is the capital city of Florida and houses Florida State University and Florida A&M University.
QUICK FACTS
• Metro population estimate of 393,414 as of 2023 (ACS 5-Year Estimate) (U.S. Census Bureau).
• Gadsden County population estimate of 43,642 as of 2023 (ACS 5-Year Estimate).
• Jefferson County population estimate of 14,713 as of 2023 (ACS 5-Year Estimate).
• L eon County population estimate of 296,913 as of 2023 (ACS 5-Year Estimate).
• Wakulla County population estimate of 34,608 as of 2023 (ACS 5-Year Estimate).
• Civilian labor force of 203,360 in December 2024 (FRED, U.S. Bureau of Labor Statistics).
• A n unemployment rate of 3.2% as of December 2024, not seasonally adjusted. This amounts to 6,600 unemployed people (FRED, U.S. Bureau of Labor Statistics).
OUTLOOK SUMMARIES
The Tallahassee Metropolitan Statistical Area (MSA) is expected to show mixed levels of growth in the studied indicators. Tallahassee’s Gross Metro Product will be $22,320.45 million. Personal income will grow by 4.9 percent annually, the 5th lowest in the state, placing the per capita income level at $51,600. Average annual wage growth of 4.1 percent should put the average annual wage at $70,700. Population growth will be 0.4 percent. Employment growth is expected to be 0.6 percent annually. The unemployment rate is estimated to average 4.2 percent.
The Other Services sector will see the highest annual growth rate in Tallahassee at 3.9 percent. The Financial sector will follow with a growth rate of 1.9 percent. The Information and Federal sectors will contract at rates of -2.2 and -1.3 percent respectively.
METRO NEWS SUMMARIES
Failed downtown development leaves Tallahassee with eyesore
• A decade after it was proposed, the Washington Square development remains an abandoned construction site in downtown Tallahassee, blocking sidewalks and right-ofway near the Leon County Courthouse and accumulating more than $400,000 in fines due to inactivity.
• City and county officials are working jointly to assess repairs and legal recourse, with commissioners emphasizing that public safety and restoring walkability—particularly along Calhoun Street—are urgent priorities.
• The project’s failure has prompted policy changes, including new requirements for surety bonds on future development deals to protect the public and ensure stalled projects can be resolved if the contractors default.
Source: WCTV, April 11, 2025
TLH Director: Airport ‘close’ to landing new airlines as Blueprint weighs $10M incentive
• Tallahassee International Airport may attract one or two new airline providers if the Blueprint Intergovernmental Agency Board approves a $670,000 annual incentive package, totaling $10 million over 15 years.
• The initiative responds to long-standing community concerns over high airfares, limited carriers, and reduced destinations, especially following JetBlue’s 2024 departure and broader industry challenges such as Silver Airways’ bankruptcy.
• A irport Director David Pollard and Mayor John Dailey support the incentives, viewing them as essential to making Tallahassee more competitive in the airline market. If approved, the program could significantly impact regional connectivity and economic development by encouraging greater air service investment.
Source: Tallahassee, May 7, 2025
Asian-centric Enson Market coming to Tallahassee
• Enson Market, a growing Asian supermarket chain, will open a new location at 1964 W. Tennessee St. in Tallahassee by summer 2026, offering fresh produce, seafood, butcher services, and everyday household products.
• The Ohio-based developer CRW Commercial cited Tallahassee’s expanding population and college community as key reasons for selecting the city, mirroring the chain’s success in similar markets like Orlando, Gainesville, and Plantation.
• The store’s arrival reflects increased consumer demand for international and culturally diverse retail options, and may signal broader trends in population growth, regional diversity, and retail investment in Tallahassee’s west side.
Source: Tallahassee, May 13, 2025
Circle K warns city leaders an eminent domain lawsuit could cost Tallahassee millions
• Circle K has warned the City of Tallahassee that it will pursue legal action if eminent domain is used to halt its proposed gas station in the Canopy subdivision, citing violations of property rights and threats to future private investment. Circle K has already invested $1.8 million in the site.
• The project, a 5,400-square-foot gas station near residential homes, has sparked backlash from Canopy residents, who argue the city should seek alternatives to eminent domain and question the transparency of recent procedural delays.
• City officials postponed a scheduled update on the project, citing the need for more time, while simultaneously advancing a proposed ordinance to temporarily ban new or expanded gas stations through the end of 2025 — a moratorium that would not affect Circle K due to its existing permit process.
Source: Tallahassee Democrat, May 21, 2025
Proposed Tallahassee Buc-ee’s development on track as early sign concerns appear resolved
• Buc-ee’s plans to build a 75,000-square-foot mega travel center on 73 acres near Capital Circle Northwest and I-10 in Tallahassee, including 120 fuel pumps, 795 parking spots, and 24 EV spaces.
• The project is advancing smoothly through the Leon County permitting process after early concerns about oversized signage were addressed within existing land development and planned unit development (PUD) guidelines.
• L ocal officials, including County Commissioner Christian Caban, have expressed strong support, citing expected economic benefits such as job creation and increased regional traffic. The project is exempt from the city’s proposed moratorium on new gas stations due to its location in unincorporated Leon County.
Source: Tallahassee Democrat, May 23, 2025
Tallahassee MSA
Long Term Outlook for Tallahassee, FL June 2025 Forecast
202020212022202320242025202620272028
Personal Income (Billions $)
TotalPersonalIncome18.320.020.221.723.024.225.326.627.9
PctChgYearAgo7.19.41.07.46.05.14.45.15.0
WagesandSalaries9.210.311.111.912.913.614.214.815.4
NonwageIncome9.19.89.29.810.210.611.111.812.4
RealPersonalIncome(12$)19.219.418.518.919.619.920.320.921.6
PctChgYearAgo8.40.9-4.72.53.31.91.83.13.1
PerCapitaIncome(Ths)47.551.651.655.057.960.863.266.169.1
RealPerCapitaIncome(12$)49.849.947.147.949.250.050.752.153.4
AverageAnnualWage(Ths)51.855.857.960.863.866.569.372.274.9
PctChgYearAgo7.27.83.85.05.04.24.34.13.8
Establishment Employment (Place of Work, Thousands, SA)
TotalEmployment177.4183.1190.6195.7201.0204.4204.0204.3205.5
PctChgYearAgo-3.83.24.12.62.71.7-0.20.20.6
Manufacturing3.43.84.04.14.24.34.24.24.1
PctChgYearAgo1.510.86.82.72.31.2-1.5-1.6-1.1
Nonmanufacturing174.0179.4186.6191.5196.8200.1199.8200.2201.4
PctChgYearAgo-3.93.14.02.62.71.7-0.20.20.6
Construction&Mining8.48.38.99.610.210.510.510.510.4
PctChgYearAgo-4.4-0.87.38.15.83.40.1-0.7-0.2 Trade,Trans,&Utilities23.624.725.426.027.227.827.527.527.1
PctChgYearAgo-4.04.73.02.34.72.3-1.2-0.2-1.5 WholesaleTrade3.73.84.14.34.34.44.44.44.4 RetailTrade17.618.418.818.919.219.719.419.419.1 Trans,Wrhsng,&Util2.22.52.52.83.73.83.83.73.6 Information3.23.64.24.24.14.04.03.93.8
PctChgYearAgo1.612.817.10.2-1.6-3.40.6-3.4-2.4 FinancialActivities7.68.08.59.09.49.79.910.010.1 PctChgYearAgo-1.85.05.96.34.43.51.71.30.9 Prof&BusinessServices23.025.327.127.228.328.427.627.127.7 PctChgYearAgo3.49.77.40.43.90.2-2.6-1.82.1 Educ&HealthServices24.324.625.626.927.327.827.928.128.4
PctChgYearAgo-1.21.34.45.01.22.00.20.71.1
Leisure&Hospitality16.818.820.420.720.621.321.521.821.9
PctChgYearAgo-20.012.08.51.9-0.83.61.11.30.5 OtherServices6.56.16.56.46.66.97.17.37.6
PctChgYearAgo-7.9-6.26.0-0.42.05.02.63.54.3
FederalGovernment2.22.12.22.32.32.22.22.22.2
PctChgYearAgo3.1-2.23.93.40.9-2.4-4.30.70.7
State&LocalGovernment58.658.057.859.160.861.461.561.862.2
PctChgYearAgo-2.2-1.0-0.32.22.90.90.30.50.6
Other Economic Indicators
Population(Ths)385.8388.5392.3395.5397.7398.4399.9401.6403.7
PctChgYearAgo0.70.71.00.80.60.20.40.40.5
LaborForce(Ths)189.7194.7200.2204.6208.2213.3213.6213.9214.2
PercentChange,YearAgo-2.32.62.82.21.72.50.10.10.1
UnemploymentRate(%)6.14.43.13.13.54.04.44.44.1
TotalHousingStarts2369.22625.82690.12575.32210.82216.32213.72273.82338.4
Single-Family1286.81541.31395.71438.81401.71309.21165.41101.41061.1
Multifamily1082.41084.51294.41136.5809.0907.11048.31172.41277.3
Short Term Outlook for Tallahassee, FL
June 2025 Forecast
Personal Income (Billions $)
2025:12025:22025:32025:42026:12026:22026:32026:42027:12027:22027:32027:42028:1
TotalPersonalIncome23.924.124.324.524.925.225.425.726.126.426.727.027.4
PctChgYearAgo4.85.75.44.74.24.24.54.74.95.05.25.25.0
WagesandSalaries13.413.613.713.814.014.114.214.414.614.714.915.015.2
NonwageIncome10.510.610.610.710.811.011.211.311.511.711.912.012.2
RealPersonalIncome(12$)19.919.919.920.020.120.220.320.420.720.821.021.121.3
PctChgYearAgo2.52.31.81.00.81.82.12.42.83.03.33.43.2
PerCapitaIncome(Ths)59.960.661.061.562.363.063.564.165.065.866.567.268.0
RealPerCapitaIncome(12$)50.149.950.050.150.350.650.851.051.551.952.352.552.9
AverageAnnualWage(Ths)65.566.166.767.668.469.069.670.371.171.972.673.273.9
PctChgYearAgo3.64.34.34.54.54.44.34.13.94.14.34.14.0
Establishment Employment (Place of Work, Thousands, SA)
TotalEmployment203.8204.6204.7204.3204.2203.9204.0203.9204.0204.2204.4204.6204.8
PctChgYearAgo2.02.51.70.50.2-0.4-0.4-0.2-0.10.20.20.30.4
Manufacturing4.34.34.34.34.24.24.24.24.24.24.14.14.1
PctChgYearAgo4.12.1-0.2-1.0-2.1-1.5-1.0-1.5-1.2-2.0-1.9-1.5-1.2
Nonmanufacturing199.5200.3200.4200.1199.9199.6199.7199.8199.8200.0200.3200.5200.7
PctChgYearAgo1.92.51.70.60.2-0.3-0.3-0.20.00.20.30.40.4 Construction&Mining10.510.510.610.610.610.510.510.510.510.510.510.410.4 PctChgYearAgo5.74.72.21.10.70.1-0.1-0.4-0.5-0.6-0.8-0.8-0.7 Trade,Trans,&Utilities27.727.927.927.827.627.527.527.527.527.527.527.427.1
PctChgYearAgo1.92.12.52.4-0.3-1.5-1.5-1.3-0.50.00.1-0.2-1.3 WholesaleTrade4.44.44.44.44.44.34.44.44.44.44.44.44.4 RetailTrade19.519.719.719.619.519.419.419.419.419.419.419.419.1 Trans,Wrhsng,&Util3.83.83.83.83.83.83.73.73.73.73.73.63.6 Information4.04.04.03.94.04.04.04.03.93.93.83.83.8
PctChgYearAgo-3.5-3.7-4.6-1.70.31.30.50.3-2.2-3.4-4.0-4.0-3.6 FinancialActivities9.79.79.79.89.89.99.99.910.010.010.010.010.1
PctChgYearAgo6.54.61.81.11.71.31.81.81.51.51.21.01.2 Prof&BusinessServices28.428.528.528.127.927.727.627.427.227.127.127.227.4 PctChgYearAgo0.20.81.3-1.4-1.6-2.9-3.2-2.6-2.8-2.0-1.6-0.81.0 Educ&HealthServices27.727.827.927.927.927.827.927.928.028.028.128.128.3
PctChgYearAgo2.12.52.31.00.60.10.00.20.40.80.80.71.0 Leisure&Hospitality21.321.321.321.421.521.521.621.621.721.821.922.021.8
PctChgYearAgo3.94.84.01.50.90.91.31.21.21.31.31.50.3 OtherServices6.86.96.97.07.07.07.17.17.27.37.37.47.5
PctChgYearAgo3.24.36.85.83.32.52.32.32.63.43.94.14.4 FederalGovernment2.32.32.22.22.22.12.22.22.22.22.22.22.2
PctChgYearAgo0.50.0-3.3-6.9-6.7-6.5-3.90.30.40.70.70.70.8
State&LocalGovernment61.261.461.461.461.561.561.661.661.761.861.961.962.0
PctChgYearAgo1.02.20.5-0.20.50.20.20.30.40.50.50.50.5
Other Economic Indicators
Population(Ths)398.1398.3398.5398.7399.2399.7400.1400.6401.0401.4401.8402.3402.9
PctChgYearAgo0.30.20.10.20.30.30.40.50.40.40.40.40.5
LaborForce(Ths)212.5213.6213.7213.6213.6213.5213.6213.7213.8213.9214.0214.0214.1
PctChgYearAgo2.53.12.51.80.50.00.00.10.10.20.20.10.1
UnemploymentRate(%)3.83.94.04.24.34.44.44.44.44.44.44.34.2
TotalHousingStarts2242.92254.92232.12135.22173.92184.92222.12274.02265.42273.02271.92284.82302.2
Single-Family1377.81339.41292.81226.61193.31178.01155.21135.01110.61106.01097.71091.21076.2
Multifamily865.1915.4939.3908.6980.61006.81066.91139.01154.81167.11174.21193.61226.0
PROFILES
The Tampa–St. Petersburg–Clearwater MSA is comprised of Hernando, Hillsborough, Pasco, and Pinellas counties. Located centrally on the west coast of Florida, this region includes Tarpon Springs, Sponge Docks, Ybor City, Bush Gardens, the University of South Florida, and the University of Tampa. The Tampa Bay Buccaneers and the Tampa Bay Rays call this region home.
QUICK FACTS
• Metro population estimate of 3,342,963 as of 2023 (ACS 5-Year Estimate) (U.S. Census Bureau).
• Hernando County population estimate of 212,807 as of 2023 (ACS 5-Year Estimate).
• H illsborough County population estimate of 1,535,564 as of 2023 (ACS 5-Year Estimate).
• Pasco County population estimate of 632,996 as of 2023 (ACS 5-Year Estimate).
• Pinellas County population estimate of 961,596 as of 2023 (ACS 5-Year Estimate).
• Civilian labor force of 1,678,128 in December 2024 (FRED, U.S. Bureau of Labor Statistics).
• A n unemployment rate of 3.2% as of December 2024, not seasonally adjusted. This amounts to 54,186 unemployed people (FRED, U.S. Bureau of Labor Statistics).
OUTLOOK SUMMARIES
The Tampa—St. Petersburg—Clearwater Metropolitan Statistical Area (MSA) is expected to show average levels of growth in the studied economic indicators compared to other MSAs. The Tampa MSA will contribute the second highest Gross Metro Product in the state with $214,235.18 million. Personal income growth of 5.2 percent will place the per capita income level at $53,500. Average annual wage growth of 4.3 percent will result in an average annual wage of $83,000 (5th highest). Population growth will be 0.8 percent. Employment growth is expected to grow at
an average of 0.8 percent annually. The MSA’s unemployment rate should average 4.1 percent. The fastest growing sector in the Tampa area will be the Other Services sector with an average annual growth rate of 2.4 percent. This is followed by the Construction and Mining sector with an average annual growth rate of 2.2 percent. The Federal and Manufacturing sectors will experience a contraction of -1.1 percent and -1.4 percent respectively.
METRO NEWS SUMMARIES
City National Bank of Florida plots aggressive Tampa Bay expansion
• M iami-based City National Bank of Florida is expanding into the Tampa Bay region, aiming to hire 200 employees companywide in 18 months, with a large share focused on Tampa, Saint Petersburg, and surrounding Gulf Coast cities.
• The bank recruited a team of local bankers — including several from Amerant Bank — to lead the effort, emphasizing local expertise over a “cookie-cutter” approach.
• CNB, Florida’s fifth-largest bank with $17.6B in deposits, plans to open new corporate office space and branches to support its relationshipdriven growth model in the competitive Tampa market.
Source: South Florida Business Journal, March 11, 2025
Geico will open Tampa campus, adding 1,000 jobs
• Geico will open a new 190,000-square-foot campus at Corporate Oaks Business Park near Tampa International Airport in August 2025.
• The expansion is expected to bring over 1,000 jobs, including sales, service, claims, and management positions.
• Geico cited Tampa’s strong talent pool and business environment as key reasons for the move.
Source: Tampa Bay Times, March 27, 2025
Tampa airport sees significant passenger drop amid national economic slowdown
• Tampa International Airport (TPA) served 1.1 million fewer passengers than expected in early FY2025, a decline driven by economic uncertainty, Hurricane Milton recovery, and reduced government travel due to federal budget cuts.
• Despite the downturn, the TPA continues expanding international service and remains Florida’s fastest-growing large hub by outbound capacity, buoyed by a strong local population with disposable income.
• Tourism remains critical to the region’s economy, but proposed legislation threatening tourism funding and a 6.2% drop in load factor highlight growing concerns about long- term travel demand.
Source: Tampa Bay Business Journal, May 1, 2025
Tampa property insurer plots big return to Florida in 2025 after lengthy exodus
• Tampa-based Heritage Insurance plans to restore 100% new business capacity in Florida by year-end, following a two-year overhaul to improve profitability and reduce risk exposure.
• The company posted $30.5 million in net income last quarter — double from the previous year — marking its third consecutive profitable quarter despite catastrophe losses.
• Heritage has grown its commercial insurance portfolio by 80% and launched a specialty lines business to diversify and stabilize long-term operations amid a strategic return to controlled growth.
Source: Tampa Bay Business Journal, May 7, 2025
3PL to open $20 million facility in Tampa
• Jacksonville-based NXTPoint Logistics will open a 193,000-square-foot warehouse at 2001 Suddath Park St. in Tampa, creating up to 62 new jobs.
• The $20 million facility, built by parent company Suddath Cos., will support storage, distribution, and fulfillment operations.
• Company leaders cited Tampa’s workforce, infrastructure, and pro-business climate as key factors in choosing Hillsborough County for expansion.
Source: Tampa Bay Business Journal, May 8, 2025
Long Term Outlook for Tampa-St. Petersburg-Clearwater, FL
June 2025 Forecast
Personal Income (Billions $)
202020212022202320242025202620272028
TotalPersonalIncome170.9187.8197.4213.2225.3235.5247.5261.8275.6
PctChgYearAgo8.59.95.18.05.74.55.15.85.3
WagesandSalaries83.092.7102.6110.3117.0122.4128.8135.6142.6
NonwageIncome87.995.194.8102.9108.3113.1118.7126.2133.0
RealPersonalIncome(12$)161.2174.4170.1171.1176.2178.5182.9189.8196.4
PctChgYearAgo2.28.2-2.40.63.01.32.53.83.5
PerCapitaIncome(Ths)53.558.059.563.165.768.271.274.778.1
RealPerCapitaIncome(12$)50.553.851.350.651.451.752.654.255.6
AverageAnnualWage(Ths)61.265.368.571.574.977.481.084.988.6
PctChgYearAgo7.76.75.04.44.83.34.74.84.3
Establishment Employment (Place of Work, Thousands, SA)
TotalEmployment1345.31406.81483.91530.01548.41568.71576.51583.71596.8
PctChgYearAgo-3.04.65.53.11.21.30.50.50.8
Manufacturing66.969.073.175.075.575.473.972.571.3
PctChgYearAgo-3.03.16.02.60.8-0.2-1.9-2.0-1.5 Nonmanufacturing1278.51337.81410.81455.01472.91493.41502.61511.31525.5
PctChgYearAgo-3.04.65.53.11.21.40.60.60.9 Construction&Mining83.286.489.892.694.698.9100.7101.7103.3
PctChgYearAgo1.53.84.03.12.24.51.81.01.6 Trade,Trans,&Utilities249.0260.7274.7279.4281.5285.0285.6288.2286.2 PctChgYearAgo-1.24.75.41.70.81.20.20.9-0.7 WholesaleTrade54.556.659.761.462.863.564.365.265.4 RetailTrade153.7159.9164.7166.1166.9168.5168.0169.7168.0 Trans,Wrhsng,&Util40.844.250.351.951.953.053.353.352.8 Information24.626.529.029.528.829.129.829.028.3 PctChgYearAgo-4.57.79.31.9-2.51.02.5-2.5-2.5 FinancialActivities125.7131.5139.8143.9144.9146.7149.4151.3152.6 PctChgYearAgo1.84.76.32.90.71.21.81.30.9 Prof&BusinessServices247.1265.0287.3290.7287.6288.8282.9277.2282.6 PctChgYearAgo0.47.38.41.2-1.10.4-2.0-2.02.0 Educ&HealthServices212.4216.9225.2240.2249.5255.4260.3264.3268.8
PctChgYearAgo-2.22.13.86.63.92.41.91.61.7 Leisure&Hospitality134.0148.5160.9169.7171.4173.7177.6180.3181.1
PctChgYearAgo-17.610.88.35.51.01.32.21.50.5 OtherServices47.849.652.152.453.754.455.256.959.0
PctChgYearAgo-7.13.95.00.52.41.41.53.13.7 FederalGovernment28.428.729.431.032.632.030.831.031.2
PctChgYearAgo6.31.12.45.55.2-1.8-3.80.60.6 State&LocalGovernment126.4124.0122.7125.6128.2129.3130.3131.4132.3
PctChgYearAgo-3.2-1.9-1.12.42.10.90.80.80.7
Other Economic Indicators
Population(Ths)3192.63239.53314.83379.93428.23454.13476.93504.03530.9
PctChgYearAgo1.31.52.32.01.40.80.70.80.8 LaborForce(Ths)1539.41579.31642.51692.01702.21730.31736.61746.81756.8 PercentChange,YearAgo-0.12.64.03.00.61.70.40.60.6 UnemploymentRate(%)7.54.32.93.03.53.94.24.34.0 TotalHousingStarts20614.223095.824227.624241.320230.218904.221120.022233.922562.0 Single-Family15556.618679.715570.114946.713577.713428.314760.614840.614468.4 Multifamily5057.64416.08657.59294.66652.55476.06359.37393.38093.6
Short Term Outlook for Tampa-St. Petersburg-Clearwater, FL
June 2025 Forecast
Personal Income (Billions $)
2025:12025:22025:32025:42026:12026:22026:32026:42027:12027:22027:32027:42028:1
TotalPersonalIncome231.8234.7236.6238.8242.3245.9249.2252.6256.6260.1263.5266.8270.4
PctChgYearAgo1.71.41.11.01.12.42.93.43.73.73.93.83.6
PerCapitaIncome(Ths)67.268.068.569.069.970.871.672.573.474.375.175.976.8
RealPerCapitaIncome(12$)51.851.651.651.752.152.452.853.153.654.054.454.755.1
AverageAnnualWage(Ths)76.477.077.678.679.680.681.582.483.484.585.486.387.3
PctChgYearAgo2.73.73.33.54.34.64.94.94.84.84.84.74.6
Establishment Employment (Place of Work, Thousands, SA)
TotalEmployment1560.51568.21573.11573.11574.01575.21577.71579.21580.71582.61584.71586.91590.1
PctChgYearAgo0.91.31.51.60.90.40.30.40.40.50.40.50.6
Manufacturing75.875.775.174.874.174.373.973.473.072.672.272.071.8
PctChgYearAgo0.20.1-0.2-1.0-2.2-1.9-1.6-2.0-1.6-2.3-2.3-1.9-1.6
Nonmanufacturing1484.71492.51498.01498.21499.91500.91503.81505.81507.71510.01512.51514.91518.2
PctChgYearAgo1.01.31.61.71.00.60.40.50.50.60.60.60.7
Construction&Mining97.798.699.4100.0100.3100.5100.9101.0101.3101.5101.8102.1102.5
PctChgYearAgo4.84.34.24.72.72.01.41.11.00.90.91.11.2
Trade,Trans,&Utilities284.2285.4285.5285.0284.7285.0286.0286.7287.8288.3288.6288.0286.2
PctChgYearAgo1.01.31.61.10.2-0.20.20.61.11.20.90.5-0.5 WholesaleTrade63.163.563.863.863.964.164.464.765.165.365.365.265.4 RetailTrade168.4169.0168.5168.0167.5167.7168.3168.5169.2169.6170.1169.7167.8 Trans,Wrhsng,&Util52.753.053.253.353.353.253.353.553.553.453.253.053.0 Information29.029.029.229.229.729.929.929.729.529.228.928.528.4
PctChgYearAgo0.21.21.21.52.63.42.31.6-0.7-2.4-3.3-3.8-3.6 FinancialActivities146.0146.2146.8147.8148.7149.0149.7150.1150.8151.2151.6151.7152.6
PctChgYearAgo0.90.91.02.01.91.91.91.61.41.51.31.11.2 Prof&BusinessServices286.8289.7290.9287.8285.8283.5282.1280.3277.8277.1276.6277.1279.7 PctChgYearAgo-0.30.31.10.5-0.3-2.1-3.0-2.6-2.8-2.3-1.9-1.10.7 Educ&HealthServices252.9254.6256.4257.8258.8259.8260.7261.7263.0264.0264.9265.5267.5
PctChgYearAgo2.22.72.62.12.32.01.71.51.61.61.61.41.7
Leisure&Hospitality172.6173.0173.8175.5176.4177.0178.0179.0179.3179.7180.5181.4179.9
PctChgYearAgo-0.80.42.13.82.22.42.42.01.71.51.41.40.3
OtherServices54.254.354.454.654.855.055.355.756.256.757.257.658.4
PctChgYearAgo1.30.91.12.01.21.41.52.02.53.03.43.53.8
FederalGovernment32.832.731.930.730.830.830.830.930.931.031.031.131.1
PctChgYearAgo1.60.5-2.7-6.4-6.2-5.8-3.50.50.60.70.70.60.6
State&LocalGovernment128.7129.2129.6129.8129.9130.2130.5130.8131.0131.3131.5131.7131.9
PctChgYearAgo1.10.80.01.61.00.80.70.70.80.80.80.70.7
Other Economic Indicators
Population(Ths)3447.33451.63456.13461.33467.23473.53479.93486.83494.03500.93507.33513.83520.5
PctChgYearAgo1.00.80.60.60.60.60.70.70.80.80.80.80.8
LaborForce(Ths)1722.41731.31734.11733.61733.71734.91737.41740.21742.91745.61748.11750.51753.0
PctChgYearAgo1.31.71.71.90.70.20.20.40.50.60.60.60.6
UnemploymentRate(%)3.73.83.94.14.24.24.34.34.34.34.34.24.1
TotalHousingStarts18792.618173.119165.619485.620235.020867.121514.121863.622114.222256.422263.222301.722367.5 Single-Family12683.013114.713759.114156.314460.714741.114882.314958.414958.514891.314798.814713.714588.6
Multifamily6109.65058.55406.55329.35774.26126.06631.86905.27155.77365.17464.47588.07778.8
PROFILES
The Villages, located in central Florida, approximately an hour north of Orlando. It is the largest retirement community in the world, comprised mostly of Sumter County, but also includes parts of Lake and Marion counties.
QUICK FACTS
• Metro population estimate of 144,970 as of 2023 (ACS 5-Year Estimate) (U.S. Census Bureau).
• Sumter County population estimate of 144,970 as of 2023 (ACS 5-Year Estimate).
• Civilian labor force of 38,936 in December 2024 (FRED, U.S. Bureau of Labor Statistics).
• A n unemployment rate of 4.7% as of December 2024, not seasonally adjusted. This amounts to 1,706 unemployed people (FRED, U.S. Bureau of Labor Statistics).
OUTLOOK SUMMARIES
The Villages Metropolitan Statistical Area (MSA) is expected to see strong levels of growth in the studied economic indicators.
The Gross Metro Product will be $6,203.63 million (3rd lowest). Personal income growth of 6.0 percent (5th highest) will contribute to a per capita income level of $67,100, ranking 4th highest in the state. Average annual wage growth of 4.5 percent (2nd highest) will result in an average annual wage of $72,000. The Villages will experience a population growth rate averaging 1.5 percent annually (4th highest).
Employment growth is expected to average 1.1 percent annually (5th highest). The unemployment rate is projected to be the highest in the state at an average of 6.5 percent.
The Other Services sector will lead The Villages at an average annual growth rate of 4.8 percent. The Education and Health Services sector will follow with an average annual growth rate of 2.6 percent.
The Financial sector will experience the largest contraction in the MSA at -1.3 percent annually, followed by Federal at a -0.8 percent contraction.
METRO NEWS SUMMARIES
Explosive growth of The Villages prompts Leesburg to consider redistricting
• R apid population growth from The Villages’ ongoing expansion—expected to add 14,000 new homes—has prompted Leesburg city officials to consider redistricting commission seats to ensure balanced political representation across districts.
• A proposed redistricting plan, using census and building permit data, would place the newly annexed and undeveloped parts of The Villages into District 3 to help equalize district populations and maintain fair representation ahead of the 2026 city elections.
• City officials emphasized maintaining compact, contiguous districts that reflect communities of interest, avoid gerrymandering, and protect minority voting strength, with final approval of the new district map expected later this year.
Source: Daily Commercial, March 11, 2025
Modular homebuilder Onx buys land near The Villages for $15.2M
• Onx Homes, a major modular homebuilder, purchased permitted land in Lady Lake near The Villages for $15.2 million, aiming to develop 232 single-family homes with hurricane-resistant designs and customizable layouts starting in the high $300,000s.
• The homes, constructed primarily off-site in Florida-based factories, are built to withstand Category 5 hurricanes, offering durability and efficiency just two miles east of The Villages— America’s top-selling retirement community.
• The development raises important regional housing considerations, as rising home prices near The Villages have made workforce housing
increasingly scarce, prompting concern from real estate experts about local affordability and sustainability.
Source: Orlando Business Journal, March 13, 2025
Booming Florida Locale Named ‘FastestGrowing City’ In The Entire State
• The Villages has been named the fastestgrowing city in Florida for 2025, based on moveBuddha data tracking planned relocations, further cementing its reputation as a premier retirement destination with strong appeal for new residents nationwide.
• The ranking reflects a combination of factors including affordability, access to healthcare, safety, and an active community lifestyle, all of which continue to attract retirees and others seeking a high quality of life in Central Florida.
• Th is surge in interest comes amid broader housing developments near The Villages and highlights the need for continued infrastructure and workforce housing to support the area’s rapid expansion.
Source: iHeart, April 1, 2025
Villagers concerned about surge in traffic due to new Costco
• Residents of The Villages, particularly in the Polo Ridge neighborhood, are voicing growing concerns over increased traffic and safety risks tied to ongoing commercial development, including a new Costco currently under construction.
• Woodridge Drive has become a high-traffic shortcut plagued by speeding and frequent accidents as retail growth accelerates in the area.
• W hile the Sumter County Sheriff’s Office has increased patrols and ticketing, locals fear traffic will worsen once the Costco opens, urging community leaders to consider further traffic control measures to protect neighborhood safety.
Source: Villages-News, April 11, 2025
Construction barriers now in place at Spanish Springs Town Square
• Construction barriers are now in place at Spanish Springs Town Square in The Villages, marking the start of a $1.2 million renovation project aimed at modernizing the community’s original town square with upgraded pedestrian spaces, seating areas, landscaping, and lighting.
• Funded by the Village Center Community Development District and private developers, the improvements also include planned upgrades to the nearby La Reina Building and former Gator’s Dockside restaurant space.
• W hile nightly entertainment at the Gazebo will continue, many have been canceled or relocated to Brownwood during the renovation period.
Source: Villages-News, April 30, 2025
Land purchases near The Villages signal incoming commercial development in Lake County
• Recent land acquisitions by Trinity Development Partners and The Benchmark Group near The Villages point to a wave of incoming commercial and mixed-use development in Lake County, driven by population growth and housing demand in the area.
• Trinity plans to build a senior-focused multifamily community with up to 500 units, along with retail, a medical office complex, and a family-oriented hotel, while Benchmark is expanding its footprint with additional commercial land purchases likely aimed at addressing the local apartment shortage.
• These investments, coupled with previously approved projects like a Walmart Neighborhood Market and other large-scale residential developments, reflect Lady Lake’s transformation into a major development hub adjacent to The Villages.
Source: Orlando Business Journal, May 6, 2025
The Villages MSA Industry Location Quotients
Long Term Outlook for The Villages, FL
202020212022202320242025202620272028
Personal Income (Billions $)
TotalPersonalIncome7.69.09.610.811.612.313.013.814.6
PctChgYearAgo8.619.16.012.87.45.75.96.36.0
WagesandSalaries1.61.92.22.52.72.83.03.23.4
NonwageIncome5.97.17.38.38.99.410.010.611.3
RealPersonalIncome(12$)7.98.69.09.510.010.210.511.011.4
PctChgYearAgo10.09.74.85.14.72.53.24.34.1
PerCapitaIncome(Ths)57.866.265.770.974.978.682.185.688.9
RealPerCapitaIncome(12$)60.063.362.162.464.365.366.668.169.5
AverageAnnualWage(Ths)50.754.758.461.964.767.070.273.977.2
PctChgYearAgo6.87.86.86.04.53.64.85.24.5
Establishment Employment (Place of Work, Thousands, SA)
TotalEmployment32.135.238.040.141.342.242.342.643.2
PctChgYearAgo0.89.87.95.62.92.10.30.91.2
Manufacturing1.21.21.51.61.41.41.41.41.4
PctChgYearAgo0.81.121.06.8-11.91.8-1.70.21.0
Nonmanufacturing30.834.036.538.539.940.740.941.241.7
PctChgYearAgo0.810.17.45.63.52.10.40.91.2
Construction&Mining3.53.83.94.14.34.44.44.44.4
PctChgYearAgo2.97.33.93.76.31.20.00.01.0
Trade,Trans,&Utilities6.56.76.87.27.67.77.77.77.6
PctChgYearAgo1.52.51.06.26.01.7-0.60.3-1.3 WholesaleTrade0.90.91.01.01.11.11.11.11.1 RetailTrade4.54.64.75.05.35.35.25.35.2
Trans,Wrhsng,&Util1.11.11.11.21.31.31.31.31.3 Information0.20.20.40.30.30.30.30.30.3
PctChgYearAgo-13.731.463.8-10.5-3.5-2.01.9-2.0-0.4
FinancialActivities1.61.92.02.32.72.72.72.62.6 PctChgYearAgo10.313.48.511.718.90.1-0.1-2.4-2.8 Prof&BusinessServices2.52.93.43.83.84.03.93.94.0
PctChgYearAgo7.619.417.511.6-0.84.6-2.4-0.83.5
Educ&HealthServices6.87.07.78.18.38.68.78.99.2
PctChgYearAgo5.62.710.04.93.03.31.82.32.8
Leisure&Hospitality4.05.76.26.15.55.75.86.06.1
PctChgYearAgo-13.043.29.8-1.1-10.43.13.02.51.4
OtherServices0.50.60.80.90.70.80.80.80.9
PctChgYearAgo-7.113.036.53.8-17.46.71.14.76.8
FederalGovernment1.71.71.71.61.71.81.71.61.6
PctChgYearAgo5.61.1-3.3-0.52.34.1-4.4-1.5-1.4
State&LocalGovernment3.53.53.64.14.94.84.94.95.1
PctChgYearAgo-2.0-0.71.815.219.6-1.60.51.72.7
Other Economic Indicators
Population(Ths)131.0136.4145.7152.2154.8156.1158.1161.4164.6
PctChgYearAgo3.24.16.84.51.70.81.32.02.0
LaborForce(Ths)27.829.831.833.434.335.035.435.735.9
PercentChange,YearAgo1.07.46.75.02.52.31.00.80.6
UnemploymentRate(%)9.46.65.05.25.96.66.96.65.9
TotalHousingStarts3528.44406.14378.63616.13731.23170.42730.92628.82568.0
Single-Family2873.83843.23717.23362.33483.53014.62647.42546.22474.4
Multifamily654.6563.0661.4253.8247.6155.883.482.693.6
Short Term Outlook for The Villages, FL
June 2025 Forecast
Personal Income (Billions $)
2025:12025:22025:32025:42026:12026:22026:32026:42027:12027:22027:32027:42028:1
TotalPersonalIncome12.112.212.312.412.612.913.113.313.513.713.914.114.3
PctChgYearAgo5.86.25.75.24.95.56.46.86.86.36.16.26.0
WagesandSalaries2.82.82.92.92.93.03.03.03.13.13.23.23.3
NonwageIncome9.39.49.59.59.79.910.110.210.410.610.710.911.0
RealPersonalIncome(12$)10.210.210.210.210.310.510.610.710.810.911.011.111.3
PctChgYearAgo3.42.82.11.51.43.04.04.44.74.24.24.34.1
PerCapitaIncome(Ths)77.578.578.979.480.581.882.883.484.385.286.086.787.6
RealPerCapitaIncome(12$)65.565.365.365.365.866.566.967.067.567.968.368.568.9
AverageAnnualWage(Ths)66.266.667.268.069.069.870.671.572.573.574.475.276.0
PctChgYearAgo2.83.73.84.04.34.85.05.15.05.35.35.14.9
Establishment Employment (Place of Work, Thousands, SA)
TotalEmployment41.842.342.342.342.342.242.342.442.542.642.742.842.9
PctChgYearAgo2.52.91.71.21.0-0.1-0.10.30.60.81.01.01.0
Manufacturing1.41.41.41.41.41.41.41.41.41.41.41.41.4
PctChgYearAgo1.84.10.31.1-2.4-1.8-1.7-1.1-0.1-0.30.50.81.1
Nonmanufacturing40.440.840.940.840.840.840.941.041.141.241.341.441.5
PctChgYearAgo2.52.91.81.21.10.00.00.40.60.91.11.01.0
Construction&Mining4.34.44.44.44.44.44.44.44.44.44.44.44.4
PctChgYearAgo2.83.20.1-1.00.9-0.1-0.4-0.6-0.3-0.10.10.40.6 Trade,Trans,&Utilities7.77.87.87.77.77.77.77.77.77.77.77.77.6
PctChgYearAgo3.53.11.5-1.1-0.1-1.4-0.8-0.10.50.50.3-0.1-1.2 WholesaleTrade1.11.11.11.11.11.11.11.11.11.11.11.11.1 RetailTrade5.35.45.35.35.25.25.25.35.35.35.35.35.2 Trans,Wrhsng,&Util1.31.31.31.31.31.31.31.31.31.31.31.31.3 Information0.30.30.30.30.30.30.30.30.30.30.30.30.3
PctChgYearAgo-9.8-3.73.23.44.02.90.50.2-1.5-2.0-2.3-2.2-1.7
FinancialActivities2.72.72.72.72.72.72.72.72.72.62.62.62.6
PctChgYearAgo2.92.1-0.2-4.01.40.1-0.6-1.3-2.0-2.3-2.5-2.7-2.5
Prof&BusinessServices4.04.04.04.03.93.93.93.93.83.83.93.93.9
PctChgYearAgo5.94.84.23.4-0.7-2.8-3.6-2.5-2.2-1.2-0.30.32.1 Educ&HealthServices8.58.68.68.78.78.78.78.88.98.99.09.09.1 PctChgYearAgo2.93.73.23.42.61.61.51.52.02.32.62.52.7 Leisure&Hospitality5.65.75.75.75.85.85.95.95.96.06.06.16.0
PctChgYearAgo1.14.14.03.03.22.63.23.12.72.72.42.21.1 OtherServices0.80.80.80.80.80.80.80.80.80.80.80.80.9
PctChgYearAgo8.25.95.17.52.81.3-0.10.72.13.86.46.56.9
FederalGovernment1.81.81.81.71.71.71.71.71.71.61.61.61.6
PctChgYearAgo6.17.53.5-0.7-4.1-6.2-5.2-2.1-1.8-1.5-1.2-1.5-1.5
State&LocalGovernment4.84.84.84.84.84.84.94.94.94.95.05.05.0
PctChgYearAgo-2.2-3.2-3.22.30.60.30.50.70.91.42.02.42.7
Other Economic Indicators
Population(Ths)155.6155.9156.2156.6157.1157.7158.4159.3160.2160.9161.8162.6163.4
PctChgYearAgo1.00.80.70.70.91.21.51.82.02.02.12.02.0
LaborForce(Ths)34.835.035.135.235.335.435.435.535.635.735.735.835.8
PctChgYearAgo2.62.72.01.81.51.00.90.80.80.80.80.70.7
UnemploymentRate(%)6.46.56.66.86.96.96.96.86.76.76.56.46.2
TotalHousingStarts3267.53222.93164.13027.32870.62724.62666.82661.52661.12634.02614.92605.32585.4 Single-Family3148.93053.12982.52873.92755.02639.42603.22592.12583.42553.12531.02517.22495.2
Multifamily118.6169.7181.7153.4115.685.263.669.477.880.883.988.090.2
PROFILES
The West Palm Beach-Boca Raton-Boyton Beach MSA stretches from the state’s Atlantic coast into the rural center and includes the northern edge of the everglades national park. It is known for being the “Golf Capital of Florida” and its sandy beaches.
QUICK FACTS
• Metro population estimate of 1,533,801 as of 2023 (ACS 5-Year Estimate) (U.S. Census Bureau).
• Palm Beach County population estimate of 1,533,801 as of 2023 (ACS 5-Year Estimate).
• Civilian labor force of 773,826 in December 2024 (FRED, U.S. Bureau of Labor Statistics).
• A n unemployment rate of 3.0% as of December 2024, not seasonally adjusted. This amounts to 23,281 unemployed people (FRED, U.S. Bureau of Labor Statistics).
OUTLOOK SUMMARIES
The West Palm Beach—Boca Raton area is expected to show relatively slow levels of growth in the economic indicators. The area will have a Gross Metro Product of $114,615.63 million. Personal income is expected to grow an average of 4.8 percent annually, the lowest amongst MSAs studied. The average real per capita income level will be $89,100 (3rd highest). Average annual wage growth will be 4.1 percent, and the average annual wage level is expected to be $93,600, the highest amongst MSAs studied. West Palm Beach is expected to average a 0.5 percent population growth each year.
Employment is expected to grow at a rate of 0.5 percent each year (4th lowest), while unemployment is expected to be relatively moderate at an average rate of 4.2 percent.
West Palm Beach’s fastest growing sector is expected to be Education and Health Services followed by the Other Services sector, which will experience 2.0 and 1.7 percent average annual growth respectively. The Manufacturing sector will contract by -1.4 percent, while the Professional and Business Services sector will contract by -1.0 percent.
METRO NEWS SUMMARIES
Baron breaks ground on Miami-area transitoriented tower
• Baron Property Group has commenced construction on Metro Parc North, its second transit-oriented development in Hialeah, Florida, adjacent to its first project, Metro Parc, completed in 2023. Combined, the two developments will span over 2 million square feet of residential and retail space, situated between the Hialeah Tri-Rail station and Hialeah Hospital.
• Metro Parc North, designed by Modis Architects and built by KAST Construction, is expected to be completed in the third quarter of 2027 and will include 661 rental units ranging from studios to three-bedroom apartments.
• The project aligns with Hialeah’s broader 25-year growth plan, which emphasizes increased housing density, improved pedestrian infrastructure, and redevelopment near transit hubs.
Source: Multifamily Dive, March 4, 2025
Critics slam Florida city’s one-way street proposal to ease gridlock
• Fort Lauderdale is evaluating a proposal to convert Andrews Avenue and Third Avenue into one-way streets with dedicated bus lanes to alleviate downtown traffic congestion; the plan has received significant public opposition. The project has received funding through Broward County’s transportation surtax initiative, with allocations for planning, design, and construction totaling over $6 million.
• The concept, known as “one-way pairs,” was introduced after the cancellation of the Wave streetcar project in 2018, which had cost over $33 million in planning without any construction.
• P ublic meetings have shown strong resistance to the plan, with residents and officials expressing concerns about increased congestion, reduced accessibility, and the
trend in other cities to revert one-way streets to two-way for improved walkability. While some transportation experts believe the plan could relieve gridlock, city officials, including the mayor, acknowledge the lack of community support and suggest the project may not proceed.
Source: Tampa Bay Times, March 10, 2025
Congresswoman Sheila Cherfilus-McCormick Delivers $1 Million in Funding to the City of West Palm Beach for Coleman Park Affordable Housing Project
• The City of West Palm Beach has received $1 million in Community Project Funding (CPF) for the Coleman Park Affordable Housing Project, secured by Congresswoman Sheila Cherfilus-McCormick. The funding will support the development of an affordable rental housing project at 1400 Henrietta Avenue, intended to provide 9 to 18 supportive housing units.
• The project aims to assist families transitioning from homelessness or at risk of homelessness, as well as low-income households unable to afford housing in the local market. The initiative reflects a broader federal-local collaboration to address housing insecurity and promote community development.
• Th is funding is part of over $14.4 million in CPF resources allocated to Florida’s 20th Congressional District for Fiscal Year 2024 to address critical regional needs.
Source: house.gov, March 18, 2025
Affiliated Development Secures $80M Construction Loan for The Era Workforce Housing Development in Fort Lauderdale
• A ffiliated Development has secured $80 million in financing and commenced construction on The Era, an eight-story, 400-unit multifamily housing project in Fort Lauderdale’s South RAC area. At least 210 of the units will be designated for workforce housing, targeting residents earning between 80% and 120% of the area median income.
• The development is located near major employment centers such as Broward Health, Port Everglades, and Fort Lauderdale’s Central Business District, and will include amenities such as a resort-style pool, fitness center, rooftop observation deck, and secure parking.
• The project received public support through a 15-year property tax reimbursement from the City of Fort Lauderdale and a 30-year reimbursement from Broward County, up to $5.5 million.
Source: Yield PRO, March 25, 2025
JetBlue Expands Fort Lauderdale Service with Two Nonstop Routes
• JetBlue has announced the reinstatement of nonstop service from Fort LauderdaleHollywood International Airport (FLL) to Philadelphia International Airport (PHL) and José Joaquín de Olmedo International Airport (GYE) in Guayaquil, Ecuador, beginning July 2025.
• The airline is expanding its presence in South Florida, with a 6% year-over-year increase in regional departures and over 70 daily flights to more than 30 destinations. JetBlue now offers the highest number of flights from Fort Lauderdale to the Caribbean and Latin America among all carriers, along with a 60% increase in lie-flat seat availability compared to the previous summer.
• The route reinstatements follow a period of network optimization and reflect JetBlue’s strategic response to evolving market conditions and aircraft availability.
Source: Yahoo Finance, April 10, 2025
Long Term Outlook for West Palm Beach-Boca Raton-Delray Beach, FL (Division of Miami MSA)
June 2025 Forecast
Personal Income (Billions $)
202020212022202320242025202620272028
TotalPersonalIncome136.0151.4165.2180.0189.1195.3204.3216.6228.0
PctChgYearAgo5.611.39.18.95.13.34.66.05.3 WagesandSalaries40.947.752.256.659.962.365.068.371.7
NonwageIncome95.1103.7113.0123.4129.3133.0139.3148.3156.3
RealPersonalIncome(12$)118.7126.4127.2133.5136.8136.9139.6145.3150.3
PctChgYearAgo3.56.50.65.02.50.12.04.03.4
PerCapitaIncome(Ths)91.0100.5107.6115.3119.4122.4127.6134.7141.2
RealPerCapitaIncome(12$)79.483.982.985.686.485.887.290.393.1
AverageAnnualWage(Ths)67.574.977.881.585.087.791.395.699.7 PctChgYearAgo9.810.93.94.74.33.14.24.74.3
Establishment Employment (Place of Work, Thousands, SA)
TotalEmployment603.5634.4668.0691.6701.5707.4709.0711.6716.6
PctChgYearAgo-5.65.15.33.51.40.80.20.40.7
Manufacturing19.520.421.021.922.622.822.221.821.4 PctChgYearAgo-3.44.62.94.43.20.5-2.2-2.2-1.7 Nonmanufacturing584.0613.9647.0669.6678.9684.7686.7689.8695.2 PctChgYearAgo-5.75.15.43.51.40.90.30.50.8 Construction&Mining37.839.341.743.744.745.846.646.847.4 PctChgYearAgo-2.53.86.14.92.12.61.60.61.1 Trade,Trans,&Utilities111.5117.0123.2126.5127.7128.9129.1130.4129.6 PctChgYearAgo-4.45.05.32.70.90.90.21.0-0.7 WholesaleTrade22.823.424.726.126.526.927.127.327.1 RetailTrade74.777.080.080.981.281.681.482.381.5 Trans,Wrhsng,&Util14.016.618.519.419.920.320.620.921.0 Information9.810.111.511.911.711.411.711.511.4 PctChgYearAgo-7.72.813.84.0-1.9-2.92.9-1.3-1.1 FinancialActivities43.445.848.849.950.050.751.351.851.9 PctChgYearAgo0.65.56.62.20.31.41.30.80.4 Prof&BusinessServices114.7124.9133.2135.4134.6133.1129.4126.9129.5 PctChgYearAgo-1.58.96.71.6-0.6-1.1-2.8-1.92.0 Educ&HealthServices102.3103.7107.0113.8118.7123.7125.5126.9128.5
PctChgYearAgo-3.11.43.36.34.44.21.41.21.2 Leisure&Hospitality74.182.089.794.495.594.296.097.497.8 PctChgYearAgo-18.110.69.45.31.2-1.42.01.40.4 OtherServices29.329.529.630.531.231.031.532.333.3
PctChgYearAgo-8.80.70.62.92.2-0.41.42.63.2 FederalGovernment7.26.97.07.27.37.16.86.97.0
PctChgYearAgo3.3-3.50.62.81.5-2.7-3.51.61.4 State&LocalGovernment54.054.955.356.557.558.958.858.858.8
PctChgYearAgo-8.01.60.72.21.92.3-0.20.00.0
Other Economic Indicators
Population(Ths)1494.41507.11534.91560.71583.61595.11602.01608.01614.8
PctChgYearAgo0.60.81.81.71.50.70.40.40.4 LaborForce(Ths)706.3724.3750.4772.7778.2788.4792.5798.3803.8
PercentChange,YearAgo-2.32.53.63.00.71.30.50.70.7 UnemploymentRate(%)8.14.43.03.03.33.94.34.44.3 TotalHousingStarts6795.77146.46407.05028.73670.44371.66445.97258.47561.6
Single-Family4034.14278.03377.43207.52845.02873.83604.53799.63729.6 Multifamily2761.62868.43029.71821.2825.31497.82841.43458.83832.0
Short Term Outlook for West Palm Beach-Boca Raton-Delray Beach, FL (Division of Miami MSA)
June 2025 Forecast
Personal Income (Billions $)
2025:12025:22025:32025:42026:12026:22026:32026:42027:12027:22027:32027:42028:1
TotalPersonalIncome193.3195.1195.7197.1199.9203.0205.7208.8212.3215.3218.1220.8223.8
PctChgYearAgo0.60.1-0.3-0.10.01.62.73.64.14.04.13.93.6
PerCapitaIncome(Ths)121.4122.4122.6123.3124.9126.8128.4130.2132.2134.0135.6137.1138.8
RealPerCapitaIncome(12$)86.585.985.585.586.186.987.588.289.290.090.891.492.1
AverageAnnualWage(Ths)86.787.387.988.889.990.891.892.994.095.196.297.298.3
PctChgYearAgo2.53.73.13.13.73.94.44.74.64.84.84.64.5
Establishment Employment (Place of Work, Thousands, SA)
TotalEmployment705.5708.2708.3707.7708.0708.5709.4709.9710.4711.1712.0712.8713.7
PctChgYearAgo0.70.90.71.10.40.00.10.30.30.40.40.40.5
Manufacturing22.922.922.622.622.322.422.222.121.921.821.721.621.5
PctChgYearAgo1.21.30.1-0.7-2.7-2.3-1.8-2.2-1.8-2.4-2.4-2.0-1.7
Nonmanufacturing682.5685.4685.7685.2685.7686.2687.1687.9688.5689.3690.3691.2692.2
PctChgYearAgo0.60.90.71.10.50.10.20.40.40.50.50.50.5
Construction&Mining45.445.746.046.346.446.546.646.746.846.846.947.047.1 PctChgYearAgo1.92.52.24.02.31.81.30.90.80.50.50.60.7 Trade,Trans,&Utilities128.8129.2128.9128.6128.6128.9129.4129.7130.2130.5130.6130.4129.5
PctChgYearAgo1.20.90.80.7-0.2-0.20.40.91.31.21.00.5-0.5 WholesaleTrade27.026.926.926.927.027.027.127.227.327.327.327.227.2 RetailTrade81.682.081.681.381.181.381.681.782.082.282.582.381.3 Trans,Wrhsng,&Util20.220.320.320.420.520.520.620.820.820.920.920.921.0 Information11.311.311.411.411.611.711.711.711.711.611.511.411.4
PctChgYearAgo-6.8-3.3-1.80.32.63.62.92.50.5-1.1-2.0-2.5-2.3 FinancialActivities50.450.750.750.951.251.351.451.551.751.851.851.852.0
PctChgYearAgo0.91.00.72.91.61.21.41.10.90.90.80.60.7 Prof&BusinessServices133.1133.8133.7131.8130.8129.7128.9128.2127.1126.9126.7127.0128.1 PctChgYearAgo-1.2-0.3-1.4-1.6-1.7-3.1-3.5-2.7-2.8-2.2-1.8-1.00.8 Educ&HealthServices122.7123.5124.0124.5124.9125.3125.6126.0126.5126.8127.1127.3128.1
PctChgYearAgo4.64.84.13.31.81.51.31.21.21.21.21.01.3
Leisure&Hospitality93.894.094.195.095.495.896.296.896.997.197.598.097.1
PctChgYearAgo-3.1-2.6-1.01.31.71.92.31.91.61.41.31.30.2
OtherServices30.931.031.131.231.331.431.531.732.032.232.432.733.0
PctChgYearAgo-1.5-1.0-0.71.61.31.31.41.72.12.52.93.03.3
FederalGovernment7.37.27.06.86.86.86.86.96.96.97.07.07.0
PctChgYearAgo0.8-1.1-3.5-7.1-7.3-5.5-2.31.71.61.61.51.51.5
State&LocalGovernment58.958.958.858.758.758.858.858.858.858.858.858.858.8
PctChgYearAgo3.32.82.01.0-0.4-0.3-0.10.10.10.10.00.00.0
Other Economic Indicators
Population(Ths)1591.71593.91596.41598.41600.01601.21602.71604.21605.71607.21608.71610.21611.9
PctChgYearAgo1.00.80.60.50.50.50.40.40.40.40.40.40.4
LaborForce(Ths)785.3789.9789.5789.0790.3791.8793.2794.7796.2797.7799.1800.4801.7
PctChgYearAgo0.91.61.11.60.60.20.50.70.70.70.70.70.7
UnemploymentRate(%)3.63.83.94.14.24.34.44.44.44.44.44.44.4
TotalHousingStarts3378.64079.94783.95244.25818.16278.66717.56969.47144.07252.67289.37347.67422.0
Single-Family2469.32755.13029.33241.63414.23569.33678.23756.33800.13811.63802.33784.23755.1
Multifamily909.31324.71754.62002.62403.92709.33039.33213.13343.93441.03487.03563.43666.9
EXPLANATION AND INTERPRETATION
This technique compares the local economy to a reference economy; in this case, the local economy is the chosen MSA, and the reference economy is the state of Florida. An Industry Location Quotient (LQ) is calculated to determine if the local economy has a greater share of each industry’s employment than the reference economy. The LQ helps to identify specializations that exist in the local economy.
There are only three possible outcomes: 1. An LQ greater than one 2. An LQ equal to one and 3. An LQ less than one. An LQ that is greater than one means that the share of local employment in that particular industry is greater than the reference economy employment share in that same industry. This implies that some of the goods or services produced by that industry are exported for consumption elsewhere. An LQ of one means that local demand is met by the local industry. No goods/services are imported or exported from the local area in that industry. The share of local employment in that industry is equal to the share for that industry in the reference economy. An LQ less than one implies that the industry is not meeting local demand for that good or service, and in order to meet demand, that area must import that good or service. This also means that the share of local employment in that industry is less than the share of employment in that industry for the reference economy.
CALCULATION
An industry location quotient is a calculated ratio of two ratios.
LQ = ((Local employment in industry A in year T / Total local employment in year T) / (Reference economy employment in industry A in year T) / (Total reference employment in year T))
For example:
Orlando MSA employment for Information is 27,400
Total Orlando MSA nonagricultural employment is 1,104,100
Florida employment for Information is 169,800
Total Florida nonagricultural employment is 8,247,000
LQ = ((27,400 / 1,104,100) / (169,800 / 8,247,000)) = 1.2039
Source: Florida Regional Economic Database, Current Employment Statistics, November 2022
Sean Snaith, Ph.D., is the director of the University of Central Florida’s Institute for Economic Forecasting and a nationally recognized economist in the field of business and economic forecasting.
Snaith is the recipient of multiple awards for the accuracy of his forecasts, his research and his teaching. He has served as a consultant for local governments and multinational corporations such as Compaq, Dell and IBM. Before joining UCF’s College of Business, he held teaching positions at Pennsylvania State University, American University in Cairo, the University of North Dakota and the University of the Pacific.
Snaith is frequently interviewed in international, national and regional media. He has been quoted in The Wall Street Journal, USA Today, The New York Times, The Economist and The Guardian and has appeared on CNBC, Fox Business Network, The Nightly News with Brian Williams, Al Jazeera, the BBC and CBC, China Central TV, Sky News, Nippon TV and the Business News Network, based in Toronto.
Snaith is a sought-after speaker known for his engaging and humorous presentations. He has built a national reputation for his unique ability to explain complex subject matter in a digestible manner. He earned praise from one business editor for having “an uncanny knack of making economics not only understandable but interesting.”
Snaith is a member of several economic organizations and national economic forecasting panels, including The Wall Street Journal’s Economic Forecasting Survey, the Associated Press’ Economy Survey, CNNMoney.com’s Survey of Leading Economists, USA Today’s Survey of Top Economists, Federal Reserve Bank of Philadelphia’s Survey of Professional Forecasters, Bloomberg and Reuters.
Snaith holds a B.S. in Economics from Allegheny College and an M.A. and Ph.D. in Economics from Pennsylvania State University.
Sean M. Snaith, PhD Director, Institute for Economic Forecasting
P 407.823.1451
E ssnaith@ucf.edu ief@ucf.edu
ucf_ief
ucf.ief
ucf.ief
linkedin.com/company/institutefor-economic-forecasting/