HIGHLIGHTS SPRING 2025
IN THIS U.S. FORECAST
• Trump keeps changing tari s, and all I got was this lousy forecast.
• It’s not easy being green, and it’s not easy trying to forecast the economy when trade policy changes on a seemingly daily basis. Despite uncertainty, the economy will continue to grow, but at a slower pace.
• e national debt continues to rise, surpassing $36.9 trillion. Annual net interest payments on this debt have now exceeded $1 trillion. It took decades to accumulate this debt, and the problem cannot be xed until Congress acts.
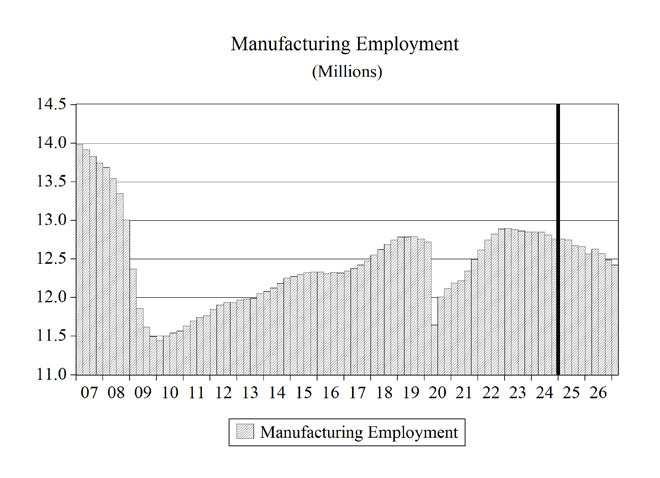
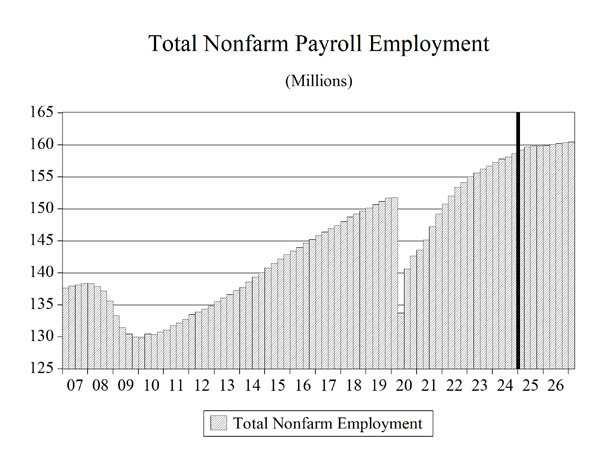
• e labor market is cooling, but still solid. Payroll job growth of 2.2% in 2023 fell to 1.3% in 2024 and will continue to slow. It is expected to hit 1.1% in 2025, and 0.3% in 2026. 0.2% in 2027 and then tick up to 0.3% in 2028.
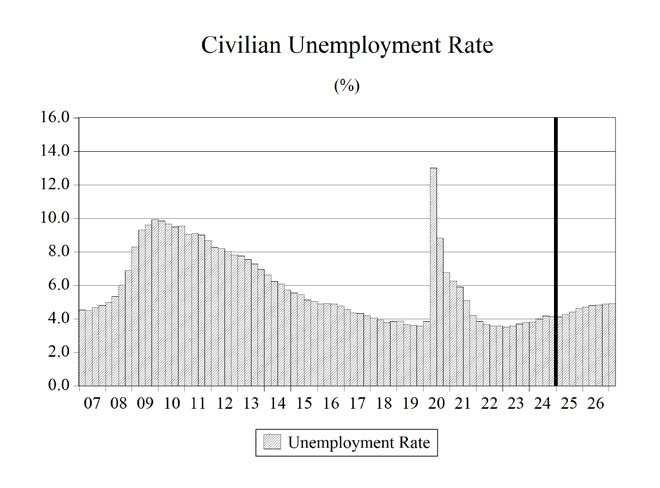
• Despite resistance to the e ects of the Fed’s tightening, the headline unemployment rate (U-3) is expected to gradually rise to 4.9% in 2027 before declining slightly in 2028. ese are still historically low rates of unemployment.
• After two years of erosion, consumer’s purchasing power has been clawing its way back. Wage growth has surpassed in ation and is allowing households to begin repairing strained budgets and to address more than $1 trillion in credit card debt.
• Real consumption spending ticked up to 2.8% in 2024 as real wages started to rise, but it will begin to decelerate, hitting 2.4% in 2025. Growth will slow to 1.5% in 2026, rise to 1.9% in 2027 and 2.4% in 2028.
• Real GDP growth hit 2.9% in 2023 and 2.8% for 2024. Growth will slow over the next several years to 1.5% in 2025, 1.7% in 2027, and stay near that level through 2028.
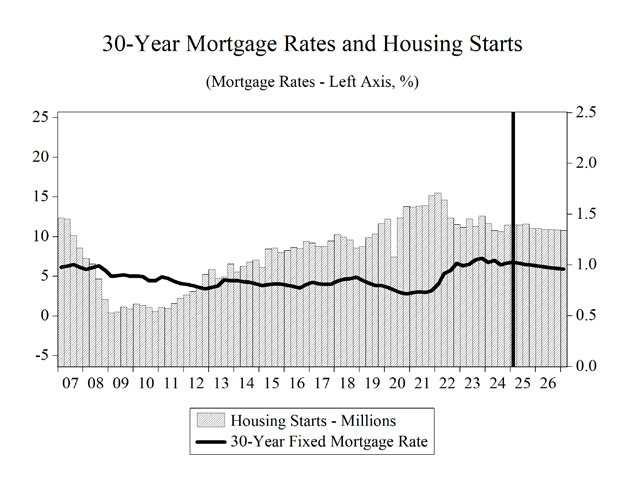
• High home prices combined with 7% mortgage rates have eroded housing demand. However, low inventories will provide a oor for the sector. Housing starts declined from 1.6 million in 2022 to 1.42 million in 2023 and will continue to ease, reaching 1.33 million in 2027. However, as mortgage rates decline starts will creep up, reaching 1.34 million in 2028.
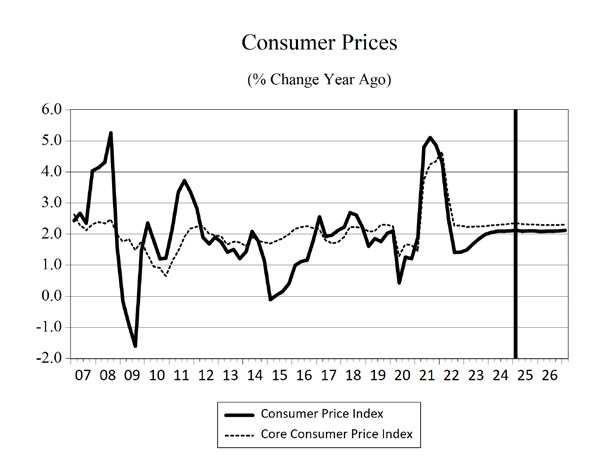
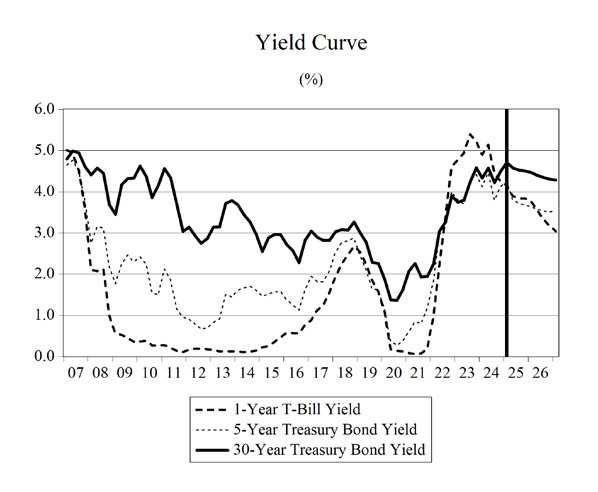
• Core consumer price in ation will continue its slow decline. By the beginning of 2027, headline in ation will be close to the Fed’s target level of 2%. e Fed prematurely started to cut interest rates in 2024 and has had to pause rate cuts thus far in 2025.
Kermit the Frog famously sang the song; It’s Not Easy Being Green in the 1970’s. e song captures Kermit’s struggle with self-acceptance and feeling out of place because of his green color. e song’s long-lasting popularity mirrors human experiences of insecurity, di erence, or not tting in, making it relatable across ages and cultures.
By the end, Kermit embraces his uniqueness, o ering a hopeful message of self-love with the line “I’m green, and it’ll do ne.” e simple yet poignant lyrics convey both struggle and resolution, resonating with listeners facing personal challenges.
e song’s blend of simplicity, universality, and its heartfelt delivery made it a beloved anthem for selfacceptance, contributing to its lasting popularity.
So here I sit 50 plus years after this song was released, relating the song to being an economic forecaster during the uctuating tari s of the Trump administration, seeing parallels between the song’s themes of struggle, identity, and adaptation to the challenges faced in economic forecasting in the current environment.
Economic forecasting during the Trump administration feels like being “green” in a world of uncertainty. Tari s introduce unpredictability,
with sudden announcements disrupting markets and trade ows. As a forecaster, it is sometimes overwhelming to try to predict the economy in a volatile environment where traditional models struggle to account for rapid policy shifts.
e Trump administration’s tari s, which shift based on political or diplomatic whims, make it hard to rely on historical data or standard economic indicators. Precise quantitative forecasts in such an environment simply aren’t possible, but just because something is di cult doesn’t mean that it isn’t worth trying. Accepting the reality of the situation and the elusiveness of quantitative accuracy and pivoting toward qualitative insights during this phase of the Trump administration is my “I’m green and it’ll do ne” moment.
So qualitatively, I am con dent to claim the following: e tari and trade uncertainty will not result in the U.S. economy entering a recession. It may, however, cause growth to be somewhat lower than it would have been in the absence of the disorder. Tari s do not cause in ation; in ation is the increase of the price level in the economy. In ation is solely caused by the growth rate of money supply. Tari s may result in a one-time increase in the price of goods that are subject to or constructed
using materials that are subject to tari s. is is not in ation, which is the broad-based and ongoing increase in prices in the economy. Finally, once the trade rules are settled, consumers and businesses will adjust to the new set of rules by reevaluating supply chains, re-shoring the production of some goods and adjusting purchases to re ect the post-tari set of prices that consumers will face. at being said, it’s time to delve into this lousy forecast.
ANXIOUS INDEX
Recession Fear Surges
e most recent release (2nd quarter of 2025) of the Survey of Professional Forecasters by the Federal Reserve Bank of Philadelphia states that the forecasters surveyed for the publication put a 36.10% chance that a decline in real GDP will occur in the 3rd quarter of 2025. is is the lowest reading of the anxious index in three years.
One section of the Survey of Professional Forecasters asked panelists to estimate the probability that real GDP will decline in the
quarter in which the survey is taken, as well as the probabilities of a decline in each of the following four quarters. e anxious index is the estimated probability of a decline in real GDP in the quarter after a survey is conducted. In the survey taken in April for the 2nd quarter of 2025, the index stands at 36.10, meaning forecasters believe there is a 36.10% chance that real GDP will decline in the 2nd quarter of 2025. is is up from 15.37% in the survey taken in the 1st quarter of 2025.
e graph below plots the historical values of the anxious index, where the gray bars indicate periods of recession in the U.S. economy. e current level of the anxious index is slightly less than 22.5 points higher than the average level during the 2009-2020 economic recovery (13.63).
GDP OUTLOOK
e negative growth we are projecting for federal government spending is going to have an impact on overall real GDP growth for the next several years. ere is also a high level of uncertainty in the economy, with the frenetic pace of activity in the initial months of the Trump administration. Until the dust settles and markets can discern what the new rules of the game are going to be, the uncertainty will persist and so will the dampening e ect that uncertainty has on economic growth.
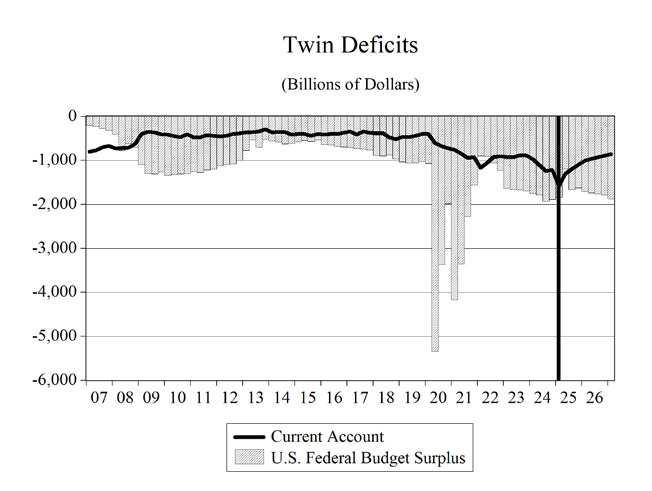
Persistent large de cits at the federal level continued to fuel economic growth through the end of 2024. e size of these de cits is set to decline in 2025 before rising again through 2028.
e eventual end of trade related uncertainty and business-friendlier policies from DC should continue
the economic expansion through the end of our forecast horizon albeit with slower economic growth as consumers are tapping the brakes and working at repairing their in ation-damaged balance sheets.
e slowing growth in 2025 and beyond will impact the labor market. e unemployment rate will gradually rise as 2026 progresses, continuing into 2027 before stabilizing below 5%. Job growth will slow to a trickle but should not turn negative as the economy essentially remains at full employment.
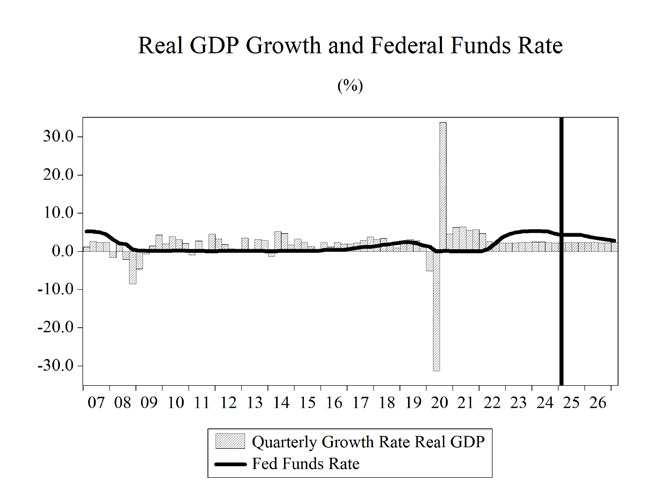
ere will be another recession and there is a chance that it could be borne of the uncertainty happening in the nation’s capital. However, at this point we are not predicting that it will come to pass in the next several years. In the meantime, we are anticipating a softening of real GDP growth slowing from 2.8% in 2024 to 1.5% in 2025 before drifting up to 1.6% in 2027 and then ticking up to 1.7% in 2028.
CONSUMER SPENDING
U.S. consumers were hit hard by high in ation for more than two years, and despite wage and salary growth, the rising cost of living eroded away all those wage gains and even more purchasing power beyond that. Starting in the second quarter of 2021, real median weekly wage and salary growth had been negative. is means that even though workers had more dollars in their paychecks, the amount of goods and services that they could purchase with these dollars declined for more than two years. is declining purchasing power set the stage for a slowing economy and raised the possibility of recession.
e holes in consumers’ budgets were patched by savings from the COVID era and using credit card debt. However, these patches to consumers’ budgets can only hold for so long before spending is impacted.
In ation hit middle- and lower-income households hard. Roughly 63% of consumer expenditure goes to
food, shelter, and transportation; all three of these categories saw outsized price increases over this twoyear span.
Over the most recent two years, thanks to a still strong labor market and retreating in ation, growth in real wages has turned positive. is is enabling consumers to make more permanent repairs to damaged household budgets.
Credit card delinquency rates were rising for more than two years as households struggled to make ends meet. In the second half of 2024, these delinquency rates started to decline thanks to rising real wages. However, overall credit card debt remains above $1 trillion, and this will constrain consumer spending growth over the next few years.
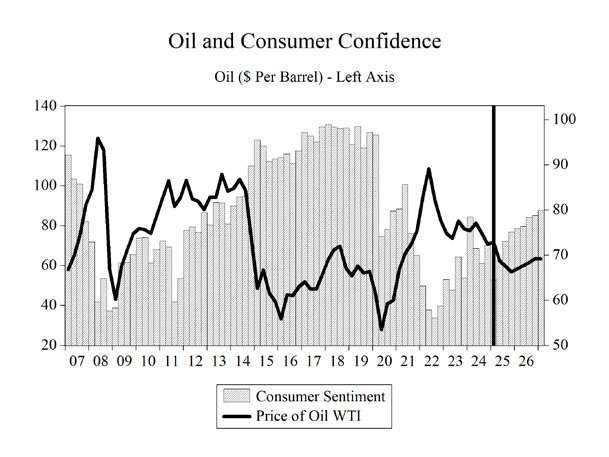
Consumer sentiment has been on an upward, but somewhat volatile, trend since hitting an all-time low at the height of the in ation crisis. Seeing paychecks start to go further has played a role in regaining con dence in households’ nancial status.
COVID-19 public health policies caused spending growth in 2020 to contract by 2.5%. Consumption spending growth slowed from 8.8% in 2021 to 3.0% in 2022 and then to 2.5% in 2023 before ticking up to 2.8% in 2024. During 2025-2028, real consumer spending growth is expected to average 2.0%. Consumer spending growth will be dampened by the economic slowdown in 2025 and 2026 after hitting 2.8% in 2024 before riding in the next two years to 2.4% in 2028.
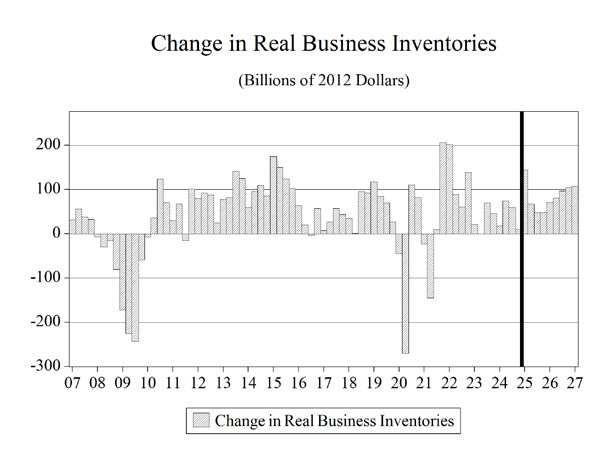
INVESTMENT
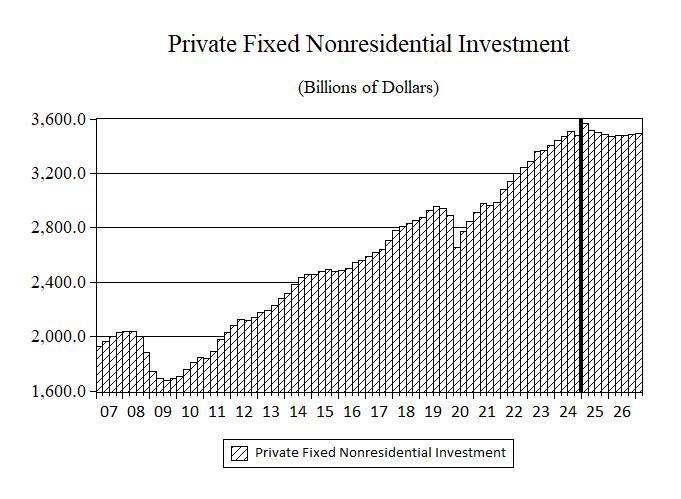
Higher interest rates and increasing levels of policy uncertainty combined to slow investment spending in 2024, and it will likely continue to decelerate through 2027 before rising in the nal year of our forecast, 2028. Businesses will continue to try and gure out what tari s, spending cuts, and regulatory changes are going to be implemented and, importantly, how long such changes might remain in place.
In 2020, nonresidential investment spending contracted by 4.6%, then rebounded to 6.0% growth in 2021 and 7.0% growth in 2022, easing to 6.0% in 2023 and 3.6% in 2024. During 2025-2028, we expect average growth in non-residential investment spending to be just 0.5%, decelerating from 3.6% in 2024 to -1.1% in 2026 before rebounding to 1.4% in 2028.
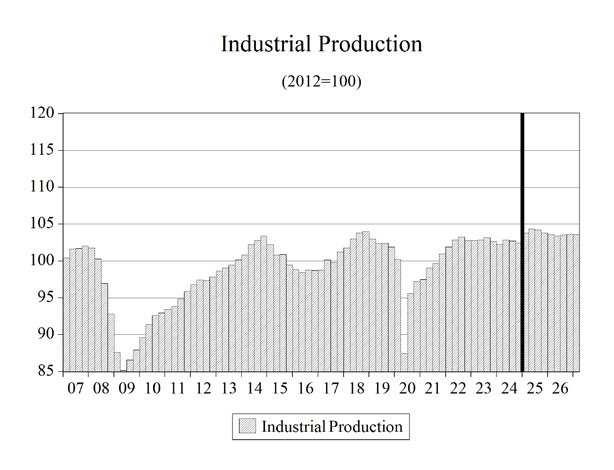
Spending growth on equipment and software held steady in 2023 and 2024 at 3.5%. Average growth in this type of investment spending is expected to be 1.4% over the 2025-2028 timeframe, after contracting in 2026.
In 2022, as air travel continued to grow in the post-lockdown era, aircraft purchases grew by 5.4% that year and surged to 28.9% in 2023. Over the 2025-2028 period, spending on aircraft is expected to grow by an average of 4.2%. is deceleration of growth comes after a two-year period where growth averaged 23.1% in 2023-2024.
Lower oil prices over the past quarter and the unfriendly policy from the Biden administration have pushed the current rig count to 559, which is 35 rigs fewer than a year ago. Rig counts were over 1,000 as recently as 2019. Friendlier policy from the Trump administration should bolster that number in the next couple of years.
In 2018, investment in mining and petroleum equipment growth came in at 27.0% before contracting by 0.3% in 2019 and plunging to -38.4% in 2020. Investment will average a 7.4% growth per year during 2025-2028, including a surge to 21.3% in 2026.
Business non-residential structures investment growth contracted by 9.2% in 2020, 2.6% in 2021, and then accelerated to 3.6% in 2022. Nonresidential structures spending will grow at an average rate of -1.7% during 2025-2028, after growing at 10.8% in 2023 and 3.5% in 2024.
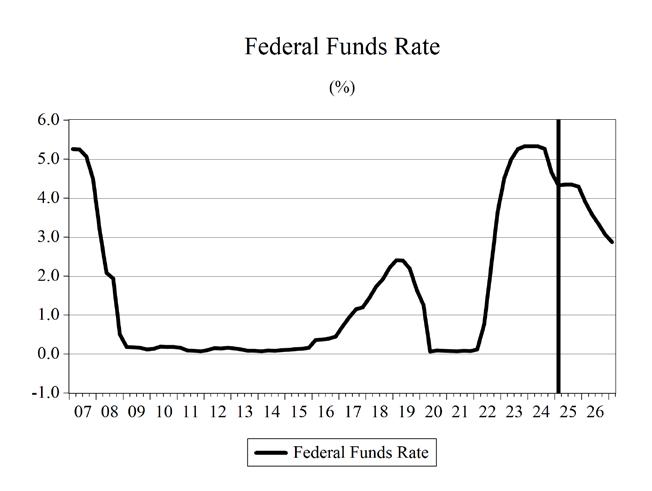
e Federal Reserve cut short-term interest rates to near zero and kept them there for nearly two
years in response to the pandemic. Interest rates on U.S. Treasury bonds fell to historic lows but have since gone up. Higher interest rates slow investment spending. e Fed has now switched gears to go into recession- ghting mode, cutting short-term rates in September, which in turn caused long-term rates to rise in response to these cuts.
Higher borrowing costs and tighter credit conditions in the wake of the Silicon Valley Bank failure will be a persistent headwind for commercial real estate investment spending.
Business spending on industrial equipment will grow at an annual average rate of just 1.9% from 2025-2028. Investment spending growth on computers and peripherals will average 2.1% during 2025-2028. Spending on communications equipment should expand at an average annual rate of 4.9% during the same period, with spending in 2025 expanding at a 14.4% rate.
Residential xed investment growth hit 10.9% in 2021. Growth will average just 0.5% during 2025-2028, as higher prices combined with higher mortgage rates have eroded demand and caused investment spending to contract by 8.6% in 2022 and 8.3% in 2023 before growing 4.2% in 2024.
We expect housing to continue a slow deceleration that commenced in 2023 and continued through 2024. After reaching 1.6 million in 2021, starts fell to 1.37 million in 2024. ey will continue to drift lower for the next four years, hitting a level slightly less than 1.34 million in 2028. High home prices and a slowing economy are headwinds, and the expected decline in mortgage rates as the Federal Reserve loosened monetary policy did not materialize as long-term interest rates moved in the opposite direction. e ongoing shortage of housing that is plaguing the sector in many parts of the country will help ght against these headwinds and provide support for home building, albeit at a slightly lower pace.
GOVERNMENT SPENDING
DOGE Came in Like a Lion, is it Leaving a Lamb?
Government budget management devolved into a series of continuing resolutions, COVID-19 stimulus packages, and spending made under the umbrella of a pandemic emergency declaration. Federal government spending has been devoid of any policy discussions or debates about priorities, problems, objectives, or any consideration of de cits and the national debt. Unsurprisingly, public nances have been adrift, and de cits climbed back to the $1 trillion mark in 2019 even before the massive wave of de cit spending triggered by the pandemic.
e pandemic ended, but the spending spree in Washington, DC continued unabated. e vote to suspend the debt ceiling in June of 2023 removed the last our elected prodigals, prior to DOGE, $1.0 trillion was added to the national debt every 100 days. e interest payments on this national debt are now more than $1 trillion every year.
Can the cuts made by the Department of Government E ciency (DOGE) curb this pro igate and unchecked spending? I am still not convinced that it will be able to rein in a bureaucracy entrenched by decades of the same modus operandi. DOGE has been making cuts and according to the US debt clock website in the footnote below, there has been more than $500 billion in cuts made via this process. at’s a lot of money, but when de cits are near two trillion dollars it also shows how much heavy lifting still must be done, assuming these cuts come to fruition.
Federal government spending growth was 3.8% in 2019 before jumping to 6.3% in 2020. During the 2025-2028 period, federal government spending growth is going to contract, growing at an annual average pace of -0.4%. Over the same period, state and local governments will see spending growth at an average rate of 0.3%.
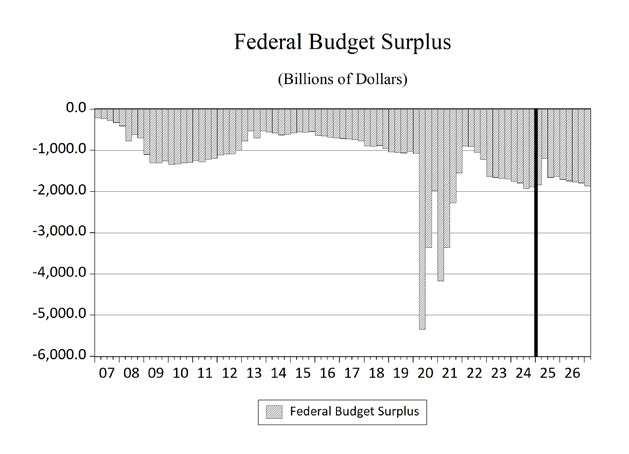
I am not yet convinced that Congress will
undertake the required cuts to the de cit and the big, beautiful bill currently being voted on suggests further delay in addressing this issue. us, we are still projecting de cits through 2028 that will consistently average nearly $2.0 trillion. e amount that the projected de cits will add to the national debt over the next four years will be $7.3 trillion, pushing the total national debt to more than $43 trillion and a debt-to-GDP ratio of approximately 128%. If higher interest rates return to the economy, the burden of servicing this debt will continue to rise as well. Slower-than-projected economic growth or a recession would also push projected de cits higher, though the possibility of faster-than-projected economic growth could help mitigate the growth of these de cits on the debt-to-GDP ratio.
Currently, the national debt is over $36.9 trillion and rising. is represents a debt of more than $323,051 per taxpayer and $107,864 per citizen. e unfunded liabilities of the U.S. are even more troubling. ese include Social Security, Medicare Parts A, B, and D, and Federal debt held by the public and federal employee and veteran bene ts, representing more than $123.3 trillion in liabilities, boiling down to more than $356,810 per citizen.1
NET EXPORTS
While DOGE is whipping up uncertainty about government spending, the threats and announcements of new tari s to be levied against U.S. trading partners continue to rile the international sector of the U.S. economy.
A country’s use of tari s historically has been to protect a domestic industry from international competition. e Trump administration is primarily using tari s as a lever to get other countries to make changes that are to the bene t of the United States, as we saw with the 25% tari s on Colombia that lasted for four hours.
Colombia initially refused to accept its citizens that 1
were being deported from the US back to Colombia. e administration threatened broad tari s against Colombia, and within a matter of hours their president capitulated. Similar tactics were employed to incentivize Mexico and Canada to assist with combatting drug ows and border control with the U.S.
A longer run goal appears to be incentivizing U.S. rms to onshore production that have moved overseas previously. It is not clear how successful these e orts will ultimately be, particularly with the possibility that these tari s may not be in place in the long term – a more general problem when governing via executive order instead of by legislation.
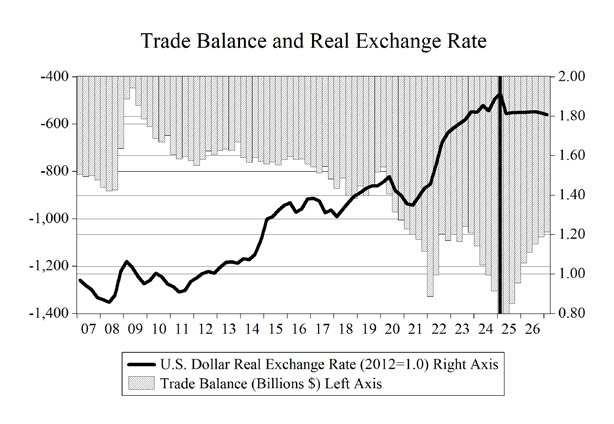
A stronger dollar boosts imports and reduces exports by making our goods and services more expensive to foreigners, while at the same time making imported goods and services less expensive to U.S. consumers. is results in a worsening of the trade de cit, which is the di erence between the dollar value of exports and the dollar value of imports. e opposite is true when the dollar undergoes depreciation.
However, the e ects of currency changes take time to work on the actual quantity of trade ows, resulting in what is known as the J-curve e ect on net exports. Because of this e ect, an appreciation (depreciation) of the dollar initially decreases (increases) the trade de cit before eventually increasing (decreasing) it. Why? Importers and exporters do not enter contracts based on the total dollar value of the transaction, but rather on the actual quantity of goods to be shipped (automobiles, at-screen televisions, etc.). As the exchange rate varies in the short run, the values of these shipments and, thus, net exports vary as well. Over time, however, the quantities do adjust in response to the exchange rate uctuations, and this is what gives rise to the J-curve e ect.
With the Federal Reserve resuming the interest rate cuts it began in September, lower interest rates will lead to a depreciation of the dollar beginning in 2025 and persisting through 2028.
Overall, real export growth has resumed, after a sharp contraction in 2020, and will continue through the end of our forecast horizon after accelerating sharply in 2021 and 2022. e appreciation of the dollar in 2022 caused a deceleration of this growth in 2023 and 2024. Real import growth also experienced a strong contraction in 2020, but growth recovered before contracting again in 2023. Import growth resumed in 2024 and will continue until slipping in 2026. Evolving trade policy issues, a slowing economy, and increasing geopolitical uncertainty notwithstanding will cause real export growth from 2025-2028 to average 2.6%, while real import growth will average 1.6% over the same period.
Real net exports will average over -$1.37 trillion during 2025-2028, with the trade balance improving somewhat in 2026 and 2027 in response to the imposition of new tari s this year before worsening to -$1.33 trillion in 2028.
UNEMPLOYMENT
e national unemployment rate (U-3) in May 2025 stood at 4.2%: down 10.6 percentage points from the April 2020 reading of 14.8%, which was the highest level since the Great Depression era. e labor force participation rate ticked down after holding steady in the previous three months with, the May 2025 rate at 62.4%. e labor force participation rate is still below pre-pandemic levels of 63.3%.
e Bureau of Labor Statistics (BLS) produces alternative measures of labor market weakness, including the broadest measure of unemployment (U-6). U-6 accounts for discouraged workers (currently 381,000 workers), underemployed workers—working part-time but not by choice—
(currently 4.69 million workers), and workers who are marginally attached to the labor force—those who have looked for work in the past 12 months, but are not currently looking, yet indicate a willingness to work (1.56 million workers). None of these 6.5 million-plus workers are accounted for in the May headline unemployment rate of 4.2%.
U-6 stands at 7.8% as of January 2025, down 4.8 points from the September 2020 level, and up 1.1 percentage points from the start of 2023. e current level of U-6 is on par with its level in November 2021. U-6 was stuck in double digits for more than seven years. It had been in single digits for fty-one consecutive months, beginning in December 2015, before surging during the lockdowns in April and May of 2020.
e spread between U-6 and U-3 measures of unemployment sits at 3.6 percentage points and is 3.8 points below the peak spread of 7.4 points that took place in September 2011.
Computers & Peripherals 1.28.614.66.1-7.118.011.1-6.10.72.7 Communications Equipment
3.1-0.311.512.5-3.7-1.514.4-5.55.65.3 Industrial Equipment 1.8-8.96.73.10.81.81.31.62.62.1 Transportation Equipment -3.4-28.2-3.07.139.98.71.14.14.04.8 Aircraft -49.041.3-12.45.428.917.212.5-0.62.62.4 Other Equipment
Structures
Commercial & Health Care
3.2-28.914.011.75.3-7.4-5.5-0.8-2.2-3.5
2.3-9.2-2.63.610.83.5-1.2-3.6-2.50.6
1.53.2-3.6-2.9-0.1-5.2-2.11.83.84.0 Manufacturing
3.86.31.8-3.22.92.6-0.1-0.6-0.2-0.5
93.93620.63653.33702.6
859.810010.110213.0
.0
4151.1153.8159.6166.0
985.274.7
Composition of Real GDP, Percent Change, Annual Rate
Gross Domestic Product-0.31.61.01.52.02.02.01.71.51
Final Sales of Domestic Product-2.52.91.31.41.71.81.71.61.51.51.51.61.71.71.81.9
Total Consumption1.82.00.91.31.61.61.71.61.92.12.32
Durables-3.44.1-2.93.35.76.26.65.96.46.16.46.56.56.56.46.2 Nondurables2.71.91.10.70.50.70.60.60.91.11.31.31.
Services2.41.71.41.21.21.21.21.31.51.71.92.02.02.12.22.1
Nonresidential Fixed Investment9.8-5.2-2.1-1.8-1.60.80.60.50.40.40.61.21.61.71.92.2
Equipment & Software22.5-13.6-4.3-1.6-1.63.32.92.72.32.01.72.32.72.82.93.3
Information Processing Equipment69.3-23.5-3.1-5.6-5.30.81.31.41.60.80.91.62.22.63.03.6 Computers & Peripherals112.8-39.01.5-7.3-5.8-1.70.10.61.50.50.32.33.63.33.24.2 Communications Equipment97.3-9.1-10.5-11.9-11.54.24.66.76.05.05.55.44.85.35.75.7 Industrial Equipment-1.4-2.418.8-5.1-1.12.42.41.82.93.42.82.42.31.71.40.5 Transportation equipment10.510.0-39.825.010.810.56.96.42.21.31.94.25.05.96.38.8 Aircraft76.9-35.81.11.16.80.21.02.63.52.73.71.61.92.22.73.0 Other Equipment-2.214.5-28.418.2-3.60.41.71.0-4.2-3.7-4.4-5.2-4.4-2.3-1.91.0
Structures0.4-2.0-4.3-4.5-3.5-3.3-3.3-3.0-3.0-2.3-0.90.21.21.41.51.9
Commercial & Health Care0.7-7.40.94.01.21.93.65.34.22.52.95.24.13.63.75.4
Manufacturing-4.3-2.3-16.0-15.3-22.3-20.8-17.9-23.5-21.1-16.8-10.7-13.1-13.4-11.4-13.3-3.0
Power & Communication5.9-6.4-4.3-21.9-5.1-13.9-9.7-5.8-10.0-18.62.232.217.3-0.617.518.6
Mining & Petroleum9.314.5-1.330.826.838.66.811.013.824.3-2.6-23.1-9.916.7-5.0-24.2
Other-3.52.93.1-3.8-0.5-3.61.80.8-0.5-0.81.44.26.0-0.13.07.4
Residential Fixed Investment1.32.9-0.30.9-2.0-1.2-0.30.80.9-1.10.41.81.3-0.62.04.8
Exports1.8-0.4-4.6-0.12.55.25.54.53.33.93.13.23.74.03.83.4
Imports41.3-14.3-11.3-6.3-4.6-0.80.60.91.72.83.43.84.34.44.44.5
Federal Government-5.1-2.7-2.5-1.20.30.40.3-0.2-0.3-0.4-0.4-0.5-0.6-0.6-0.6-0.6
State & Local Government0.80.70.1-0.3-0.10.0-0.10.00.00.00.00.0-0.1-0.1-0.1-0.1
Billions of Dollars
Real GDP21920.622005.522060.322140.422252.922362.02
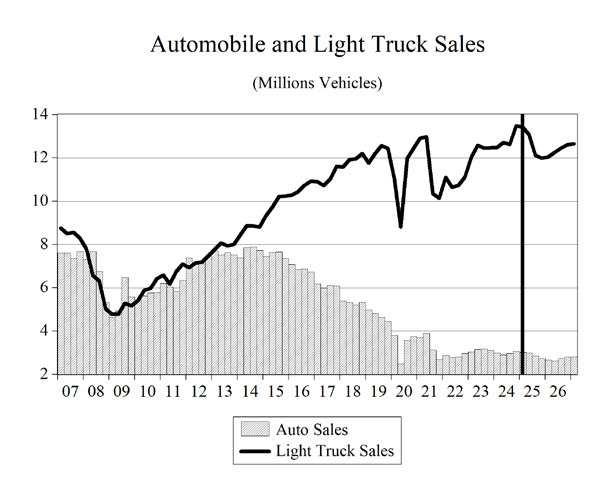
Light Vehicle Sales (Million units)16.416.115.014.714.714.915.215.415.515.615.615.715.715.915.916.0 Housing Starts (Million units)1.41.41.41.41.41.31.41.31.31.31.31.31.31.31.31.3 Existing House Sales (Million units)3.73.93.94.14.24.34.44.44.54.64.54.54.54.64.64.6 Unemployment Rate (%)4.14.24.44.64.74.84.84.94.94.94.94.94.94.84.74.6 Payroll Employment (%change)1.41.20.4-0.10.30.40.30.30.20.10.10.20.30.40.50.6 Federal Surplus (NIPA Bil. $)-1838.5-1199.9-1660.6-1628.5-1708.8-1742.2-1770.9-1791.9-1872.0-1905.6-19
Current Account Balance (Bil. $)-1581.7-1302.9-1193.2-1101.0-1006.0-960.1-925.5-891.3-860.4-831.3-814.
Exchange Rate, Major Trading Partners1.41.31.31.31.31.31.31.31.31.21.21.21.21.21.21.2 (Percent change (negative = depreciation))6.6-20.1-0.4-0.8-1.1-0.4-0.8-2.2-2.7-4.1-4.7-1.4-1.6-0.7-0.1-0.7
Incomes
Personal Income (Bil. of $)25397.225727.225917.126171.826572.426939.527256.227599.227994.128332.828652.228968.429336.429677.029999.230323.0 (Percent change)6.55.33.04.06.35.64.85.15.84.94.64.55.24.74.44.4 Disposable Income (Bil. of $)22235.022529.322925.423150.023506.123827.024103.724403.224755.825055.825340.625623.425955.326259.026547.426837.4
(Percent change)6.45.47.24.06.35.64.75.15.94.94.64.55.34.84.54.4
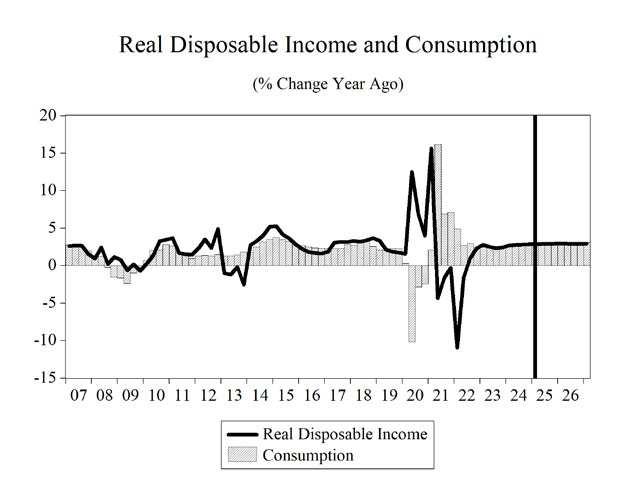
Real Disposable Income (Bil. Of 2012 $)16737.516693.016888.216953.617100.717239.217347.417468.917641.217772.617904.718019.318166.018293.918418.118537.1 (Percent change)2.7-1.14.81.63.53.32.52.84.03.03.02.63.32.82.72.6
Saving Rate (%)4.03.34.24.24.75.15.25.56.06.26.46.46.76.76.86.9
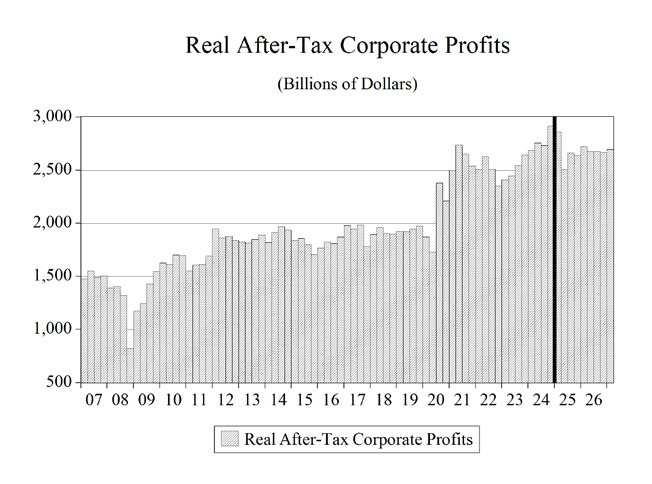
After-Tax Profits (Billions of $)3588.93263.43452.63436.93551.73509.23519.83523.73564.13542.03509.23508.93509.53493.43491.93503.6 (Percent change)-4.6-31.625.3-1.814.0-4.71.20.54.7-2.5-3.70.00.1-1.8-0.21.3
Real GDP Billions 2012 $
Gross Domestic Product
Final Sales of Domestic Product
Total Consumption
Durables
Nondurables
Table 6. Quarterly Employment
Transportation & Warehousing6.86.86.86.96.96.96.97.07.07.07.07.07.07.07.07.0 Financial Activities9.29.39.39.39.49.49.49.49.59.59.59.49.59.59.49.4 Education & Health27.127.327.427.627.827.928.028.128.228.328.428.428.628.728.828.8 Professional & Business Services22.622.722.622.322.121.921.821.621.421.421.321.321.521.621.721.9 Information2.92.93.03.03.03.03.13.03.03.03.02.92.92.92.92.9 Leisure & Hospitality17.017.017.117.317.417.417.517.617.617.617.617.717.517.617.617.7 Government23.623.623.523.423.523.523.523.623.623.623.723.723.723.723.723.7
Growth Rates
Private Nonfarm1.41.40.60.20.30.40.30.20.20.00.10.20.30.40.50.7 Mining-0.60.32.42.33.65.65.84.12.34.34.5-1.2-5.7-4.4-3.1-5.0 Construction0.91.21.51.20.00.10.00.00.1-0.10.50.80.70.61.21.6
Manufacturing0.0-0.5-2.2-0.5-2.92.0-1.7-2.8-2.2-1.8-1.8-1.0-0.6-1.2-1.5-1.3
Trade, Transportation and Utilities1.91.20.1-0.50.00.71.21.11.10.5-0.1-0.9-2.1-0.8-0.2-0.1
Transportation & Warehousing4.02.12.61.11.71.32.12.11.0-0.2-0.3-0.51.5-0.6-0.6-0.5 Financial Activities1.71.00.91.62.80.50.70.61.40.50.0-0.81.8-1.0-1.0-0.5 Education & Health3.23.12.62.62.11.91.31.81.91.01.00.82.90.91.01.0
Professional & Business Services0.21.7-0.7-5.8-3.3-3.9-2.6-2.7-3.0-1.1-1.20.43.11.62.22.7 Information1.11.02.30.56.94.30.3-2.4-1.5-2.6-3.6-3.9-0.9-1.0-0.7-0.8 Leisure & Hospitality0.61.01.54.72.51.21.82.00.3-0.11.21.5-4.61.81.00.7
Government1.1-0.1-0.7-1.70.50.50.50.50.50.50.50.40.30.30.30.2
Federal-0.8-7.2-10.3-15.70.10.00.00.00.00.00.00.00.00.00.00.0
State & Local1.41.00.70.40.60.60.50.60.60.60.50.40.40.30.30.3
Gasoline & Oil93.586.283.981.382.382.984.385.985.686.787.588.489.590.591.291.9
Fuel98.893.491.390.191.692.893.694.494.795.896.396.997.798.398.698.9
Table 8. Percent Change in Implicit Price Deflators
2025Q12025Q22025Q32025Q42026Q12026Q22026Q32026Q42027Q12027Q22027Q32027Q42028Q12028Q22028Q32028Q4
GDP3.77.12.82.73.21.62.02.21.92.11.82.22.22.01.92.0
Consumption3.66.52.32.42.72.22.12.21.81.91.61.91.91.91.71.8
Durables0.928.2-3.0-0.3-1.7-2.2-2.1-2.1-2.8-2.3-2.5-2.1-2.0-2.0-2.1-2.1
Motor Vehicles4.725.0-1.01.0-0.5-0.1-0.1-0.1-0.7-0.2-0.5-0.10.00.0-0.2-0.1
Furniture-1.429.1-4.05.5-0.7-1.5-2.0-1.8-3.4-2.9-3.3-2.5-2.3-1.9-2.0-1.8
Other Durables-3.033.4-4.07.1-0.3-1.3-0.8-1.6-1.9-1.2-1.7-1.6-1.8-1.7-1.5-1.5
Nondurables3.06.51.00.72.70.91.61.80.61.30.71.41.61.41.21.3
Food2.96.92.42.53.30.51.61.91.61.90.91.92.11.71.61.6
Clothing & Shoes-2.716.32.01.30.30.41.20.00.9-0.70.40.30.10.10.10.0
Gasoline & Oil7.2-27.7-10.2-11.95.23.06.87.8-1.45.43.44.65.04.43.03.0
Fuel21.9-20.2-8.5-5.57.05.23.53.61.24.62.32.73.12.51.01.4
Services4.23.43.73.33.43.33.03.02.92.72.52.72.72.62.42.6
Housing3.83.73.43.03.13.02.82.82.92.72.72.82.72.72.82.8
Electricity4.06.08.14.28.74.06.85.23.40.5-3.01.8-0.51.6-0.81.2
Natural Gas29.316.552.337.333.21.916.513.526.1-8.6-27.6-1.215.36.8-19.6-9.3
Water & Sewer6.74.13.45.25.15.36.16.26.76.05.95.85.44.94.95.0
Telephone-3.11.53.9-3.7-3.2-3.8-3.3-2.5-4.3-4.4-2.9-3.7-3.0-2.8-1.2-1.1
Transportation4.10.53.93.12.12.11.21.72.12.42.42.21.91.71.51.6
Other Services3.94.93.93.53.85.05.34.62.73.03.42.92.42.42.82.8
190.8
Table 10. Percent Change in Implicit Price Deflators
Forecast
2019202020212022202320242025202620272028
GDP1.71.34.57.13.62.43.62.82.02.1
Consumption1.41.14.16.63.82.53.42.61.91.8
Durables-1.0-0.95.66.5-0.8-2.14.1-0.2-2.4-2.1
Motor Vehicles0.81.611.411.70.2-2.15.31.3-0.3-0.1
Furniture0.70.95.19.2-0.8-3.13.81.2-2.6-2.4
Other Durables-2.3-2.80.51.92.3-0.45.92.0-1.5-1.7
Nondurables-0.1-0.74.69.92.30.52.01.81.21.3 Food1.03.33.110.35.01.33.12.41.61.7
Clothing & Shoes-1.3-5.12.15.22.50.82.71.70.30.1
Gasoline & Oil-3.4-14.733.530.8-9.9-5.3-10.1-2.73.84.3
Fuel-4.4-20.130.256.2-14.2-7.5-6.8-0.33.02.5
Services2.32.03.75.55.13.93.63.32.92.6
Housing3.42.92.55.97.65.43.93.12.82.7
Electricity0.20.64.313.05.84.13.96.22.70.1
Natural Gas-1.50.216.725.8-7.3-1.619.124.64.6-3.4
Water & Sewer3.23.23.64.55.54.94.95.16.25.4
Telephone-5.0-2.1-2.3-3.3-3.0-2.6-1.5-2.2-3.6-2.8
Transportation2.0-1.24.711.17.22.93.62.32.02.0
Other Services2.22.52.74.65.13.43.34.33.72.7
.34.1
Table 13. Personal Consumption Expenditures
Consumer Expenditures by Type Billions Current Dollars
Consumer spending on… all goods & services14437.514225.716113.917690.818822.819825.320982.521854.122703.723666.0 durable goods1523.61616.91990.32078.02142.62167.42328.72423.22513.92618.7 furniture and appliances346.7379.3450.8475.5480.4486.0524.0544.6553.7566.8 information processing equipment180.8213.5254.2266.8290.3311.1344.7352.0347.1343.7 motor vehicles and parts545.0546.7697.3726.4750.0728.6764.5789.2834.2882.2 other durable goods135.8130.5172.2182.0185.6193.3205.2214.8217.8223.1 nondurables3009.23089.83510.13861.03981.34075.94260.94370.34461.24581.2 clothing & shoes414.1368.0470.6492.8510.1522.7554.2574.7593.7618.8 fuel oil & coal23.820.024.732.927.925.825.322.922.923.4 gasoline & motor oil328.7238.4361.1481.7439.3414.0374.4357.2361.6368.8 food1083.21198.91291.91395.81444.01481.91555.71597.31628.61669.8 other nondurable goods1159.31264.51361.91457.81560.01631.61751.41818.21854.41900.4
Consumer Expenditures by Type Billions 2012 Dollars
Consumer spending on… all goods & services13185.712851.613979.014403.414767.815175.215539.115769.816071.816453.2 durable goods1740.61863.62173.22131.32214.32287.32360.22460.72614.82783.2 furniture and appliances397.8431.1487.3470.8479.5500.5519.8533.7557.3584.3 information processing equipment265.6342.8413.8441.0509.0561.4605.9659.6685.8707.9 motor vehicles and parts544.2537.2615.0573.5591.2586.4584.3595.4631.3668.4 other durable goods175.0174.7227.5237.8239.8254.2254.1262.8272.3285.5 nondurables3038.23141.83411.13415.13441.93507.33593.93620.63653.33702.6 clothing & shoes422.5395.5495.3493.1497.8506.0522.1532.3548.1570.7 fuel oil & coal30.632.230.526.125.725.827.124.623.923.8 gasoline & motor oil435.8370.5420.4428.9434.2432.1434.3426.0415.3406.3 food1036.91110.81160.81136.81119.71133.91154.01156.8116
Real Consumer Expenditures Annual Growth Rate
Consumer spending on… all goods & services2.1-2.58.83.02.52.82.41.51.92.4 durable goods3.37.116.6-1.93.93.33.24.36.36.4 furniture and appliances2.58.413.0-3.41.94.43.92.74.44.8 information processing equipment18.029.120.76.615.410.37.98.94.03.2 motor vehicles and parts-1.7-1.314.5-6.83.1-0.8-0.41.96.05.9 other durable goods5.3-0.230.24.60.86.00.03.43.64.8 nondurables3.03.48.60.10.81.92.50.70.91.3 clothing & shoes2.5-6.425.2-0.41.01.63.21.93.04.1 fuel oil & coal-0.35.2-5.3-14.6-1.30.25.0-9.2-2.9-0.3 gasoline & motor oil-0.4-15.013.52.01.2-0.50.5-1.9-2.5-2.2 food2.77.14.5-2.1-1.51.31.80.20.40.8 other nondurable goods4.58.16.82.22.83.33.31.51.41.7
Billions Current Dollars
Billions 2012 Dollars Business Fixed Investment2926.52791.02959.23165.13355.13476.13515.83478.53497.93547.3
.8302.7289.5286.8
.7
AnnualGrowth Rate
Business Fixed Investment3.8-4.66.07.06.03.61.1-1.10.61.4
Producers Dur. Equipment1.0-10.16.74.43.53.41.9-1.02.42.5
Structures2.3-9.2-2.63.610.83.5-1.2-3.6-2.50.6 Non-Farm Buildings1.3-4.4-6.13.814.04.0-2.3-5.6-4.4-0.9
Commercial1.63.9-3.3-1.80.2-7.0-2.81.23.53.4
Industrial5.6-9.53.324.245.020.4-3.3-18.2-18.7-12.3 Other Buildings-1.8-13.5-17.5-2.47.60.70.74.92.14.1 Utilities6.1-1.9-4.8-6.04.66.40.3-10.0-6.410.8
Mines & Wells-0.3-38.418.221.64.9-6.03.621.310.6-5.8
Forecast
2.71218.31296.1
Table 16. U.S. Exports and Imports of Goods and Services
2019202020212022202320242025202620272028
Billions of Dollars
Net Exports Goods & Services-577.3-626.2-860.0-958.9-797.3-903.1-1068.0-730.6-623.2-597.9
Current Account-441.8-601.2-868.0-1012.1-905.4-1133.6-1294.7-945.7-827.0-771.9
Exports -Goods & Services2539.42151.12555.43017.43052.53180.23247.73350.53513.13688.0
Merchandise Balance-857.3-912.9-1083.2-1179.9-1063.3-1213.0-1441.2-1127.6-1045.8-1043.3
Food, Feed & Beverage131.0139.3164.5179.9161.9165.0161.1171.4179.8188.6
Industrial Supplies Excl Petroleum526.4451.1617.6810.9719.6715.3707.0711.5752.8804.9 Motor Vehicles & Parts163.1129.4146.4163.0180.0171.6158.7162.0168.5174.7
Capital Goods, Excl. MVP550.7463.4521.5573.2602.6645.3698.3747.9793.8816.0
Computer Equipment46.941.246.749.949.068.660.749.550.052.6
Other377.8350.1394.8428.8439.8451.7493.7553.6601.3620.8
Capital Goods, Excl. MVP679.1647.1763.6870.1865.0967.91052.9958.0944.8980.6
Other485.5456.4552.6642.6654.1689.2737.5670.9657.8688.2
Consumer Goods, Excl. MVP655.3640.7768.1839.1757.5803.5860.8762.7800.0834.3
Other Consumer136.5128.4142.1135.5147.5144.2136.0123.8122.7126.1 Services600.0472.2575.9719.3753.7822.3894.2918.8942.4973.8
Billions 2012 Dollars
Net Exports Goods & Services-891.6-918.4-1236.4-1368.4-1251.6-1371.5-1567.0-1306.7-1269.2-1334.2
Exports G & S2575.72237.52382.52561.52632.32718.42744.12795.92907.53012.8
Imports G & S3467.23155.93618.93929.93883.84089.94311.04102.64176.74346.9
Exports & Imports % Change
Exports G & S0.1-15.318.818.11.24.22.13.24.95.0
Imports G & S-0.5-10.923.016.4-3.26.15.7-5.41.33.6
Real Exports G & S0.5-13.16.57.52.83.30.91.94.03.6
Real Imports G & S1.2-9.014.78.6-1.25.35.4-4.81.84.1
Sean Snaith, Ph.D., is the director of the University of Central Florida’s Institute for Economic Forecasting and a nationally recognized economist in the field of business and economic forecasting.
Snaith is the recipient of multiple awards for the accuracy of his forecasts, his research and his teaching. He has served as a consultant for local governments and multinational corporations such as Compaq, Dell and IBM. Before joining UCF’s College of Business, he held teaching positions at Pennsylvania State University, American University in Cairo, the University of North Dakota and the University of the Pacific.
Snaith is frequently interviewed in international, national and regional media. He has been quoted in The Wall Street Journal, USA Today, The New York Times, The Economist and The Guardian and has appeared on CNBC, Fox Business Network, The Nightly News with Brian Williams, Al Jazeera, the BBC and CBC, China Central TV, Sky News, Nippon TV and the Business News Network, based in Toronto.
Snaith is a sought-after speaker known for his engaging and humorous presentations. He has built a national reputation for his unique ability to explain complex subject matter in a digestible manner. He earned praise from one business editor for having “an uncanny knack of making economics not only understandable but interesting.”
Snaith is a member of several economic organizations and national economic forecasting panels, including The Wall Street Journal’s Economic Forecasting Survey, the Associated Press’ Economy Survey, CNNMoney.com’s Survey of Leading Economists, USA Today’s Survey of Top Economists, Federal Reserve Bank of Philadelphia’s Survey of Professional Forecasters, Bloomberg and Reuters.
Snaith holds a B.S. in Economics from Allegheny College and an M.A. and Ph.D. in Economics from Pennsylvania State University.
Sean M. Snaith, PhD Director, Institute for Economic Forecasting
P 407.823.1451
E ssnaith@ucf.edu ief@ucf.edu
ucf_ief ucf.ief
ucf.ief
linkedin.com/company/institutefor-economic-forecasting/