Government Shutdown Leaves Gaps in Economic Data
The Fed and the private sector must fill in the blanks.
The federal government shutdown this past fall halted operations at key agencies like the Bureau of Labor Statistics, Census, and the Bureau of Economic Analysis, thus delaying essential reports on unemployment, inflation (Consumer Price Index), retail sales, and payroll jobs and unemployment data. The October CPI release was fully canceled, and parts of the October jobs report remain incomplete, with two monthly jobs reports delayed overall.
This has created a gap in the data, which forces the Fed to rely on private alternatives (e.g., ADP payrolls, state jobless claims) or secondary indicators like ISM manufacturing surveys, which provide only partial insights into the economic landscape.
About half of the Fed’s regional districts reported lower hiring demand from employers affected by the shutdown, further muddying labor market signals.
How might this data gap influence monetary policy decisions?
The lack of timely data raises uncertainty and may lead Fed officials to adopt a more cautious stance. Federal Reserve Chair Jerome Powell has suggested this could lead the Fed to ease up on rate cuts, opening the door to skipping a widely anticipated third cut in December despite a cooling labor market.
One may view the data gap as a reason to delay easing, but you can also view the shutdown as an added downside risk to growth, justifying cuts. Futures market odds for a December cut have fluctuated — from dropping below 50% to most recently rebounding to near 90% as traders parsed every Fed comment during the data gap.
ANXIOUS INDEX
Recession Fear Eases Further
The most recent release (fourth quarter of 2025) of the Survey of Professional Forecasters by the Federal Reserve Bank of Philadelphia states that the forecasters surveyed for the publication put a 24.0% chance that a decline in real GDP will occur in the first quarter of 2026. This is another decline of the anxious index after a tariff-inspired spike in anxiety during the second quarter of 2025.
One section of the Survey of Professional Forecasters asked panelists to estimate the probability that real GDP will decline in the quarter in which the survey is taken, as well as the probability of a decline in each of the following four quarters. The anxious index is the estimated probability of a decline in real GDP in the quarter after a survey is conducted. In the survey taken in November for the fourth quarter of 2025, the index stands at 24.0, meaning forecasters believe there is a 24.0% chance that real GDP will decline in the first quarter of 2026. This is down from 36.1% in the survey conducted in the second quarter of 2025
and from 29.6% in the third quarter of 2025.
The graph below plots the historical values of the anxious index, where the gray bars indicate periods of recession in the U.S. economy. The current level of the anxious index is slightly more than 10.0 points higher than the average level during the 2009-2020 economic recovery (13.63).
GDP OUTLOOK
The slowing growth we are projecting for federal government spending this year is going to have an impact on overall real GDP growth. There has been a high level of uncertainty in the economy with the frenetic pace of activity in the first year of the Trump administration. As the dust settles and markets can discern what the new rules of the game are going to be, some uncertainty will fall, and with it, the dampening effect that uncertainty has on economic growth will allow some breathing room in 2026.
Figure 1.
Persistent large deficits at the federal level continued to fuel economic growth through the end of 2024. The size of these deficits is set to decline to a lower level through 2026 before drifting back up to 2024 levels in 2028.
The eventual end of trade-related uncertainty and business-friendlier policies from D.C. should continue the economic expansion through the end of our forecast horizon — albeit with slower economic growth as consumers are tapping the brakes and working at repairing their inflationdamaged balance sheets.
The slowing growth in 2025 and beyond will impact the labor market. The unemployment rate will gradually rise into 2026, before stabilizing well below 5.0%. Job growth will slow to a trickle and could turn negative at times, even as the economy essentially remains at full employment.
There will be another recession, but the chance that it could be borne of the uncertainty happening in the nation’s capital has diminished in recent months. We are not predicting that it will come to pass in the next several years. In the meantime, we are anticipating a softening of real GDP growth slowing from 2.8% in 2024 to 2.1% in 2025, before rising to 2.4% in 2026 and then drifting down to 1.6% in 2028.
CONSUMER SPENDING
U.S. consumers were hard hit by the highest inflation in 40 years, which persisted at these elevated levels for more than two years. Despite wage and salary growth that was
occurring during this time, the rising cost of living wiped away all those wage gains and even more purchasing power beyond those gains. Starting in the second quarter of 2021, real median weekly wage and salary growth turned negative.
This means that even though workers had more dollars in their paychecks, the amount of goods and services that they could purchase with those dollars continued to decline for more than two years. This declining purchasing power set the stage for a slowing economy and raised the possibility of recession that many economists thought may occur in 2023.
The holes in consumers’ budgets were patched by savings from the COVID lockdown era and the use of credit card debt. However, these patches to consumers’ budgets were not a permanent solution to the loss of purchasing power and would only hold for so long before spending is impacted.
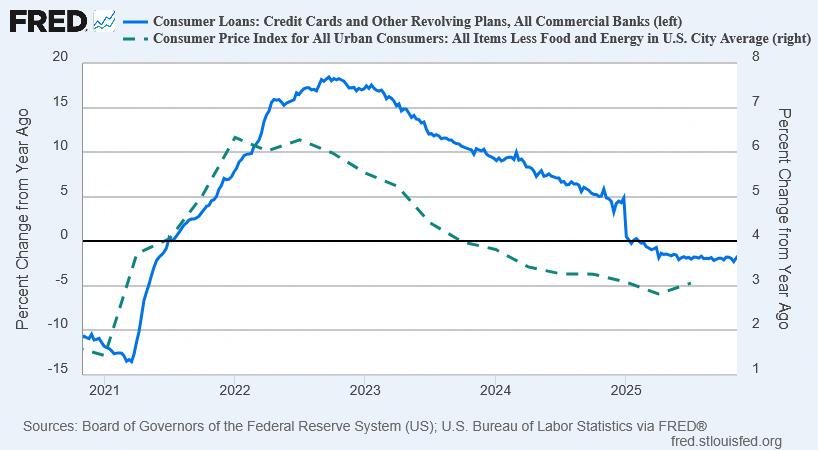
Inflation hit middle- and lower-income households hard. Roughly 63% of consumer expenditure goes to food, shelter, and transportation; all three of these categories saw outsized price increases over this two-year span.
In the chart below, we can see the synchronized rise in both inflation and the amount of credit card debt held by U.S. consumers. Even after inflation hit its apex and began a slow descent, credit card debt continued to rise as inflation persisted above wage growth.
Over the most recent two years, thanks to a still-strong labor market and retreating inflation, growth in real wages has turned positive. This is enabling consumers to make more permanent repairs to those inflation-damaged household budgets.
Credit card delinquency rates that were rising for more than two years as households struggled to make ends meet, thankfully in the second half of 2024, began to decline thanks to rising real wages. However, overall credit card debt remains above $1.0 trillion dollars, and this will continue to constrain consumer spending growth over the next few years.
Consumer sentiment has been on a volatile path since hitting an all-time low at the height of the inflation crisis. Seeing paychecks starting to stretch further has played a role in regaining confidence in households’ financial status, despite the “doom and gloom” predictions that are a feature of the second Trump administration.
COVID-19 public health policies caused spending growth in 2020 to contract by 2.5%. Consumption spending growth slowed from 8.8% in 2021 to 3.0% in 2022, and then to 2.6% in 2023 before ticking up to 2.9% in 2024. During 20252028, real consumer spending growth is expected to average 2.2%. Consumer spending growth will be dampened by the economy slowing, with consumer spending growth of 2.7% in 2025, 2.3% in 2026, and 1.9% in 2027, before ticking up to 2.1% in 2028.
INVESTMENT
Higher interest rates and increasing levels of policy uncertainty combined to slow investment spending in 2024, before jumping in 2025. After this year, it will likely continue to decelerate in 2026 before rising slightly in the final two years of our forecast. Businesses will continue to try
and figure out what tariffs, spending cuts, and regulatory changes are going to be implemented and, importantly, how long such changes might remain in place. This uncertainty will impact investment spending growth until answers to these questions are in place.
In 2020, non-residential investment spending contracted by 4.6%, then rebounded to 6.2% growth in 2021 and 6.5% growth in 2022; then jumped to 7.3% in 2023 before sliding to 2.9% in 2024. During 2025-2028, we expect average growth in non-residential investment spending to be just 1.8%, decelerating from 2.9% in 2024 to 1.1% in 2026, before rebounding to 1.3% in 2028.
Spending growth on equipment and software jumped from 3.5% in 2024 to 7.8% in 2025. Average growth in this type of investment spending is expected to be 3.2% over the 20252028 timeframe, after slipping to 1.1% in 2026. In 2023, as air travel continued to grow in the post-lockdown era, aircraft purchase growth surged to 21.3% in 2023. Over the 2025-2028 period, spending on aircraft is expected to grow by an average of 13.7%. This deceleration of growth comes after tariff-fueled growth of 58.5% in 2025.
Lower oil prices over the past quarter and the green-focused policy from the Biden administration have pushed the current U.S. rig count to 544, which is 38 rigs fewer than a year ago. Rig counts were over 1,000 as recently as 2019. Friendlier policy and resumption of transportation projects from the Trump administration could help that number in the next couple of years.
Investment in mining and petroleum equipment growth plunged to -38.7% in 2020 as oil prices crashed. Investment will average 5.6% growth per year during 2025-2028, including a surge to 19.5% in 2026 as regulatory restraints are eased.
Business non-residential structures investment growth contracted by 9.2% in 2020, 2.6% in 2021, and then accelerated to 3.5% in 2022. After growing 16.7% in 2023 and 1.1% in 2024, nonresidential structures spending will grow at an average rate of -2.0% during 2025-2028. Higher borrowing costs and tighter credit conditions in the wake of the Silicon Valley Bank failure will be a persistent headwind for commercial real estate investment spending as regional banks are key lenders in this sector.
The Federal Reserve cut short-term interest rates to near zero and kept them there for nearly two years in response to the pandemic. Interest rates on U.S. Treasury bonds fell to historic lows but have since gone up. Higher interest rates slow investment spending. The Fed temporarily switched gears to go into recession-fighting mode, prematurely cutting short-term rates in September, which in turn caused long-term rates to rise in response to these cuts. With inflation close to the target level, the Fed has resumed interest rate cuts this fall, which could push longer-term rates somewhat lower, but not to the level during the post-pandemic era.
Business spending on industrial equipment will grow at an annual average rate of 4.4% from 2025-2028, boosted in part from spending for reshoring production in the face of tariffs. Investment spending growth on computers and peripherals will average 5.7% during 2025-2028, with 35.0% growth in 2025 as the rush into artificial intelligence steams on and spending is pulled forward to avoid higher tariffs. Spending on communications equipment should expand at an average annual rate of 1.4% during the same period, with spending in 2025 expanding at a 12.8% rate — also boosted by tariff avoidance.
Residential fixed investment growth hit 10.9% in 2021. Growth will average just 0.3% during
2025-2028, as higher prices combined with higher mortgage rates have eroded demand and caused investment spending to contract by 8.1% in 2022 and 7.8% in 2023, before growing 3.2% in 2024.
We expect housing starts to stabilize after a slow deceleration that commenced in 2023 and continued through 2024. After reaching 1.6 million in 2021, starts fell to 1.37 million in 2024. They will continue to hover in a narrow range for the next four years, coming in at a level slightly more than 1.32 million in 2028. High home prices and a slowing economy are headwinds, and the expected decline in mortgage rates as the Federal Reserve initially loosened monetary policy did not materialize as long-term interest rates moved in the opposite direction. But cuts this fall should cause mortgage rates to drift somewhat lower. The ongoing shortage of housing in many parts of the country will help fight against these headwinds and provide support for home building, albeit at this slightly lower pace.
GOVERNMENT SPENDING
Same as it Ever Was
Government budget management has devolved into a series of continuing resolutions, COVID-19 stimulus packages, and spending made under the umbrella of a pandemic emergency declaration. Federal government spending has been devoid of any policy discussions or debates about priorities, problems, objectives, or any consideration of deficits and the national debt, let alone talk of a balanced budget for far too long. Unsurprisingly, public finances have been adrift, and deficits climbed back to the $1 trillion mark in 2019 even before the massive wave of deficit spending triggered by the pandemic. The current deficit is in excess of $1.7 trillion.
Did the cuts made by the Department of Government Efficiency (DOGE) curb this profligate and unchecked spending? I am still not convinced that it will be able to rein in a bureaucracy entrenched by decades of the same modus operandi. DOGE has been making cuts, and according to the U.S. debt clock website in the footnote below, there have been more than $620 billion in estimated cuts made via this process. That’s a lot of money if the cuts come to fruition, but when deficits are nearly $2 trillion dollars, it also shows how much heavy lifting still must be done, assuming these cuts come to pass.
Federal government spending growth was 3.8% in 2019 before jumping to 6.3% in 2020. During the 2025-2028 period, federal government spending growth will continue, growing at an annual average pace of 0.3%. Over the same period, state and local governments will see spending growth at an average rate of 0.9%.
I am doubtful that Congress will undertake the required cuts to the deficit, and the One Big Beautiful Bill turned law suggests further delay in addressing this issue. Thus, we are still projecting deficits through 2028 that will consistently average nearly $1.8 trillion. The amount that the projected deficits will add to the national debt over the next four years will be $7.1 trillion, pushing the total national debt to more than $45 trillion and a debtto-GDP ratio of approximately 129%. If higher interest rates return to the economy, the burden of servicing this debt will continue to rise as well. Slower-than-projected economic growth or a recession would also push projected deficits higher, though the possibility of faster-than-projected economic growth and interest rate cuts could help mitigate the growth of these deficits on the debtto-GDP ratio.
Currently, the national debt is over $38.3 trillion and rising. This represents a debt of more than $329,022 per taxpayer and $111,510 per citizen. The unfunded liabilities of the U.S. are even more troubling. These include Social Security; Medicare Parts A, B, and D; and federal debt held by the public; and federal employee and veteran benefits; representing more than $123.5 trillion in liabilities, boiling down to more than $356,206 per person.1
NET EXPORTS
Uncertainty regarding tariffs to be levied against U.S. trading partners continues to rile the international sector of the U.S. economy. The tariffs are now awaiting a ruling by the U.S. Supreme Court, but whatever the ruling, there may be other ways to pursue these policies.
A country’s use of tariffs historically has been to protect a domestic industry from international competition. The Trump administration is primarily using tariffs as a lever to get other countries to make changes that are to the benefit of the United States, as we saw with the 25% tariffs on Colombia that lasted less than a day. The administration has also been using tariffs to bring about changes to other barriers to trade.
A longer run goal appears to be incentivizing U.S. firms to onshore production that had been moved overseas previously. It is not clear how successful these efforts will ultimately be, particularly with the possibility that these tariffs may not be in place in the longer term — this a more general problem of governing via executive order instead of by legislation. However, to date, there has been some limited anecdotal evidence of success on this front, such as some movement of
auto manufacturing back across the border from Canada.
A stronger U.S. dollar boosts imports and reduces exports by making our goods and services more expensive to foreigners while at the same time making imported goods and services less expensive to U.S. consumers. This results in a worsening of the trade deficit, which is the difference between the dollar value of exports and the dollar value of imports. The opposite is true when the dollar undergoes depreciation.
However, the effects of currency changes take time to work on the actual quantity of trade flows, resulting in what is known as the J-curve effect on net exports. Because of this effect, an appreciation (depreciation) of the dollar initially decreases (increases) the trade deficit before eventually increasing (decreasing) it. Why? Importers and exporters do not enter contracts based on the total dollar value of the transaction, but rather on the actual quantity of goods to be shipped (automobiles, flat-screen televisions, etc.). As the exchange rate varies in the short run, the values of these shipments and, thus, net exports vary as well. Over time, however, the quantities do adjust in response to the exchange rate fluctuations, and this is what gives rise to the J-curve effect.
With the Federal Reserve resuming the interest rate cuts that began last September, lower interest rates will lead to a depreciation of the dollar beginning in 2025 and persisting through 2028.
Overall, real export growth has resumed, after a sharp contraction in 2020, and will continue through the end of our forecast horizon, after accelerating sharply in 2021 and 2022. The appreciation of the dollar in 2022 caused a deceleration of this growth in 2023 and 2024. Real import growth also experienced a strong contraction in 2020, but growth recovered before
contracting again in 2023. Import growth resumed in 2024 and will continue until turning negative in 2026. Evolving trade policy issues, a slowing economy, and increasing geopolitical uncertainty notwithstanding, real export growth from 20252028 will average 3.2%, while real import growth will average 2.2% over the same period.
Real net exports will average over -$1.37 trillion during 2025-2028, with the trade balance improving somewhat in 2026 and 2027 in response to imposition of new tariffs before worsening to -$1.38 trillion in 2028.
UNEMPLOYMENT
The national unemployment rate (U-3) in September 2025 stood at 4.4%: down 10.4 percentage points from the April 2020 reading of 14.8%, which was the highest level since the Great Depression era. September 2025 labor force participation rate ticked up to 62.4% from the July 2025 rate of 62.2%. The labor force participation rate is still below pre-pandemic levels of 63.3%.
The Bureau of Labor Statistics (BLS) produces alternative measures of labor market weakness, including the broadest measure of unemployment (U-6). U-6 accounts for discouraged workers (currently 557,000 workers), underemployed workers — working part-time but not by choice (currently 4.58 million workers) — and workers who are marginally attached to the labor force — those who have looked for work in the past 12 months, but are not currently looking, yet indicate a willingness to work (1.74 million workers). None of these, nearly 6.9 million workers, are accounted for in the September headline unemployment rate of 4.4%.
U-6 stands at 8.0% as of September 2025, up 0.3 points from the September 2024 level, and up 1.3 percentage points from the start of 2023.
The current level of U-6 is close to its level in November 2021. U-6 was stuck in double digits for more than seven years. It had been in single digits for 51 consecutive months, beginning in December 2015, before surging during the lockdowns in April and May of 2020, hitting 22.9% in April.
The spread between U-6 and U-3 measures of unemployment sits at 3.6 percentage points and is 3.8 points below the peak spread of 7.4 points that took place in September 2011.
30-Year Mo rt gage Rat es and Ho using St art s
Civilian Unemplo yment Rat e
Change in Real Business Invent o ries
(Billions of 2012 Dollars)
Change in Real Business Inventories
eral Fu n d s R ate
To t al No nfarm Payro ll Emplo yment
Table 1. Summary of the Long-Term Forecast of the U.S.
Table 1. Annual Summary of the Long-Term Forecast of the U.S.
Composition of Real GDP,
Incomes