

TULSA MUSIC CENSUS RECAP

A community-led initiative to gain a better understanding of the current needs of the Tulsa music community.


WHAT WE'LL COVER
• Ecosystem Composition
• Live Events
• Sector Profiles
• Economic Activity
• Ecosystem Development
• Livability
• Music Friendly Policies
• Key Insights
• Opportunities

WHAT WE HAVE
CITY-WIDE STUDY
Part of a 25-city cohort measuring music ecosystems, the music community was surveyed directly about their music, their business, needs and opinions.
1003 RESPONSES OVERVIEW OF DATA
The three main sectors of the music community are Creative, Industry, and Venue/Presenters, representing a wide range of roles in the music ecosystem.

This data is a starting point to learn and build conversation around what our music ecosystem needs and why we all need to support it.
WHO WE ASKED
PEOPLE WORKING IN THE MUSIC INDUSTRY WHO ARE 18 YEARS OR OLDER AND LIVING IN THE TULSA REGION
INDUSTRY
The people working on the business side of the music industry.
Ex. Event/Venue Workers, Music Marketing, Music Development
CREATIVE VENUES/PRESENTERS
The people involved in the making of the music. Ex. Musicians, songwriters, performers, composers, teachers
The people owning/managing venues in Tulsa region. This needed to be one person from each venue to not skew data.
Ex. Live Music Venues, Independent Promoters, Hybrid Performance Spaces
ECOSYSTEM COMPOSITION
WHO MAKES UP OUR MUSIC COMMUNITY?

The Tulsa music ecosystem shows a balanced distribution across its three main sectors. Music Creatives make up the majority at 69%, followed by Industry at a healthy 21%, and Venue /Presenter at 10%. This composition indicates a strong presence of Creatives, with a substantial portion of Industry professionals contributing to the ecosystem.

RACE & ETHNICITY
WHO MAKES UP OUR MUSIC COMMUNITY?
Census Data v. Tulsa Population
• Respondent data indicates that the Tulsa music ecosystem has a higher proportion of individuals identifying as White/European Origin and NativeAmerican or Alaska Native compared to the overall Tulsa population.
• The representation of Black or African American, Hispanic, andAsian or Asian American individuals is lower in the music census than in the general population.

EXPERIENCE
WHO MAKES UP OUR MUSIC COMMUNITY?
• The Industry sector features a balanced mix of seasoned professionals with over a decade of experience and a significant influx of newcomers with less than 3 years in the field, indicating a healthy growth and renewal.
• The Music Creative Sector is predominantly composed of 10+ years experienced individuals, showcasing a strong foundation of veteran talent.
• The Venue/Presenter sector also has a majority of longterm professionals but includes a notable proportion of newer participants, reflecting a healthy blend of established and emerging talent.

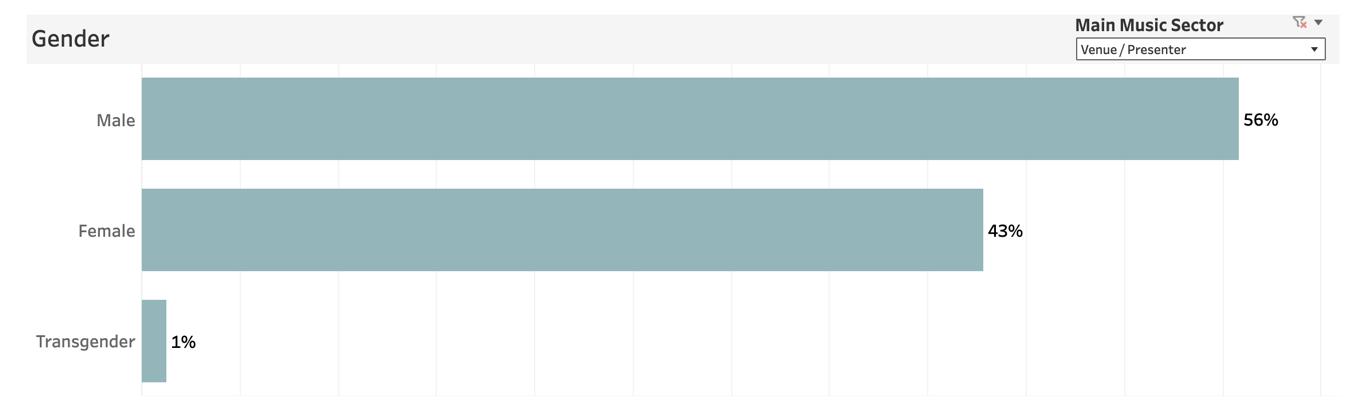
GENDER
WHO MAKES UP OUR MUSIC COMMUNITY?
• In the creative sector, there is a strong male majority.
• The venue/presenter sector also has a higher proportion of males, though the difference between male and female representation is less pronounced.
• The industry sector displays a more balanced distribution, with females slightly outnumbering males.


LIVE EVENTS!

Tulsa is a Live Music City!
Venue/Presenter – Respondents
average 51 events per year for a total of 3,028 events annually.
57% feature local headliners, and 68% book all or most local acts as headliner support.

VENUES
Tulsa's Venue/Presenter respondents are primarily
• 42% for-profit locally owned venues
• 16% live music venues
• 13% independent promoters
• 12% hybrid performance spaces
• 26% Nonprofit venues
• 19% informal setups
77% of venues have outdoor capabilities

CREATIVES
Tulsa’s Creative respondents rely on local live performances and teaching for their income. Tulsa’s rising cost of living is a key concern for Creatives, coupled with stagnant pay rates. Creative respondents in Tulsa spend an average of $6,959 annually on music-related expenses, highlighting a significant investment in their careers that also yields a collective spend of over $5M annually of which 49% stays local.

CREATIVES
• 30% of all respondents work solely in the music industry
• $400 average pay for local performance
• 47% Hold Intellectual Property rights
• 33% Use their home as recording studios
• 17% of respondents have received financial assistance


INDUSTRY
Industry respondents in Tulsa are working as event/venue workers (21%), followed by roles in music marketing (16%) and music development (13%). The gender distribution shows a higher representation of females at 54%, compared to 45% males. The industry primarily serves local clients.

INDUSTRY


ECONOMIC ACTIVITY
MUSIC IN THE ECONOMY
• Music generates a total of $18.5M in income annually across all respondents
• 26% of respondent annual income comes from music
• Average annual income from music is $18K/respondent
• 70% of respondents work outside of the music industry to secure their primary income.
• Nearly half of the respondents hold intellectual property rights, but 34% do not collect royalties, and a significant portion outsource their licensing activities.
• Performance opportunities for respondents are limited, with 51% reporting one or less local gigs per month, and 51% do not have any touring gigs.


ECOSYSTEM DEVELOPMENT

A demand for better connectivity and resources
For Creatives
• 66% of respondents want connections with music services, 56% want to connect with other creative industries, and 52% desire spaces for musical collaboration.
For Venue/Presenter resources
• 80% prioritize audience development tools. Financial assistance is lacking for 83% of respondents, with a preference for micro-grants (61%) and tax breaks (55%). 43% work in another creative field. Valuable initiatives include more varied venue sizes (63%) and recorded music assistance (64%). To stimulate local audience interest, 86% believe increasing awareness is crucial, followed by more local music in public spaces (79%).
ECOSYSTEM DEVELOPMENT (cont.)
Initiatives Valuable to Tulsa

ECOSYSTEM DEVELOPMENT (cont.)
Initiatives Valuable to Tulsa

LIVABILITY

While 45% of respondents are not struggling with affordability challenges, many highlight significant financial pressures. The increasing cost of living is a top concern for Creative respondents, with 72% marking it as a high concern, and 65% troubled by stagnant pay rates. Housing costs have risen for 29% of all respondents in the past three years, with 11% finding their current housing costs exceed 30% of their household income. Financial pressures on Creatives are further compounded by a lack of music work (55%) and insufficient time for creativity (46%). Venue/Presenters also face challenges, particularly with talent costs (68%), marketing production (43%), and post-COVID fan behavior issues (38%). 76% of respondents prefer a smoke-free environment, 78% have health insurance, and 53% own their homes.
LIVABILITY (cont.)


MUSIC-FRIENDLY POLICIES
Presenter Challenges
• Talent costs rank as the highest challenge, with 68% of respondents indicating it as a significant issue. Marketing production is another major concern, with 43% ranking it high. Post-COVID fan behavior and insurance costs are also notable challenges, affecting 38% and 28% of respondents, respectively. Regulatory costs and compliance time are highlighted by 16% and 6% of respondents as significant issues. Sound policy and inspections are also considered challenges, though to a lesser extent.

KEY INSIGHTS

Performance Opportunities
• Tulsa's music community needs more performance opportunities in general and with Venue/Presenters averaging roughly one performance/week it seems there is room to grow. Tulsa also needs more diverse and affordable performance venues. Smaller and non-bar venues are particularly needed to provide more opportunities for local musicians.
Professional Development
• There is a high demand for training in booking, event production, marketing strategies, and audio/video recording. Improved networking opportunities and resources for professional growth are also essential.
KEY INSIGHTS (cont.)
Venue/Presenter Barriers
• Talent costs, marketing production, and post-COVID fan behavior are significant market challenges. Simplified and more efficient regulatory processes, including better sound policies and permit management, are necessary.
FinancialAssistance
• Financial support is a critical need, with strong preferences for micro-grants, tax breaks, and discounted services. These measures could help alleviate the economic pressures faced by the music community.
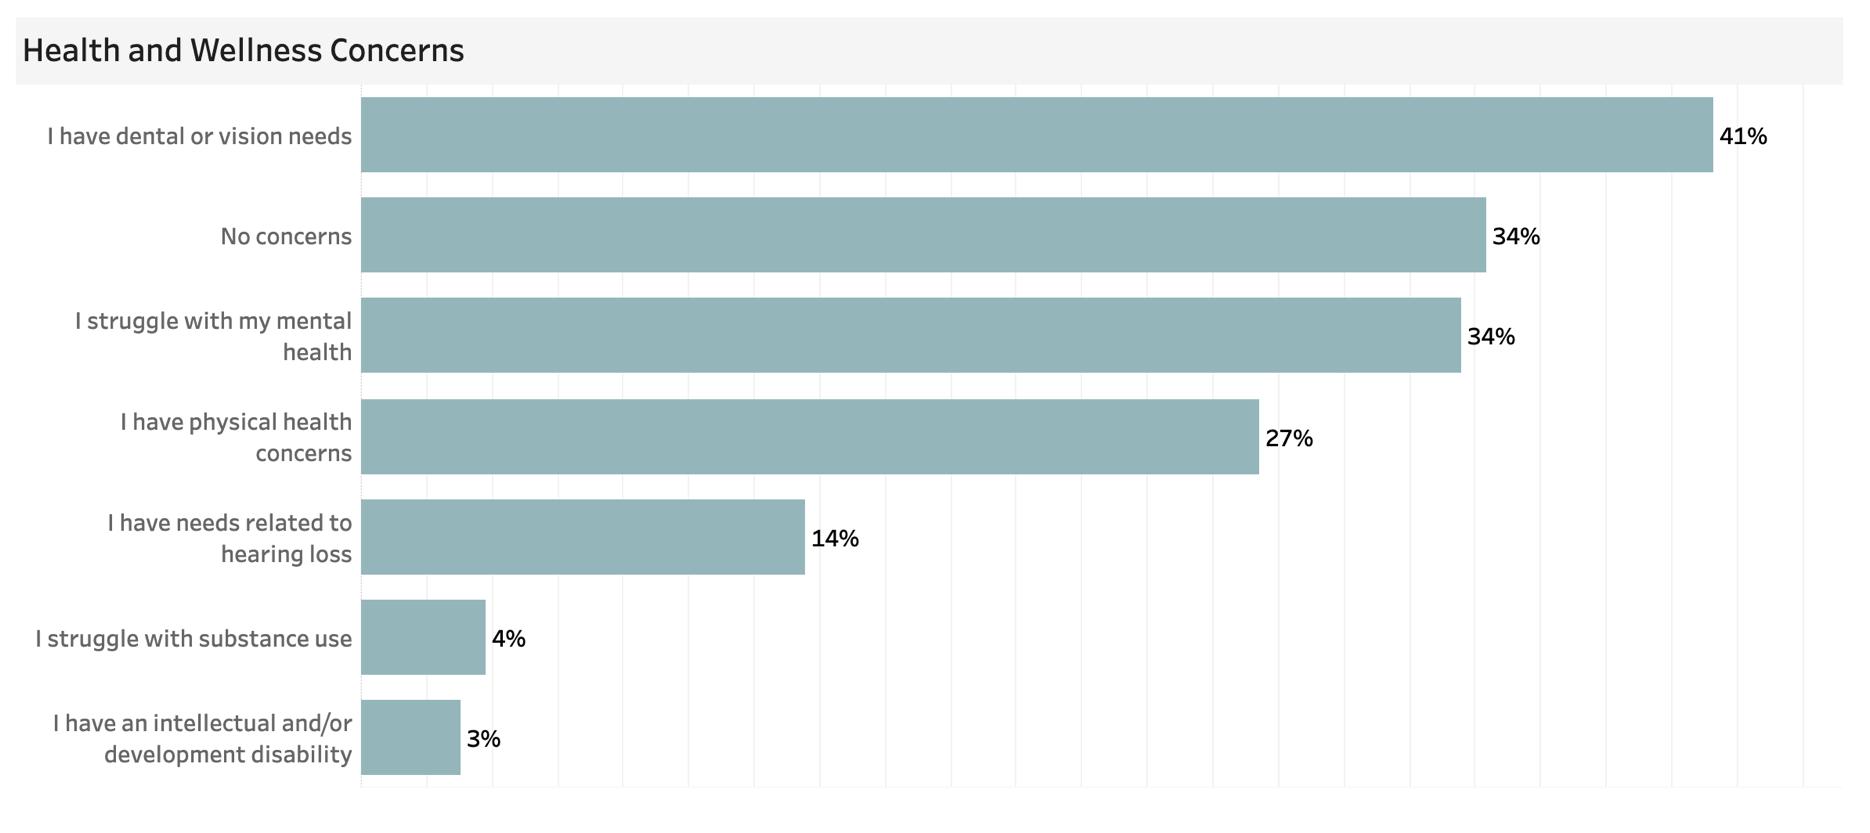
Health and Safety Preferences
• A significant majority of respondents (76%) prefer smoke-free environments. Additionally, health insurance coverage is an essential aspect of livability, with many relying on employer-provided or government programs and 22% uninsured.
OPPORTUNITIES
Enhance Professional Development Programs: Offer training in booking, event production, marketing, and audio/video recording, alongside improved networking opportunities.
Simplify Regulatory Processes: Address challenges related to sound policies, and permit management through streamlined regulatory frameworks.
Increase Financial Support: Provide micro-grants, tax breaks, and discounted services to alleviate financial pressures on the music community.
Strengthen Health and Safety Measures: Ensure more venues are smoke-free and improve access to health insurance, vision services, and dental services for music professionals.
OPPORTUNITIES (cont.)
Boost Local and National Recognition: Develop programs to increase the visibility of Tulsa's music scene locally and nationally,.
Promote and Sustain Inclusivity: Continue to foster an inclusive environment by involving more women and underrepresented groups.
Create a Central Hub: Establish a centralized communication and support hub (likely virtual) for the music community and other creative sectors to enhance collaboration and resource sharing.
QUESTIONS?
THANK YOU, PARTNERS!