MAKING SENSE OF STANDARDIZED ASSESSMENTS TO UNDERSTAND MY CHILD’S LEARNING PROGRESS
PARENT EDUCATION SERIES
MONDAY, JUNE 3, 2024

PARENT EDUCATION SERIES
MONDAY, JUNE 3, 2024
¡ MAP testing was developed by Northwest Education Associates in 2000.
¡ They are:
¡ A collection of computerized, adaptive tests in reading, language usage and math that benchmark students
¡ Administered three times per year
¡ Compared to 2020 national norms from pre-pandemic years (2015-2018) sampled from 3.5 to 5.5 million test scores
¡ Benchmark assessments identify students’ academic strengths and areas for growth to support
¡ Future instruction
¡ Support success on later summative and achievement testing
¡ Benchmark assessment is designed to be low-stakes to inform student progress and instruction
¡ Determining small-groups for reading and math instruction
¡ Conversations about academic progress with teachers


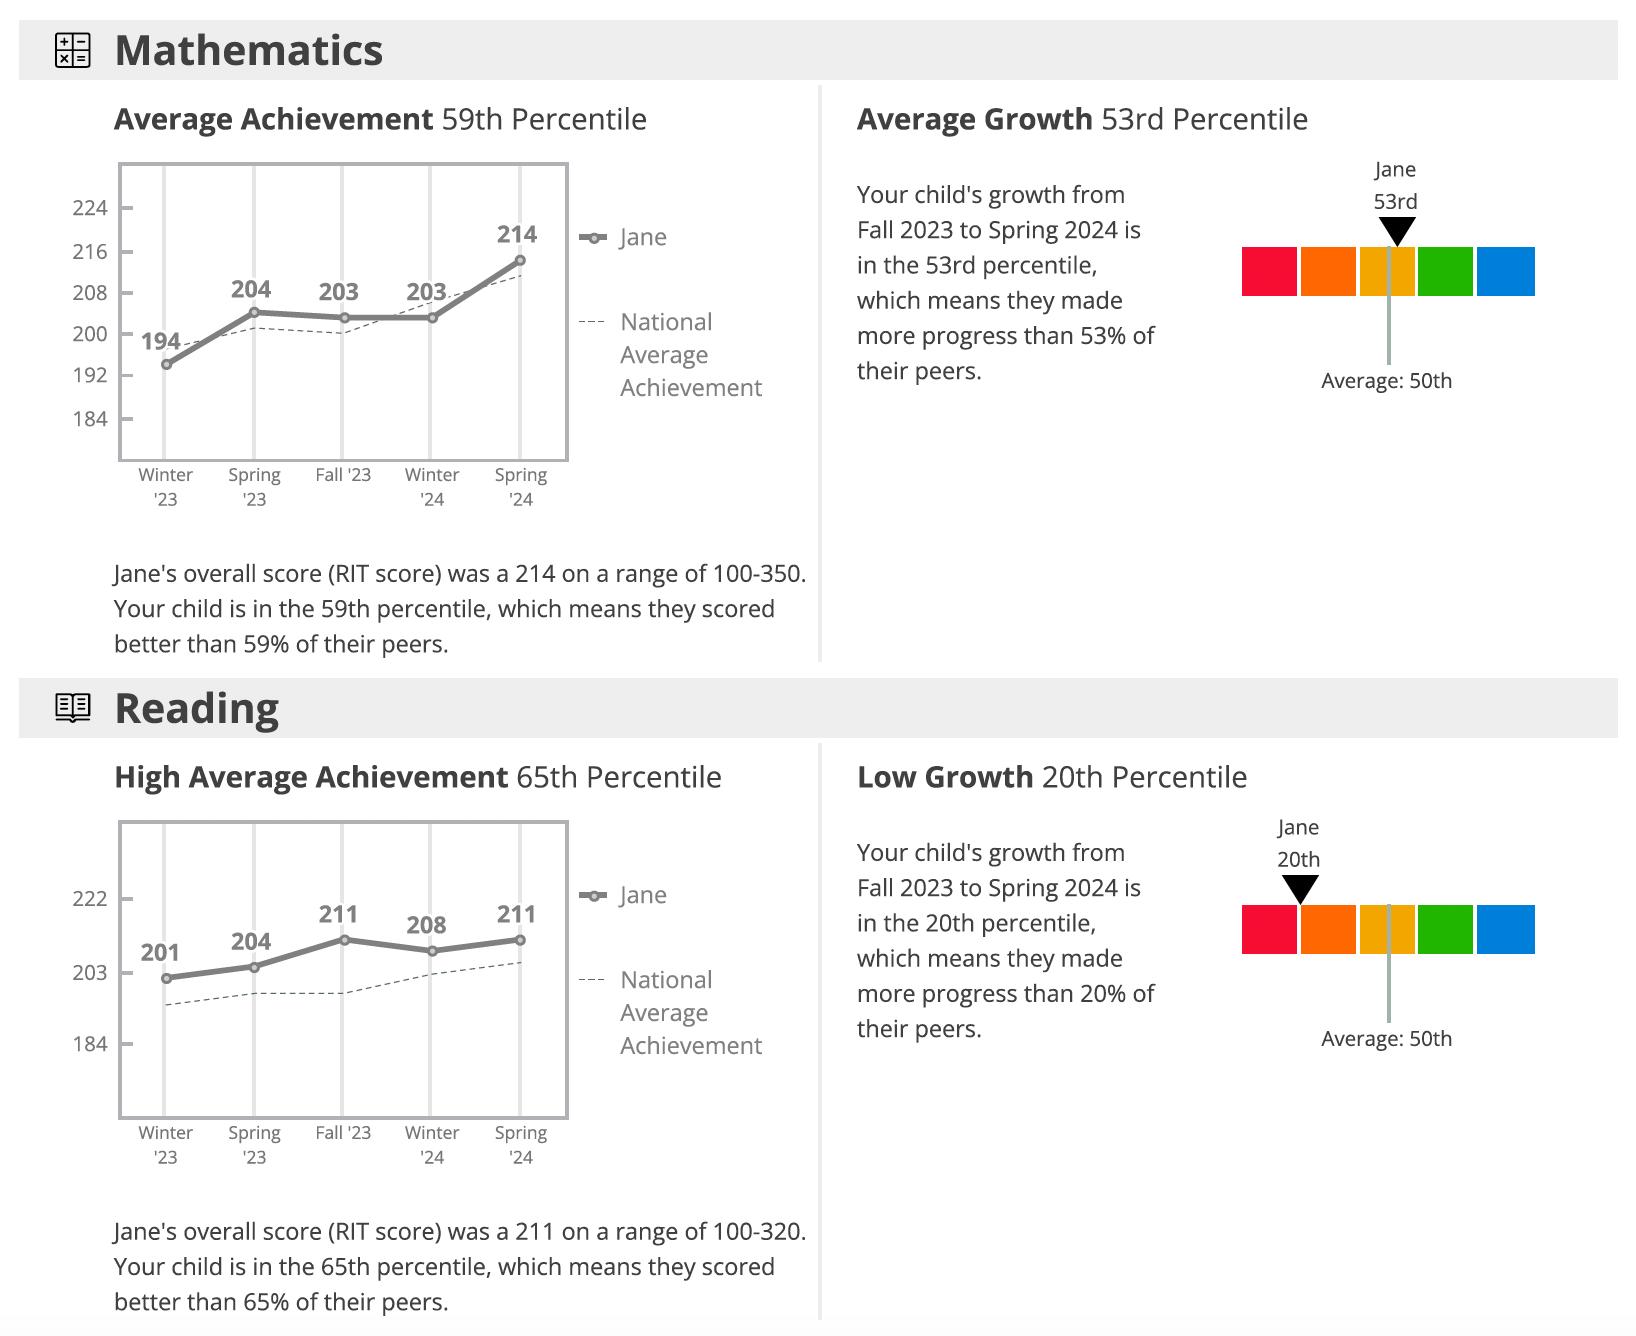
¡ RIT (Rausch Unit Scale) measures student achievement across grade levels
¡ RIT scale is stable, meaning that the space between scores is consistent regardless of the student’s grade level
¡ RIT scale is not grade-specific, helping teachers see what students are ready to learn regardless of the grade level
¡ Growth compares your child to typical growth for a student starting from the same achievement level in the same grade level and subject area
¡ Growth scores are measured in quintiles
¡ Red: 1st-20th percentile
¡ Orange: 21st-40th percentile
¡ Yellow: 41st-60th percentile
¡ Green: 61st-80th percentile
¡ Blue: 81st-99th percentile
¡ MAP is a snapshot in time, and we administer it multiple times a year to look for trends
¡ MAP scores can be affected by:
¡ How the student was feeling that day
¡ The time and attention the student gave
¡ Question selection
¡ CTPs were developed by the Education Records Bureau (ERB)
¡ They are
¡ An assessment of achievement in language arts and mathematics, along with verbal and quantitative reasoning ability
¡ Administered once per year in Sixth and Seventh Grades
¡ Guidance for how a student might perform on high school entrance exams, such as the ISEE or SSAT
¡ Achievement tests determine content mastery
¡ Provides insight into an individual student’s and a class’s academic strengths and areas for growth to
¡ Guide instruction
¡ Allow comparison of our students to other independent school students


¡ Achievement
¡ Vocabulary
¡ Reading Comprehension
¡ Writing Mechanics
¡ Writing Concepts and Skills
¡ Mathematics
¡ Ability
¡ Verbal Reasoning
¡ Quantitative Reasoning
¡ Scale score – allows for comparison of a student’s achievement year over year by putting scores on a consistent scale
¡ Percentile – compares students' performance to other students at a particular grade, it is not a percent of mastery
¡ Stanine – breaks student performance into nine groups
¡ Stanines 1-3: Below Average
¡ Stanines 4-6: Average
¡ Stanines 7-9: Above Average
¡ Identify areas of strength and areas for growth in our program compared to other independent schools
¡ Provide guidance to families in preparing for high school entrance exams
¡ Inform discussions around the high school search process
¡ MAP is used in Third through Eighth Grade to provide:
¡ Understanding into a student’s strengths and areas for growth
¡ Useful data for planning instruction
¡ Insight for discussion around curricular planning
¡ CTP is used in Sixth and Seventh Grade to provide:
¡ A point of comparison between our students and other independent school students
¡ Information for the high school search process
¡ Comparisons of MAP and CTP to internal assessments
¡ Flyleaf reading assessments
¡ Projects and essays in reading
¡ Projects and assessments in social studies
¡ Unit assessments for math
¡ Projects, labs and assessments in science ¡ AIMSWEB
¡ Teacher observations