


Economy • Environment • Society
The Southeastern Massachusetts Metropolitan Planning Organization (SMMPO) through the Southeastern Regional Planning and Economic Development District (SRPEDD) operates its programs, services, and activities in compliance with federal nondiscrimination laws including Title VI of the Civil Rights Act of 1964 (Title VI), the Civil Rights Restoration Act of 1987, and related statutes and regulations. Title VI prohibits discrimination in federally assisted programs and requires that no person in the United States of America shall, on the grounds of race, color, or national origin (including limited English proficiency), be excluded from participation in, be denied the benefits of, or be otherwise subjected to discrimination under any program or activity receiving federal assistance. Related federal nondiscrimination laws administrated by the Federal Highway Administration, the Federal Transit Administration, or both prohibit discrimination on the basis of age, sex, and disability. These protected categories are contemplated within SRPEDD’s Title VI Programs consistent with federal interpretation and administration. Additionally, SRPEDD provides meaningful access to its programs, services, and activities to individuals with limited English proficiency, in compliance with US Department of Transportation policy and guidance on federal Executive Order 13166.
Individuals seeking additional information or wishing to file a Title VI/Nondiscrimination complaint may contact the SRPEDD Title VI/Nondiscrimination Coordinator at the contact information here. All such complaints must be received, in writing, within 180 days of the alleged discriminatory occurrence. Assistance will be provided, upon request, to individuals unable to provide the complaint form in writing.
Title VI Coordinator - SRPEDD
88 Broadway, Taunton, MA 02780
Phone: 508 824-1367 or dial 711 to use MassRelay
Email: aduarte@srpedd.org
Massachusetts Public Accommodation Law (M.G.L. c 272 §§92a, 98, 98a) and Executive Order 526 section 4 also prohibit discrimination in public accommodations based on religion, creed, class, race, color, denomination, sex, sexual orientation, nationality, disability, gender identity and expression, and veteran’s status, and SRPEDD and the SMMPO assures compliance with these laws. Public Accommodation Law concerns can be brought to SRPEDD’s Title VI /Nondiscrimination Coordinator or to file a complaint alleging a violation of the state’s Public Accommodation Law, contact the Massachusetts Commission Against Discrimination within 300 days of the alleged discriminatory conduct.
The SMMPO is equally committed to implementing federal Executive Order 12898, entitled “Federal Actions to Address Environmental Justice in Minority Populations and Low-Income Populations” and Executive Order 13985 (2021) entitled “Advancing Racial Equity and Support for Underserved Communities Through the Federal Government.”
In this capacity, the SMMPO identifies and addresses disproportionately high and adverse human health or environmental effects of its programs, policies, and activities on low-income and minority, including BIPOC, Asian or Pacific Islander populations, as well as religious minorities, LGBTQ+ persons, Limited English Proficient (LEP) persons or those who have a disability. The SMMPO carries out this responsibility by the consistent, fair, just, and impartial treatment of all individuals, and by involving underserved individuals in the transportation process and considering their transportation needs in the development and review of the SMMPO’s transportation plans, programs and projects.
English: If this information is needed in another language, please contact the MPO Title VI Coordinator at 508-824-1367 ext. 235 or at aduarte@srpedd.org
Spanish: Si necesita esta información en otro idioma, por favor contacte al coordinador de MPO del Título VI al 508-824-1367 ext. 235 o en aduarte@srpedd.org .
Portuguese: Caso estas informações sejam necessárias em outro idioma, por favor, contate o Coordenador de Título VI da MPO pelo telefone 508-824-1367, Ramal 235 ou em aduarte@ srpedd.org .
Haitian Creole: Si yon moun bezwen enfòmasyon sa a nan yon lòt lang, tanpri kontakte Koòdonatè a Title VI MPO nan 508-824-1367 ext. 235.
Simplified Chinese: 如果需要其他语言的此信息,请致电 508-824-1367 分机联系 MPO Titl e VI 协调员。 235 或发送电子邮件至 aduarte@srpedd.org 。
Simplified Chinese: 如果需要其他语言的此信息,请致电 508-824-1367 分机联系 MPO Titl e VI 协调员。 235 或发送电子邮件至 aduarte@srpedd.org 。
Traditional Chinese: 如果需要其他語言的此信息,請致電 508-824-1367 分機聯繫 MPO Tit le VI 協調員。 235 或發送電子郵件至 aduarte@srpedd.org 。
Mon Khmer Cambodian (Khmer): ប្រសិនបើព័ត៌មាននេះត្រូវការជាភាសាផ្សេង សូម ទាក់ទងអ្នកសម្របសម្រួល MPO Title VI តាមរយៈលេខ 508-824-1367 ext ។ 235 ឬនៅ aduarte@srpedd.org ។

This report was made possible with funding from the following sources:
U.S. Economic Development Administration
Massachusetts Community Compact Cabinet
District Local Technical Assistance
Maps produced by SRPEDD are for the sole purpose of aiding regional planning decisions and are not warranted for any other use. This map is not intended for engineering, legal, or survey purposes.
This report was prepared by the Southeastern Regional Planning and Economic Development District (SRPEDD):
Jeffrey Walker, AICP; Executive Director
ENVIRONMENTAL PLANNING
Danica Belknap, CC-P; Environmental Planning Manager
Michelle Tinger; Assistant Director of Environmental Planning
Karen Pettinelli; Principal Natural Resource Planner
Audrey Matthews; Senior Climate Planner
Lauren Lunetta; Environmental Planner
Cecelia Lagomarsino; Environmental Planner
Helen Zincavage, AICP; Environmental Planning Manager (former)
COMPREHENSIVE PLANNING
Grant King, AICP; Deputy Director/Comprehensive Planning Manager
Robert Cabral; Assistant Comprehensive Planning Manager
Lizeth Gonzalez; Director of Economic and Community Development
Taylor Perez; Director of Housing and Research Initiatives
Chris Welch; Principal Comprehensive Planner
Maria Jones; Senior Public Engagement and Communications Planner
Amber Davis; Senior Comprehensive Planner
Laura Tsang; Senior GIS and Data Planner
Danyel Kenis; Urban Design Planner
Aubrey Hoes; Comprehensive Planner
Kaitlin Whalen; Comprehensive Planner
Emily Duseau; Comprehensive Planning Intern (former)
HOMELAND SECURITY
Kevin Ham; Director of Homeland Security
Joseph Monet; Homeland Security Specialist/Comprehensive Planner
TRANSPORTATION PLANNING
Lisa Estrela-Pedro; Transportation Planning Manager
Jackie Jones, AICP; Assistant Director of Transportation Planning
Sean Hilton; Senior Transportation Planner
Noah Soutier; Public Health and Transportation Planner

Prosperity and continued growth depend in part on a region’s ability to predict, prevent, withstand, and recover from disruptions to its economic systems. While acknowledging that these disruptions often originate from larger market changes, regional, national, or even international industry downturns, and other external shocks, our region seeks to build lasting economic resilience by anticipating risks, evaluating their potential impact on economic assets, and building responsive capacity. In the context of the SRRP, economic resilience is defined in three categories of needs that address diversifying the economy, providing a sustainable future for utilities networks, and supporting resilient transportation models.
Best Practice #1: Upgrade existing public water infrastructure.
Best Practice #2: Provide resources and programming to increase awareness around water quality.
Best Practice #3: Increase awareness of water conservation tactics.
Best Practice #1: Upgrade existing wastewater infrastructure.
Best Practice #2: Implement Green Infrastructure.
Best Practice #3: Increase regional coordination.
Best Practice #1: Pursue and support municipal fiber networks.
Best Practice #2: Increase awareness of lifeline and the comcast internet essentials program.
Best Practice #1: Support the offshore wind industry and encourage new projects.
Best Practice #2: Increase awareness and accessibility to solar PV systems.
Best Practice #3: Plan for long-term electrification and natural gas transitioning.
Best Practice #4: Increase participation in statewide clean energy programs.
Most communities in the SRPEDD region have access to public water, though the extent of access varies widely. There are a fair number of inter-municipal agreements (IMAs) involving the exchange of water treatment and/or distribution for consumption. Almost all towns in the region, with the exception of Carver, Rehoboth, and Seekonk, have some form of an IMA that involves shared water resources.
Some of the primary sources of water for the region are the Assawompset Pond Complex, the Mattapoisett River Valley, and the Taunton River Basin.
Increased flood events and precipitation are putting a strain on existing water infrastructure. Many wastewater treatment facilities in the region have been pushed over capacity from stormwater infiltration during heavy rains, leading to untreated effluent overflowing into nearby bodies of water or soil. Further, a significant and/or sudden increase in hydraulic load can induce stress on microorganisms essential for treating wastewater and breaking down certain hazardous materials. This added stress can kill off the microorganisms, effectively decreasing water quality exiting the treatment facility. Additionally, a lack of stormwater infrastructure can lead to increased presence of pesticides, insecticides, and other pollutants from runoff in local public water supplies and sensitive ecosystems. This can cause eutrophication, increase the risk of tick and mosquito-borne diseases, and endanger drinking water quality.
Additional contaminants can make their way into public water supplies from aging/failing septic systems. While soil can filter most bacteria and viruses in wastewater, it cannot remove all contaminants, including medicines, cleaning products, and other chemicals. When a septic system fails or is severely inundated during a flood event,1 untreated sewage may surface and can leach into surface waters or drinking wells via cracks or the well cap.2 Released nitrogen from septic systems can also accumulate to unsafe levels in drinking water and cause a number of environmental hazards.3
Another known concern in public water supplies is the presence of per- and polyfluoroalkyl substances (PFAS). PFAS have been used in manufacturing for years and are found in clothing, furniture, packaging, non-stick cooking surfaces, and many other products. These chemicals are man-made and do not break down in the environment. Since PFAS do not break down and can move through soils, they can accumulate in water and in wildlife.4 While research is still ongoing to determine the full list of effects of PFAS on humans, it is believed that these chemicals can affect fertility, fetal development, hormones, and the body’s immune system. They are also believed to increase the risk of certain cancers. Several communities in the region reported concerns about PFAS concentrations in the local water supply in their Water Management Plans, including Carver, Plainville, and Raynham, though the problem is widespread throughout the region and the state. This problem is discussed in detail in the Provide Drinking Water section of this report.
In addition to contaminants, the actual availability of potable water is a concern for many communities in the Southeast. Increased drought events, such as the ones that occurred in 2016-2017, 2020, and 2022,5 put pressure on local public water supplies and have led to communities needing to tap into emergency water supplies.6 Some communities, such as Swansea, have turned to alternative sources of water via desalination, though these alternative measures can be costly.
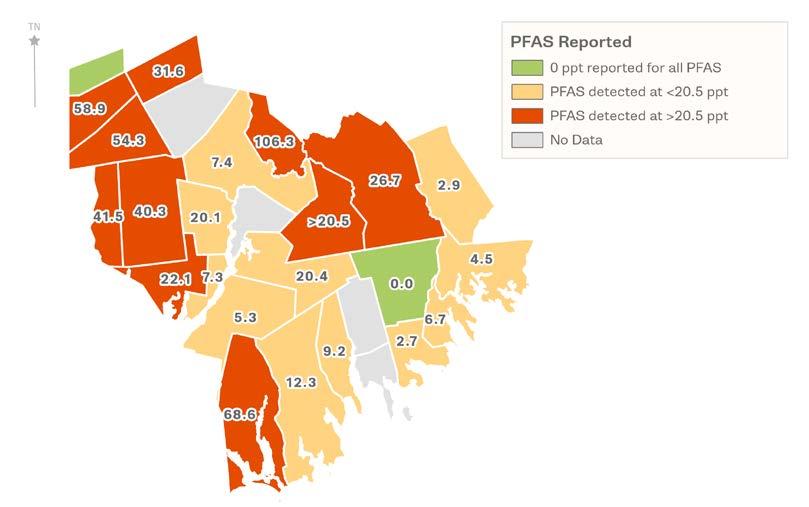
Source: Sierra Club.
1. Aging/Outdated Infrastructure: Much of the Southeast’s water infrastructure is aging. Aging infrastructure is more susceptible to infiltration and contamination during storm events. Additionally, lead present in old service lines can leach into drinking water.
2. Sensitive Infrastructure: Many communities rely on municipal wells or private wells for drinking water. Residents with private wells may lose access to their water supply during storm events if the power goes out. Wells can also dry out during drought events. Additionally, residents are responsible for maintaining the water quality of their wells, which can be contaminated by fertilizers, chemicals, and nearby septic systems.
3. High Costs: Water infrastructure, including wells and public water supplies, are costly to install and maintain.
4. Presence of Contaminants: Combined Sewer Overflow events endanger local drinking supplies and the ecosystems that support them. Additionally, the presence of PFAs, lead, nitrogen, bacteria, and other contaminants in drinking water poses public and ecological health risks.
A resilient water supply must be safe, accessible during extreme weather events, and affordable. For communities with limited public water, this means promoting emergency preparedness, maintaining municipal wells, and facilitating necessary upgrades to private wells. For communities with existing public water networks, this means ensuring safe drinking water at affordable rates.
T2-T6: Communities should prioritize and implement upgrades to aging water systems, develop and maintain emergency water plans, and utilize available funding programs (such as those through MassWorks or CDBG) to ensure water is affordable, safe, and accessible for all.
Like wastewater infrastructure, public water infrastructure is aging. Municipalities should prioritize upgrades in key areas to ensure residents and commercial users have access to safe drinking water.
There are numerous programs at the state and federal level designed to support infrastructure improvements, including programs specifically geared towards drinking water infrastructure. Communities can individually apply for these programs or work with SRPEDD, other public agencies, or private consultants to tap into these funds to support their infrastructure improvement needs. Many of these programs overlap with those addressed in the Wastewater section of this plan. These include (but are not limited to):
• Massachusetts State Revolving Fund Program (SRF): The State Revolving Fund (SRF) financial assistance program offers affordable financing options to cities, towns, and public water utilities to improve water infrastructure and drinking water safety. The program helps communities comply with federal and state water quality requirements of wastewater treatment plants and collection systems, evaluate issues related to watershed management priorities, stormwater management, green infrastructure, and provides financial assistance to communities to implement their community septic management programs that make available loans to homeowners with failed septic systems.
• MassWorks (One Stop for Growth Program): A competitive grant program that provides capital funds for public infrastructure projects that support growth.
• HousingWorks (One Stop for Growth Program): A competitive grant program that provides capital funds for infrastructure projects that support housing development.
• Sections 319 and 604b Grant Programs (MassDEP/EPA): Competitive grant programs that support planning for and implementing measures that protect water quality and target nonpoint source pollution.
• Planning Assistance Grants (EOEEA): A competitive grant program that supports planning for sustainable land use practices.
• Community Development Block Grants [CDBG] (EOHLC): A competitive grant program that distributes federal CDBG funds from the U.S. Department of Housing and Urban Development (HUD) to support needs for housing, infrastructure, economic development, revitalization, and public social services.
• Lead Service Line Replacement Program (MA Clean Water Trust/ MassDEP): A program offering 0% interest construction loans and planning grants to support lead service line inventorying and replacement.
• Water & Environmental Programs (USDA Rural Development): A program that provides loans and grants for drinking water, sewer, and storm drainage facilities in rural areas and municipalities with a population of 10,000 people or less.
• Community Development Block Grants (HUD): A program that distributes funding to “Entitlement Communities” to provide livable housing and expanded economic opportunities for low- and moderate-income people.
Private well owners are responsible for maintaining the quality of their drinking water. Municipalities should work to ensure owners are aware of their options for testing, treatment, and maintenance of their wells. This can be accomplished through educational workshops, informational campaigns, and collaboration with local health departments or environmental groups. This can be further incentivized through public recognition programs that highlight communities with the highest clean water rates.
The Town of Middleborough has several wells with higher concentrations of PFAs than the Maximum Contaminant Level (MCL) allows. Through coordinated outreach, the Town was able to work with a well-known resident group to educate the public and promote resources regarding PFAs in municipal drinking water sources, which has greatly aided their efforts to address ongoing water quality issues townwide.
T2-T6: To increase awareness around water quality and support private well owners, municipalities should host educational workshops, launch targeted informational campaigns, and collaborate with local health departments and environmental groups to provide accessible testing and treatment services. Additionally, they should create public recognition programs to incentivize high water quality standards, develop online resources, send annual reminders for testing and maintenance.
Given increasing rates of drought events, water conservation measures will be crucial to implement throughout the region. There are many ways communities can conserve water and prepare for drought events, from simple tactics such as water reuse to complex tactics such as creating a large-scale desalination plant. In most cases, communities should begin with the least intense interventions, namely stormwater capture and re-use (usually for non-potable purposes), increasing access to low-flow plumbing, and educational campaigns to teach household-level water conservation tips.
Some common water conservation methods for residential uses include:
• Identifying and fixing any water leaks;
• Installing low-flow plumbing, including faucets, showerheads, and toilets;
• Fully loading dishwashers and washing machines before running;
• Minimizing outdoor landscape watering; and
• Minimize draining pools in the summer and cover them when not in use.
It is important to note that, while residential reductions in water usage are important, water is primarily used for electricity generation and agriculture.7 Any concerted effort to reduce residential water consumption must also be mirrored by efforts to reduce commercial and industrial water consumption.

Plymouth is currently undergoing a period of rapid development. To accommodate for the town’s sole-source aquifer and water-dependent economic base, Plymouth has put a stronger emphasis on water conservation through a ‘Save Water’ campaign established by the Plymouth Water Conservation Committee.
Southeastern Massachusetts manages sewer systems collaboratively through regional initiatives and partnerships among municipalities. Key efforts include regional sewer districts such as the Greater New Bedford Regional Refuse Management District and the Upper Blackstone Water Pollution Abatement District, collaborative projects with organizations like the Buzzards Bay Coalition, regional sewer expansion projects, and stormwater management through Municipal Separate Storm Sewer Systems (MS4). The Massachusetts Department of Environmental Protection (MassDEP) provides grants and assistance to support these efforts.
Across the region, sewer service areas are generally concentrated in urban and densely populated towns, while rural and suburban regions rely heavily on septic systems. Key sewer service areas include the Greater New Bedford Area, Fall River, and Wareham. In the surrounding suburban communities, the network is usually limited; in rural communities, it is often minimal or non-existent. Efforts are ongoing to expand sewer services and improve wastewater management, reducing the environmental impact of septic systems in vulnerable areas. High densities of septic systems in towns like Wareham, Westport, and Marion contribute to nitrogen pollution, affecting the health of coastal ecosystems and water quality in Buzzards Bay. Areas with extensive sewer service host their own wastewater treatment facilities (WWTFs) or water pollution control facilities (WPCFs).
Several cities and towns treat neighboring communities’ wastewater through inter-municipal agreements (IMAs). Fall River hosts a regional WWTF, which processes flows from Freetown, Westport, and Tiverton. New Bedford, North Attleborough, Somerset, and Taunton also have IMAs with nearby communities. Additionally, the towns of Mansfield and Norton formed a regional wastewater district with Foxborough. The three towns’ wastewater is treated at the Nortonlocated MFN (Mansfield-Foxborough-Norton) Regional WPCF.
Table 1. Sewer availability by municipality.
Municipality
Sewer Availability
Wastewater Treatment Facility
Acushnet Extensive New Bedford WWTF
Attleboro Extensive Attleboro WWTF
Berkley None -
Carver None -
Dartmouth Extensive Dartmouth WPCF
Dighton Limited Taunton WWTF
Fairhaven Extensive Fairhaven WPCF
Fall River Extensive Fall River Regional WWTF
Freetown Limited Fall River Regional WWTF
Lakeville None -
Mansfield Extensive MFN Regional WPCF
Marion Extensive Marion WWTF
Mattapoisett Limited Fairhaven WPCF
Middleborough Extensive Middleborough WWTF
New Bedford Extensive New Bedford WWTF
North Attleborough Extensive North Attleborough WWTF
Norton Extensive MFN Regional WPCF
Plainville Limited North Attleborough WWTF
Raynham Extensive North Main St Treatment Facility John P. Lynn Treatment Facility
Nip Treatment Facility
Rehoboth No -
Rochester No
Seekonk No
Somerset Extensive Somerset WPCF
Swansea Limited Somerset WPCF
Taunton Extensive Taunton WWTF
Wareham Extensive Wareham WPCF
Westport Limited Fall River Regional WWTF
The state also focuses on water quality and management, utilizing detailed GIS mapping to delineate sewer service areas and wellhead protection zones. Wellhead protection areas are critical for safeguarding drinking water sources from contamination, especially in regions relying heavily on groundwater. This mapping is also crucial in areas that depend heavily on septic systems, highlighting regional disparities in sewer services and the resulting environmental impacts. These disparities are addressed through updated regulations, including new standards for contaminants like PFAS, which are essential for improving wastewater treatment and stormwater management.
Additionally, the management of Municipal Separate Storm Sewer Systems (MS4) plays a pivotal role in mitigating pollutant runoff into stormwater, which is vital for maintaining both environmental and public health. In southeastern Massachusetts, MS4 areas are primarily located in urbanized regions as defined by the U.S. Census. The MS4 permit applies to these urban areas and aims to manage stormwater to reduce pollution. The map above shows the automatically designated MS4 areas under the National Pollutant Discharge Elimination System (NPDES) Phase II Stormwater Program, based on the 2000 and 2010 U.S. Census data (the most current analysis available). These areas are required to adopt comprehensive stormwater management practices to protect water quality and comply with federal and state regulations.
Climate change and aging infrastructure will continue to strain local sewer networks. Increasing rainfall has caused significant flash flooding across the Southeast region and the state. These flash flooding events can contribute to inflow and infiltration (I&I) issues and overwhelm combined sewer systems, causing a combined sewer overflow (CSO). During a CSO, systems can discharge sewage, often untreated, into local waterbodies. In 2023, there were 1,943 sewage overflow events statewide. Fall River and New Bedford experienced some of the highest instances of these events in the state between April and September 2023.8
Table 2. Top five overflow events statewide. (EOEEA)
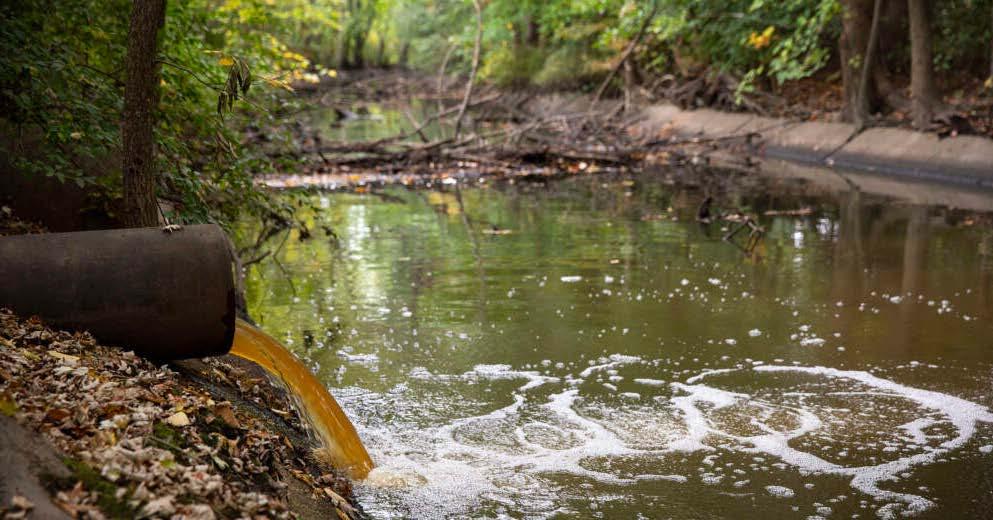
These overflows pose significant environmental and public health hazards. Discharge can contain harmful chemicals, pathogens, and trash, which can affect the local ecosystem and endanger residents who may not be aware of sewage in the water. Furthermore, these discharge events often occur in urban areas near environmental justice populations.
Where sewer is not present or widely available, many residents and businesses rely on septic systems to capture and treat wastewater. On average, a new septic system costs $20,000 in Massachusetts, with more complex systems costing upwards of $50,000.9 These prices can fluctuate depending on the local soil conditions and environmental regulations, where more challenging soils and stricter regulations can result in higher costs for residents and developers. These costs can inhibit new housing and economic and community development opportunities, posing significant financial challenges for homeowners with fixed or low/moderate incomes and small businesses.
Finally, concerns about nitrogen loading in estuaries and embayments are an important consideration when looking at the future of septic systems in Southeastern Massachusetts. Changes to Title V regulations in regions such as Cape Cod10 to reduce nitrogen loading will likely serve as a model for areas in the South Coast as the environmental impacts of septic systems are further studied.
1. Aging/outdated infrastructure: Much of the Southeast region’s sewer infrastructure is aging. This aging infrastructure is more likely to contribute to environmental hazards.
2. Limited infrastructure: Sewer infrastructure is limited or non-existent in smaller suburban and rural communities. This can hinder development opportunities.
3. High costs: Replacing septic systems and acquiring new sewer infrastructure is costly. This can make addressing wastewater issues difficult to achieve.
Resilient wastewater systems should output high-quality, treated effluence; they should also be able to handle excess capacity during storm events while still outputting at the same level of quality. These quality systems should be supported by strong governance structures that prioritize regionalization and resource sharing.
T2-T3: Rural and semi-suburban communities with limited or no public wastewater infrastructure should evaluate which areas in their community would need new infrastructure to foster economic development, the creation of new housing opportunities, and environmental protection. Once these areas have been identified, these communities should pursue funding to begin design and engineering studies (many grant programs for construction require or recommend projects at greater than or equal to 25% design), likely in partnership with a neighboring municipality with existing infrastructure, alongside robust public engagement campaigns.
T4-T6: Dense suburban and urban communities with existing public wastewater infrastructure should work to evaluate capacity needs and prioritize the highest-impact upgrades. Upon determining which areas have the highest need, these communities should pursue funding to begin design and engineering studies and/or construction.
Funding Sources: Community One Stop for Growth (MassWorks, HousingWorks), USDA, EDA, EOEEA, HUD and MA CDBG grants.
Aging infrastructure across the region, state, and nationally has led to increased pollution and environmental hazards, posing risks for both humans and the ecosystems we live within. Municipalities can pursue upgrades to their existing wastewater systems, prioritizing key upgrades in areas with the most severe need.
The state and federal government have many programs that support critical infrastructure planning and improvements. These include (but are not limited to):
• Massachusetts State Revolving Fund Program (SRF): The State Revolving Fund (SRF) financial assistance program offers affordable financing options to cities, towns, and public water utilities to improve water infrastructure and drinking water safety. In addition, the program helps communities comply with federal and state water quality requirements of wastewater treatment plants and collection systems, evaluate issues related to watershed management priorities, stormwater management, green infrastructure, and provides financial assistance to communities to implement their community septic management programs that make available loans to homeowners with failed septic systems.
• MassWorks (One Stop for Growth Program): A competitive grant program that provides capital funds for public infrastructure projects that support growth.
• HousingWorks (One Stop for Growth Program): A competitive grant program that provides capital funds for infrastructure projects that support housing development.
• Sections 319 and 604b Grant Programs (MassDEP/EPA): Competitive grant programs that support planning for and implementing measures that protect water quality and target nonpoint source pollution.
• Planning Assistance Grants (EOEEA): A competitive grant program that supports planning for sustainable land use practices.
• Community Development Block Grants [CDBG] (EOHLC): A competitive grant program that distributes federal CDBG funds from the U.S. Department of Housing and Urban Development (HUD) to support needs for housing, infrastructure, economic development, revitalization, and public social services.
• Water & Environmental Programs (USDA Rural Development): A program that provides loans and grants for drinking water, sewer, and storm drainage facilities in rural areas and municipalities with a population of 10,000 people or less.
• Community Development Block Grants (HUD): A program that distributes funding to “Entitlement Communities” to provide livable housing and expanded economic opportunities for low- and moderate-income people.
Communities can individually apply for these programs or work with SRPEDD, other public agencies, or private consultants to tap into these funds to support their infrastructure improvement needs.
T2-T4: Rural, semi-suburban, and suburban communities should explore opportunities to install small- and medium-scale green infrastructure in key areas, particularly those with large amounts of pavement/impervious surfaces and/or areas prone to flooding. Consider LID regulations an guidedance.
T5-T6: Urban communities should explore all forms of green infrastructure installation, focusing on differing areas of need and determining the appropriate best practice/scale. This can include limiting residential runoff by implementing small-scale green infrastructure programming to establishing community-wide tree planting programs for property owners.
Funding Sources: MassDEP 604b, SRF Program, MVP, and MS4 Municipal Assistance Grant Program; EPA UWSG and WIFIA; Rockefeller Foundation Environmental Impact Bond (EIB); NFWF and Wells Fargo Resilient Communities Program.
“Green infrastructure” is defined in the 2019 Water Infrastructure Improvement Act as “the range of measures that use plant or soil systems, permeable pavement or other permeable surfaces or substrates, stormwater harvest and reuse, or landscaping to store, infiltrate, or evapotranspiration stormwater and reduce flows to sewer systems or to surface waters.”11 Green infrastructure is the opposite of “gray infrastructure,” which refers to conventional stormwater management practices in place regionally and nationally, including gutters, pipes, and tunnels that move stormwater from the source to treatment facilities or water bodies. Green infrastructure is designed to mimic the natural water cycle, absorbing and filtering stormwater and runoff at the source.
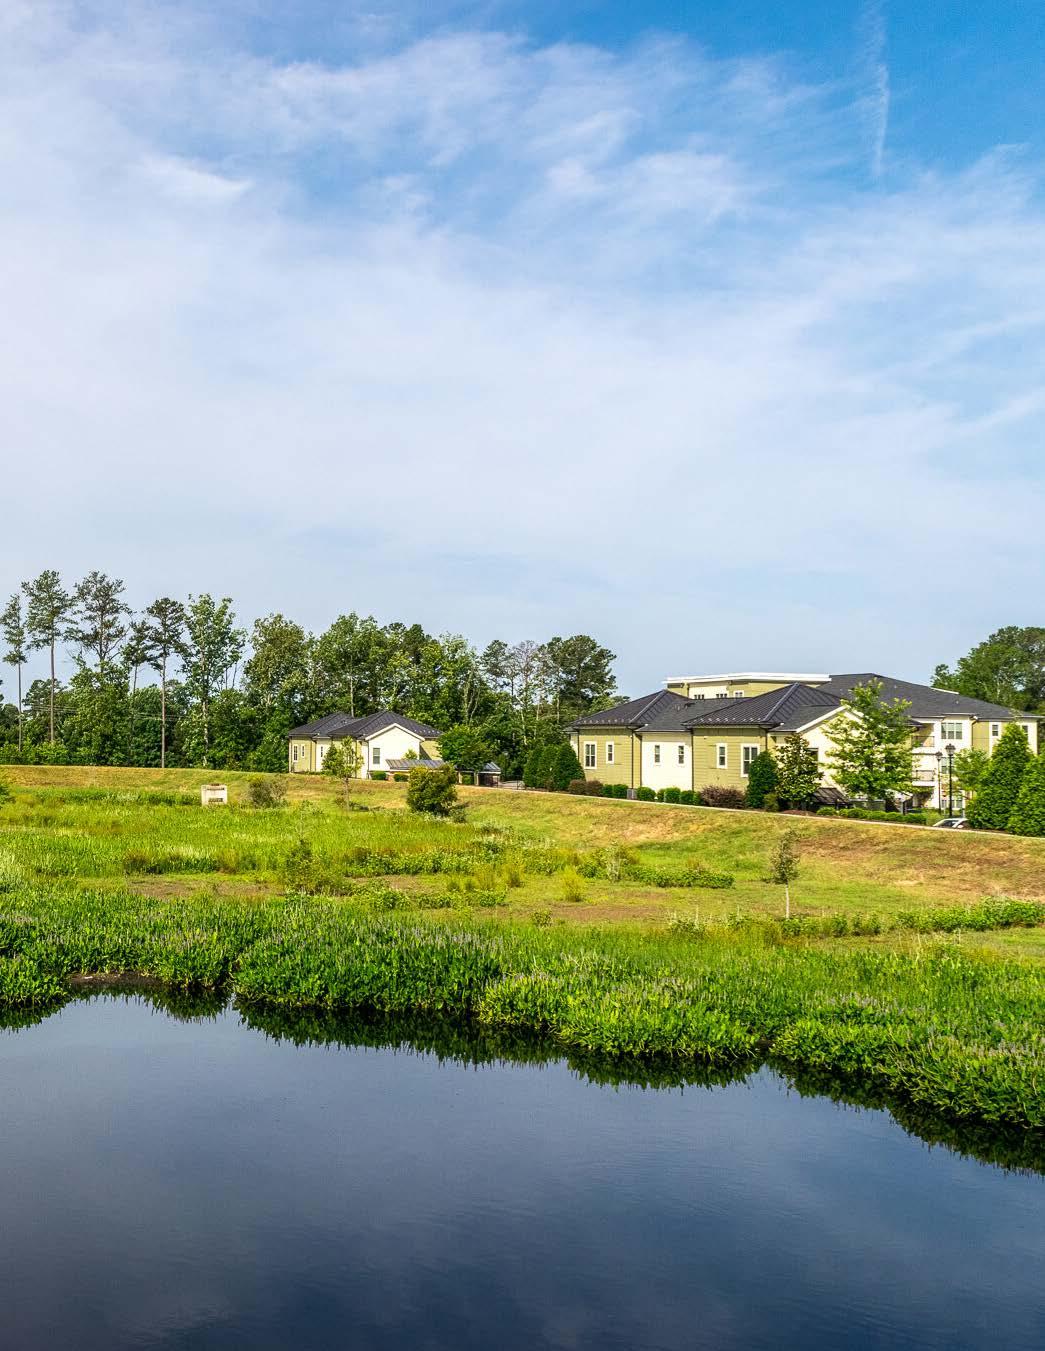
There are varying scales of green infrastructure, ranging from small-scale solutions such as rain barrels for homeowners, to large-scale solutions such as constructed wetlands. Some common types of green infrastructure include:
• Small-scale Green Infrastructure: This includes downspout disconnection, rain barrels, and rain gardens. These small-scale solutions aim to collect stormwater at the source, allowing it either to filter through permeable surfaces (rather than flow into the drainage system or local water bodies) or to be re-used.
• Medium-scale Green Infrastructure: This includes streetside planter boxes, bioswales, and permeable pavement. Like small-scale green infrastructure, these solutions are designed to capture and filter stormwater at the source to prevent runoff. However, these solutions are usually incorporated in parking lots, along streets, and adjacent to larger developments. Since they incorporate landscaping elements, they can also be used to beautify areas.
• Large-scale Green Infrastructure: This includes green walls/roofs, maintaining tree canopy cover, land conservation, and constructed wetlands. These tactics are designed to manage stormwater runoff at a large scale and can be ideal in urban areas where space is limited.
Depending on the need, communities can work to implement these green infrastructure solutions into their local regulations for stormwater management (often known as “Low Impact Development” or LID standards), design standards, and programming. Doing so can limit the risks posed by untreated runoff and minimize the strain on wastewater systems during storm events.
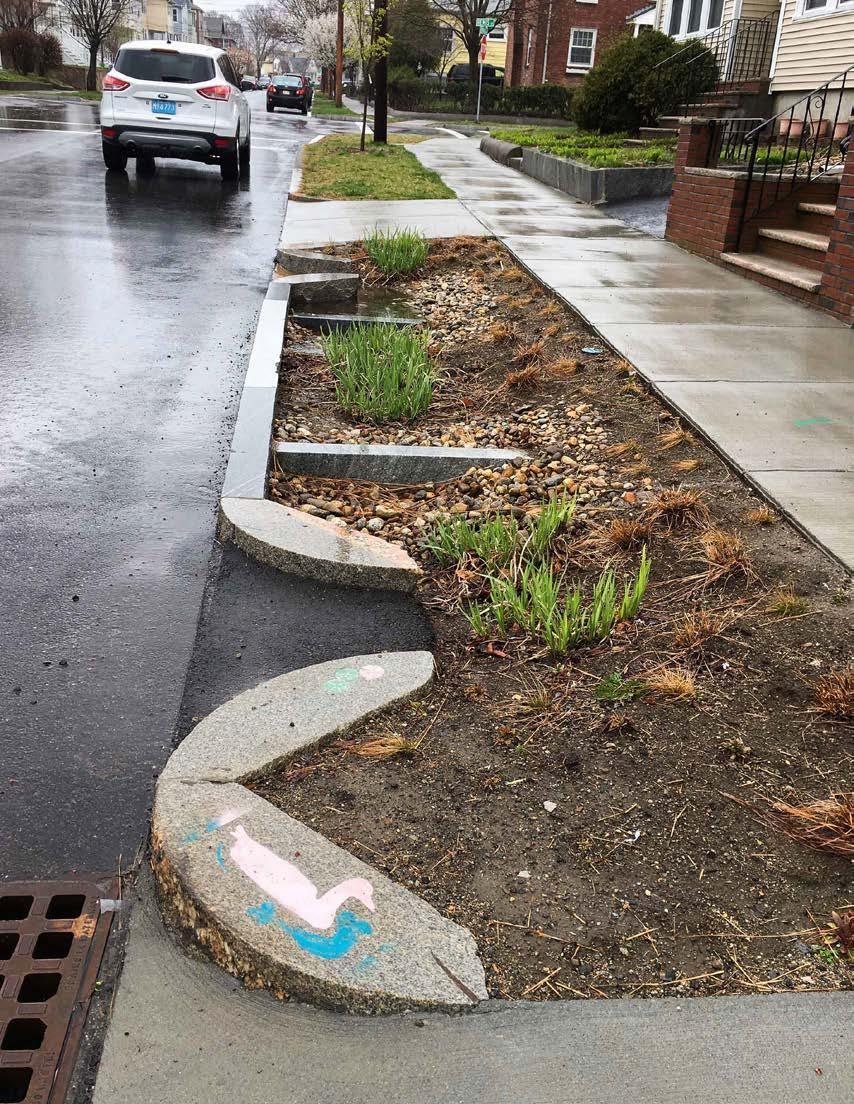
The City of Watertown was awarded a grant from MassDEP’s 604b EPA pass-through to fund various green infrastructure projects.12 Using the funds, the City installed several rain gardens, bioswales, and tree trenches, helping to limit runoff that would otherwise end up flowing, untreated, into the Charles River.
T2-T6: Smaller communities should partner with larger communities to explore opportunities to regionalize their wastewater infrastructure, sharing capacity where appropriate and mutually finding ways to increase costsavings and efficiency.
For communities with limited staff capacity and resources, coordinating with neighboring municipalities may be the best solution to increasing wastewater infrastructure access. Many of SRPEDD’s communities are already participating in an Intermunicipal Agreement. Strengthening these partnerships through increased coordination will help foster better outcomes for all members. This can include mutually pursuing funding for improvements that expand capacity and upgrade facilities, as well as sharing leadership roles and jointly managing responsibilities.
The Mansfield Foxborough Norton (MFN) Wastewater District was formed through a partnership and agreement between the Towns of Mansfield, Foxborough, and Norton in July 2014, the first wastewater district created in Massachusetts in over 20 years. The MFN Wastewater District owns and operates the MFN Regional Wastewater Facility, which is located within the Town of Norton. The 4.14 million gallons-per-day facility treats wastewater and septage from the three member towns, as well as from Easton and Sharon. Treated effluent is discharged into the Three Mile River. The facility is governed by a seven-member commission with representatives from each of the three towns, and was last upgraded in 2018, which added a new chlorine contact tank and secondary clarifier, as well as primary clariflocculation and a four-state biological treatment process.13 The upgrade increased regional capacity by 1 million gallons-per-day, increasing the wastewater flow allotments for all three towns and mutually reducing costs.
Access to reliable and affordable internet is essential to everything from going to school, scheduling a doctor’s appointment, paying bills, and applying for jobs. The majority of households in the Southeast region have access to broadband internet in their home. Broadband is defined as internet that is 100/20 Mbps (a measure of upload/download speed) or faster, a standard set the Federal Communications Commission (FCC). Currently, the average lowest price for broadband in the southeast region is $58 a month. Additionally, 71% of people in the southeast region who responded to the Massachusetts Broadband Institute’s (MBI) survey for the recent State Digital Equity Plan say that their monthly internet cost is either “very” or “somewhat” hard for them to afford. For 38% of households in southeastern Massachusetts, their internet bill is over $100 a month. In comparison to the rest of the state, residents in this area were more likely to say that the cost of an internet subscription prevents them from having an internet plan.14
One issue that people in the southeast note about their broadband service is the lack of choice when it comes to selecting an internet service provider. Many areas only have one prominent internet service provider, leading to a lack of choice and competition (often resulting in higher internet prices in these markets). In this region, the most common internet service providers are Comcast and Verizon. Other providers that operate in the area include Charter, the Taunton Municipal Lighting Plant (TMLP), and T-Mobile. TMLP operates a municipal fiber network that provides service to homes and businesses in parts of Taunton, Raynham, Berkley, Dighton, and Lakeville. Other towns in the region have municipal fiber networks that connect their municipal buildings, but not residential homes, including Acushnet and Seekonk. Additionally, the towns of Westport, Wareham, Middleborough, Mattapoisett, Lakeville, Fairhaven, Dighton, and Freetown have received Municipal Fiber Grant Funding between FY 2022 and FY 2024 to either create or expand a Municipal Fiber Network.15
The Cities of Taunton, Fall River, and New Bedford have the highest need for digital equity and broadband availability, access, and adoption in the SRPEDD region. In both Taunton and Fall River, 11% of households, and 10% of households in New Bedford, do not have internet access. In terms of current services, SRPEDD identified 138 digital equity assets in the region. This includes locations and organizations such as libraries that have free public wi-fi and hotspot lending programs, councils on aging that offer computer classes for seniors, and various nonprofits that provide digital skills training.
The Massachusetts Broadband Institute is currently funding a Municipal Digital Equity Planning Program which allows towns to create Municipal Digital Equity Plans at no cost to the town. These plans analyze the current state of internet use, access, service, and programs in a community. Based on these findings, the plan identifies implementation activities and projects to expand broadband service and digital equity in the community. In the SRPEDD region, Fairhaven, New Bedford, Wareham, Attleboro, Freetown, Swansea, Rochester, Marion, and Mattapoisett are enrolled.
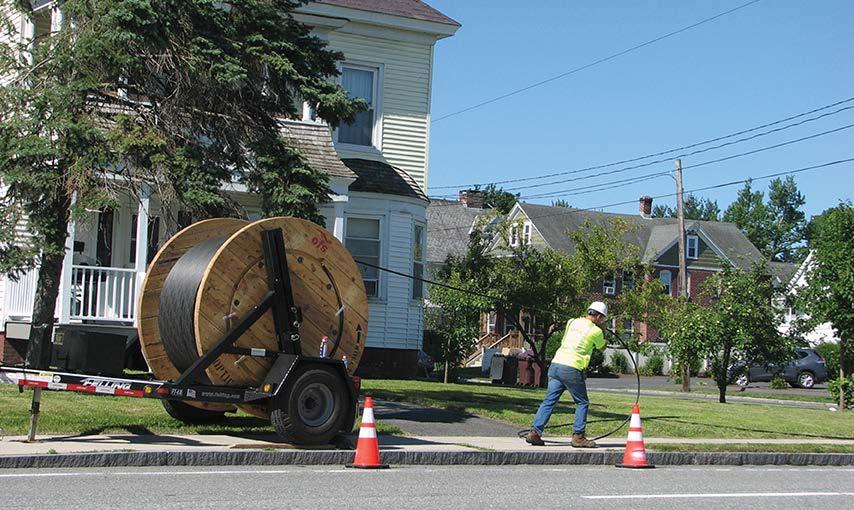
Table 3. Broadband access by municipality. (ACS 2022)
1. High Costs: A large percentage of people in the Southeast region report that their monthly internet bill is hard for them to pay.
2. Lack of Options: Many households across the Southeast region only have one option for an internet service provider that is providing broadband speeds (100/20 Mbps).
A resilient broadband network provides high-quality internet for all residents at an affordable price. A resilient network should provide adequate internet coverage to all residents, regardless of whether they reside in a rural or urban area.
T2-T3: Rural and suburban communities should consider creating a Municipal Fiber Network to offer residents additional internet service providers and create competition in the market, lowering prices for residents of these areas.
Across the Southeast, a growing concern is the cost of internet being too high. In many communities, this often results from little to no competition with internet service providers. According to MBI, Fairhaven, New Bedford, Somerset, and Swansea have the least competition in the SRPEDD region, with no access to broadband internet speeds from two or more providers anywhere in the municipality. Creating a municipal fiber network would allow residents to have access to additional internet service providers.
Massachusetts awards Municipal Fiber Grants to communities looking to create or expand their fiber optic infrastructure. In the Southeastern region, Acushnet, Dighton, Fairhaven, Freetown, Lakeville, Mattapoisett, Middleborough, New Bedford, Raynham, Seekonk, Taunton, Wareham, and Westport have been awarded Municipal Fiber Grants to use for various projects.
• Community Development Block Grants: Federal funds that can be used to install wiring, cables, and other equipment necessary for a broadband network.
• EDA Public Works and Economic Adjustment Assistance Programs: Federal funds that can be used for construction or upgrades to public infrastructure.
• Department of the Treasury Capital Projects Fund: Federal funds that can be used to ensure that a community has access to high-quality modern infrastructure, including broadband.
The City of Taunton has been awarded two Municipal Fiber Grants, one in FY 2022 to expand the water department’s fiber optic infrastructure, and another in FY 2024 to expand the city’s existing fiber optic infrastructure. Currently, TMLP is offering 100 Mbps speeds for $49.95 a month for residential customers.
T2-T6: Communities should consider having dedicated days at local community anchor institutions, such as schools, libraries, or councils on aging to help people enroll in the Lifeline or Comcast Internet Essentials program.
T2-T6: Communities can explore the option of replicating the Affordable Connectivity Program on a local level. Using income-based or other qualifications, communities can implement a similar program that would provide a monthly discount on residents’ internet bill.
Because of the high cost of internet in the Southeast region, it is important that residents are aware of programs that can offset this cost. From December 2021 to May 2024, the Affordable Connectivity Program (ACP), a federal program, gave eligible households $30 off their internet bill, or $75 on tribal lands, as well as a one-time device credit.16 Many households in the region utilized this benefit.
While there is no substitute for the program, the Comcast Internet Essentials Program, as well as the federal Lifeline program can help with the cost of broadband and phone service. Lifeline provides a $9.25 monthly discount which can be used on either a phone or internet plan. To qualify you must either receive SNAP, or Medicaid benefits, or have an income that is lower than 135% of the federal poverty guidelines. The Comcast/Xfinity Internet Essentials program is an internet service option that offers a $9.95 a month internet plan option to qualified households. To qualify for this program, you must have either previously been enrolled in the Affordable Connectivity Program or participate in other government assistance programs, such as Medicaid, SNAP, or housing assistance.17
The state of New York recently passed the Affordable Broadband Act, which requires all internet service providers to provide low-income households with an affordable broadband option. Providers must offer a service plan of 25 Mbps for $15 a month or 200 Mbps for $20 per month.18
The region’s energy portfolio is currently serviced by three major suppliers: Massachusetts Electric (National Grid), NSTAR Electric (Eversource Energy), and municipal-run entities. Only four of the 27 communities in the region, however, offer multiple options for customers. The remaining 23 municipalities only offer one energy provider for the entire jurisdiction. NSTAR Electric has the largest service area in the region, with availability in over 13 municipalities; Massachusetts Electric is available in 11 municipalities; and municipal-run energy is available in eight municipalities.
The three different energy suppliers hold territory in different parts of the region. Massachusetts Electric dominates suburban/urban areas (T4-T6), while municipal energy and NSTAR Electric remain the principal providers for lesser developed (T2-T3) territory. Only Westport, Dighton, Lakeville, and Middleborough have access to both private and municipal service providers. Conversely, customers in highly developed areas such as Taunton, Fall River, New Bedford, and Attleboro only have singular options for energy service.
There is a distinct lack of competition across the jurisdictions in the region. With town/city-run energy service only available in eight of the region’s 27 towns and cities, many customers are left without competitive pricing options for their residential or commercial energy utilities. Given that National Grid and Eversource Energy – both of which are publicly traded companies – dominate the region, customers may be exposed to monopolistic pricing, a trend that is pervasive statewide, as noted in the Attorney General’s 2024 updated report on Competitive Electric Supply.19 As many of the jurisdictions in Bristol County and Plymouth County are managed by a single energy provider, it would be possible to note that the energy market in the region has characteristics of areas with true energy monopolies.
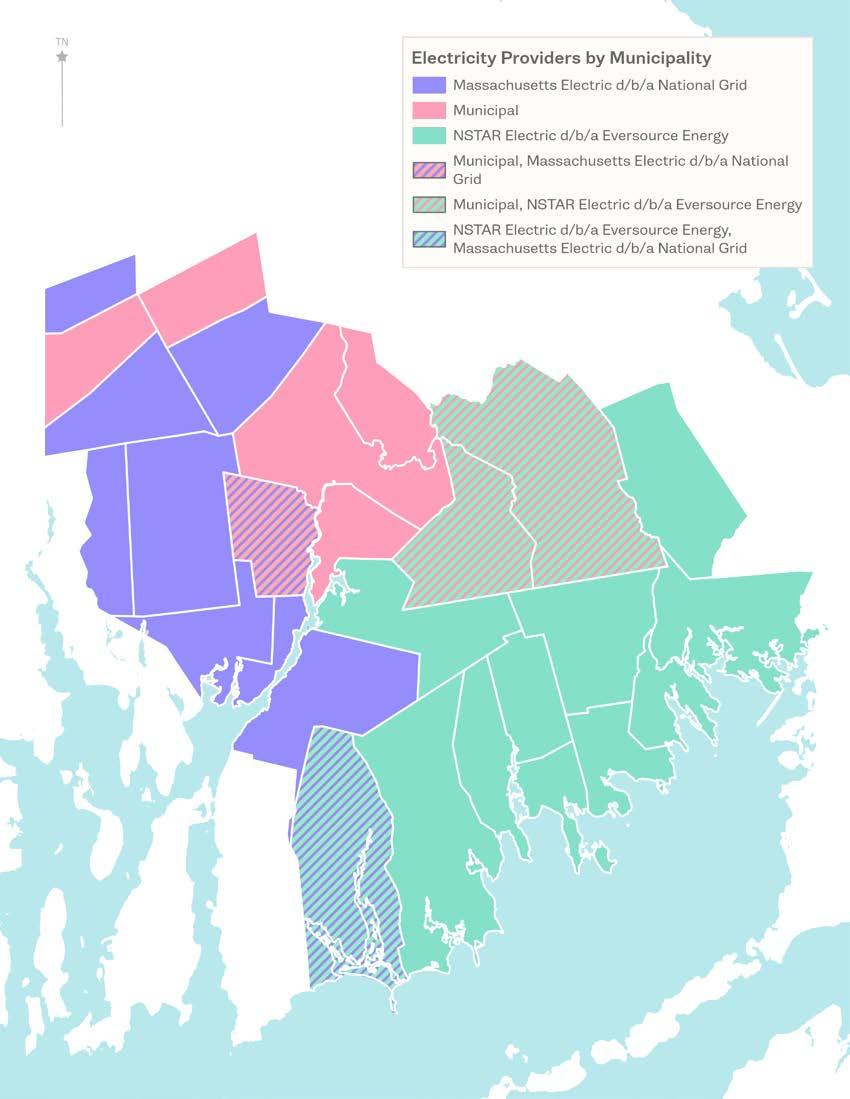
Table 4. Residential fixed price electricity rate by provider as of August 2024. (National Grid, Eversource, Towns of North Attleborough, Mansfield, and Middleborough, and City of Taunton)
A public monopoly situation can be detrimental to customers; without sufficient competition, utilities providers such as National Grid or Eversource could subject residential and commercial parties to increased prices and decreased service quality (i.e. frequent or long-lasting outages, lacking customer service, inadequate service network). However, the trajectory of a public monopoly is wholly dependent on the existing municipal, state, and federal regulations within the region or industry.
The Sherman Antitrust Act, passed in 1890, provides sweeping protections against monopolistic practices, including the utilities industry.20 Yet, as the Sherman Act has served as the landmark for antitrust regulation over the past 100 years, there still exist legislative gaps, even in the utilities industry. For example, ‘tie-ins’ can be a major concern within the energy sector. Tie-ins in the utilities industry occur when a service provider requires customers to purchase a proprietary product or service that a customer may have purchased or installed elsewhere.21 In application, a company like Eversource or National Grid could require the installation of proprietary service lines for customers wishing to integrate new residential or commercial developments. Though the Sherman Act does cover practices such as tie-ins, further enforcement is often necessary to police these issues.
Furthermore, 19 of SRPEDD’s member communities have created a Community Choice Electricity (CCE) program as of November 2021. Community Choice
Electricity programs, also known as municipal aggregation programs, are defined in UMass Ahmerst’s 2023 CCE Report as “[programs to] allow local governments to aggregate the electricity loads of residents, businesses, and municipal facilities to procure their supply of electricity (including renewable energy) in the competitive market.”22 The primary benefits of CCEs are reducing consumer electricity rates and increasing the percentage of renewables within a community’s energy mix. UMass Amherst’s report notes that 80% of municipalities surveyed had experienced savings by developing a CCE program, as well as achieving higher renewable energy levels. For additional guidance, the Massachusetts Department of Energy Resources has a guide for advancing clean energy through CCEs. Municipalities can create their own CCE or participate in a regional CCE with other communities.
Communities in the region will need to further diversify their energy portfolios by incorporating more renewables. As of 2023, solar growth has been lagging statewide, exacerbated by supply chain issues throughout the COVID pandemic. Many solar projects in the Southeast have also been delayed while awaiting state approval for necessary grid upgrades, including projects in Cape Cod and Martha’s Vineyard.23 There is also concern among community members about the land use implications associated with large-scale ground-mounted solar arrays. According to Mass Audubon’s 2020 Losing Ground report, an estimated 6,000 acres of undeveloped land have been converted to solar arrays since 2012. A priority at both the state and regional level will be getting solar off the ground, instead encouraging installation on rooftops and over parking lots and other previously disturbed and impervious areas. Currently,17 of the region’s 27 municipalities include language pertaining to solar development. However, only Dighton, Marion, Taunton, and Westport have a full solar bylaw or ordinance, and only three of those include provisions for small-scale ground-mounted solar systems.
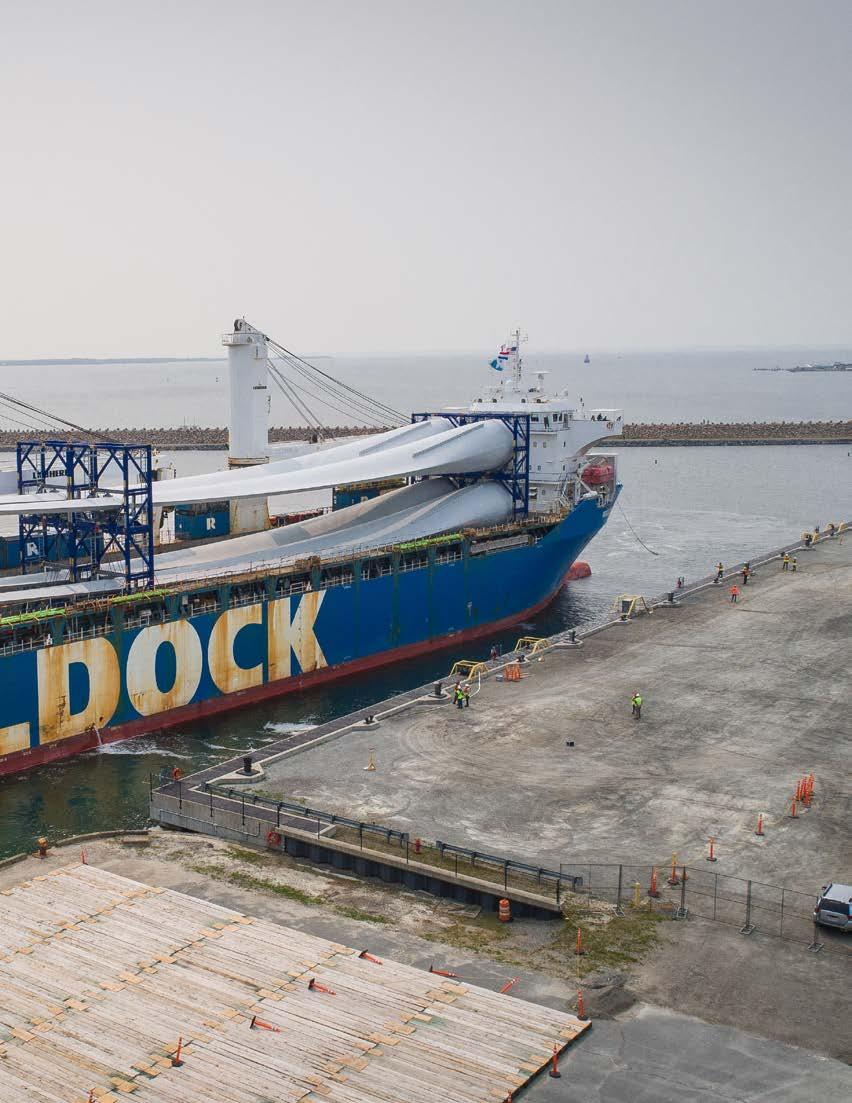
Wind energy potential is incredibly high in the region, as well, and several communities have existing or proposed wind projects. Several communities along the coast have deep-water ports, notably those in New Bedford and Somerset. One of the highest priorities for the region will be the realization of Italy-based Prysmian Group’s proposal to build an offshore wind manufacturing facility at Brayton Point, a former coal-fired power plant.

Massachusetts’ REPA (Regional Energy Planning Assistance Program) helps communities in the SRPEDD region develop energy plans that incorporate a mix of energy sources, including renewable energy. REPA often involves helping towns and cities apply for grants, such as the Green Communities designation, which encourages energy efficiency and renewable energy projects.
1. Limited Options: Most of SRPEDD’s region only has access to one electric utility provider. This can lead to monopolistic practices and high costs for consumers.
2. Aging Grid Networks: Renewable generation and long-term electrification will necessitate significant and costly grid upgrades. Additionally, it will leave fewer consumers utilizing natural gas infrastructure. The cost to repair aging infrastructure may end up being passed on to the most vulnerable residents, as more affluent communities move away from natural gas consumption.24
3. Local Perceptions and Skepticism: There is inherent skepticism about renewables/energy conservation measures, and the upfront costs associated with them. This skepticism makes it difficult to gain the local buy-in necessary to support new programs and investments.
For a resilient future, the SRPEDD region must focus on both diversifying supplier options and increasing renewables uptake to follow suit with the statewide goals to achieve Net Zero by 2050. A resilient energy portfolio will prioritize equitable energy outcomes, emphasizing transitioning from natural gas while ensuring the most vulnerable residents are not shouldering the burden. Additionally, a resilient energy portfolio will tap into the region’s most pertinent renewable energy resources, including offshore wind and rooftop solar.
T2-T6: Communities should update local zoning codes and streamline permitting processes, integrate these projects into economic development plans, and invest in relevant infrastructure and workforce training programs to facilitate offshore wind projects in the South Coast.
The region’s most recent 2023 Comprehensive Economic Development Strategy (CEDS) highlights offshore wind and ocean-based industry clusters as a notable strength. The Massachusetts Decarbonization Roadmap also highlights the New England coast as having access to world-class offshore wind resources. To prepare for decarbonization and to promote economic development and job creation SRPEDD’s coastal communities, especially those with deep water ports, should prioritize enabling new offshore wind projects (including manufacturing and installation) through local zoning and regulatory processes. These efforts can tie directly into education and workforce development opportunities to accomplish multiple resilience initiatives at once.
13. Offshore wind turbine blades on a cargo ship at the Port of New Bedford, MA. (Kevin Ham/SRPEDD)
T2-T6: Addressing common concerns by providing clear, unbiased information about solar benefits and educating on issues such as predatory sales practices and safety will strengthen awareness and accessibility of solar PV systems. Communities should also leverage resources from organizations like the Green Energy Consumers Alliance and DOER to streamline awareness and increase solar use in the region.
Another major component of decarbonization and energy diversification is increasing the uptake of rooftop solar photovoltaic (PV) systems. As noted in the statewide Decarbonization Plan, offshore wind alone will not provide enough carbon-free electricity to meet the needs required to reach Net Zero by 2050. Increasing rooftop solar will allow users to access new energy sources outside of the limited network of existing options while also contributing to the state’s pathway to decarbonization.
Recent trends in the solar market have likely left many residents skeptical of the benefits of rooftop solar installation. Communities considering programming to increase solar uptake will need to address concerns about predatory sales practices, lacking returns on investment, and safety.25 Organizations such as the Green Energy Consumers Alliance offer resources to educate consumers on their options, and have notably highlighted some of these prominent issues in the solar industry in recent years.26 The Office of the Attorney General also has a resource page on frequently asked questions about solar products in Massachusetts, which describes how to handle predatory/aggressive sales tactics and how to choose between solar options.
There are a number of incentives and rebates available to consumers in Massachusetts, including:
• Solar Massachusetts Renewable Target Program (DOER): A state program that provides monthly incentives to small-scale solar developments producing no more than 5 MW electricity per parcel of land. Eligible solar PV systems must be integrated with the Massachusetts electricity grid.
• Federal Residential Solar Energy Credit (DOE): A tax credit provided to residents who have installed/plan to install a small-scale solar PV system. The apportioned tax credit is determined by the date of installation.
• Massachusetts Residential Energy Credit (DOR) (DOER): A tax credit allowing residents to receive 15% of the cost of a residential solar PV system, up to a maximum of $1,000.
• Massachusetts Property Tax Exemption (DOR) (DOER): A law, initially enacted in 1970, exempting property owners from property taxes for 20 years following the initial installation of a residential solar PV system. This exemption applies to both on and off-grid systems.
• Municipal Light Plants: Residents and commercial parties living or operating in a municipality managed by an MLP are eligible for various incentives and rebates, such as net metering, allowing for reimbursement of excess energy provided to the MLP.
T2-T6: Planning for long-term electrification will be possible by developing or utilizing state and federal programs that support low-to-moderate income households and businesses in transition. Communities should equip residential and small commercial buildings with the resources for longterm renewable use by promoting the adoption of rooftop solar, induction stovetops, and heat pumps.
There is an impending need to plan for increasing electricity loads to the grid as communities begin to transition to renewable energy sources.27 As discussed earlier, long-term electrification goals statewide and nationally will likely drive up maintenance costs for natural gas infrastructure, a burden that, without proper planning, may likely be passed on to the most vulnerable consumers.
Communities should plan to create new programs or tap into existing ones at the state and federal level to support low-to-moderate income households and businesses transition to all-electric appliances and home heating/cooling. For residential and small commercial buildings – and especially older buildings – this transition will primarily focus on the uptake of rooftop solar, induction stovetops, and heat pumps. Recent research is beginning to home in on “neighborhoodscale electrification” strategies, which aims to transition entire neighborhoods off natural gas at once.28 The State’s recent creation of the nation’s first Office of Energy Transformation29 is a strong indication that more statewide programming around natural gas transitioning is coming.
In the interim, communities should remain engaged with this new Office and begin exploring ways to work together regionally to coordinate transitioning and electrification. Long-term exploration of these efforts can also examine more advanced technologies, including microgrids and battery storage.
THE CALIFORNIA PUBLIC UTILITIES COMMISSION (CPUC)
The CPUC has been actively involved in creating policies and regulations that encourage the transition from natural gas to electrification in California. This includes building decarbonization efforts and incentives for all-electric homes. California’s Building Decarbonization program, which provides incentives for electric heat pumps and other electrification technologies, and the CPUC’s Long-Term Gas Planning Process are several initiatives that serve to enhance long-term electrification and the transition away from natural gas.
T2-T6: By engaging with DOER’s Green Communities Division, communities can access technical and financial support for adopting green energy alternatives. Additionally, utilizing MassCEC’s funding opportunities for green investments and promoting clean energy education can further enhance local clean energy initiatives.
The Commonwealth has various clean energy programs available to the public. The Massachusetts Department of Energy Resources (DOER) Green Communities Division provides both technical and financial assistance to adopt green energy alternatives. The Massachusetts Clean Energy Center (MassCEC) offers funding to green investment programs, while also promoting clean energy education across various disciplines.
Best Practice #1: Support job stability in healthcare and retail.
Best Practice #2: Enable innovation and support small businesses through modern and flexible zoning.
Best Practice #3: Ensure the longevity of agricultural activities by supporting related agrotourism activities.
Best Practice #4: Support competitive wages, especially among retailer workers.
Best Practice #1: Encourage students to pursue higher education in health sciences, biotechnology, and engineering.
Best Practice #2: Invest in partnerships and educational campaigns that connect the region’s students and workforce to education necessary in the Offshore Wind industry.
Best Practice #3: Create an ecosystem to attract and retain biotechnology firms to the region.
Best Practice #1: Encourage and adopt “high road management practices.”
Best Practice #2: Develop a framework to support small business development and entrepreneurship.
Best Practice #3: Invest in a revolving loan fund to support small business establishment and growth.
Best Practice #4: Support small businesses through support programs and flexible permitting and zoning.
Throughout the last 10 years, the region’s industries experienced a wide range of growth and decline. Most recent industry data shows that the region’s top industries include:
1. Healthcare & Social Assistance (17.26%)
2. Retail Trade (12.77%)
3. Educational Services (9.01%)
4. Accommodation & Food Services (8.89%)
5. Manufacturing (6.97%)
The region’s overall employment grew by 4% between 2013-2022; however, over half of the industries in the region saw a decrease in percent employment. The industries with the greatest decline in employment include Management of Companies and Enterprises (-28%), Utilities (-18%), and Manufacturing (-12%). Industries with the greatest employment growth were Construction (36%), Transportation and Warehousing (29%), and Administrative and Waste Services (9%). Most of region’s top industries declined, except for Health Care & Social Assistance which saw less than 1% of growth. Across the region, Healthcare and Social Assistance holds the largest share of employees, which is also reflected in the top employers in the region, which includes Partners Healthcare System Inc, St. Anne’s Hospital, Brockton VA Hospital Medical Center, and Good Samaritan Medical Center. The closure of Steward Hospitals threatened this industry in late 2024, and prompts the region to consider an economic landscape that supports heath care in the face of future challenges created by the private market.
Despite the modest growth in employment and mixed industry trends, wages grew across all industries. Wage growth can most likely be attributed to several different factors, the first of which is the increase of minimum wage from $11 to $15 per hour. The other major reason could be attributed to rising inflation, further exacerbated by trends due to the COVID-19 pandemic.
The region should stabilize existing critical industries such as Healthcare and Retail, while also promoting growth in emerging industries. Between 1977-2007, big box stores and chains grew much faster than specialist retail chains.30 This is evident in the region’s major commercial corridors and business trends, where many businesses can be considered big box and chain stores. The preference for big box stores fluctuated over the years, with demands growing for more local and crafted products found most at specialty retailers. In fact, according to some sources, consumers are willing to spend more money at local shops to ensure they thrive.31 Studies also show that shopping local benefits the overall economy, with small businesses returning more than three times per dollar in sales to the local economy.32
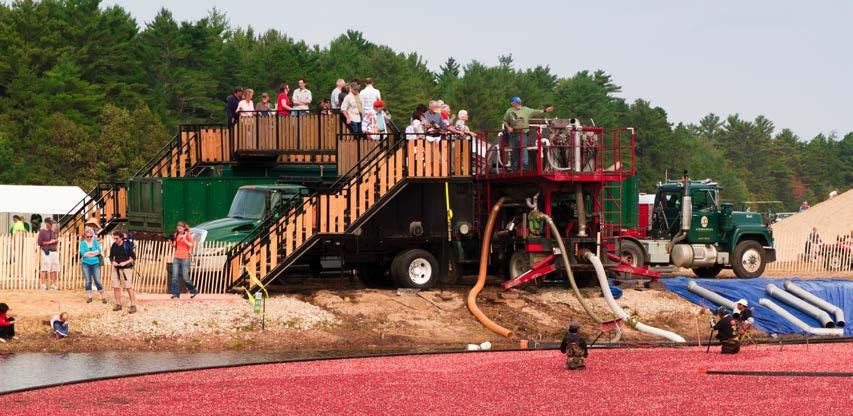
Construction is among the fastest developing industries in the region due to its growth in wages and share of employment, mirroring trends in Transportation and Warehousing. These two industries, along with Professional and Technical Services and Agriculture, Forestry, Fishing and Hunting were the only industries to have growth in both wages and employment share in all three of the region’s counties (Bristol, Norfolk, and Plymouth Counties) from 2013-2022. Though agriculture accounts for less than 1% of employment in the region, the New Bedford Port is the highest grossing port in the United States, which accounts for the significant growth in wages.33 However, with deep agricultural roots – and a distinct desire to preserve this history as part of the economic and physical landscape – the region has potential to capitalize on agritourism initiatives. The USDA touts agritourism as a means to generate revenue from recreational or educational activities, particularly in farms closer to urban centers, such as those in the Southcoast.34 Throughout the Commonwealth, 13% of farms participate in agritourism activities – a figure that grew 41% between 2017-2022. These activities account for upwards of $23 million worth of revenue.35
Sustainable growth requires careful consideration of future economic trends. For example, the rapid development of warehouses in the region occurred to meet high demand, elevated further during the pandemic. The COVID-19 pandemic tested local economies, particularly those that lean too heavily on the success of one industry; in response, communities should pursue any tools available to anticipate disruptions and diversify their economies to withstand them. A diversified, well-planned economy is the main way to combat changes in industry trends and survive future economic turbulence.
1. Low wages: Though the region has a moderate concentration of high-wage employment, our top 5 industries (in terms of share of employment) rank lower with an average high of $80,000 per year. Growth in these sectors is expected, and should be encouraged, though the region should consider industry diversification to make higher paying jobs available.
2. High Concentration of Healthcare and Retail jobs: Healthcare and Social Assistance and Retail Trade are the largest industries in the region. The region should work to diversify and grow new sectors.
3. Low employment in high-wage industries: The region’s share of employment in high-wage industries such as Agriculture, Utilities, and Transportation & Warehousing is growing. Though not as competitive compared to the top 5 industries, projections show the region should focus on growing employment in these sectors to diversify employment sectors.
The region’s economy is growing – and shifting – along with modern trends. In order to sustain employment in the region’s largest sectors, and create opportunities for new ones, municipalities need to proactively implement changes in close coordination with regional and state actors.
T4-T6: Communities within these typologies are often host to regional retail clusters and health care centers. Municipal officials – both elected and appointed – should maintain collaborative relationships with private sector representatives from these industries and institutions. These types of public-private partnerships are essential to ensuring sustained economic activity, navigating necessary changes, and preparing for and responding to market changes.
Recent troubles with the Steward Healthcare System and the COVID-19 pandemic show that private market disruptions and public health crises can significantly impact job stability in healthcare and retail. In collaboration with the state, the region should consider potential safety measures should private equity fail to meet the mission of public health.
T3-T6: Communities with greater densities have the consumer capacity, supportive infrastructure, and built landscape to support business innovation through zoning. Communities within these typologies may consider implementing modern zoning such as Innovation Districts, Village Districts, Transit Oriented Development Districts, Main Street and Downtown Districts, Technology and Lab Districts, and other zoning that removes unnecessary barriers to economic activity, both large and small.
Funding Opportunities: Community One Stop for Growth, Community Compact Cabinet, District Local Technical Assistance.
Communities throughout the region enable economic activity and influence small business growth through zoning, which establishes what uses are allowed, where they are allowed, and at what intensities (regulated through dimensional characteristics, such as minimum lot sizes and height restrictions). Municipalities can support small businesses and their longevity by enabling mixed use zoning and removing unnecessary regulations and procedures. Similarly, flexible (not overly prescriptive) zoning that is regularly updated based on market trends can proactively make space for new and emerging economic activities such as labs, flex spaces, and incubators in select places in each community
the longevity of agricultural activities by supporting related agrotourism activities.
T2-T3: Rural and select suburban communities with agricultural traditions and active farms are best suited to support agrotourism initiatives. Economies in these communities would benefit from the diversification of agricultural activities, insulating farms from closure and creating alternative paths for future development. Communities can ensure that their zoning and other bylaws (such as Right-to-Farm bylaws) enable ancillary activities such as those envisioned here.
Funding Opportunities: Community One Stop for Growth, Community Compact Cabinet, United States Department of Agriculture.
Many rural communities report uncertainty with regards to the future of farms in their communities. To support their longevity, municipalities should work with regional organizations, such as SEMAP, and the USDA to identify ways in which to diversify their activities to include paid experiences, weddings, and harvest events.
Best Practice
Support competitive wages, especially among retailer workers.
T3-T6: Local and state officials may choose to participate in a multisectoral collaborative dedicated to this issue, including the participation business owners, community members, and workers’ advocacy groups. They collaborative would ensure that wage-related advocacy is conducted lawfully, openly, and with accurate market data to support recommendations. The collaborative could raise public and executive-level awareness of the importance of equitable wage policies; it would also allow interested parties to launch a coordinated effort to lobby for improved workers’ rights through targeted advocacy campaigns, public forums, and direct engagement with policymakers.
Funding Opportunities: US Dept. of Labor Growth Opportunities Grant Program, HUD Community Development Block Grant Program, DOC Economic Development Administration PWEAA Program.
Minimum wages have increased significantly over the last decade; however, they struggle to keep pace with the rate of inflation. As the cost of living continues to rise, local representatives should support reasonable and lawful efforts to increase wages, especially for the region’s retail and service industry workers.

A modern economy can only be achieved by cultivating innovations in technology and aligning workforce development strategies with the skills necessary for rising industries. According to the MassTech Collaborative, Massachusetts is one of the leading states in the innovation economy that hinges on talent, research activity, and access to capital. In 2021, the MassTech Collaborative published The Annual Index of the Massachusetts Innovation Economy. From a statewide perspective, their research considered the factors that have made the state successful; MassTech also laid out the challenges the state contends with as it continues to grow.
Though the economic well-being of the state as a whole is on solid ground, the Southeastern region trails behind the Boston metro research and development corridor, which brings renowned biotechnology and life science firms to the Commonwealth. The StatsAmerica Innovation Intelligence Tool provides data that describe human capital, business dynamics, employment, and productivity to provide a more complete picture of the current state of the innovation economy in southeastern Massachusetts.36 For example, communities within the southeast region are in proximity of universities with high R&D spending in science and engineering. This should positively impact the average share of employees in high-tech industries, however, only 5%, are employed in these industries in Southeastern MA – compared to 9% at the state level and 16% in the nearby Boston Metro.37 Additionally, the tool compares the diversity of patents in the region against the U.S., showing the southeast region is more diverse.38
The region (and neighboring Rhode Island) host an emerging cluster of activity in the Offshore Wind sector, which is evident in projections that show Utilities as an industry is expected to grow across Bristol (27%), Greater New Bedford (33%), and the South Shore WDAs (79%) between 2020-2030.39 Offshore Wind is already creating demand for laborers with specialized skills obtained only through

training and certification. However, there is a clear gap between this demand and availability of a homegrown regional workforce with the skills necessary to secure well-paying jobs in this industry.
Additionally, other trends in the Southeast region impact innovation and workforce development, including education, training, and competition created by its proximity to the Boston research and development corridor. The region trails behind in educational attainment, particularly in higher education. Furthermore, Recent Graduate Surveys from the University of Massachusetts Dartmouth highlight that most students graduate and remain in the state; however, only a fraction – an average of 14% over the last three yearsremain in the region.40 Recent Graduate Surveys also reveal Healthcare and Technical Occupations are among the most frequently cited occupations of recent graduates, with an average 15% in the last 5 years. Students pursuing graduate education also cited Engineering Technologies and Related Fields most frequently.41 Unfortunately, industry projections for the region’s workforce development areas (WDA) do not align with growth in these sectors. Though not part of the region’s critical industries, Professional, Scientific, and Technical Services are expected to grow in the South Shore and New Bedford WDAs. This industry cluster supports research and development locally, while also ensuring high-wage employment for individuals with a background in health sciences, engineering, and other modern technologies.
Further efforts to understand and influence these sometimes divergent trends would enable the region to have a more resilient, modern, and sustainable economy.
1. Educational attainment: The region’s ability to compete with neighboring regions that host robust research and development markets are directly hindered by the educational attainment of our workforce.
2. Training and certification in specialized industry skills: As the Offshore Wind industry grows in the region, necessary training and certification programs should be address skills gaps in the local workforce.
3. Retention of graduates in health sciences and biotechnology: Though the region produces skilled and educated workers in the fields of science and technology, few students stay in the region to pursue these careers.
4. Retention and attraction of research and development firms: Though the region excels in the production of patent technologies, low growth projections show that few research and development firms are settling or growing in the region.
An innovative economy and skilled workforce require investments in people. The South Coast is a prime location for research and development activities. It is central and strategically located; it boasts an increasingly educated population; and land values and development costs are lower compared to the Greater Boston Region. To create greater diversity in the local economy, the region and its municipalities should explore ways in which to encourage industry growth and align skills with local employment opportunities.
Education is one of the greatest barriers to entry for health sciences, biotechnology, and engineering. Trends show encouraging students to pursue degrees in these fields will also support the industrial growth in the region.

Best Practice 2: Invest in partnerships and educational campaigns that connect the region’s students and workforce to education necessary in the Offshore Wind industry.
T1-T6: Various technical schools and post-secondary institutions offer training programs that specialize in Offshore Wind operations. Partnering with these institutions, along with existing Offshore Wind industry leaders, would allow for the development of an educational pathway to directed, in-demand career opportunities in offshore wind. Offering flexible learning options, apprenticeship programs, subsidized transportation, or scholarships would reduce financial and logistical burdens and would incentivize residents of the region to participate in these educational programs.
Funding Opportunities: MassCEC.
Municipalities, regional workforce organizations, and institutions for higher education may coordinate efforts to connect local students and communities with training and certifications to enable entry into the specialized Offshore Wind workforce.
Create an ecosystem to attract and retain biotechnology firms to the region.
T1-T6: The development of a region-wide coalition, comprised of municipal representatives, industry members, chambers of commerce, and local business owners, would help to foster growth in the region’s biotechnology industry. This intersectional collaboration, through routine meetings, strategic planning, and private/public partnerships, would fulfill the interests of both municipalities and existing biotechnology firms. The coalition would serve to promote biotech-friendly development that would transform the region into a leading hub for innovation, helping to retain and attract firms within the region.
Funding Opportunities: DOC Economic Development Administration, EOLWD.
To support industry diversification through biotechnology and engineering, the region needs a prepared workforce to meet demand from local companies. This ecosystem needs to be cultivated by a variety of actors.

Mansfield Bio-Incubator is a non-profit organization whose mission is to facilitate and assist the creation, growth, and success of the next generation of biotech companies. The incubator supports nascent companies and nurtures entrepreneurship by providing affordable lab and office space to lease. Additionally, the Incubator provides services, training, mentoring, and a network of professional advisors. In late 2023, the Mansfield Bio-Incubator received funding from the EDA to cultivate an biotech ecosystem in the region to compete with the Boston corridor. Similar incubator success stories are available throughout the Commonwealth and the nation.
Small businesses are the backbone of community identity and local economies. In ensuring a diverse and resilient economy, in addition to pursuing new industries with high-tax generating and employment opportunities, the region should emphasize small business growth and stability. Small businesses often influence the vitality of our region’s Main Streets and Downtowns.
According to the Small Business Administration (SBA), small businesses account for as much as two-thirds of new jobs across the country, while encouraging competition and innovation.42 Small businesses thrive in the state - and equally in the region. Between 2013 and 2022, business applications filed in Bristol and Plymouth County grew over 40 percent - a rate of growth that outpaced the state (33%).43
Though there are varying definitions for what constitutes a “small business” (including number employees or annual revenue), this study considers the development and success of businesses with less than 100 employees.44 According to the Innovation Intelligence Index, the southeast region produces new businesses at a slightly faster rate than they close.45
Despite the growth of small businesses, they continue to face regulatory and economic challenges. According to a study published by The MassINC Polling Group, small businesses struggle to hire staff due to rising costs. More than 60% of respondents reported open positions, but the high cost of living and housing make attracting employees at competitive and sustainable wages a challenge. With rising inflation, small businesses also struggle to access much needed capital to expand and are further hindered by unnecessary local regulations, complicated grants, unfavorable repayment terms, or high interest rates. Small businesses are poised for expansion; however, their growth hinges on the overall health of the economy.46
1. Inflation and high cost of living: Small businesses struggle to keep up with cost of doing business due to inflation, while also attracting employees in high cost of living areas.
2. Competitive, sustainable wages: Attracting employees to areas experiencing rising costs of living mean small businesses must increase wages to remain competitive and create a sustainable workforce.
3. Burdensome regulations and restrictive zoning: Small businesses with limited staff and unique business models can benefit from streamlined permitting, lower barriers to entry, and flexible local regulations.
4. Employee retention: Given the challenges of inflation, few small businesses can afford to raise wages, which impacts their ability to retain existing and new employees.
5. Access to capital: Without access to capital, small businesses struggle to grow. Rising interest rates makes borrowing money expensive and grants can be challenging to obtain.
Best Practice 1: Encourage and adopt “high road management practices.”
T2-T6: High Road management practices are easily applied to small businesses of all types. Municipalities and regional entities across all typologies can benefit from connecting their small businesses to resources that detail high road management practices.
“High road management practices” include several strategies to improve the experience of employees, such as pay scales, human resource management, and policies that protect basic worker dignity. By subscribing to high road management practices, small businesses typically experience reduced turnover and greater productivity.
T2-T6: Rural and urban communities alike host small businesses and rising entrepreneurs through start-ups and home-based businesses. Municipalities should connect small businesses that apply for permits to resources and partners, such as SEED Corp., that provide valuable growth tools and best management models.
Entrepreneurs are not always trained in small business management, which includes business plan development, pre-venture feasibility, cash flow analysis, personnel and organizational issues, conventional and non-conventional financing, marketing, international trade, and procurement. Some municipalities form partnerships or direct pipelines to technical assistance or organizations that are able to provide support via the Small Business Administration. Non-profit business development partners (such as Southeastern Economic Development Corp., “SEED Corp.” ) also serve small businesses throughout the region.
T2-T6: Communities across all typologies would benefit from revolving loan funds to support small business growth. Small, rural, and suburban communities may consider regional revolving loan funds where their communities’ economies are closely aligned. Larger and urban communities may approach these funds from a community or neighborhood level to direct growth in specific districts.
Cities and towns support local business by providing access to capital with integrated support and guidance to obtain it. Most small businesses receive capital through small or local banks with SBA -backed loans. Cities and towns eliminate this step altogether, creating a competitive pool of funds to seed new businesses or expand an existing venture.
The Small Business Admiration (SBA) awarded the City of New Bedford with funds to support startups and existing businesses in direct response to the fallout of the pandemic. Through this funding, the City established the NB100! And NBForward grant programs which supports small business growth and development. NB100! provides up to $10,000 in capital for start-up costs associated with leases or mortgage payments, utilities, payroll, and inventory. NBForward offers grants for similar purposes to existing businesses, and offers a loan program of up to $200,000 for renovations, property acquisitions, and other expenses.

T2-T6: Review zoning and permitting procedures in partnership with local business owners. Numerous tools and programs exist to support local small businesses. These include: permitting guides, online “e-government” solutions, government support programs through agencies such as the Massachusetts Downtown Initiative, and programs and initiatives such as Business Improvement Districts and Main Streets Collaboratives.
Communities influence small business growth and activity through local permitting and zoning, which establishes what uses are allowed, where they are allowed, and at what intensities (regulated through dimensional characteristics, such as minimum lot sizes and height restrictions). Municipalities can support small businesses and their longevity by enabling mixed use zoning and removing unnecessary regulations and procedures.
Best Practice #1: Connect modes of transportation with South Coast Rail.
Best Practice #2: Enhance and expand local pedestrian and bicycle networks through collaboration with communities.
Best Practice #3: Continue to address high frequency and high severity crash intersections.
Best Practice #1: Monitor identified freight routes for improvements.
Best Practice #2: Advocate for public-private partnerships for the construction and maintenance of rest stops for freight vehicles on significant routes.
Best Practice #3: Connect freight shipping routes to critical port facilities.
Best Practice #1: Develop a Regional Evacuation Plan.
Best Practice #2: Continued coordination with partners outside of the region.
Best Practice #3: Establish a process for the updating and maintenance of evacuation route planning.
Best Practice #4: Strength county government to support emergency response.
One of the largest transportation challenges facing the SRPEDD region is the expansion of multi-modal transportation accommodations, including expanded transit service and bicycle/pedestrian networks. The lack of multi-modal accommodations is especially apparent in commute-to-work data from the American Community Survey (ACS) 2016-2020 5-year estimates, which shows nearly 83% of commuters drive alone, with steadily declining rates of carpooling since 1990. The primary mode of getting around the SRPEDD region is the use of personal vehicles, which is expected given the lack of an extensive multi-modal transportation network.
The region is served by two Regional Transit Authorities (RTAs) that provide both fixed routes and ADA paratransit/demand response service. Service is the northern section of the SRPEDD region is provided by the Greater Attleboro Taunton Regional Transit Authority (GATRA), while the southern portion is served by the Southeastern Regional Transit Authority (SRTA). Fixed route service refers to a transit service that operates on regularly scheduled bus routes on a published timetable. Fixed route service is generally found in the more urbanized areas of the region where population densities are higher, and a greater number of destinations are located. SRTA operates with a fixed route system as described, whereas GATRA runs a flag-stop system where riders can hail the bus from any point along pre-determined routes. Both RTAs comply with federal requirements associated with the Americans with Disabilities (ADA) Act, which requires ADA service be available concurrently with fixed route bus service and travel.47 Public transit is not strictly limited to or solely operated by the RTAs; the region is also served by two private commuter bus carriers.
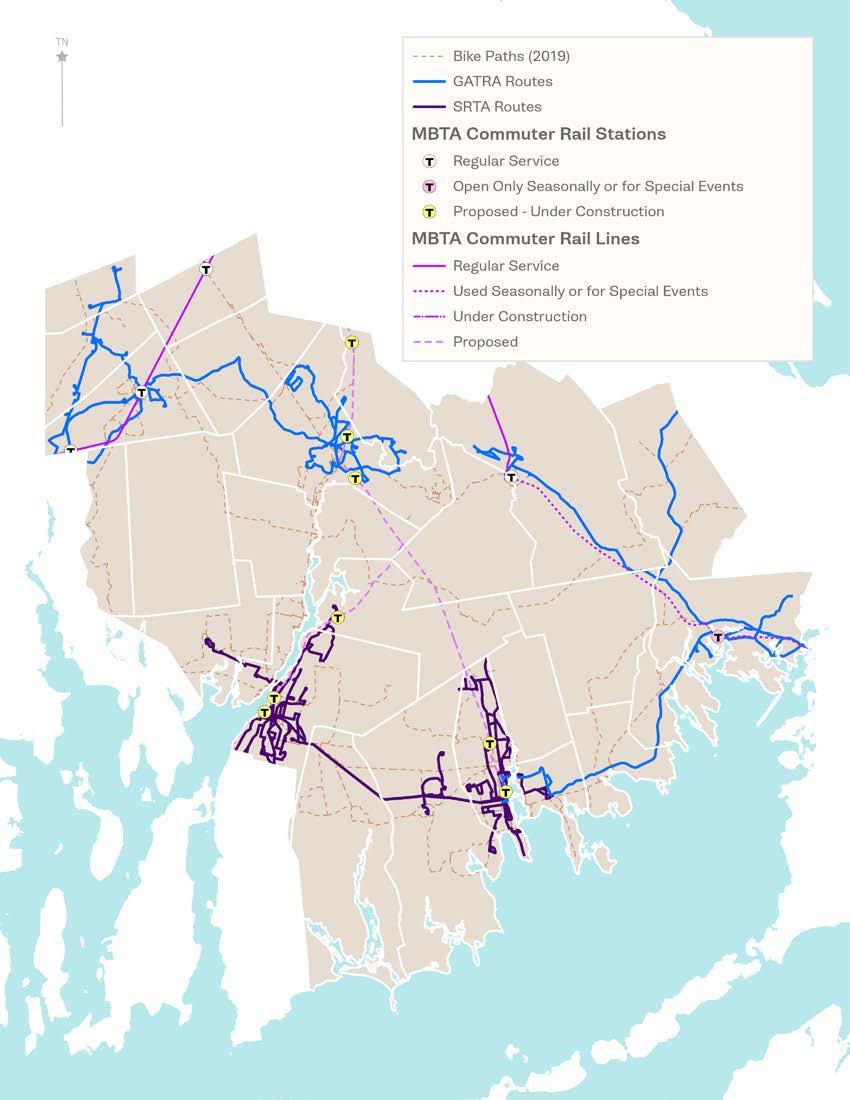
Lack of transit connectivity is a barrier to mobility and participation in economy within the region. The GATRA and SRTA systems only intersect in Wareham by utilizing the Wareham-New Bedford Connection, and the only other intraregional connections are made through private commuter and intercity bus lines. Barriers to accessible Intercity bus travel include cost prohibitive fares, lack of coordinated intercity schedules, and in some cases, the lack of connections altogether.
Transit in the region is concentrated in the four cities (Attleboro, Fall River, New Bedford, and Taunton), with limited service into suburban communities. As the job market has shifted from centralized urban cores to decentralized suburban industrial parks, commercial strip malls, and shopping plazas, transit providers struggle to adequately meet the needs of the workforce. Transit is most cost effective in dense urban cores, however the disperse development of suburban areas make fixed route transit more expensive to operate, and more time consuming to ride. Additionally, the service provided by both RTAs does not typically cover hours outside of the 6:00 AM and 6:00 PM, though some services are being extended on certain routes.
Commuter rail service in Southeastern Massachusetts is poised for substantial growth in 2025. After several decades of planning, the Massachusetts Bay Transportation Authority’s (MBTA) South Coast Rail Project will soon be operational and will utilize the existing Middleborough/Lakeville Line to connect the cities of New Bedford, Fall River, and Taunton to South Station in Boston by passenger rail service for the first time since September 1958.
By the end of 2025, the region’s commuter rail service is expected to significantly expand, increasing the total number of stations from 3 to 8, not including the temporarily closed South Attleboro Station, or the Middleborough/Lakeville and Wareham Stations, which will continue to be utilized for Cape Flyer service.
There are two current large-scale regional networks in continued development at the time of this plan, including the South Coast Bikeway and Taunton River Trail, which aim to provide over 70 miles of bicycling network in and around the region once fully realized. In addition, the Mansfield/Norton Rail Trail will provide nearly 5 miles of ADA accessible trail from downtown Mansfield to the Myles Standish Industrial Park once construction is completed using Transportation Improvement Program (TIP) funds.
However, the current bicycle network is fragmented in many areas, with large gaps within and between communities. These gaps, lacking safe cycling infrastructure, hold back more significant growth in bike ridership that could be realized with a high degree of connectivity and put those who rely on bicycles as a primary mode of transportation in unsafe riding situations unless they are closely connected to existing infrastructure. Additionally, potential bicyclists in the region that are interested in riding but are concerned for their safety and don’t have enough local infrastructure in their community to feel comfortable using a bike to get around for everyday trips.
Roadway improvement projects are typically completed in many different phases over many years, and across multiple municipalities all operating under different budget constraints, local priorities, and timelines. Completed segments of onroad bikeways may appear disjointed and disconnected from important trip origins and destinations; however, upon closer examination of the planned regional interconnected network, a clearer vision of the future regional bicycle network comes into focus.
In response to existing conditions, the Regional Bicycle Plan, overhauled in 2023, was written to envision a future safe, connected, and regionwide bicycle network that will enable significant growth in bike ridership.
The 27 communities that make up the region vary widely when it comes to walking conditions, from wide open rural areas with no pedestrian facilities, to small towns with intermittent sidewalks and/or compact town centers, to cities with vast sidewalk networks.
Residents in the region want to prioritize pedestrian related transportation improvements. When surveyed, 41% said they would add/fix bike lanes and sidewalks with available funding. Another 39% of people report walking and biking in a typical week, compared to 92% which use their own vehicle.48 Regional studies49 reveal consensus to improve walking connections that typically coincide with enhanced bicycle facilities, especially shared use paths that provide access for cyclists and pedestrians alike.
1. Connectivity and Accessibility: Commuters experience “last-mile” travel difficulties when switching from one mode to another. Examples of this include commuters who utilize more than one form of transportation on a single commute – such as biking, walking, train, bus, and car.
2. Limited Transit: The region has an expanding need for transit services – bike and rail – for all riders, but particularly due to an aging population.
3. Non-Motorized Connections: The region has a lack of continuous and connected bicycle and pedestrian infrastructure throughout communities.
4. Crash Severity: The SRPEDD region has higher serious injury rates, related to motor vehicle crashes, when compared to other regions and the Commonwealth at large.
To best support a resilient, multimodal transportation network, communities in the SRPEDD region will need to coordinate myriad, incremental and ongoing improvements that will ultimately contribute to a broad and comprehensive system for getting around. While Phase 1 of the South Coast Rail will provide a backbone for regional and State-wide commuting, it will be important for communities, transit service providers, government agencies to ensure that there are proper linkages between transportation modes and that these modes meet the needs of residents and visitors across the Southeast region.
T3-T6: Invest in better bicycle and pedestrian infrastructure to transit stations as well as equipping all regional transit authority buses with bicycle racks to safely transport all passengers to their destinations.
T2-T6: Upgrade and/or install transit stops with ADA accessible sidewalks and waiting areas to improve the overall transit user experience and improve safety for all transit riders.
T3-T6: Schedule regular meetings of RTAs with MBTA to better coordinate bus schedules with commuter rail scheduling and access progress.
Potential Funding Opportunities: SMMPO Transportation Improvement Program (TIP), Community Transit Grant Program.
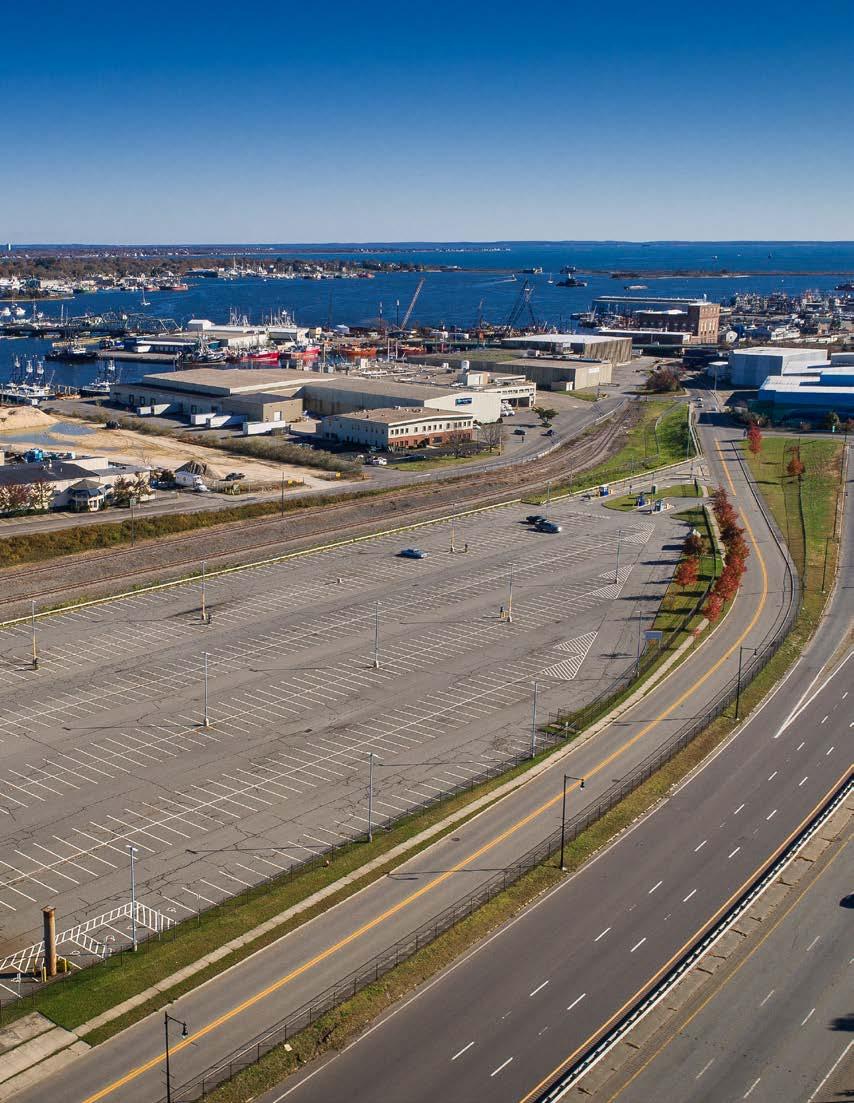
As the South Coast Rail becomes fully operational, its success will depend, in part, on the integration of additional modes of transportation. For Regional Transit Authorities, such as GATRA and SRTA, it will be important to connect bus routes to ensure connections to MBTA Commuter Rail stations. Of equal importance is synchronizing these routes’ schedules with the Commuter Rail’s inbound and outbound schedules. Similarly, communities should explore the integration of bicycle and pedestrian infrastructure to connect locations where people live, work, and shop to regional transit hubs.
Provides a broad overview of desirable transit stop treatments to improve overall accessibility and the transit user experience. Also provides a general cost estimate for improvements.
T2-T6: Continue collaboration with community groups such as the South Coast Bikeway Alliance to advance regionally significant projects to support better bicycle and pedestrian networks.
T2-T6: Continue to support projects that advance pedestrian and bicycle accommodations through the TIP evaluation criteria and funding process, especially to important destinations and job centers throughout the region.
Potential Funding Opportunities: SMMPO TIP, Safe Streets and Roads for All (SS4A) Grant Program, MassDOT Complete Streets Funding Program.
The SRPEDD Bicycle Plan outlines several regional priorities for Southeastern Massachusetts’ South Coast Bikeway, Taunton River Trail, and other significant bike routes in the region. The successful implementation of these large-scale bicycle routes will require ongoing and significant collaboration. Communities should give priority to providing separated, multi-use paths, offroad connections, and dedicated bicycle lanes that create a continuous, safe route for those who wish to bike in the region.
While many communities still rely primarily on vehicular access for circulation and transportation networks, all SRPEDD communities have individuals who must walk to get from place to place. Additionally, there are many others who would prefer to walk for local commutes rather than driving. Communities in Southeastern Massachusetts should continue to expand opportunities in high priority areas for walking, such as connections to schools, shopping and commercial areas, high density residential locations, green spaces, town centers, and other points of significant interest. Steps to achieve these goals will be laid out further in the soon to be published SRPEDD Pedestrian Plan.
T2-T6: Invest in high impact safety solutions for all modes such as improved street lighting, improved sidewalks and crosswalks, access management in commercial districts, and other proven safety countermeasures.
T2-T6: Implement and fund the safety recommendations for the SRPEDD Regional Bicycle Plan, upcoming SRPEDD Regional Pedestrian Plan, and upcoming SRPEDD Safety Action Plan
T2-T6: Work with local municipal officials to continually identify roadways that may not seem dangerous from data analysis alone but still pose safety risks to the community such as intersections where near misses regularly occur.
Potential Funding Opportunities: SMMPO TIP, Safe Streets and Roads for All (SS4A) Grant Program, MassDOT Complete Streets Funding Program.
A safe roadway system is a resilient roadway system. The safer a transportation system is, the more likely it is for people to use it. Improving safety for more vulnerable transportation modes such as walking, bicycling, and transit can encourage use of these modes and decrease the use of single occupancy vehicles.
SRPEDD is developing a Regional Safety Action Plan through a Safe Streets and Roads for All grant. This plan will identify and prioritize improvements at locations with high rates of vulnerable road user serious injuries and fatalities. Communities can use the plan to apply for funding through the Safe Streets and Roads for all grant program (or other funding sources) to improve safety for these types of users in their community.
SRPEDD also maintains and updates a regional evaluation of the 100 most dangerous intersections in Southeastern Massachusetts. Many of these projects are strong candidates for the Transportation Improvement Program and are candidates for MassDOT’s list technical assistance and infrastructural improvements. Communities with dangerous, inefficient, or concerning intersections should continue to identify these as candidates for safety-oriented improvements. Further, communities can connect these safety improvements with additional local goals, such as exploring non-motorized transportation and connecting transportation infrastructure to local land use needs.
Provides a wide variety of safety improvement examples including but not limited to creation of local road safety plans, performing road safety audits, and improving pavement markings. Each section includes examples and visual representations of road improvements as well as their own case studies.
Photo 23. The intersection of Route 6 and Route 136, the most dangerous intersection in the SRPEDD region. (Kevin Ham/SRPEDD)
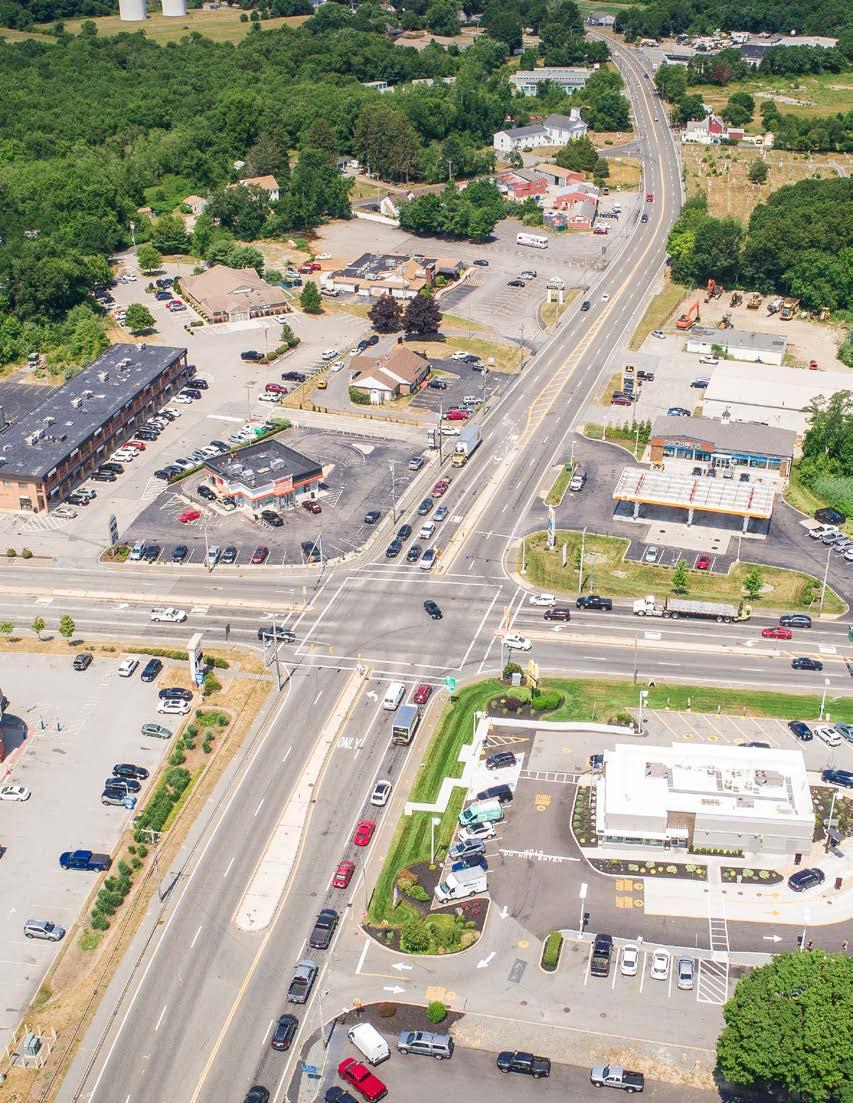
The majority of freight in Massachusetts is moved by truck, and all goods at one point or another are likely loaded onto a truck between their origin and destination. This means planning for truck movement in the region is critical for maintaining both its quality of life and the economic success.
SRPEDD continually evaluates and monitors the performance of roadways throughout our 27 communities. To best evaluate the movement of goods, common metrics include Truck Travel Time Reliability (TTTR), Level of Travel Time Reliability (LOTTR), and Travel Time Reliability (TTR).50
Interstate roads in the region are best evaluated using TTTR. The ratio of TTTR is calculated by dividing the 95th percentile truck travel time (slower conditions) by the 50th percentile truck travel time (usual conditions). A higher ratio indicates less reliability while a lower ratio indicates a more reliable roadway. The Federal Highway Administration (FHWA) established goals for the state of Massachusetts to have a TTTR below 1.85.
Table 5. Truck Travel Time Reliability for SRPEDD Region and Massachusetts. (FHWA, RITIS)
Truck Travel Time
Reliability (TTTR)
Based on the data gathered from the RITIS probe data analytics suite, the interstate system in the region operates efficiently, with minimal disruptions to transported freight due to queuing. There are, however, certain roadways that do exceed the goal TTTR set out by the FHWA.
Unlike TTTR, Interstate Travel Time Reliability (ITTR) is calculated differently and results in a percentage of all person-miles traveled (number of miles traveled by individuals across all modes) that were reliable. The data provides insight into the performance of the interstate highways in the region for all vehicles rather than just trucks, where the higher the percentage, the more reliable the miles-traveled.
According to FHWA, reliable roadways have a level of travel time reliability (LOTTR) lower than 1.50.1 In the same way TTTR is calculated, LOTTR is calculated by dividing the 95th percentile travel time (slower conditions) by the 50th percentile travel time (usual conditions) to produce a LOTTR ratio. Any segments with a ratio above 1.50 are deemed as “unreliable” when calculating the total percentage of miles traveled that are reliable. The higher the percentage of reliable miles traveled, the lower the LOTTR ratio. SRPEDD has had high reliability in recent years since 2017. An interactive map of 2022 problem locations can be found by visiting this link.
Table 6. Interstate Travel Time Reliability for SMMPO Region and Massachusetts. (FHWA, RITIS)
Interstate Reliable
In addition to ITTR and TTTR, data for Travel Time Reliability (TTR) is also available for the SRPEDD region. This data results in a percentage of all person-miles traveled (on all roadways, but just interstates) that were reliable. The data provides insight into the performance of the non-interstate highways in the SRPEDD region.
More information on freight movement in the SRPEDD region can be found in the 2021 Freight Action Plan produced by SRPEDD with an interactive of important freight facilities and high truck traffic locations on the web here.
Table 7. Non-Interstate Travel Time Reliability for SMMPO Region and Massachusetts. (FWHA, RITIS)
Non-Interstate
Reliable Person Miles Traveled
1. A lack of Amenities for Drivers: The lack of a formal rest areas for trucks in the region presents safety issues as drivers have few options for areas to rest between legs of their routes.
2. Climate Vulnerabilities: An increase in extreme weather events may present new challenges especially to coastal communities receiving freight deliveries in a timely manner.
3. Integration of EV Shipping Vehicles: Electrification of freight vehicles will require new facilities to provide a place for charging and rest of drivers.
T2-T6: Continue to track traffic trends throughout the region to identify areas that experience truck bottlenecks using the Regional Integrated Transportation Information System (RITIS) and expanding SRPEDD’s regional modeling efforts with the Boston Region MPO’s TDM23 model.
T2-T6: Continue to participate in Massachusetts Environmental Protection Agency (MEPA) reviews of large-scale developments to ensure that they do not have an outsized impact on local traffic and goods movement.
The Southeast Region of Massachusetts is home to a significant amount of freight shipping. Because of this, each improvement to the current system of shipping in the region will have a significant impact on the broader shipping industry – across the Commonwealth and beyond. Local, regional, private sector, and State-level stakeholders should monitor the benefits of safety, congestion, and system preservation improvements on identified and significant freight routes and roadways; particularly travel time metrics for those within critical economic development areas. By tracking this data with an eye towards improvement, it allows the possibility to identify roadways that operate at substandard levels and provides opportunities to continue and improve the efficient movement of freight.
Best Practice 2: Advocate for public-private partnerships for the construction and maintenance of rest stops for freight vehicles on significant routes.
T3-T6: Investigate ways to initiate a feasibility study with MassDOT to ensure truck drivers have a safe place to park on major trucking routes in the SRPEDD region.
T2-T6: Coordinate with neighboring regional planning agencies to discuss truck parking facilities near the SRPEDD region and any underlying capacity issues.
T2-T6: Document areas where trucks park in an unsafe manner to better understand where parking issues occur regularly (and where there is already demand for truck parking).
Accessible, visible, and appropriately located rest stops are critical for the safety of those who drive freight vehicles. One potential strategy to ensure that these facilities receive the proper integration into freight planning is to work with local, state, and national legislators to consider policy changes that would allow profitoriented businesses to manage and locate rest areas along interstate highways. Current work from Jason’s Law feedback and FHWA truck parking requirements can provide critical insight into providing these necessary facilities for drivers.
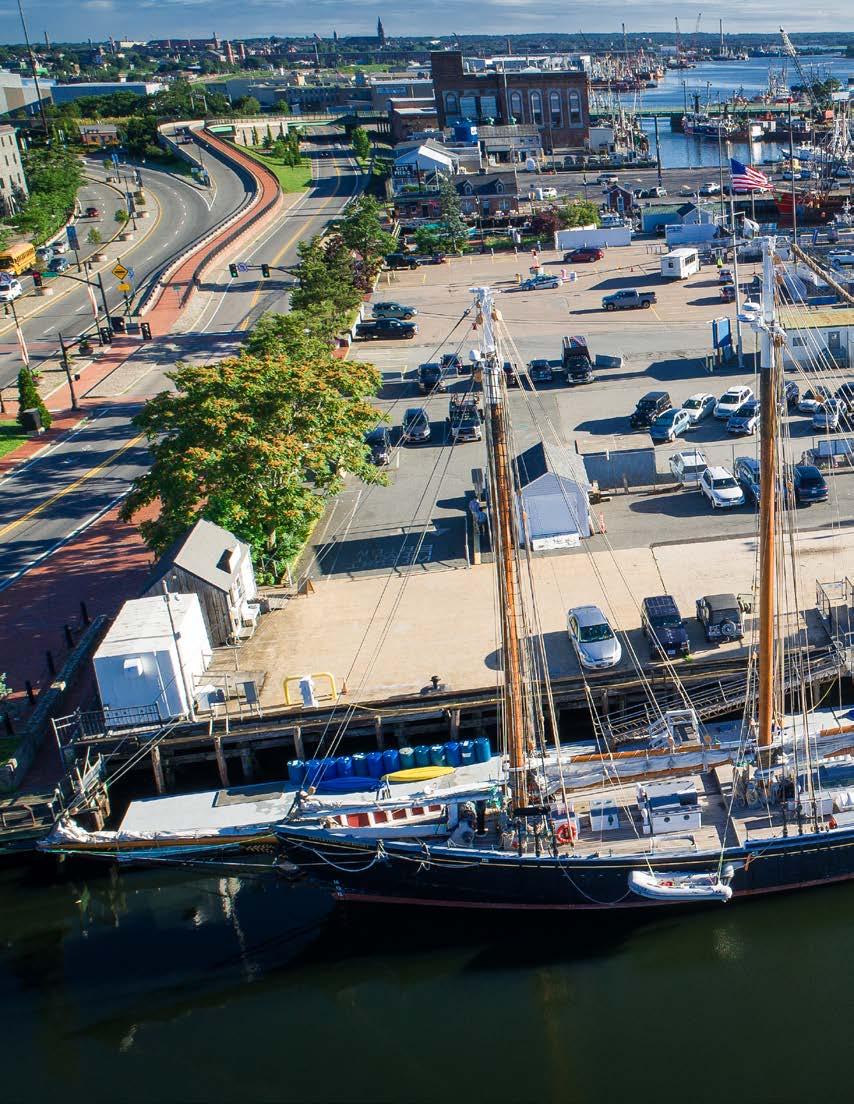
Coastal T2-T6: Collaborate with port officials and businesses to identify problem areas for connecting port facilities to the broader on-land transportation network.
The Southeastern Massachusetts region is home to critical port facilities. To continue to provide efficient, safe, and quick shipping, it is important to maintain open communications between high volume businesses located in port areas and shipping companies. Collaboration across these sectors can continue to create the conditions to identify improvements for this critical sector.
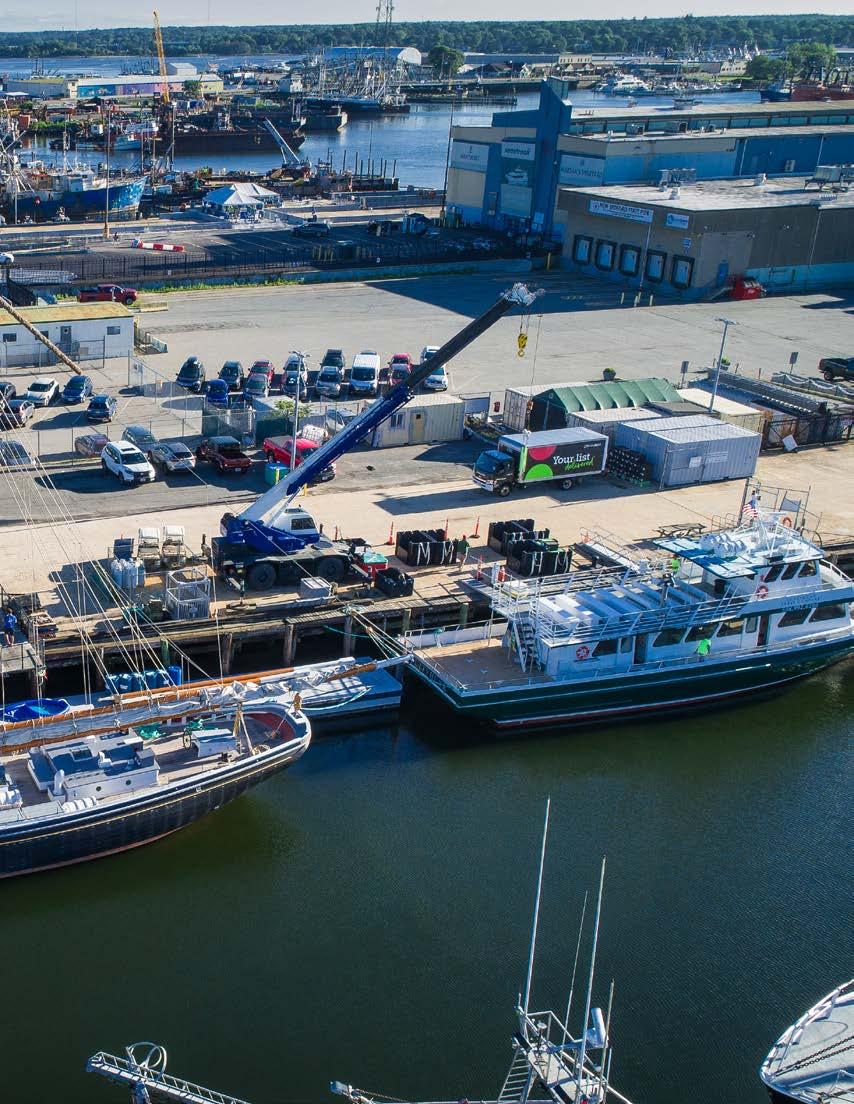
A critical component of planning for resiliency in the SRPEDD region is the ability to respond to emergency evacuations. Currently, the region does not have a regional evacuation process during emergencies, such as hurricanes or flooding. There are, however, several mutual aid networks set up amongst neighboring communities and several local level plans for evacuation procedures and emergency response. In the event of a large-scale regional evacuation, there is currently no way of knowing how these local municipal plans would interact with one another to get residents out of harm’s way.
The Cape Cod Emergency Traffic Plan (2022) was “developed to facilitate the egress of a high volume of traffic from Cape Cod in the event of a hurricane or other potential or actual hazard.” It is almost certain that a hazard affecting Cape Cod, would impact the SRPEDD region: egressing traffic from the Cape would flow through many SRPEDD communities, adding more traffic onto an already strained highway network in the event of an emergency.
The last time a regional emergency evacuation plan was compiled for the SRPEDD region was in September 2006 to address hurricane evacuation from coastal communities. Because of this, SRPEDD is actively creating a shared vision among our communities, neighboring Regional Planning Agencies (RPAs), and the commonwealth of Massachusetts for a regional evacuation route that responds to several potential emergency situations. This work utilizes expertise from SRPEDD’s Homeland Security, Environmental, and Transportation departments.
As of early 2024, the project team is meeting with communities to understand individual needs and existing evacuation procedures to evaluate compatibility with their neighbors and determine how existing plans can be implemented into a larger regional route. This work will continue through 2025 as regional evacuation routes are developed with information gathered from individual communities.
1. Evacuation Route Conflicts: Without an existing regional evacuation route, municipalities are unaware of neighboring local plans, potentially causing serious traffic jams on major roadways during an evacuation.
2. Storm surge impacts on major road systems: I-195, Route 25, Route 6, Route 138, and Route 79 are major roadways in the region that would be affected by storm surge from a hurricane. These roadways would not only be used by individuals living in the region but also by Cape Cod residents passing through the region to safety.
3. Lack of centrally coordinated system: While there are numerous mutual aid networks for law enforcement, fire services, emergency medical services exist, and while MEMA does have a role in coordinating requests to individual municipalities, a regionalized comprehensive system would allow for a coordinated response and planning efforts.
Developing a regional evacuation route plan is a top priority to developing resilience for preparedness in an emergency scenario that requires evacuation. A cohesive regional plan will help prevent traffic jams and local municipalities from sending residents on a collision course as most local plans stop at town borders. Frequent assessments to identify hazards that could impact evacuation routes is important as infrastructure, population, and climate continue to change. Involving local communities, emergency responders, and relevant agencies in planning and decision-making ensures an effective evacuation strategy for the region.
T2-T6: Create, frequently review/update, and prominently circulate a Regional Evacuation Plan.
SRPEDD is developing a regional evacuation route plan involving all municipalities in the region. Although coastal community evacuation would be more likely to happen in the event of a hurricane, the entire region must have a plan to ensure a smooth evacuation process in any emergency scenario. Evaluating the current evacuation routes based on individual community plans suggests that changes may be necessary to improve regional connectivity and provide better information to local and state officials in the event of a regional evacuation.
At the local level, evacuation routes are designed to guide residents away from danger to temporary shelters, typically high or junior high schools equipped to house people during an emergency. The designated routes should be made publicly known to minimize confusion, as many shelters are not located directly on the route. Communities should disseminate information about shelter locations through maps, town websites, or road signage for emergency use.
Regionally, the most effective roads for moving people away from an emergency are those with the highest carrying capacity. In these cases, two-lane minor arterial, collector, and local roads are not optimal for regional evacuation unless they lead to a regionally designated emergency shelter. Multi-lane roads and divided highways can move the highest volume of traffic away from an area at any given time. Interstate highways and divided state highways are the best choices for regional emergency evacuation, followed by undivided multi-lane U.S. highways and state-numbered arterials leading to regional shelters. These road types are easier to communicate in traffic reports during an emergency as they are more familiar to the general public.
T2- T6: Maintain open channels of communication with SEOC and MEMA to inform them of any changes to the local and regional evacuation plans. Keeping them informed of regional evacuation route changes ensures that other state-level organizations can offer support and be aware of local requirements throughout the region. Holding collaborative planning meetings with MEMA and SEOC will ensure that the regional evacuation routes are in line with state plans.
T2- T6: Coordinate training courses and role-playing exercises with MEMA and SEOC. Through these exercises, local authorities can better coordinate during real emergencies by understanding state protocols.
MEMA maintains statewide evacuation plans for the Commonwealth, ensuring effective responses to all hazards. These plans consider the needs of all populations and provide resources for local and regional evacuations. The State Emergency Operations Center (SEOC) plays a crucial role in coordinating and supporting evacuations. SEOC provides operational guidance during emergencies, ensuring timely and effective responses. Representatives from state agencies, local and federal governments, and non-governmental organizations should collaborate to support evacuations within the region. This coordination framework ensures efficient evacuation operations.
Establish a process for the updating and maintenance of evacuation route planning.
T2- T6: Conduct a review of the evacuation plan at least once a year to ensure it remains current and effective. Update the strategy based on community feedback, exercises, and real-world events. To make sure the plan represents the needs and resources of the community, involve local companies, people, and leaders in the planning process. Run public awareness efforts and community outreach to inform locals of the protocols and routes for evacuation.
As communities and infrastructure evolve, evacuation routes may need adjustments. Regular updates ensure that routes remain effective by accounting for new buildings and roads. Emergency evacuation plans are legally required and keeping them up to date ensures compliance and helps prevent negative outcomes and poor management practices. Well-maintained evacuation plans prevent fatalities and injuries during emergencies. By establishing evacuation and shelter-in-place zones, authorities can target vulnerable areas while minimizing unnecessary evacuations. This approach optimizes resource allocation and reduces panic during an emergency scenario.
T2- T6: Establish intergovernmental agreements between municipalities and county governments to pool resources and create response plans to address emergencies. Encouraging collaborations between surrounding municipalities and county administrations will help create better plans for multi-municipality incidents.
A strong county government model would allow for the coordinated planning and responses needed for a modern regional response. The vast majority of emergency situations and evacuations are multi-jurisdictional incidents. Barnstable County on Cape Cod would be a model for the SRPEDD region to emulate. Strengthening county government requires a delicate balancing act between the individual needs and autonomy of partner municipalities (on the one hand), and the strength in responding to collectively and collaboratively to emergencies (on the other hand).
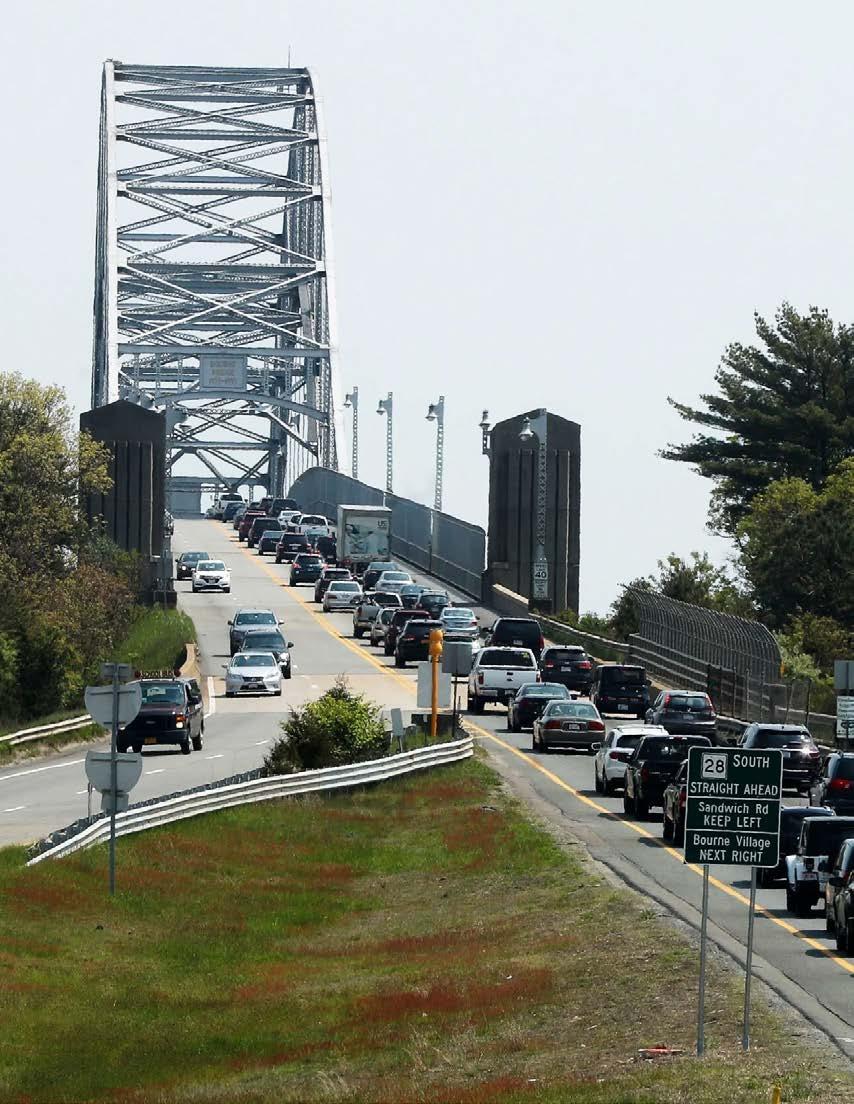
The CCETP is designed to “facilitate the egress of a high volume of traffic from Cape Cod” due to a hazard such as a hurricane. The plan touches on everything from routing, sheltering of residents, logistics of traffic control points, public information & warning, and coordination with the many local and state agencies it would take to move people off the Cape. Because Barnstable County has a strong county-level government, there are personnel that can facilitate the many planning meetings, exercises, and discussions needed to both develop and keep this plan updated as the region changes. Without that strong core government, efforts would need to be led by a group of municipalities, all of which are going to be focused on their own evacuation and traffic threats. Barnstable County can be the strong facilitator, convener, and holder of the master regional plan, as well as to be the conduit through with the plan would flow if implemented, through the Multi Agency Coordination Center (MACC) Emergency Operations Center (EOC) in Barnstable.
1 Washington Department of Health’s resource page on flooding and septic systems.
2 EPA’s resource page on septic systems and drinking water
3 EPA’s resource page on advanced septic systems
4 CDC’s page on PFAs.
5 “Massachusetts nees a regional drought plan.” The Boston Globe.
6 Massachusetts Drought Retrospective 2016-2017.
7 “How We Use Water” EPA.
8 “Sewage can overflow into Mass. waterways when it rains. Fixing the problem isn’t cheap.” WBUR.
9 “What is the installation cost of a Massachusetts septic system?”
Massachusetts Real Estate News
10 “New Massachusetts DEP regulations target Cape Cod septic system.” The National Law Review
11 “About Green Infrastructure” EPA.
12 “Green Stormwater Infrastructure” Watertown, MA.
13 “Water Pollution Control Facility Upgrade and Expansion” MFN Regional Wastewater District.
14 Massachusetts Broadband Institute, Massachusetts State Digital Equity Plan, 2023.
15 Municipal Fiber Grant Recipients.
16 Federal Communications Commission Affordable Connectivity Program.
17 Xfinity Internet Essentials.
18 “ISPs Give Up Challenge to N.Y.’s Affordable Broadband Law.” Broadband Breakfast.
19 “A Predatory and Broken Market: the 2024 Update Analysis of the Individual Residential Electric Supply Market in Massachusetts” Massachusetts Attorney General’s Office
20 Sherman Antitrust Act, 15 U.S.C. § 1-7 (1890).
21 Turetsky, D. (1996, January 11). Antitrust Enforcement in the Electric Industry [Text transcript]. Dept of Justice Antitrust Division
22 “Community Choice Electric Programs: A Survey of Massachusetts Municipalities.” UMass Amherst.
23 “As Massachusetts pioneers a new way to pay for grid upgrades, some solar projects are left waiting.” Energy News Network.
24 “As wealthy tabs go electric, who will pick up the tab for aging gas infrastructure?” Energy News Network.
25 “As solar gained steam in Massachusetts, so did the complaints against solar panel installers.” Boston 25 News.
26 For example, “These energy suppliers say they can save you money. Regulators say it’s a scam.” WBUR and The Boston Globe.
27 “Massachusetts utilities outline plans to handle more electricity.” WWLP.
28 See “Heat pumps are the pathway to energy affordability.” The Boston Globe, and “The movement to get neighborhoods off natural gas gains momentum.” Smart Cities Dive.
29 See “Healey-Driscoll Administration Establishes Nation’s First Office of Energy Transformation.” MA EOEEA, and “To chart its path away from gas, Massachusetts launches energy transformation office.” Smart Cities Dive
30 “Supersize It: The Growth of Retail Chains and the Rise of the “Big-Box” Store.” Emek Basker, Shawn Klimek, Pham Hoang Van. Journal of Economics & Management Strategy.
31 “Americans willing to spend more when shopping locally.” Faire, Wakefield Research.
32 “Expert Alert: The Economic Impact of Shopping Locally.” University of Minnesota Duluth.
33 “Economic Impact: Port of New Bedford.” New Bedford Port Authority.
34 “Agritourism Allows Farms To Diversify and Has Potential Benefits for Rural Communities.” USDA Economic Research Service.
35 Census of Agriculture 2017-2022. USDA.
36 Utilized the Innovation Intelligence tool from StatsAmerica comparing SRPEDD to MAPC.
37 ibid.
38 ibid, based on the most recent three years of data.
39 MA EOLWD.
40 UMass Dartmouth Recent Graduate Surveys 2023, 2022, 2021.
41 UMass Dartmouth Undergraduate Alumni Recent Graduate Surveys (20182023).
42 Small Business GDP, 1998-2014, U.S. Small Business Administration Office of Advocacy.
43 U.S. Census Business Dynamics Survey.
44 As defined by the Bureau of Economic Analysis in Measuring the Small Business Economy
45 Innovation Intelligence Report.
46 The MassINC Polling Group, Small Business Survey, 2024.
47 The Americans with Disabilities Act (ADA) of 1990 mandated that Americans with disabilities have equal access to public transportation as well as places of public accommodation. ADA service must operate the same days and times as the fixed route bus service and travel, at a minimum, within a ¾-mile of fixed bus routes. ADA paratransit/demand response service refers to a flexible transit service in which customers schedule a trip in advance and the vehicle is dispatched based on daily demands of customers.
48 SRPEDD Moving Forward 2050 Public Survey Results.
49 SRPEDD Pedestrian Plan (2019).
50 Regional Integrated Transportation information System (RITIS).

Environmental resilience typically refers to the ability of an environmental system to return to its equilibrium after a disturbance such as a storm or fire. However, another key aspect includes efforts to safeguard the land’s ability to continue providing essential elements that form the basis of any community, including water supply, clean air, and vital green spaces for connection, recharge, and recreation. In the context of the SRRP, environmental resilience is defined by protecting the capacity of the region’s natural lands to protect human health, settlement, and basic needs, while recognizing the importance of enabling natural environments to draw carbon to enable these outcomes.
Best Practice #1: Ensure adequate, regularly scheduled, water quality testing and monitoring.
Best Practice #2: Work to reduce pollution from runoff by limiting impervious surface cover.
Best Practice #3: Maintain groundwater resources by preserving and enhancing natural land cover to enable recharge.
Best Practice #4: Conserve water resources by reducing unnecessary consumption.
Best Practice #1: Increase education on air quality and safety.
Best Practice #2: Increase forestry management to maintain a healthy tree canopy.
Best Practice #1: Conserve and protect farmland and working lands.
Best Practice #2: Conduct a Regional Agricultural Assessment and Producer Needs Assessment.
Best Practice #3: Support the revitalization of conservation districts and agricultural commissions in the SRPEDD region.
Best Practice #4: Support financial and technical assistance programs for implementation of on-farm climate resilience BMPs.
Best Practice #5: Support regional improvements in hydrologic infrastructure and water management practices.
Best Practice #6: Bolster the regional agricultural economy.
Best Practice #1: Upgrade building infrastructure.
Best Practice #2: Develop community amenities for cooling.
Best Practice #3: Enhance urban planning and design for green spaces.
Best Practice #4: Strengthen heat-related community education and engagement.
Best Practice #5: Secure funding and foster partnerships for heat mitigation projects.
Best Practice #6: Address Environmental Justice concerns.
Best Practice #1: Utilize grant funding to provide opportunities for local, naturebased open spaces.
Best Practice #2: Ensure new green spaces are accessible to large local populations and vulnerable communities.
Best Practice #3: Require or encourage new developments to include publicly accessible green spaces.
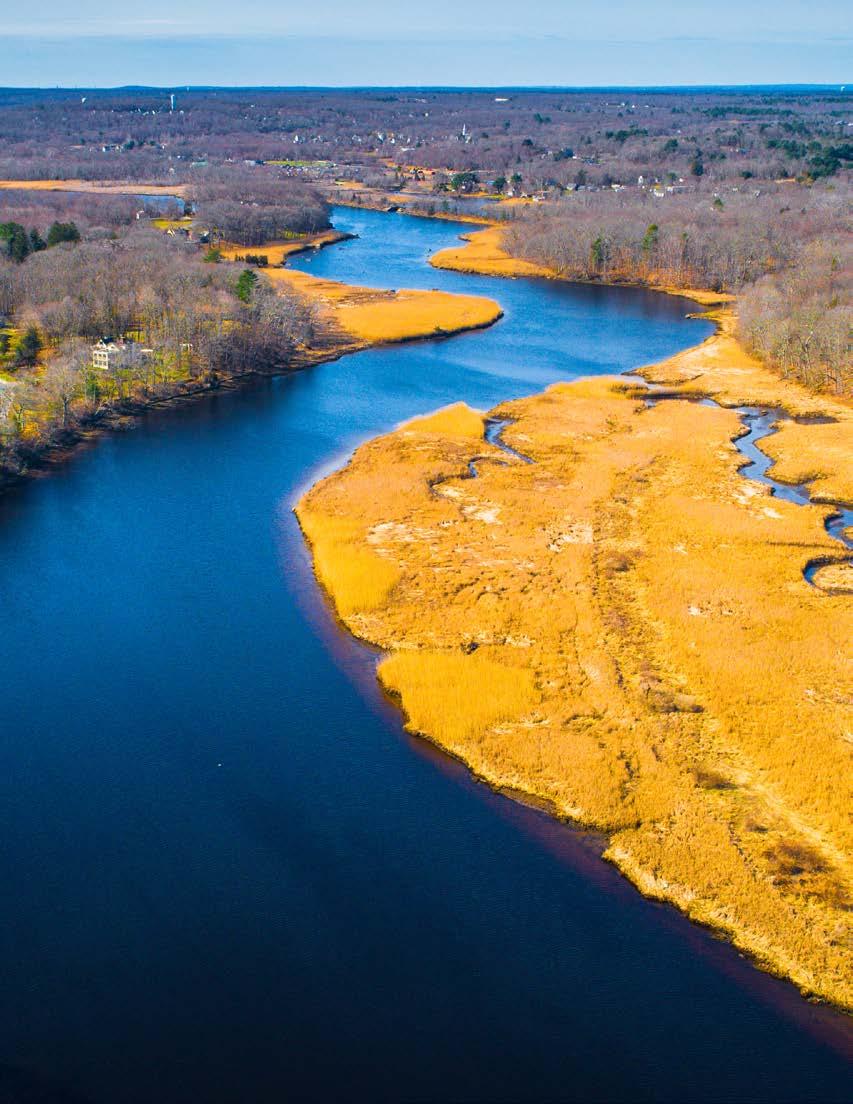
Water is essential for all life on Earth and accounts for approximately 71% of the Earth itself. However, despite the seemingly abundant water supply, oceans, a saline water that is unusable for most human needs, accounts for approximately 97% of that water.1 The remaining fresh water, approximately 2.5%, is able to be used, but only about 1.2% is available for use, the rest is locked up in natural features, such as glaciers, ice caps, and the ground (also known as aquifers). Luckily, this limited supply of fresh water can be rejuvenated and used again through processes such as the water cycle, groundwater recharge, and wastewater treatment plants. Fresh water systems are categorized into different watersheds, which is an area of land that drains the fresh water into a common outlet, such as a bay or a stream.
In the SRPEDD region, the vast majority of our water comes from two primary watersheds known as the Taunton River and the Buzzards Bay, with the Mount Hope Bay, Narragansett Bay, Ten Mile River, and Blackstone watersheds covering parts of the western portion (see the Watersheds in Southeastern Massachusetts map). An important component to maintaining the water quality of these watersheds is to minimize pollution and maximize the potential for groundwater recharge through increasing permeable surfaces in the region. In Southeastern Massachusetts, most municipalities have less than 20% impervious surface, with only Somerset (26.94%) and New Bedford (36.17%) having larger proportions (see the 2016 Impervious Land Cover in Southeastern Massachusetts map). Twenty-four (24) out of 27 of these municipalities have also taken proactive measures to ensure water quality through various Water/Aquifer Protective zoning, and twenty-five (25) out of 27 municipalities are seeking to implement various Municipal Vulnerability Preparedness (MVP) identified measures to keep our water supplies clean for many generations to come.
The importance of implementing clean water strategies can also be seen in the Massachusetts planning document known as the Resilient Lands Initiative: Expanding Nature’s Benefits Across the Commonwealth, where specific actions set by the state for the protecting and restoration of drinking water supplies include:
• Conserve the most intact landscapes within the watersheds of the Commonwealth’s Gateway Cities’ drinking water supplies;
• Expand urban river and stream restoration projects;
• Evaluate updates to upland drinking water protection zones
• Parking lot assessment and restoration
Additionally, as of October 2020, the Massachusetts Department of Environmental Protection (MassDEP) has implemented regulation standards for drinking water in the Commonwealth, under 310 CMR 22.00, which “is intended to promote the public health and general welfare by preventing the pollution and securing the sanitary protection of all such waters used as sources of water supply and ensuring that public water systems in Massachusetts provide to the users there of water that is safe, fit and pure to drink.” Under this legislation, various Surface Water Supply Protection Areas have been identified and are categorized into 3 zones:
• Zone A represents: The land area between the surface water source and the upper boundary of the bank; The land area within a 400-foot lateral distance from the upper boundary of the bank of a Class A surface water source, as defined in 314 CMR 4.05(3)(a); The land area within a 200-foot lateral distance from the upper boundary of the bank of a tributary or associated surface water body.
• Zone B represents the land area within one-half mile of the upper boundary of the bank of a Class A surface water source, as defined in 314 CMR 4.05(3) (a), or edge of watershed, whichever is less. Zone B always includes the land area within a 400-foot lateral distance from the upper boundary of the bank of a Class A surface water source.
• Zone C represents the land area not designated as Zone A or B within the watershed of a Class A surface water source, as defined in 314 CMR 4.05(3) (a).
The Surface Water Supply Protection areas in Southeastern Massachusetts are primarily designated as Zone C, accounting for approximately 97,723 acres, followed by Zone A, approximately 66,173 acres, and Zone B, approximately 31,916 acres.
While the quality and quantity of water supplies are the topmost priority, the distribution of those supplies is also a key component. The Public Water Supply System is classified by Community Water Systems or Non-community Water Systems. A Community Water System serves at least 15 service connections used by year-round residents or regularly serves at least 25 year-round residents, where as a Non-community Water System can either be Non-transient, regularly serving at least 25 of the same persons or more approximately four or more days per week, more than six months or 180 days per year (e.g., private workplaces), or Transient, serving water to 25 different persons at least 60 days of the year (e.g., public businesses). The majority of the Public Water Supply in Southeastern Massachusetts is under Community Groundwater Wells (190) and Transient/Noncommunity (169), with significantly fewer Non-Transient/Non-community (54) and Community Surface Water (20) locations. In addition to Public Water Supply Systems, there are also Private Water Supply Systems, often in the way of private wells, to help distribute fresh water where it is needed.
Alongside Massachusetts specific legislation, there is also Federal legislation requiring certain standards for water supplies. This federal legislation is known as The Federal Clean Water Act (CWA) and requires states to monitor and report on the condition of their water resources. In Southeastern Massachusetts there are 419 water quality stations, 409 of which monitor various surface waters in the way of rivers, streams, and lakes, and 10 of which monitor discharge areas in the way of industrial or storm sewers.
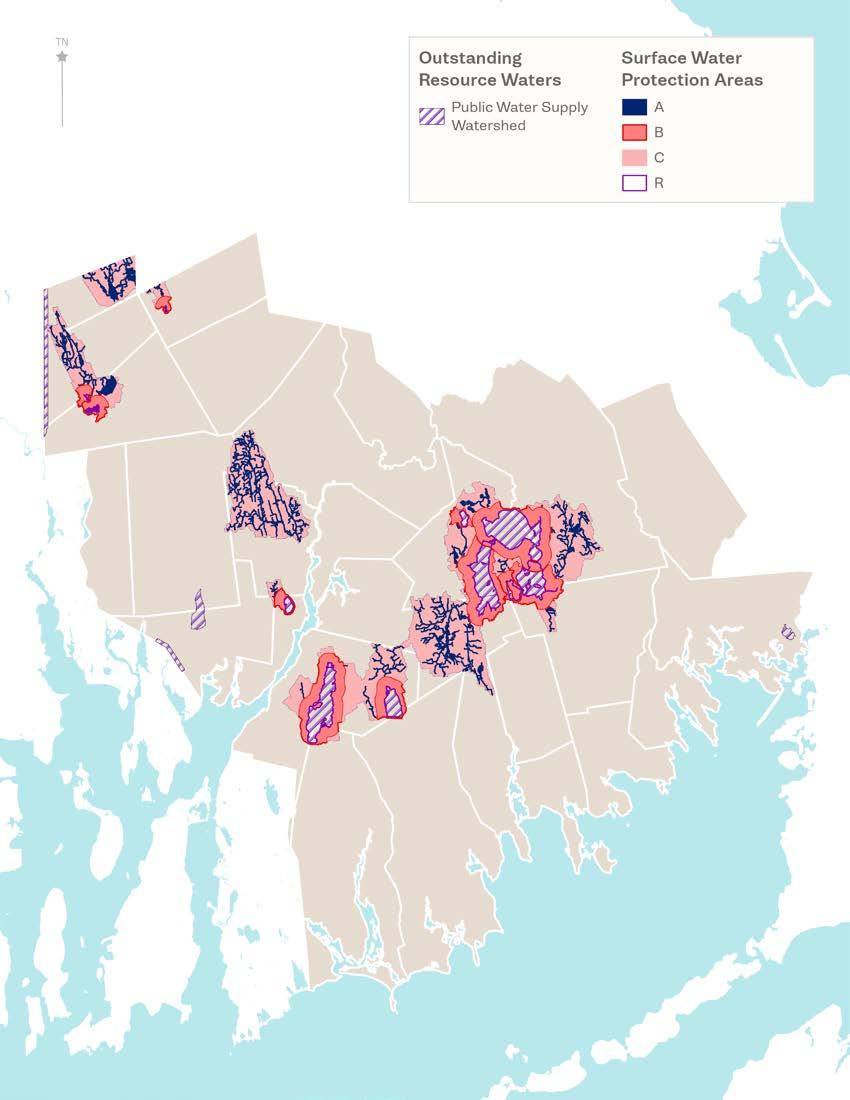
1. Limited Groundwater Infiltration: For rainwater to go through the process known as Groundwater Recharge and refill our underground aquifers, it has to be able to percolate into the soil. This process is slow moving, and things like intense rain events or impervious surfaces due to development limit the amount of water that can seep into the soil.
2. Pollution: To be used for human consumption, water has to be clean from harmful pollutants. Pollutants within our water supplies can be physical items, such as plastic bottles, or chemical, such as excess fertilizer from lawn treatments. Depending on the type of pollutant, the process of removing it from the water can be extremely tricky and time consuming.
3. Quantity of Water: Among many other things, Climate Change is likely to cause increased periods of drought that will put a strain on our limited drinking water. Additionally, if populations continue to increase, there will be a need to stretch the potable water in order to accommodate for the increased consumption.
4. Public Education: As previously stated, pollution is one point of concern when it comes to clean drinking water. However, many pollutants can be traced back to the household level, where the individual may not even be aware of the actions they are taking to cause the water pollution. Bringing education and awareness to the actions that cause household pollution, and helping individuals understand ways to avoid it, can help mitigate the pollution before it even occurs.
Providing clean, reliable drinking water begins with ensuring the source is protected from and free from contaminants. Resilient watersheds and drinking water sources are reinforced by research-backed and data-driven regulatory protections and adequate enforcement by governing agencies from the municipal level to the state level.
T1-T6: All municipalities should regularly participate in water quality testing and supply monitoring to ensure safe, potable, water supplies for their communities.
Funding Opportunities: Planning Assistance Grants (EOEEA), Municipal Vulnerability Preparedness Action Grant (EOEEA), CZM Coastal Habitat and Water Quality Grants (MassCZM).
Many communities cited wanting to continue water quality testing in their MVP. Additionally, communities should continue to track the availability of their water resources as droughts become more common due to climate change.
T1-T3: Rural communities with less development tend to have larger expanses of unaltered natural areas. These communities should prioritize protecting those intact open spaces, particularly wetland buffers and forests within surface water protection areas and aquifer protection zones, from development through adoption of the regulatory best practices outlines above.
T4-T6: Dense suburban and urban communities that are already largely developed tend to have the largest amount of impervious surfaces. In these communities, the above suggested best practices can be applied to redevelopment projects to reduce the quantity of water that becomes runoff during storm events or, at the very least, not contribute further to runoff. Development in these areas should prioritize reuse and infill to prevent further conversion of natural areas into impervious surface.
Funding Opportunities: Sections 319 and 604b Grant Programs (MassDEP/ EPA), Planning Assistance Grants (EOEEA), Drinking Water Supply Protection Grant Program (MassDCS/EEA), Municipal Vulnerability Preparedness Action Grant (EOEEA).
As described in the Ensure Public Water Capacity and Protect Water Quality and Aquatic Habitat sections, one of the main ways to limit waterbody contamination is by limiting the amount of impervious surface cover that leads to stormwater runoff. This can be accomplished through the installation of green infrastructure (see Types of Green Infrastructure) or through regulatory changes to local Board of Health regulations and zoning bylaws. Some primary regulatory changes communities can pursue include:
• Setting roadway, lot size, building and parking area standards to reduce the total amount of impervious surfaces allowed for new developments;
• Setting minimum open space preservation requirements;
• Incorporating tree retention bylaws; and
• Requiring the installation of permeable surfaces for new developments.
Maintain groundwater resources by preserving and enhancing natural land cover to enable recharge.
T1-T3: More rural communities should make the conservation of natural land cover a top priority, as once land has been developed, it becomes harder to restore it to its natural state. However, if land needs to become developed for other uses, taking into consideration the above best practices to limit impacts and avoid the creation of impervious surfaces will be critical in maintaining our groundwater resources long-term.
T4-T6: More urban communities, which often have the largest amounts of impervious surface, should focus on restoring natural landscape where possible, primarily through the planting of native vegetation into the current landscape. This process will enable those communities to improve water resources in the short-term, while in the long-term these communities can work on reducing impervious surface cover when opportunities present themselves.
Funding Opportunities: Planning Assistance Grants (EOEEA), Drinking Water Supply Protection Grant Program (MassDCS/EEA), Municipal Vulnerability Preparedness Action Grant (EOEEA), Land and Water Conservation Fund Grant Program (MassDCS).
Replacing natural land with impervious cover during development prevents rainfall from soaking into the ground and restricts future groundwater storage. Limiting impervious surfaces and maintaining or enhancing natural land wherever possible enables rainwater to percolate into the soil; this allows water to be naturally cleaned by plant roots and the soil, rather than needing to be cleaned through man-made systems.
These preferred outcomes can be accomplished by limiting impervious surfaces during development projects, or through enhancements to the natural landscape that encourage the drawdown process. Some changes communities can implement to accomplish these tasks include:
• Regulatory changes to zoning bylaws and site plan review that encourage land conservation or Low Impact Development (LID);
• Regulatory changes to subdivision rules and site plan review that require on-site stormwater management that prioritizes infiltration and other LID practices;
• Restrict development in aquifer recharge and water supply protection areas;
• Restore degraded or altered natural areas and plant trees and other native vegetation in urban areas to capture rainfall; and
• Create bioswales and/or raingardens in areas where runoff is common.

Funding Opportunities: Massachusetts State Revolving Fund (MassDEP), Municipal Vulnerability Preparedness Action Grant (EOEEA), MassWorks (One Stop for Growth Program), Health Communities Grant Program (U.S. EPA), SNEP Watershed Implementation Grants (Southeast New England Program, SNEP, U.S. EPA Region 1).
In addition to supporting nature’s capacity to recharge groundwater, we can also reduce the quantity of water we withdraw by reducing non-essential water consumption. Through public education and regulatory updates, communities can encourage residents and businesses to reduce water use through the following practices:
• Require native and drought-tolerant plants in landscaping to reduce watering needs;
• Implement sprinkler and non-essential water use regulations and/or bans;
• Install rooftop rain capture devices, such as rain barrels, so that this runoff can instead be used to water plants and for other non-potable household uses, such as flushing toilets; and,
• Educate members of the community about water conservation measures.

Southeastern Massachusetts generally has good air quality conditions; however infrastructure and historical industry legacies may still interfere with or exacerbate certain areas in our region more than others. Since the decline of factories in many of our jurisdictions and territories in the 20th century, air quality has improved significantly. The major concerns of air quality are along traffic corridors, ports, industrial areas, and with wildfire smoke. Another concern for the region is indoor air quality degradation due to the age of buildings and increasing building maintenance costs, which is not regulated by the EPA. Federal air quality monitors tracked by the State of Massachusetts and the EPA that provide data for our region are in New Bedford, Fall River, Brockton, and Providence, RI.
Along Interstate-195 (I-195), I-95, I-495 corridors, there is substantial ozone; particulate matter over 2.5 micrometers also increases in surrounding communities. This air pollution is also prevalent along Routes 44, 79, 140, 24, and 114, but with less severity. The concern for those communities depends on the direction and humidity of air flow, but are constant and increase with more traffic. Roughly 90% of our region is above the national percentile for traffic proximity.
Typically, Environmental Justice communities will suffer the greatest brunt of pollutants from highways, due to their close proximity. This is the case for almost all Environmental Justice communities in our region. We should consider the health implications for those communities as asthma and heart health issues increase with poor air quality, particularly for PM2.5 and ozone.
Communities with major industrial docks or boat traffic also may suffer with poor air quality. This is particularly true for industrial boating and fishing ports that rely on diesel fuel, which is most boats in the United States. Communities with especially poor air quality due to industrial ports are New Bedford and Fall River, which creates risk for health issues caused from diesel-fueled boat air pollutants.
Massachusetts does not have a very strong susceptibility to wildfire compared to other regions or states in the US, but smoke from fires that burn across the MidWest and Canada can have major impacts to the air quality for our Southeastern Region.
Most cities have fire protocols and safety standards for State Forests, which mitigate wildfires and thus wildfire smoke from becoming an issue for our region. All of Massachusetts is in attainment of National Ambient Air Quality Standards (NAAQS). An exceptional event occurred in 2016 during which air quality monitors in Ware and Chicopee measured ozone levels that exceeded EPA’s NAAQS, correlating with wildfire smoke from the Fort McMurray wildfire in Alberta, Canada, which likely affected the readings.
Air quality has a variety of potential health hazards, referenced in the SRRP’s Healthcare section Asthma is an indicator of poor air quality if it is adjusted for age and race, because it can universally signify poisonous or harmful particulates in the air for an entire population. Exacerbations of poor air health can lead to hospitalizations when conditions worsen, which is also a public health signifier. Most SRPEDD communities fall within a range that is not more significant than rates ofor Asthma hospitalization for the State of Massachusetts. New Bedford, Taunton, Wareham, Fairhaven, and Fall River are communities of concern, however, as they have statistically higher hospitalization rates than other communities in Southeastern Massachusetts.
Following the known highways that cross our region, there is a correlation between asthma rates and highway locations. Other health-related issues may come from poor air quality, particularly if there is a specific chemical exuding from a distinct source, like in the case of New Bedford’s diesel ship supply and use.
Wind is one of the largest factors, besides source, that determines air quality health. With the two largest sources of air pollution in our region being ports and automobile transportation corridors, the direction and magnitude of the wind will put certain communities at a higher risk than others. This is particularly true with coastal towns, which have a constant inland breeze coming from the ocean into the cities. There are debates on whether wind will increase or decrease with global climate change; in either case, it is possible that a given community may be unequally impacted by a particular source due to inland wind movement, usually traveling from west to east in our region.
Extreme heat events can also have impacts on air quality. Many conditions associated with heat waves or more severe events – including high temperatures, low precipitation, strong sunlight and low wind speeds – contribute to a worsening of air quality in several ways. High temperatures can increase the production of ozone from volatile organic compounds and other aerosols. Weather patterns that bring high temperatures can also transport particulate matter air pollutants from other areas of the continent. Additionally, atmospheric inversions and low wind speeds allow polluted air to remain in one location for a prolonged period of time.2
The State of Massachusetts does regulate open air quality through permitting and vehicle inspections. Companies that pollute noxious or harmful gasses are required to report to the state how much and how often. Additionally, there is the Massachusetts vehicle check program which requires cars to meet a certain emission standard to drive on our roads. In the automobile sphere, the State of Massachusetts has provided grants for electric vehicle fleets and ride-share grants to encourage electric vehicles and fewer automobiles on the road.
1. High Automobile (Gas and Diesel) Traffic Rates: Because of our region’s location, there is a high amount of travel and shipping in gas- or diesel- fueled vehicles, which negatively impacts our air quality health. This harms the health of our communities, particularly those close to travel corridors, and is only increasing.
2. Increasing Rates of Extreme Heat and Wildfires: Climate change will bring warmer temperatures and increasing wildfire events. Even if it originates from outside our region, wildfire smoke may spread and be carried by the wind to impact our region’s residents. Additionally, the increasing temperatures in the region will exacerbate air quality issues.
3. Difficulty of Enforcement: Air quality is tangible only with tools, instruments, health rates, and sometimes visible smog. This makes regulation and permitting difficult and easy to dodge without obvious violations.
4. Loss of Tree Cover: Trees, especially mature ones, play an important role in purifying local air. Tree removals during development as well as blow downs during storms can reduce tree canopy and the air quality benefits it provides.

Best Practice 1: Increase education on air quality and safety.
T1-T6: All communities can share information with their residents to increase public awareness of local air quality and how their actions may impact it, as well as where to find information about current conditions to inform daily activities. Communities can also alert their members when poor air quality events take place, so people can take action to protect their health when conditions are poor.

As more of our residents understand the risks to our air quality and their health from pollutants, the better decisions they can make to reduce pollution contribution and take measures to avoid going outside when air quality is poor or determining when their indoor air quality needs to be improved.
T1-T3: Pursue proactive land conservation and management in coordination with state initiatives, such as the Executive Office of Energy and Environmental Affairs’ (EOEEA) Forests and Climate Solutions; work in partnership with various state departments and programs including, but not limited to Department of Fish and Game’s (DFG) Division of Fisheries and Wildlife, Department of Conservation and Recreation’s (DCR) Division of Water Supply Protection, and DCR’s Public Lands Forestry Program. Adopt forestry management practices, with support from the U.S. Department of Agriculture’s (USDA) Natural Resources Conservation Service (NRCS).
T4-T6: Participate in DCR’s Urban and Community Forestry and Greening the Gateway Cities Programs; pursue local zoning, permitting, and siteplanning that minimizes clear-cutting and emphasizes a health urban forest and tree canopy. Dedicating more resources to local tree wardens and urban forestry programs can help with maintaining and protecting tree canopy in urban areas.
Both rural and urban forestry management practices can protect tree health in our forests and neighborhoods. Healthy, mature trees protect local air quality, and are more likely to withstand extreme winds than diseased or damaged trees, reducing the likelihood of blowdowns. Tree blowdowns during storms not only reduce tree canopy, but dead standing wood in forests also contributes to wildfire hazards.

ADDITIONAL COMMONWEALTH FORESTRY PROGRAMS
• Programs and Services for Forest Land-Owners
• Grants for Forestry and Forest Fire Control
• Forest Stewardship Programs
• DCR Watershed Forestry Program
Farmland is among the most valuable and vulnerable resources in the SRPEDD region. Under the stewardship of producers, farmlands of southeastern Massachusetts enhance climate resiliency by providing food to communities, contributing to the local economy, offering ecosystem services, protecting vital natural resources, maintaining the rural heritage and quality of open space of lands. Approximately 42% (215,000 acres) of the land in the SRPEDD region is categorized as prime farmland, farmland of statewide importance, or farmland of unique importance. Prime farmland has the best combination of soil properties, growing season, and moisture content required to produce high yields of crops in a sustained and economically generative manner.3 Farmlands of statewide importance are also well-suited for crop production with some limitations.4 Farmlands of unique importance are areas best suited for very specific crop types, such as cranberry production.5 Statewide, the region hosts a high density of farmland of state importance and farmland of unique importance. Municipalities with the highest percentage of productive farmland are Mansfield at 61% and Marion at 60% (please note that these proportions indicate areas of soil quality, not land use or active agriculture).
The region’s farmlands dedicated to cranberry production are of special significance to Massachusetts agriculture. Massachusetts ranks as the third largest cranberry producer globally, after Wisconsin and Quebec), and cranberries are the state’s top globally competitive agricultural commodity.6 The largest concentrations of cranberry acreage are found in Carver, Wareham, Middleboro, Plymouth, and Rochester, all of which are within the SRPEDD region except the town of Plymouth.7 Massachusetts cranberry production generated $59,652 million in market value in 2021, and sales accounted for 13% of the state’s agricultural market.8
The region’s agricultural lands also generate a wide diversity of products including vegetables, fruits, nursery and floriculture crops, wine, grains, seeds, grasses, livestock, eggs, dairy, wool, pullets, seafood, and other animal products.9 Cultivation practices include viticulture, aquaculture, horticulture, hydroponics, urban agriculture, animal husbandry, and native plant cultivation (such as cranberries). Scale and distribution type in the region ranges from small-scaledirect-to-consumer activities to large-scale commodity contracts. Plymouth County, largely within the SRPEDD region, holds the highest agricultural market product value in the state, and the fourth highest density of land in farms.10
In addition to agricultural products, the farmlands of southeastern Massachusetts provide the region with essential ecosystem services. Ecosystem services offered by agricultural systems include carbon sequestration, climate mitigation, nutrient retention, erosion and flood control, floodplain management, and provision of migratory havens and stop-overs for critical species. When healthy soils practices are implemented, these ecosystem services increase in effect and contribute to clean water and air. Healthy soils practices are climate mitigative as they improve carbon sequestration, retain nutrients and sediments and reduce pollution in air and water, and buffer the effects of floods and droughts.
Farmlands and agricultural operations also bring economic and social goods to the region. Agricultural enterprises provide jobs and commerce in rural areas while maintaining the community’s historic rural character and identity. Farms also bring economic activity to the region through agrotourism, farmer’s markets, and local foods attractions like farm-to-table restaurants. Government programs like the Supplemental Nutrition Assistance Program (SNAP) and Healthy Incentives Program (HIP) incentivize and reduce the cost of local produce for low-income populations, and the presence of local agriculture can improve food security and nutrition for these communities.
Despite the economic, social and environmental benefits provided by the region’s farmlands, these lands and their associated agricultural operations are at high risk in the region due to development pressures, global food supply shifts, and climate factors. In MA between 2014 and 2017, 24,700 acres of natural land in MA were converted to development, which is a rate of 13.5 acres per day.11 The SRPEDD region falls within the Massachusetts ‘sprawl frontier,’ which is the area experiencing the highest rates of development in the state. Wareham, Plainville, Norton, Rochester and Middleborough are at particularly high risk of natural land conversion and are listed in Mass Audubon’s ‘Towns with Highest Rate of Development’, which provides the top 20 towns with highest land conversion rates in the state.12
In contrast to the rates of development, the SRPEDD region is conserving land at some of the lowest rates in the state. Much of the region ranks in the lowest quintile, with land conservation happening at a rate of 0-17% between 2012 to 2017. Threats from development arise due to a variety of factors including the high value of the land for development, challenges with generational transfer, the difficulty in maintaining agricultural profits, and from underuse of agricultural land. In 2016 only 8% (40,500 acres) of prime farmland in the SRPEDD region was used for agricultural production. Of these working lands, 15% are protected in perpetuity under conservation restriction and 13.7% have short-term protection through Mass. General Law c.61A, § 14 (known as Chapter 61A), which provides preferential tax treatment for working agricultural lands (see Map 2 below). An additional 0.5% of working lands are under forms of alternative limited legal protection. These protections on land can assist in farm viability by relieving economic pressures on agricultural operations and preserving productive soils for agricultural use.
Climate factors including more frequent droughts, flooding, pest pressures, and extreme weather events also pose threats to farmland productivity and operational viability in the SRPEDD region. In relation to climate pressure, in the State Hazard Mitigation and Climate Adaptation Plan the Massachusetts Executive Office of Energy and Environmental Affairs identified agriculture as one of the state’s most at-risk assets, and agricultural operations as one of the most highly vulnerable industries to climate stressors.13 The report indicates that drought, flooding, pest pressure, and wildfires are predicted to be the highest
threats to agriculture in Massachusetts. State categorizations of farmland productivity are affected by hydrometeorological factors and shifts in climate will affect the productivity and type of farmlands. Extreme weather events, changes in soil productivity, food system economic shifts, and other climate factors can put significant stressors on producers and impact farm viability in the SRPEDD region.
Conservation restrictions on farmland, including working-lands protections, serve as essential regional climate resiliency tools. Protected farmland offers significant carbon sequestration capacity and ecosystem benefits, especially over time in contrast to the environmental impacts of development. Farmland managed under a conservation restriction, such as the state’s Agricultural Preservation Restriction (APR) program, includes a conservation plan that preserves the environmental value of the land and the agricultural operation. The conservation plan made with the Natural Resource Conservation Service (NRCS) includes recommendations, technical assistance, and access to funding to improve the sustainability of the operation and use of climate-smart practices. Ecosystem services provided by preserved farmlands include reduced erosion, habitat passage, buffer protections, preserved waterways, cleaner air, flood plain water retention, heat island mitigation, and carbon sequestration.
Preserved farmlands can also assist in climate resiliency by improving regional food security, increasing public access to open space. When municipalities enter into conservation agreements with producers, agricultural operations protected through municipal trust provide public benefit as community partnerships can be developed to improve access to open space, environmental education, and food access.
The risk of losing agricultural land to development is related to economic insecurities farmers face, which are dependent on global, local, and regional economic factors. Economic factors that are often outside of a producer’s control have a significant impact on farm viability. While efforts to support whole farms need to go beyond ‘buy local’ initiatives, local and regional sales of farm products can support farm viability in the SRPEDD region alongside other efforts. Agricultural economic activities such as farmers markets, farm-totable restaurants, farm-to-institution programs, agriculture-related events, and agrotourism can support farm income and increase regional agricultural viability.
Support for middle-of-the-supply-chain infrastructure improvements can also assist with regional agricultural viability by increasing options and capacity for the preservation and distribution of foods, which in turn expands the product type, length of time, and quantity of sales farms can generate throughout the year. Expanding regional and local agricultural economic activities in the SRPEDD can both support farm viability and increase tourism and other forms of economic activity in the region.
In a climate context, agricultural activities and productive farmlands are some of most valuable and vulnerable assets in the SRPEDD region. Farmland preservation and sustainable farm operations improve regional climate resiliency, and initiatives are needed to provide support for producers and associated entities in the SRPEDD region. Effective support mechanisms for regional agricultural economies include marketing initiatives for local foods, development of agrotourism, financial and technical assistance in farm business planning and development, and specialized local farm subsidies and administrative support in grant writing. Currently, 8 out of 27 of the municipalities in Southeastern Massachusetts are seeking to implement various identified Municipal Vulnerability Preparedness (MVP) measures to support farm viability in the region.
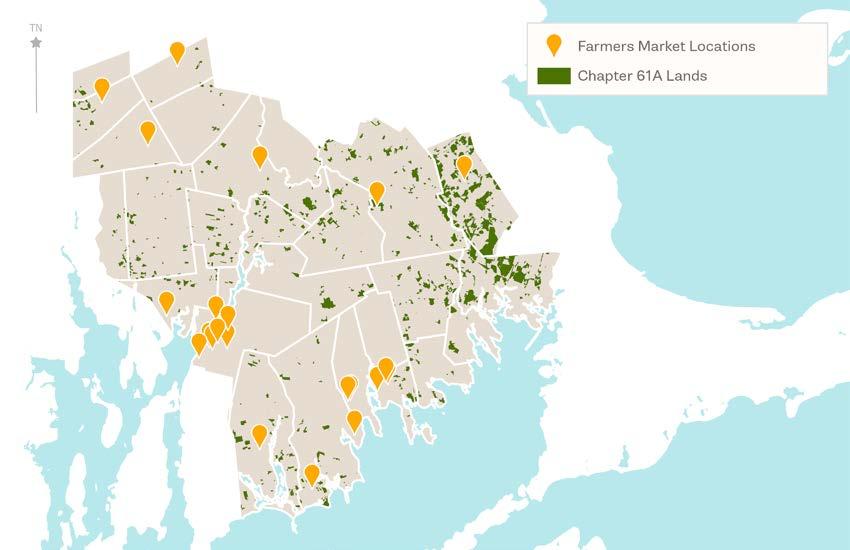
1. Climate Change: Heightened impacts from droughts, floods, pest pressure, temperature extremes, and severe weather events will increase stress on farms and can reduce farm productivity and viability. Farms in the SRPEDD region are vulnerable to increased erosion, loss of soil organic matter, crop loss, and overall reduction of farmland productivity due to intensified climate factors.
2. Farmland Conversion: Southeastern Massachusetts is experiencing some of the highest land conversion rates in the state, leading to losses of farmland throughout the region.14 Only 2.8% of the region’s 215,000 acres of productive farmland are under permanent protection through working lands conservation restrictions that protect farmlands and support farm operation viability.
3. Regional improvements needed in hydrologic infrastructure: Stormwater and wastewater overflows contribute to flooding and toxic pollutant deposits on farms, which cause crop loss and impact use options and productivity of land. Outdated damns, culverts, and stormwater and wastewater systems contribute to regional flooding on farmland.
4. Heightened threats to agricultural economic viability: Agricultural operations face unique economic vulnerability in a climate context, as productivity is sensitive to climactic factors. Environmental stressors related to climate change can increase management costs for farmers in our region. Crop losses and soil productivity decline reduce farm income.
Measures are needed to protect farmland and support agricultural viability in the SRPEDD region in a climate context. Conservation restrictions on agricultural land, increased uptake of on-farm best management practices (BMPs), and regional strategies to manage changes in hydrometeorological patterns can all support agricultural viability and climate resiliency in Southeastern Massachusetts.
Many best practices of supporting resilient agricultural initiatives have already been documented in various Massachusetts planning documents, such as The Resilient Lands Initiative: Expanding Nature’s Benefits Across the Commonwealth, and the Massachusetts Farmland Action Plan 2023 – 2050. Aligning our goals and best practices to those of the State will help us promote the short and long-term success of sustainable agriculture in the SRPEDD region.
T1-T3: Municipalities can work with local land trusts to identify priority farmlands and working lands that may be facing threats of development from generational transfers or financial hardship. Through community Master Plans and Open Space and Recreation Plans, towns can identify goals and values for farmland preservation and incorporate farmland preservation into resiliency planning and visions for town culture and identity. Town representatives can develop relationships with local farmers and learn how to best support the preservation of farms and farmland in their area.
To secure the future of agricultural operations in the SRPEDD region, efforts to permanently protect priority farmland through conservation restriction must be intensified. High priority farmlands should be identified for conservation goals, and community efforts undertaken to begin communication and strategizing with farmland owners, producers, municipal leaders, agricultural associations and land trusts.
These efforts can support fundraising strategies to protect productive farmlands in the SRPEDD region. This approach will help ensure that these valuable working lands remain dedicated to agriculture for generations to come.

The APR program is a voluntary initiative that aims to protect farmland by offering farmers a financial incentive to place a permanent deed restriction on their land, thereby keeping it in agricultural use. This program has been successful in conserving thousands of acres of farmland across Massachusetts, ensuring that these lands remain available for farming despite development pressures. The APR program has proven effective in protecting agricultural land in areas facing significant development pressure. By offering fair market value compensation to landowners, the program encourages participation and secures long-term agricultural viability.
T2-T3: SRPEDD can conduct a regional agricultural assessment that involves an inventory of the region’s farmlands, agricultural operations and products, current trends and predictions, regional strengths and threats to farm viability and land preservation. Outreach to producers, municipalities, Agricultural Commissions, and regional agriculture non-profits should be conducted to determine the trends in the region and the needs of producers.
To preserve the role of the agricultural community in sustaining natural landscapes and ensuring economic prosperity among producers, municipalities should consider agricultural diversification and land protection strategies that would best support producers in their community. To determine the best practices for supporting producers and regional agricultural efforts, a needs assessment should be conducted of producers in the SRPEDD region. A regional study would convene rural, urban, and agricultural communities and consider the many initiatives, policies, and funding strategies that would support the sustainability of the agricultural industry in the SRPEDD region in the modern economy, and plan for climate resiliency and mitigation through agricultural practices and land preservation.

Farms Under Threat 2040 is American Farmland Trust’s initiative to document the status and threats to farmland, while providing recommendations and policy solutions to protect the land. The project identifies the challenges farmers face in achieving economic viability and barriers to farmland protection. Farms Under Threat 2040 Part II also identifies conservation practices and soil health practices that governments can support through financial and technical assistance.
T1-T3: Revitalization of the Bristol County Conservation District and support of expanded efforts in the Plymouth County Conservation District and Agcoms would be a major step in assisting farm viability in the SRPEDD region. SRPEDD can work in partnership with the Massachusetts Association of Conservation Districts (MACD) and regional Agcoms to revitalize the Bristol County Conservation District and support the Plymouth County Conservation District. SRPEDD can also work with municipalities to support existing Agcoms and to institute them in municipalities where one has not yet been formed.
Conservation Districts (CD) in Massachusetts assist farms in economic and environmental sustainability practices, which assist in farmland conservation, farm viability, and climate resiliency. CD leverage grant funds from the state to support agricultural initiatives in their region. The SRPEDD region is located primarily withing Bristol County and Plymouth County, and the Bristol County Conservation District has been inactive. Agricultural Commissions (Agcoms) in the SRPEDD region also play a key role in supporting agricultural efforts and require municipal support to maintain activities and community involvement. Municipalities with Agcoms in the SRPEDD region include Carver, Dartmouth, Dighton, Fairhaven, Mattapoisett, Middleborough, Plainfield, Rehoboth, Rochester, Taunton and Westport.

The Massachusetts Executive Office Energy and Environmental Affairs Division of Conservation Services provides District Innovation Grants to Conservation Districts and to restore, protect, and improve the land, forests and water of the Commonwealth. The District Innovation Grants can be used by Conservation Districts to support conserve the Commonwealth’s agricultural lands and support farm viability and conservation practices.
T1-T5: SRPEDD municipalities can work with the USDA Natural Resource Conservation Service (NRCS) and the Massachusetts Department of Agriculture (MDAR) to assist farms in receiving financial and technical assistance from these organizations for climate-smart practices. State and federal programs are available to assist farms in adopting climatesmart practices, but producers often face barriers in connecting with these resources due to time and administrative capacity restraints. Municipalities should develop relationships with farmers and identify areas where they can strengthen support by assisting in connecting farmers with available resources. Outside of state and federal programs, there are also financial and technical assistance initiatives offered through non-profit organizations that serve MA producers, including American Farmland Trust and Northeast Organic Farming Association of Massachusetts (NOFA MA).
For agricultural land to maintain its current production capacity, on-farm climate mitigation strategies are needed to reduce stressors from climate impacts on regional agricultural production. Funding is needed in the region to provide financial and technical assistance to farms to support the adoption of the following climate-protective best management practices (BMPs):
• Establish hedgerows;
• Incorporate perennials;
• Iinstall swales, two-stage ditches, drainage basins, and other waterdiversion and absorption techniques;,
• Implement soil building practices such as compost application,; and,
• Utilize precision irrigation equipment.

The Massachusetts Department of Agriculture (MDAR) Climate Smart Agriculture Program (CSAP) provides financial and technical assistance through grants to farms interested in improving their environmental and economic resiliency and adopting practices to mitigate and adapt to climate change. This program supports infrastructural improvements, adoption of climate-smart practices and the general goals identified in the Massachusetts Local Action Food Plan. This program highlights the importance of state-supported initiatives that provide both financial and technical assistance to farmers, enabling them to adopt climate-resilient practices that enhance soil health, water retention, and overall farm productivity.
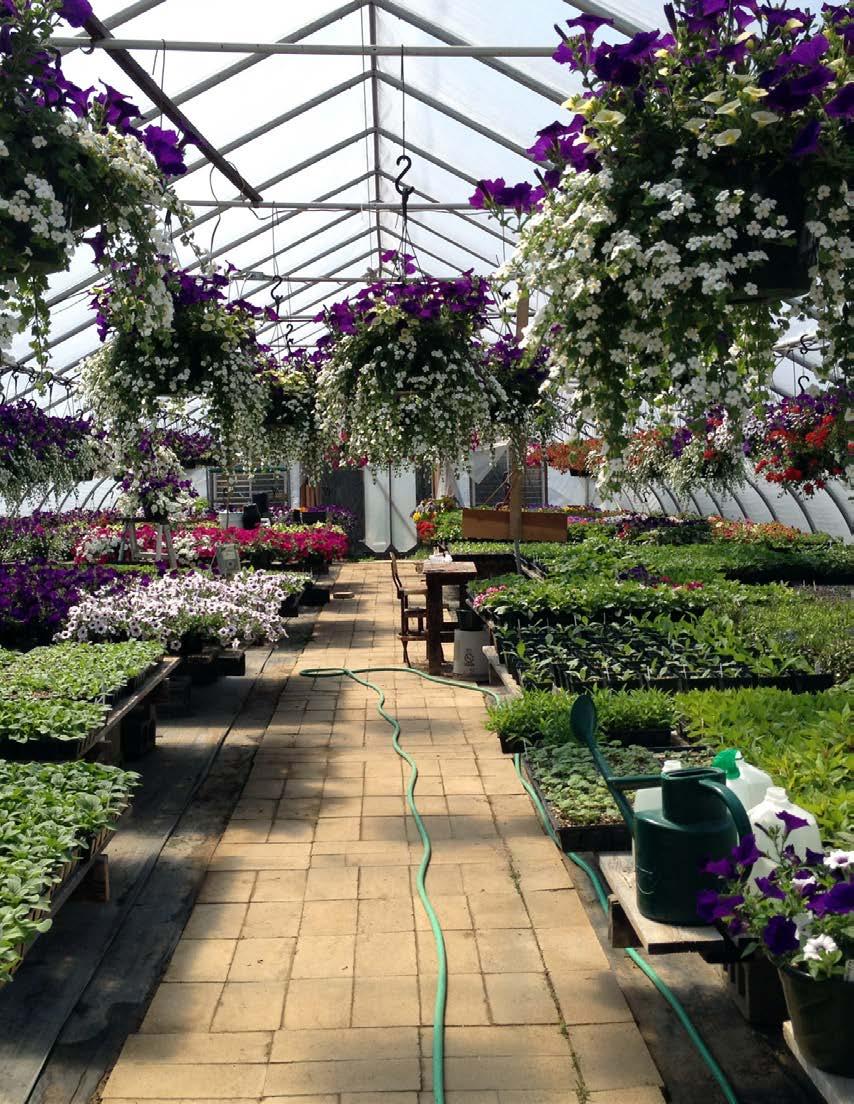
T1-T6: Municipalities in SE MA can review existing stormwater and wastewater infrastructure and identify areas where current infrastructure is not adequate to meet the needs of predicted increases in precipitation and pollution from development. Towns can plan to update aging and problematic infrastructure along with improvements in permeability of surfaces. Areas of impervious surfaces can be updated with pervious materials, such as pervious pavers and porous asphalt. Drainage patterns can also be improved with plans to install green infrastructure in target zones.
Flooded farms in MA have experienced crop loss from pollutants introduced via stormwater runoff and wastewater overflows; however, agricultural flooding can be mitigated through regional storm and wastewater BMPs. Climate adaptation and mitigation strategies are needed at the regional level to divert and retain water in extreme weather events, which can mitigate flooding on farms. In a climate context, aging hydrologic infrastructure is not adequate to direct stormwater runoff away from agricultural fields and can contribute to flooding through overflows. Improvements and updates in regional hydrologic infrastructure and regional BMPs related to water diversion, and water quality and access are needed to manage anticipated climate events. Improved management of stormwater and wastewater can reduce flooding and toxic pollutant contamination of agricultural fields. Funding is needed in the region to support regional water management practices and infrastructure improvements.
T1-T6: Municipalities can create Local Foods Commissions to address the marketing and retail needs of farmers within the community. These Commissions can work collaboratively with Agricultural Commissions, neighboring municipalities, and regional organizations, such as the Southeastern Massachusetts Agricultural Partnership (SEMAP), to identify mechanisms and address regional agricultural economies. Local Foods Commissions can apply for grants to support the development of local foods initiatives at the municipal or regional level. There are state and federal grants available to strengthen food economies, such as the MA EEA Food Security Infrastructure Grant Program, the U.S. EPA Local Foods Local Places planning assistance program, and the USDA Agricultural Marketing Service Farmers Market Promotion Program
Additional economic support of farms is needed to support farm viability amidst intensifying and unpredictable climate stressors. The economic viability of local agricultural operations can be improved through local-foods marketing initiatives, farm-to-institution programs, agrotourism, development of regional food hubs, improvements to middle-of-the-supply-chain infrastructure (i.e. regional processing facilities), and educational initiatives informing the public about the region’s agricultural products and history.
SEMAP is a non-profit organization dedicated to preserving and expanding access to local food and sustainable farming in Southeastern Massachusetts. The partnership offers programs supporting local food marketing, farm-to-institution initiatives, and educational outreach. SEMAP also collaborates on the development of food hubs and processing facilities, which are crucial for strengthening the local food economy. SEMAP’s work illustrates how regional partnerships can effectively support the agricultural economy by connecting farmers with local markets, promoting agrotourism, and enhancing infrastructure that supports local food distribution and processing.

There are clear areas of extreme temperature concentration across the SRPEDD region, particularly when we examine extreme heat and urban heat islands. There is no universal threshold for extreme temperatures because extremes are relative to the average or typical weather in a region. Extreme heat for Massachusetts is usually defined as a period of 3 or more consecutive days above 90 degrees Fahrenheit (°F), but more generally as a prolonged period of excessively hot weather, which may be accompanied by high humidity.15 A heat wave is defined as three or more days of temperatures of 90°F or above with these periods characterized by unusually high atmosphere-related heat stress, which can have adverse health consequences. Extreme cold temperatures are characterized by the ambient air temperature dropping to approximately 0°F or below.
Historically, New England has been characterized by cold winters, with homes and infrastructure generally built to withstand cold temperatures. Constructed in previous decades when summer temperatures were more moderate, our existing building stock is not inherently well-equipped to deal with extreme heat. For example, a 2020 federal survey estimated that 13% of Massachusetts households did not use air conditioning equipment.16 Outside of residential contexts, extreme heat can affect other institutions and be particularly concerning for those who work outside. While we need additional data at the state and local level, an estimated 41% of school districts representing about 36,000 schools nationwide, need to update or replace heating, ventilation, and air conditioning (HVAC) systems in at least half of their schools to provide adequate air conditioning.17 As identified by the Natural Resources Defense Council (NRDC), in 2021, 960,851 Massachusetts workers were employed in high risk industries for heat impacts, with no state-wide heat safety standards existing or in development.18 19 In 2020, 54,454 workers in Bristol County (26%) and 37,722 workers in Plymouth County (21%) were employed in these same high-heat risk industries.20
Table 1. Average Rate of Hospital Visits for Heat Related Illness. (State Hazard Mitigation Plan data excerpt for SRPEDD Counties)
County
Rate of Emergency Room Visits for Heat Stress (per 10,000 residents)
Rate of Hospital Admissions for Heart Attacks (per 10,000 residents)
Rate of Emergency Department Visits for Asthma per 10,000 Residents
Rate of Emergency Department visits for Asthma for Children under age 15 per 10,000 Residents
Extreme heat exposure can result in deadly acute illnesses, such as heat exhaustion and heat stroke, and exacerbate chronic conditions, such as heart, renal, and respiratory diseases (the body’s cooling mechanisms tax these internal systems). In fact, heat is the leading weather-related killer in the U.S.21 A study of heat-related deaths across Massachusetts estimated that when the temperature rises above the 85th percentile (hot: 85-86°F), 90th percentile (very hot: 87-89°F) and 95th percentile (extremely hot: 89-92°F) there are between five and seven excess deaths per day in Massachusetts. As reported in the Massachusetts State Hazard Mitigation and Climate Adaptation Plan, from 2002-2012, Bristol and Plymouth counties were among the counties with the highest annual average age-adjusted hospital admissions for heart attack, and Plymouth County had the second highest average age-adjusted rate of hospital admission for heat stress. As discussed further in the vulnerabilities section below, climate modeling points toward increased heat wave durations and total high heat days into the coming decades because of climate change.
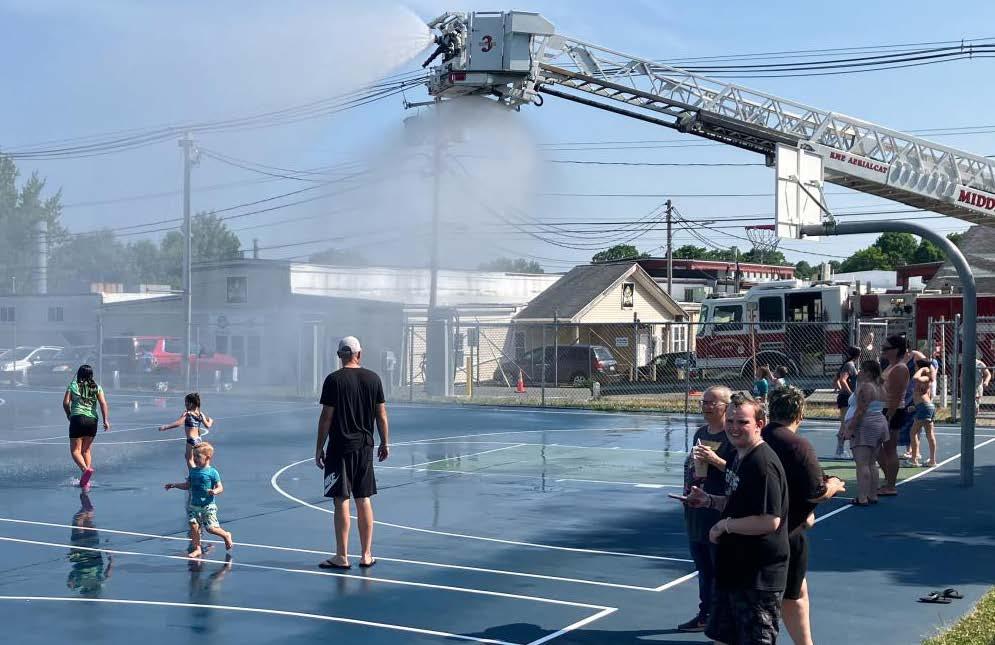
Heat risks and impacts are elevated in heat island areas – the term for pockets of heat in built-up landscapes that tend to be hotter than nearby rural or shaded areas. As explained by the Environmental Protection Agency (EPA): “Structures, such as buildings, roads, and other infrastructure absorb and re-emit the sun’s heat more than natural landscapes, such as forests and water bodies. Urban areas, where these structures are highly concentrated and greenery is limited, become ‘islands’ of higher temperatures relative to outlying areas.”22 Heat island effects result in daytime temperatures that are 1-7°F higher than temperatures in outlying areas and nighttime temperatures that are 2-5°F higher. Humid regions like the eastern US and cities with larger and denser populations experience the greatest temperature differences.
There are several factors that contribute to heat island impacts, including: (1) reduced natural landscapes in urban areas; (2) urban material properties, such as pavements or roofing, that absorb and emit more of the sun’s heat compared to vegetation; (3) urban geometry related to the dimensions and spacing of buildings blocking wind and heat release; (4) heat generated from human activities, such as vehicles, air-conditioning units, and industrial facilities; and (5) weather and geography, with calm and clear weather conditions resulting in more severe heat islands. These factors can also cause heat levels to vary within cities, with urban parks and residential areas typically cooler than downtown areas. Surface temperatures can even vary within a given facility (see the case study section for a description of Groundwork South Coast’s evaluation of heat levels in Riverside Park, New Bedford.) Heat islands can affect communities by increasing peak energy demand during the summer, air conditioning costs, air pollution and GHG emissions, heat-related illness and death, and water quality degradation.
ResilientMA provides spatial datasets that estimate Land Surface Temperature (LST) for each RPA region. These datasets are created by combining estimates of surface temperature, sourced from the Landsat 8 satellite, for days in 2018, 2019, and 2020 where the daily air temperature maximum exceeded 70°F (see the SRPEDD Land Surface Temperature Map). When indexed and averaged across years, these datasets show relative temperature across the region, and identify “hot spot” areas that rank in the top 5% of Land Surface Temperature Index values.
Hot spots are concentrated in SRPEDD’s urban core areas (Fall River, New Bedford, Attleborough, Taunton) as well as town/village centers (Middleborough, Wareham, Mattapoisett, North Attleborough, Mansfield) and commercial centers (Dartmouth, Seekonk, Swansea, Raynham, Somerset). Hot spot patterning also follows some of SRPEDD’s key transportation corridors, particularly Route 1, Route 6, and Route 44. In three municipalities, hot spot areas span 10% or more of the community’s total area: New Bedford (45%), Fall River (18%), and Mansfield (10%). There is also an observable overlap between hot spots and Environmental Justice areas in the SRPEDD region, with large portions of the region’s hot spot areas containing Environmental Justice Communities.
Because of the ways in which impervious covers, such as pavement and roofing, contribute to heat island impacts, there is significant but not perfect correlation between certain SRRP Transect typologies and hot spot areas in the SRPEDD region. The vast majority of the T6 City Center and T5 Town Center Core areas are identified hot spots, with some T4 Town Center areas also overlapping with SRPEDD region hot spots. Twenty-one municipalities (78% of municipalities) in the SRPEDD region identified heat or extreme temperatures among their top 3-4 resilience related challenges during MVP planning. Just over half of the region included recommendations with general language related to increasing or shoring up shelter capacity. Without the full context of the conversation, it is difficult to know whether in all cases this general discussion specifically referenced and included cooling center or cooling shelter capacity, but we give the benefit of the doubt to an expansive definition and noted all such action items here. In several municipalities, the specific need for cooling centers or to provide more AC in public buildings, such as schools, was noted as a top or high priority, including New Bedford, Mansfield, Attleboro, and Plainville. Seekonk and Dighton identified cooling centers as medium priority. As of writing, no SRPEDD community has received an MVP Action Grant related to heat island or cooling center impacts.
One notable data gap is the lack of an existing and continuously maintained database of cooling and/or heating center locations across the SRPEDD region. There is a mechanism for municipalities to report their cooling station locations to MEMA, but the only data reported out of this registry is town cooling center registrations by year (the fact of a reporting, not the name, location, hours, capacity, or any other specific information associated with the cooling station).
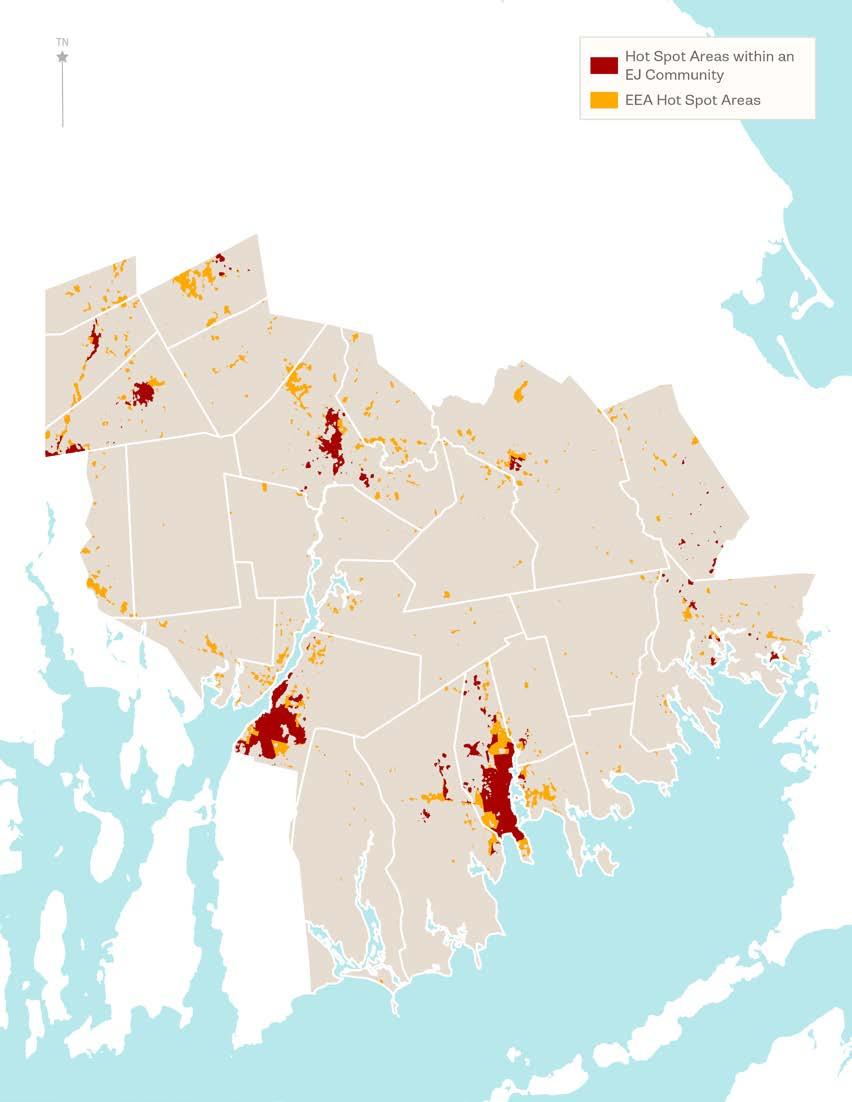
1. Inadequate Cooling in Public Schools: A significant number of school districts require updates or replacements of HVAC systems to provide adequate air conditioning. Schools, particularly in areas with high heat island effects, may not be properly equipped to handle extreme heat, putting students and staff at risk.
2. Heat Health Risks: Extreme heat can lead to severe health issues, including heat exhaustion, heat stroke, and exacerbation of chronic conditions like heart and respiratory diseases.
3. Limited Cooling Infrastructure and Facilities: There is a lack of a comprehensive and maintained database for colling center locations across the region. Additionally, many municipalities have not established or adequately publicized cooling centers, leaving vulnerable populations at greater risk during extreme heat events.
4. Heat Adversely Impacts Environmental Justice Communities: There is a notable overlap between heat islands and Environmental Justice communities, indicating that already vulnerable populations may be disproportionately affected by extreme heat.
5. Loss of Tree Cover: Trees, especially mature ones, provide shade and cooling, mitigating urban heat island impacts. Tree removals during development as well as blow downs during storms can reduce tree canopy and therefore exacerbate extreme heat in urban areas.
Best Practice 1: Upgrade building infrastructure.
T2-T6: Communities with older public buildings, such as schools and municipal facilities, should prioritize retrofitting to modernize HVAC systems and improve energy efficiency. This includes installing or upgrading air conditioning, implementing zone controls, enhancing insulation, using reflective roofing materials, and upgrading to energy-efficient windows. Where feasible, incorporating renewable energy sources like solar panels and passive solar design can further reduce energy demands and costs. Regular maintenance and energy monitoring are essential to ensure ongoing efficiency and comfort.
Funding Opportunities: Energy Efficiency and Conservation Block Grant Program, Green Communities Competitive Grant.
Prioritize the retrofitting of older buildings, particularly schools and public facilities, with modern HVAC systems to ensure effective cooling. This includes installing air conditioning where it is currently lacking and upgrading outdated systems. Implement energy-efficient enhancements, such as improved insulation, reflective roofing materials, and energy-efficient windows, to reduce cooling demands and enhance comfort during heat waves.

In response to increasing temperatures and the need for better learning environments, New York City embarked on a multi-year project to upgrade HVAC systems in its public schools. The initiative focused on installing air conditioning units in classrooms that lacked them and updating existing systems to more energy-efficient models. The project also included improvements in insulation, window replacements with energy-efficient models, and the installation of reflective roofing materials. These upgrades not only improved comfort during heat waves but also reduced energy consumption across the district.
T3-T6: Suburban and urban communities should prioritize the development and maintenance of public amenities such as splash pads, community pools, and cooling shelters to provide essential relief during extreme heat events. These amenities are especially important for vulnerable populations, including the elderly, low-income families, and those without adequate home cooling systems. Communities should strategically place these facilities in high-need areas, ensure they are accessible and inclusive for all residents, and extend operating hours during heat waves. Additionally, public awareness is critical, so it is essential to make public service announcements and develop and maintain a centralized database or app with real-time information on locations, hours, and capacities of theses amenities. Partnerships with local organizations, schools, and businesses can help promote these resources, especially in underserved areas; and transportation options should be considered to improve access. Finally, investing in green infrastructure, such as solar-powered cooling shelters or water recycling systems, will enhance the sustainability and resilience of these amenities.
Funding Opportunities: Community Development Block Grant (CDBG), Municipal Vulnerability Preparedness (MVP) Program, Green Communities Competitive Grant.
Suburban and urban communities should invest in public amenities such as splash pads, community pools, and cooling shelters. These resources offer essential cooling options for vulnerable residents who may not have access to sufficient home cooling or water resources. Ensure that information about these amenities is easily accessible to the public, particularly during heat waves, through public service announcements and a centralized database detailing locations, capacities, and hours of operation.
The City of Los Angeles launched the “Beat the Heat” campaign to educate residents about the dangers of extreme heat and the steps they can take to protect themselves. The campaign targeted vulnerable populations using a combination of social media, public service announcements, and community workshops. The initiative provided resources, such as water bottles, cooling towels, and maps of cooling centers. The city also worked with local community organizations to ensure that the campaign reached non-English-speaking residents and those in low-income neighborhoods.
T3-T6: Communities should launch comprehensive public health campaigns to educate residents about the risks of extreme heat, the symptoms of heat-related illnesses, and preventive measures such as staying hydrated and seeking air-conditioned environments. Special attention should be given to vulnerable populations, including the elderly, children, and individuals with pre-existing health conditions, ensuring they have access to the necessary information and resources. Effective communication strategies should include multilingual materials, community workshops, partnerships with local organizations, and the use of various media platforms to reach all segments of the population. Engaging local leaders and distributing educational materials in public spaces can further enhance outreach and impact.
Funding Opportunities: Public Health Emergency Preparedness (PHEP) Cooperative Agreement, Community Health Improvement Grants, CDC Foundation Heat and Health Initiative.
Launch public health campaigns to educate residents about the risks of extreme heat, the symptoms of heat-related illnesses, and preventive measures, such as staying hydrated and seeking air-conditioned environments. Pay particular attention to vulnerable populations, including the elderly, children, and individuals with pre-existing health conditions, ensuring they have access to the information and resources needed to stay safe during extreme heat events.
T3-T6: Communities should expand urban green spaces, including parks, tree-lined streets, and rooftop gardens, to effectively mitigate the urban heat island effect and enhance overall heat resilience. These green areas not only provide natural cooling but also improve air quality and contribute to residents’ well-being. Urban planning and redevelopment projects should prioritize the adoption of cool roofs, which utilize reflective materials to reduce heat absorption, and cool pavements, which are designed to reflect more sunlight and absorb less heat. Additionally, urban design should integrate heat mitigation strategies by optimizing building spacing to promote airflow, using reflective materials in construction, and preserving natural landscapes.
Funding Opportunities: Urban and Community Forestry Grant Program, Municipal Vulnerability Preparedness (MVP) Program, Green Communities Competitive Grant.
Expand urban green spaces, including parks, tree-lined streets, and rooftop gardens, to mitigate heat island effects. These areas provide natural cooling and enhance overall heat resilience. Promote the adoption of cool roofs (reflective materials that reduce heat absorption) and cool pavements (materials that reflect more sunlight and absorb less heat) in urban planning and redevelopment projects. Integrate heat mitigation into urban design by optimizing building spacing for airflow, using reflective materials, and preserving natural landscapes.
T2-T6: Communities should actively pursue grants, such as MVP Action Grants, to support heat mitigation projects, including upgrading cooling centers and expanding urban green initiatives. To maximize resources and impact, establish public-private partnerships that can fund and implement infrastructure improvements, urban greening projects, and community resilience efforts. By leveraging both public funding and private investment, communities can accelerate the development of heat mitigation strategies and enhance overall resilience to climate impacts.
Funding Opportunities: MVP Action Grants, FEMA Building Resilient Infrastructure and Communities (BRIC) Program, Environmental Protection Agency (EPA) Environmental Justice Grants.
Actively pursue grants, such as MVP Action Grants, to support heat mitigation projects, including the upgrading of cooling centers and the expansion of urban green initiatives. Establish public-private partnerships to fund and implement infrastructure improvements, urban greening projects, and community resilience efforts.
Boston’s Resilient Infrastructure Initiative is an example of securing funding and fostering partnerships to enhance urban resilience to extreme heat. The city successfully applied for MVP Action Grants to fund the upgrading of cooling centers and the expansion of urban greening projects. The initiative also involved collaboration with private companies and non-profits to cofund the planting of trees and the installation of green roofs across the city. These partnerships enabled the city to implement large-scale projects that would have been difficult to achieve with public funds alone.
T2-T6: Communities should direct resources toward Environmental Justice communities, prioritizing them in heat mitigation efforts to ensure they have access to necessary infrastructure and support during extreme heat events. It is essential to involve residents from these communities in the planning and decision-making processes related to heat mitigation strategies. By actively engaging these communities and incorporating their input, communities can develop more equitable and effective heat mitigation solutions that directly benefit those most vulnerable to climate impacts.
Funding opportunities: Environmental Justice Small Grants Program, EPA Environmental Justice Collaborative Problem-Solving (EJCPS) Cooperative Agreement Program, State Environmental Justice Grants.
Direct resources towards Environmental Justice communities, prioritizing them in heat mitigation efforts and ensuring they have access to the necessary infrastructure and support during extreme heat events. Involve residents from these communities in the planning and decision-making processes related to heat mitigation strategies in order to directly address their needs and concerns.
Chicago has focused on addressing environmental justice concerns through its heat response strategy, particularly in low-income and minority neighborhoods. Following a deadly heatwave in the 1990s, the city has made a concerted effort to improve infrastructure and resources in these communities. The strategy includes prioritizing these areas for new cooling centers, expanding access to public pools and green spaces, and ensuring that residents are involved in planning and decision-making processes. The city also provides targeted outreach and education to ensure that residents in these neighborhoods are aware of the resources available to them during extreme heat events.
Studies show that having access to green spaces can improve one’s physical and mental health in a number of ways. To begin, increasing access to green spaces often leads to cleaner air and reduced air pollution, one of the greatest environmental risks to human health. This cleaner air can significantly reduce the likelihood of complications such as heart disease, lung cancer, asthma, and more.23 Nearby green spaces also reduce the ambient air temperature during the summer months, reducing the impacts of heat-related illnesses.24 In addition to these already great benefits, having accessible green spaces often leads to an increase in time spent outdoors, and those who spend time outdoors are three times more likely to achieve the recommended levels of physical activity than those who don’t.25 The benefits of getting adequate physical activity are numerous and reduces the likelihood of death due to noncommunicable diseases such as heart disease.26
There are also more nuanced benefits of green spaces, often in regard to mental health, such as decreases in stress, anxiety, and depression when living within a 1-kilometer (~ 0.62 miles) radius of green space.27 Additionally, time spent in nature has been shown to improve one’s brain performance in ways of an improved memory and attention span.28 Accessible green spaces can also increase social connection within a neighborhood, leading to reduced feelings of loneliness, increases a sense of place, and decreases in local crime.29
In the SRPEDD Region, green spaces are spread throughout the area, with some municipalities having access to more green spaces than others (see Publicly Accessible Open Spaces in Southeastern Massachusetts map). When looking at the Trust for Public Land ParkServe dataset, the Trust has mapped a 10-minute walking radius around most of the identified green spaces within the region (see Trust for Public Land Identified Parks map). As can be seen by that map, there are large portions of the region who do not live within a reasonable traveling distance for green spaces. A further breakdown of the approximate percentage
of residents who live within that 10-minute walking radius by municipality can be seen below in Table 1, Percent Open Space and Percent of Residents Served, by Municipality, in Southeastern Massachusetts. Based on this information, the total population in the SRPEDD region that is served by these green spaces is roughly 51%.
Table 2. Percent Open Space and Percent of Residents Served, by Municipality, in Southeastern Massachusetts.
Municipality
The Trustfor Public Land then took their analysis one step further and identified priority area for potential new parkland to be added in each municipality (see Trust for Public Land Priority Park Areas map). The municipalities with the highest need for new parkland includes Rehoboth, Freetown, and Westport.
Massachusetts also acknowledges the important of green spaces for public health within the key document known as the Resilient Lands Initiative: Expanding Nature’s Benefits Across the Commonwealth, where specific actions to implement are identified to improve the health of the community through accessible natural areas. These actions include:
• Designate climate risk zones – by identifying areas at risk of things such as extreme heat and flooding, green nature-based solutions, such as tree planting, can be implemented.
• Seek to launch a Plot Restoration Opportunity Program – the repurposing of vacant lots that are not appropriate for development into urban farms, gardens, micro-forests.
• Create a network of small, neighborhood shady parks and natural areas in high-density neighborhoods.
• Seek to launch a locally led nature-based solutions pilot grant program to improve community health and resilience to climate impacts.
1. Competing Types of Development / Limited Space: There is a finite amount of physical space where things can be put or built within any given area, causing increased competition for land.
2. Location of Open Spaces: The further a person lives from Green Spaces, the less benefits they receive from said space. However, creating Green Spaces that are close enough for all populations to receive the benefits would require an enormous amount of land. One way around this would be to start incorporating things such as biophilic design within our man-made environment in order to bring the benefits of Green Spaces to built environments.
3. Accessibility of Open Spaces: Even if a Green Space is physically present near a population of people, not everyone experiences the space the same way. The needs of a person varies depending on their age and physical ability. Creating Green Spaces that can meet the needs of all persons is a challenge that is hard to overcome.
4. Environmental Gentrification: As spaces become less polluted, less dilapidated, more visually beautiful, and have an increased access to green amenities, property values often increase. This process frequently results in the displacement of the poorest peoples by pricing them out and causing them to move to less desirable areas.
Best Practice 1: Utilize grant funding to provide opportunities for local, nature-based open spaces.
T1-T6: As opportunities present themselves, all municipalities should work on identifying areas within their communities that have a need for new or improved open spaces. With those locations and needs already in mind, recognizing the appropriate grant funding source becomes an easier process. Community Priority Protection Areas (PPAs, updated in 2023 and 2024) and Open Space and Recreation Plans can serve as the foundation for these efforts.
Funding Opportunities: Parkland Acquisitions and Renovations for Communities (MassDCS), Local Acquisitions for Natural Diversity (MassDCS), Outdoor Recreation Legacy Partnership Grant Program (MassDCS), Land and Water Conservation Fund Grant (MassDCS), Healthy Communities Grant Program for New England (EPA).
The Commonwealth has many grant options available for nature-based solutions. While these resources are readily available, it often requires the grant-writer to identify the most appropriate use for a park or open space and connect it to the proper grant. Communities should identify parcels that provide regionally or locally significant opportunities for open space; conduct planning, design analysis, and public outreach; then pursue preservation or public space construction projects to ensure all communities have access to nature-based open spaces.
large local populations and vulnerable communities.
T3-T6: More developed communities are more likely to have densely populated areas and areas with vulnerable populations. Prioritizing areas within their municipality that would benefit the largest number of people, or directly benefit their underserved populations, should be top priority when selecting areas for new or improved open spaces. Maintaining Americans with Disabilities Act (ADA) accessibility in these areas is essential.
Funding Opportunities: Parkland Acquisitions and Renovations for Communities (MassDCS), Local Acquisitions for Natural Diversity (MassDCS), Outdoor Recreation Legacy Partnership Grant Program (MassDCS), Land and Water Conservation Fund Grant (MassDCS), Healthy Communities Grant Program for New England (EPA), Massachusetts Office on Disability (MOD).
In complement to Best Practice #1, it is important to consider the location of green spaces to ensure that all populations have access to enjoy the physical and psychological health benefits associated with nature-based public spaces. Communities should identify feasible locations, connected to various modes of transportation, that are accessible to population centers and other frequently visited locations when looking to preserve open spaces. Additionally, communities should think about regional connections to these spaces – ensuring equitable access across Southeastern Massachusetts.
Require or encourage new developments to include publicly accessible green spaces.
T1-T6: New development is bound to happen – be it new business or housing. Working within that new development to include open spaces can help create a more welcoming and positive environment for your community. Open Space Residential Design or Low Impact Development are two different ways that municipalities can implement these strategies.
Funding Opportunities: Planning Assistance Grants (EOEEA).
While Best Practices #1 and #2 identify criteria for selecting public spaces, it is important to acknowledge the limitations and pressures that development can impose on open space networks. However, local communities should work with developers, either through requiring high quality open spaces with nature-based elements in the zoning, or by identifying opportunities during the development process to ensure that new construction incorporates natural and biophilic elements. While local control over land often provides a direct opportunity to preserve long-standing natural systems, the design of parks and open spaces as part of larger development initiatives introduces the opportunity for constructed natural systems that can still provide the same health benefits.
Best Practice #1: Utilize green infrastructure and protect wetlands.
Best Practice #2: Regulate development in floodplains.
Best Practice #3: Conduct hard infrastructure failure assessments regionwide.
Best Practice #4: Conserve water resources by reducing unnecessary consumption.
Best Practice #1: Manage coastal erosion and habitat restoration through “living shorelines.”
Best Practice #2: Enhance infrastructure resilience and adaptation.
Best Practice #3: Foster community engagement and equity.
Best Practice #4: Protect and restore coastal wetlands.
Best Practice #5: Promote sustainable development and land use.
Best Practice #6: Strengthen economic resilience and diversification.
Best Practice #1: Expand waste diversion and recylcing programs.
Best Practice #2: Promote community engagement and education.
Best Practice #3: Upgrade infrastructure and expand capacity.
Best Practice #4: Leverage data for continuous improvement.
Our region is made up of five different watershed boundaries that cross political, municipal, and state boundaries. Those watersheds are: Ten Mile River, Narraganset Bay, Mt Hope Bay, Taunton River, and Buzzards Bay Watersheds. Because our region is coastal to the south, all water generally flows South towards Buzzards Bay, Narraganset Bay, Mt. Hope Bay, and other smaller bay watersheds. These watersheds are internally networked by numerous rivers, tributaries, streams, and aquifers that provide for our region’s water supplies and ecosystem health; this in influences our ability to mitigate flooding and heat, promote potable water health, and encourage biodiversity. Due to this prevalence of water bodies and rivers – and since many of our colonial- and industrial-era communities developed along them – Southeastern Massachusetts experiences both alluvial and sunny-day/tidal flooding.
Wetlands play a substantial role in flood mitigation as “green infrastructure.” Wetlands can act like a sponge during major flooding events, filtering and absorbing flood water through the soil, plants and organisms, and into groundwater. Many key organisms also need wetlands to thrive, such as many protected bird, salamander and skink populations; the Commonwealth’s Wetlands Protection Act and associated policies and programs prevent wetlands from being developed. There are multiple classes of wetlands, each with their own level of importance: marshes, bogs, wet prairies, and swamps. A map of the region below shows where protected wetlands are located and potential breeding grounds for stated protected breeding organisms. Despite the prevalence of wetlands and wetland protections, much of our region’s waterways have been built up with hard infrastructure, such as concrete embankment walls, dams, and levees. The hard infrastructure in many towns initially created the safety of predictable water flow and reduced risk of flooding, which has allowed for growth
and development. These infrastructures may become weak overtime without strong maintenance; they may also no longer be up to the task of mitigation water flows caused by more frequent and severe storms and rain events. For example, many underground stormwater infrastructure systems are over capacity during high rainfall events, and because of the age of many cities in the region, are so complex from years of work that they are difficulty to repair. Recent increasing rainfall events for longer periods of time provides that many of our of municipalities must update their storm water systems, but many may not have the funding for a comprehensive overhaul.
Since the 1920’s, FEMA FIRM Maps have provided residences with information on the direction and zones of flooding during high rainfall events that had a chance of occurring once every 100 years or 500 years. Now those maps are available online. Because of climate change, many communities are defaulting to using 500 year floodplain maps to determine where to develop and build because 100 year floodplains are flooded more frequently than indicated. For
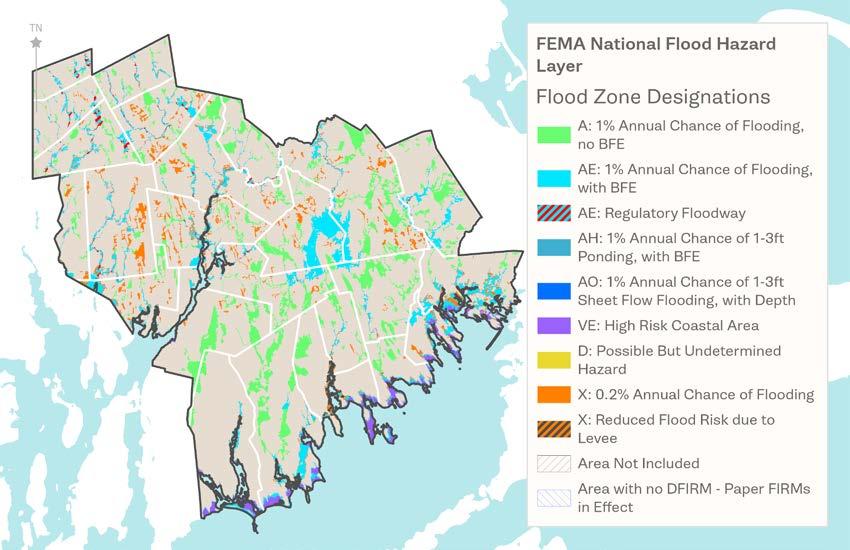
our communities, the following have parcels within a 100- or 500-year floodplain, below. Alluvial flooding and flash flooding conditions can be made much worse by impervious surfaces on the ground. This prevents groundwater from being directly absorbed into the soil and sends the water and whatever particulates it contains downstream. The accumulation of water that has not been infiltrated into the ground exponentially increases flooding severity.
The State of Massachusetts has more flood control regulation than most states; however, our region can still make progress mitigating those flooding impacts. The Watershed Protection Act, Wellhead Protection Regulation, and MEMA are all forms of state legislation and policy aimed at preventing environmental disaster; these can be used for flood prevention regulation, as well. Additionally, the State provides many standards that new development must or can abide by with funding incentives. Many of our municipalities are aware of the costly impacts of flooding and engage in their own forms of policy to prevent wetlands disturbance or development, reduce impervious cover, and require flood controls.
In some communities, sewer systems can become over capacity with heavy rainfall events. Many of our communities run on site-level septic systems, but antiquated or at-capacity sewer systems can contaminate coastal and wetland ecosystems if they become overloaded and force a discharge into a protected water body. Our other sections regarding infrastructure in Volume 1, Chapter 2 go into more detail about how communities may better integrate sewer.
1. Climate Change Impacts: Increased rainfall events for longer periods of time, particularly after drought events, lead to much greater impacts from flooding. Inland groundwater tables rising due to sea level rise and increased rainfall is a new impact to those with basements.
2. Impervious Development: Increasing impervious pavement with development, even in areas that are not environmentally protected, will increase flooding impacts downstream in the watersheds, carrying particles and chemicals contained within it.
3. Dam and other built infrastructure failure: Many hard infrastructures were built several decades ago and their integrity, costs of maintenance, and benefits to the environment may no longer be viable. Dam failure can threaten entire communities,30 so where there is potential for this hazard, communities need to consider plans to mitigate the effects or safely remove the dam. Similarly, many outdated culverts do not support the flow of water needed with increased rainfall or provide reasonable access for ecosystems to thrive.
T2-T6: Communities should prioritize natural ecosystem restoration over hard infrastructure by promoting green infrastructure solutions that enhance ecosystems, improve groundwater infiltration, and increase natural water flow. This includes practices like wetland restoration, riparian buffer installation, and the of permeable surfaces in urban areas. Where feasible, protect and acquire land containing wetlands to ensure long-term conservation and preservation of these critical ecosystems, which play a vital role in flood control, water quality, and habitat protection.
Funding Opportunities: Land and Water Conservation Fund (LWCF), Wetlands Reserve Program (WRP), Municipal Vulnerability Preparedness (MVP) Program, EPA Wetland Program Development Grants, Clean Water State Revolving Fund (SRF), and National Estuary Program.
Promote natural ecosystem restoration and rebuilding instead of hard infrastructure to improve ecosystems, increase groundwater infiltration, and water flow. Where possible, protect and buy land where there are wetlands to preserve and conserve for years to come.
17. A rain garden next to a parking lot in Milwaukee, Wisconsin. (City of Milwaukee Environmental Collaboration Office)
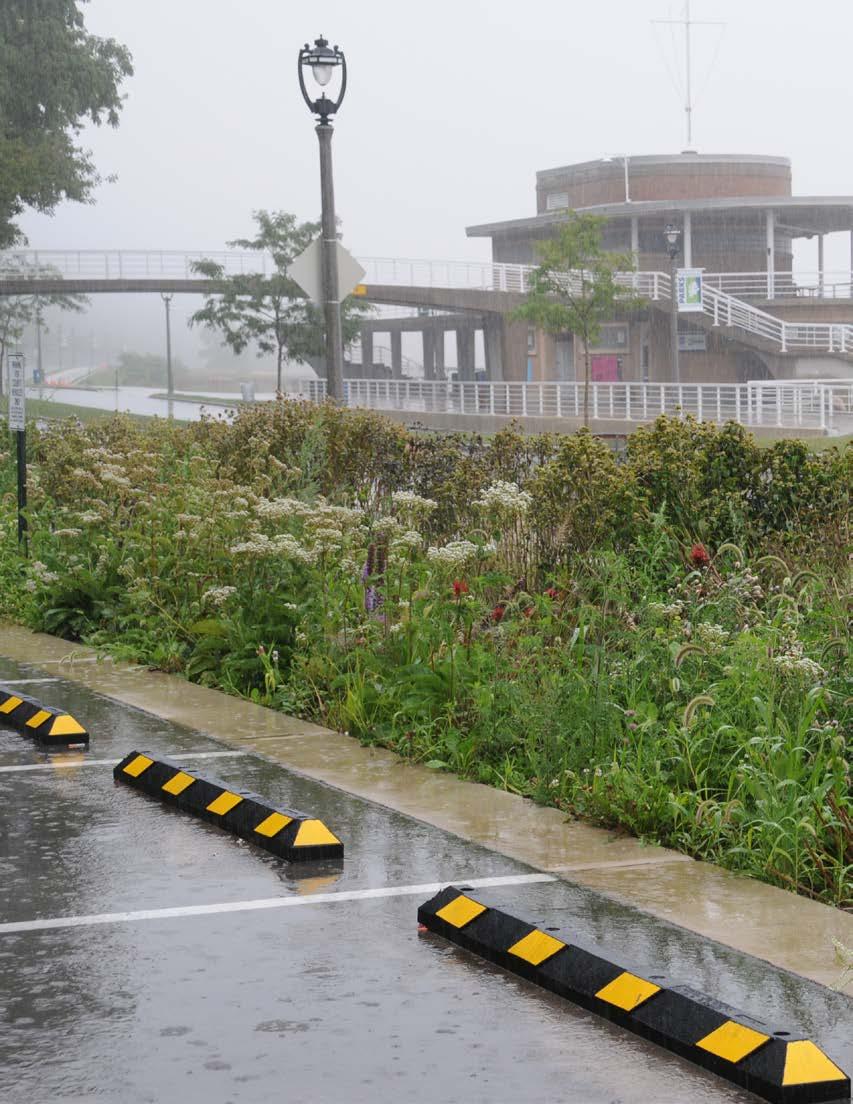
The Milwaukee Metropolitan Sewerage District (MMSD) developed a Green Infrastructure Plan to reduce flooding and improve water quality through the use of green infrastructure. The initiative includes rain gardens, bioswales, permeable pavements, and wetland restoration to increase groundwater infiltration. The plan has led to reduced stormwater runoff, improved water quality in rivers and streams, and restored wetland areas for habitat protection. Milwaukee also purchased land for wetland restoration as part of flood management.
Following severe flooding in the 1990s, Charlotte-Mecklenburg introduced a comprehensive floodplain buyout program. The city has purchased over 400 flood-prone properties, turning them into open space or parkland, effectively regulating development in the floodplain and preventing future losses. The program reduced flood risks by preventing new development in flood-prone areas, and it helped restore floodplains that absorb excess runoff during storms.

T2-T6: To mitigate flooding risks, communities should regulate development in both the 100-year and 500-year floodplain by updating zoning and building codes. While some development in the 500-year floodplain may be permissible, policies should emphasize flood-resilient design, construction standards, and restrictions on high-risk activities. Site planning should prioritize natural floodplain functions, ensuring that runoff flow is minimally impacted yet able to filter into key aquifers, and new development should incorporate flood-resistant features such as elevated structures, permeable surfaces, and green infrastructure to protect both residents and businesses from future flood events. Additionally, concern to reducing removal of topsoil through development should be minimized as much as possible through development agreements.
T4-T6: Agricultural and rural lands should make sure that lands with pastures are using USDA best practices to circulate the use of livestock in different parts of land to prevent topsoil erosion and compaction which leads to less filtration.
Funding Opportunities: FEMA Hazard Mitigation Grant Program (MHGP), Community Development Block Grant Disaster Recovery (CDBG-DR), Flood Mitigation Assistance (FMA) Program.
Development of natural floodplains alters the flow of runoff and can impact flooding. While development is already restricted in the immediate floodplain, policies that consider how larger storms may impact wider areas means not only regulating development of the 100-year floodplain, but the 500-year floodplain, as well. While not all development needs to be prevented within a 500-year floodplain, the type, design, and proposed active uses within floodplains can be regulated by building codes and zoning to protect future residents and firms from flooding impacts.
T2-T6: Communities should conduct comprehensive assessments of dams, levees, retaining walls, and other critical flood control infrastructure to evaluate their current condition and capacity to handle increased rainfall and runoff due to climate change and rising impervious surface areas. These assessments should include structural integrity evaluations, stress tests for extreme weather conditions, and recommendations for necessary upgrades or retrofits. Where possible, prioritize nature-based solutions alongside hard infrastructure to improve long-term resilience and reduce reliance on aging systems.
Funding Opportunities: FEMA Pre-Disaster Mitigation (PDM) Program, Army Corps of Engineers Rehabilitation and Inspection Program, Infrastructure Investment and Jobs Act (IIJA), Coastal Zone Mitigation through Massachusetts CZM, Municipal Vulnerability Preparedness through MassDEP.C
Most of the communities in this region have dams, levees, and retaining walls to protect their town from the uncontrolled floodwaters. Many of these systems have worked for decades and need to be assessed for their integrity and ability to withstand increasing rainfall levels with climate change and impervious cover increases.
Vermont initiated a comprehensive dam safety assessment program after Hurricane Irene caused severe flooding and dam failures in 2011, The state reviewed all high- and significant-hazard dams to assess their structure integrity and risk of failure, prioritizing those in the worst condition for repair or removal.
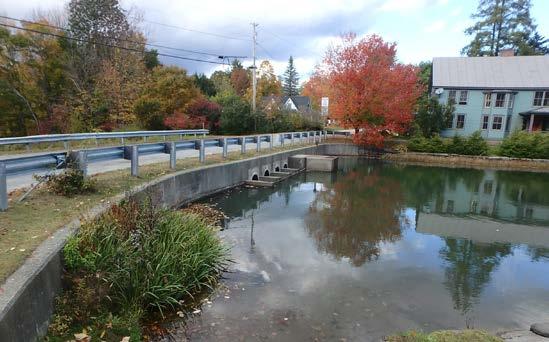
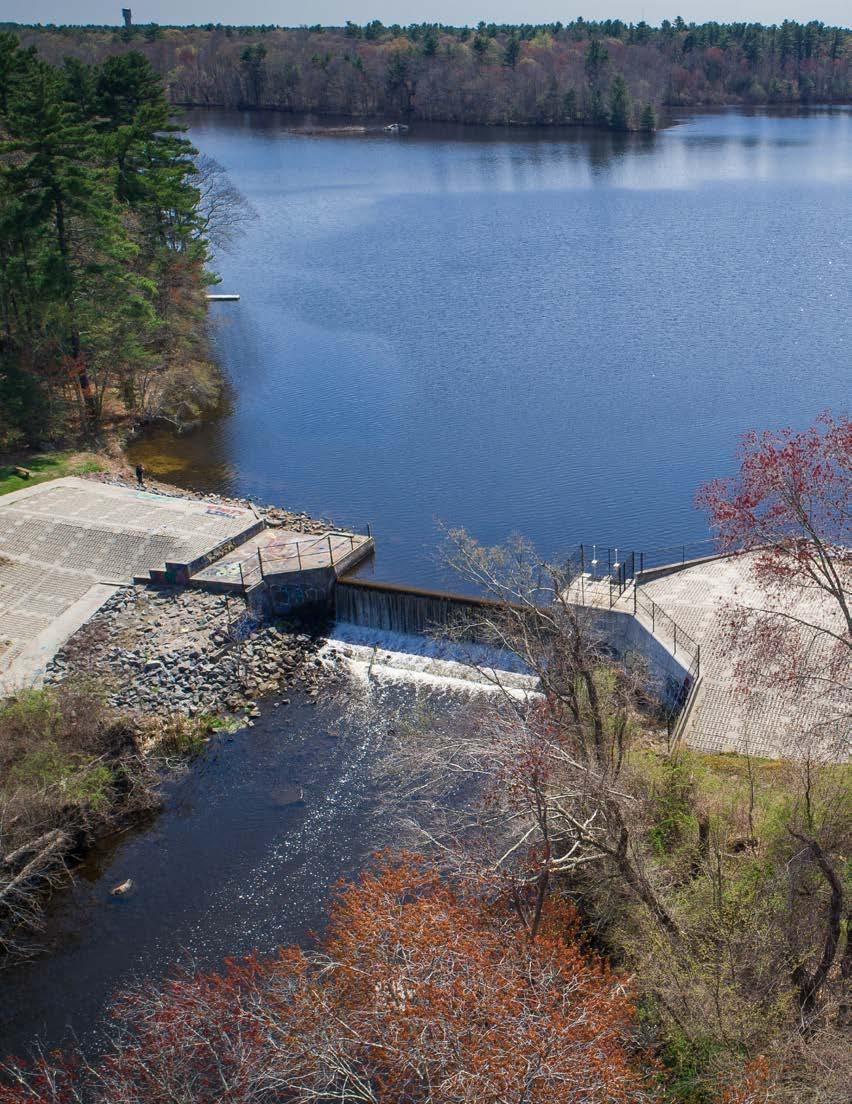
The impact of sea level rise varies across the region, with particular attention to Buzzards Bay and Narragansett Bay. These coastal areas, boasting over 250 miles of diverse shorelines, play a pivotal role in supporting recreational activities, commerce, fishing, scientific research, and unique natural habitats. While erosion rates are generally low compared to other parts of the state, exceptions exist, notably Westport and Dartmouth at the mouth of Buzzards Bay, where direct ocean wave impacts have caused significant shoreline erosion. Over the last 120 years, East Beach in Westport, for instance, has eroded over 150 feet, endangering homes and necessitating homeowner relocations
Approximately 23% of the total regional shoreline allows public access (26% in Buzzards Bay and 11% in Narragansett Bay). Rising seas pose a threat to these accessible beaches, especially when development restricts the opportunity for beaches and parking areas to migrate inland. Shoreline modifications, including over 1,800 bulkheads, seawalls, revetments, groins, and jetties, disrupt natural sediment transport and habitat migration processes, hindering the adaptability of beaches.
Sea level rise is anticipated to profoundly impact the Southeastern region, especially in Wareham. The town’s low-lying infrastructure and location make it susceptible to more than a quarter of all buildings being inundated by a 10-year storm as soon as 2050.31 Furthermore, the hurricane barrier in New Bedford, constructed in 1966 to shield the port from storms, is expected to close more frequently due to high tides alone, potentially reaching 1-2 closures a day by 2050.32 This increased closure frequency poses challenges for the city activities and port logistics, as evident from the barrier closing 26 times in 2019.
Sea level rise will also exacerbate extreme events, particularly impacting storm surges and the environment’s protective capabilities. Coastal features such as beaches, dunes, marshes, shrublands, and forests act as buffers against storms,
provide wildlife habitat, store carbon, maintain cultural connections, and offer enjoyment to communities. However, only 23% of coastal habitat in Buzzards Bay is permanently protected, leaving vulnerable areas susceptible to loss.33
Communities along the South Coast, particularly Environmental Justice (EJ) communities, are projected to experience increased flooding. New Bedford and Fall River’s maritime economies, supporting approximately $1.8 billion in total personal wages annually, may disproportionately impact low-income and minority residents.34 With more than 13,000 structures around the bay potentially flooded in a 10-year storm by 2050, it is crucial to prioritize resources for adaptation and relocation, especially for vulnerable communities.
Much of this region is intrinsically linked to the sea, with a legacy of whaling, shipping, and fishing that goes back thousands of years into our pre-colonial past. Today, a Blue Economy that relies on fishing remains central to this part of the state and has grown to include ocean science, tourism, and a nascent wind power industry. One of the more visible examples of this are the working ports that support commercial centers along the South Coast, including in two Designated Port Areas in New Bedford (includes Fairhaven) and Fall River that are critical to the state’s economy.
Private property is significantly impacted by sea level rise, with projections indicating potential inundation of over 15,000 structures and 250 miles of roadway by 2050. Particularly vulnerable are towns like Wareham, Bourne, Marion, and Mattapoisett, situated at the terminal end of Buzzards Bay, facing increased flooding, erosion, and infrastructure damage.35
Both daily tidal flooding and storm events are projected to inundate low-lying roads and buildings unprepared for flooding. Vulnerabilities in Wareham include a quarter of all buildings potentially being inundated by a 10-year storm by 2050. Daily tidal flooding is projected to impact over 25 miles of roadway and over 1,400 buildings across the region as soon as 2050.36
Critical infrastructure and utilities, such as wastewater pump stations, are at risk, as are numerous roadways vital for emergency services. For example, Wareham faces the potential inundation of 95 miles of road by a 100-year flood, including crucial routes like Route 6, Onset Avenue, and Sandwich Road.37 Similar vulnerabilities exist in other towns, emphasizing the need for robust infrastructure planning and adaptation measures.
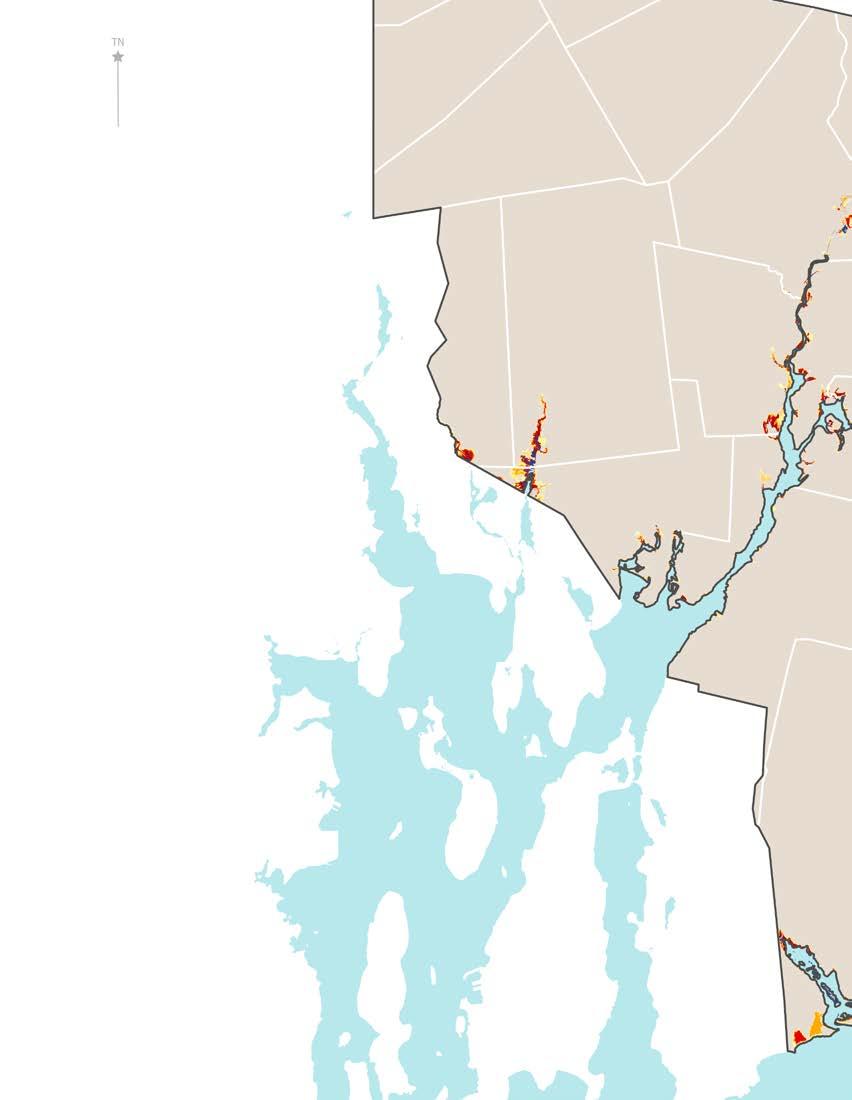
Sea level rise poses a significant threat to coastal wetland habitats and the invaluable benefits they offer. The impact is expected to be felt in various regions, including Falmouth, Bourne, Wareham, Marion, Mattapoisett, Fairhaven, New Bedford, Dartmouth, Westport, Fall River, Swansea, Rehoboth, and Seekonk.
Salt marshes are home to a diversity of wildlife, filter pollutants before they reach our bays, and provide storm protection to our coastal community by buffering storm surge and absorbing excess rainwater. These landscapes, if healthy, also show incredible promise for slowing the effects of climate change by sequestering vast amounts of carbon – more than 10 times the amount sequestered by forests. Salt marshes, in particular, are at risk due to rising seas. Of the more than 250 miles of shoreline along Buzzards Bay and Narragansett Bay, around one-third is salt marsh, totaling 4,900 acres.38 The survival of salt marshes depends on their ability to flood and drain regularly, accumulate sediment over time, and migrate inland with sea level rise. Human alterations, such as ditching for agriculture and mosquito control, as well as infrastructure like roads, compromise these natural processes. The projections for marsh loss are alarming, with an anticipated 23% loss in total marsh and nearly 80% transition.
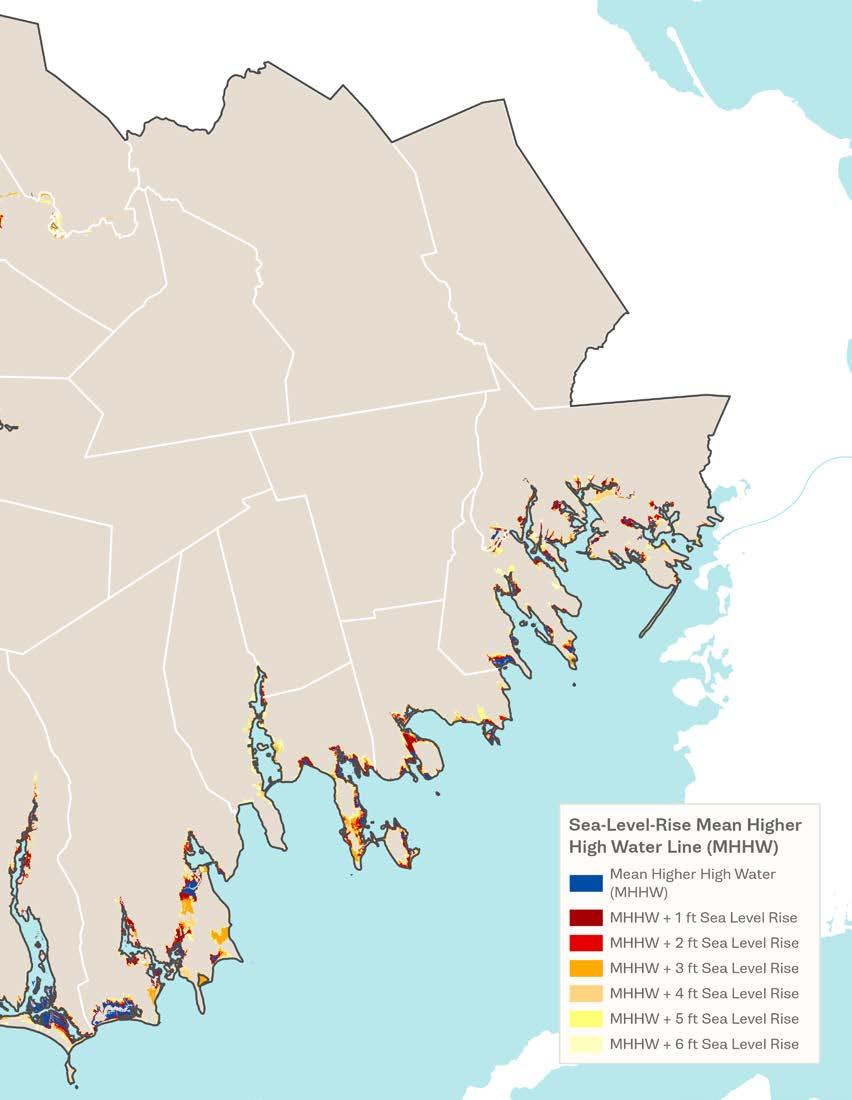
1. Coastal Erosion and Infrastructure Threats: Southeastern Massachusetts is increasingly vulnerable to coastal erosion due to impacts of climate change. Many beachfront properties are at direct risk, with homeowners facing significant threats from eroding shorelines. Additionally, the region’s extensive shoreline modifications, including over 1,800 structures like seawalls and jetties, disrupt natural sediment transport and hinder the natural migration of beaches, further increasing the vulnerability of coastal habitats and inland areas,
2. Sea Level Rise and Flooding: Rising sea levels are expected to cause more frequent and severe flooding where over a quarter of all buildings may be inundated by a 10-year storm by 2050. Critical infrastructure assets, including wastewater pump stations and key roadways, are also at high risk. By 2050, projections indicate that daily tidal flooding could affect over 25 miles of roadway and 1,400 buildings across the region, posing significant challenges for infrastructure resilience and emergency services.
3. Economic and Social Vulnerabilities: The maritime economies of New Bedford and Fall River, which support $1.8 billion in annual personal wages, are particularly vulnerable to the impacts of sea level rise. This threat disproportionately affects low-income and minority communities, potentially exacerbating economic inequalities. The region’s Blue Economy, encompassing fishing, tourism, and emerging industries like wind power, is also at risk, with potential negative impacts on commercial ports and local economies due to environmental changes.
4. Environmental and Habitat Loss: Sea level rise threatens the survival of vital salt marshes, which play a crucial role in supporting wildlife, filtering pollutants, and providing storm protection. Projections indicate a 23% loss of salt marshes, with nearly 80% undergoing significant transition, compromising their ecological functions and their ability to sequester carbon by 2050.39 Coastal wetlands, essential for storm protection and wildlife habitat, are also at high risk of significant loss.
5. Public Access and Recreation: Rising sea levels endanger public access to beaches, particularly in areas where development restricts the natural inland migration of beaches and associated infrastructure, such as parking areas. This threatens recreational opportunities and the overall accessibility of coastal areas.
Best Practice 1: Manage coastal erosion and habitat restoration through “living shorelines.”
T1-T5: Communities should promote the use of living shorelines, such as marsh restoration and dune replenishments, to naturally stabilize eroding areas while preserving habitats. The construction of hard structures should be minimized, with an added emphasis on removing or modifying existing structures where feasible to enable natural beach migration. Additionally, efforts should be made to expand the percentage of permanently protected coastal habitats.
Funding Opportunities: Coastal Resilience Grant Program, National Coastal Resilience Fund, NOAA Habitat Restoration.
Promote the use of living shorelines, such as marsh restoration and dune replenishment, to naturally stabilize eroding areas while preserving essential habitats. Minimize the construction of hard structures like seawalls and jetties, which disrupt sediment transport, and encourage the removal or modification of existing structures where feasible to enable natural beach migration. Expand the percentage of permanently protected coastal habitats, especially in vulnerable areas like Buzzards Bay, to prevent further loss of critical ecosystems.

The Chesapeake Bay region has implemented living shorelines projects to combat coastal erosion while preserving habitats. These projects include marsh restoration, dune replenishment, and the use of natural materials, such as oyster shells and native vegetation, to stabilize shorelines. The living shorelines have effectively reduced erosion, restored vital coastal habitats, and enhanced biodiversity. These projects have also been more resilient to storms compared to traditional hard structures like seawalls. The approach has become a model for coastal management in other regions.
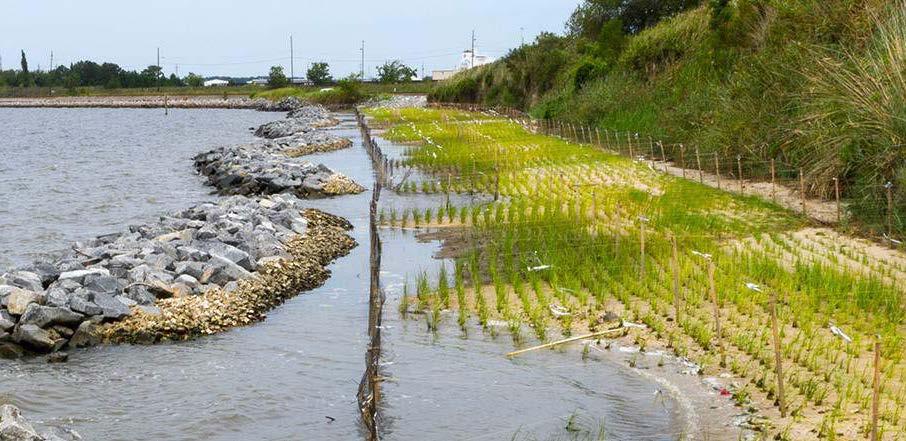
T2-T6: Communities should prioritize retrofitting and elevating critical infrastructure to withstand future flooding and sea level rise. Incorporate sea level rise and storm surge projections into all infrastructure development and land-use planning. Implement comprehensive flood mitigation strategies.
Funding Opportunities: FEMA Pre-Disaster Mitigation Grant Program, NOAA Coastal Resilience Grants, U.S. Amy Corps of Engineers Continuing Authorities Program (CAP).
Retrofit and elevate critical infrastructure, including wastewater pump stations and key roadways, to withstand future flooding and sea level rise, with a focus on areas where significant flooding is anticipated. Incorporate sea level rise and storm surge projections into infrastructure development and land-use planning, ensuring that new developments are resilient to future conditions. Implement flood barriers, stormwater management systems, and green infrastructure (e.g., rain gardens, permeable pavements) to mitigate the impact of flooding on communities and infrastructure.
CASE STUDY: NEW YORK CITY’S CLIMATE RESILIENCY DESIGN GUIDELINES
New York City developed Climate Resiliency Design Guidelines to retrofit and elevate critical infrastructure, incorporating sea level rise and storm surge projections. This initiative focuses on protecting key infrastructure, such as wastewater treatment plants, subways, and roads, from future flooding. The guidelines have led to the successful elevation and fortification of critical infrastructure, reducing vulnerability to flooding and ensuring continuity of essential services during extreme weather events.
T2-T6: Direct adaptation resources and planning efforts towards Environmental Justice (EJ) communities. Educate the public, particularly in vulnerable areas, about the risks of sea level rise and the importance of adaptation strategies. Utilize workshops, community meetings, and digital platforms to effectively disseminate information and engage residents in adaptation efforts.
Funding Opportunities: Environmental Justice Collaborative Problem Solving (EJCPS) Cooperative Agreement Program, NOAA Coastal Resilience Grants, FEMA Building Resilient Infrastructure and Communities (BRIC) Program.
Communities should prioritize directing adaptation resources and planning efforts toward Environmental Justice (EJ) communities, which are disproportionately affected by sea level rise. It is crucial to educate the public, particularly in these vulnerable areas, about the risks associated with sea level rise and the importance of implementing adaptation strategies. To effectively engage residents, utilize a variety of communication methods, including workshops, community meetings, and digital platforms, to disseminate information and involve the community in adaptation efforts. By fostering active participation and ensuring equitable access to resources, communities can build resilience in the populations most at risk.
Boston launched the Climate Ready Boston initiative, focusing on engaging Environmental Justice (EJ) communities in adaptation planning. The city conducts workshops, community meetings, and uses digital platforms to educate residents about sea level rise and gather input on adaptation strategies. The initiative successfully raised awareness and involved diverse communities in climate adaptation efforts. The focus on EJ communities has ensured that vulnerable populations are prioritized in resilience planning, leading to more equitable outcomes.
T1-T6: Communities should facilitate the inland migration of salt marshes, invest in large-scale wetland restoration projects, and establish monitoring programs to track the health of coastal wetlands is crucial.
Funding Opportunities: NOAA Coastal Resilience Grants, U.S. Fish and Wildlife Service Coastal Program, National Fish and Wildlife Foundation (NFWF) National Coastal Resilience Fund.
Facilitate the inland migration of salt marshes by removing barriers and preventing further development in areas likely to become future marshland, helping to maintain the ecological functions of these critical habitats. Invest in large-scale wetland restoration projects to bolster the resilience of coastal ecosystems, which provide natural storm protection and carbon sequestration. Establish monitoring programs to track the health of coastal wetlands and implement adaptive management strategies to address challenges, such as sediment loss and increased salinity due to sea level rise.
Louisiana has invested in large-scale wetland restoration projects as part of its Coastal Master Plan. The plan includes initiatives to facilitate the inland migration of salt marshes and restore degraded wetlands, which are vital for storm protection and carbon sequestration. The restoration efforts have significantly improved the resilience of coastal ecosystems, helping to buffer communities from storm surges and reducing land loss. The ongoing monitoring program has provided valuable data for adaptive management, ensuring that restoration efforts remain as conditions change.

T2-T6: Communities should enforce zoning regulations that restrict new construction and regulate site planning in areas highly susceptible to flooding and erosion, ensuring that development aligns with long-term sustainability goals. Where feasible, communities should encourage managed retreat from the most vulnerable coastal areas. Additionally, designing and maintaining green spaces in coastal areas can provide natural flood mitigation.
Funding Opportunities: FEMA Hazard Mitigation Grant Program (HMGP), Coastal and Estuarine Land Conservation Program (CELCP), U.S. Department of Housing and Urban Development (HUD) Community Development Block Grant – Disaster Recovery (CDBG-DR).
Enforce zoning regulations that restrict new construction in areas highly susceptible to flooding and erosion and promote the use of setback requirements to allow natural coastal processes to take place. Where feasible, encourage managed retreat from the most vulnerable coastal areas, especially for private properties and infrastructure at high risk of permanent inundation. Design and maintain green spaces, such as parks and buffer zones, in coastal areas to provide natural flood mitigation and create adaptable public spaces that enhance community resilience.
After Hurricane Sandy, Staten Island implemented a managed retreat program, offering buyouts to homeowners in the most vulnerable coastal areas. The program aimed to reduce risks from future flooding by allowing natural coastal processes to take place in these areas. The managed retreat has led to the creation of green spaces that provide natural flood mitigation and serve as public parks. The program has been recognized for its proactive approach to reducing long-term risk and its potential as a model for other flood-prone communities.
T2-T6: Communities should strengthen and diversity the Blue Economy by investing in sustainable sectors like ocean science and renewable energy, with a particular focus on offshore wind. Collaboration with local businesses and industries is essential to create economic adaptation plans that address the effects of sea level rise and climate change on commercial operations, particularly in ports and coastal region.
Funding Opportunities: Economic Development Administration (EDA) Public Works and Economic Adjustment Assistance Program, NOAA Sea Grant Blue Economy Grants, U.S. Department of Energy Offshore Wind Energy Program.
Bolster and diversify the Blue Economy by investing in sustainable industries like ocean science and renewable energy (e.g., offshore wind) to reduce dependence on traditional maritime activities that may be vulnerable to sea level rise. Collaborate with local businesses and industries to develop economic adaptation plans that address the impacts of sea level rise and climate change on commercial activities, particularly in ports and coastal areas.
New Bedford, Massachusetts, has invested in diversifying its economy by promoting sustainable industries like ocean science and offshore wind energy. The city has collaborated with local businesses to develop economic adaptation plans addressing the impacts of sea level rise and climate change on its traditional maritime industries. New Bedford’s efforts have strengthened and diversified the local economy, thereby reducing dependency on traditional fishing activities, which are vulnerable to environmental changed. The city is now a leader in the Blue Economy, with growing industries in renewable energy and marine research.
Massachusetts has taken significant strides in environmental management and waste reduction through a combination of updated resources and new regulations. Utilizing GIS data on solid waste diversion and disposal, the state provides invaluable historical insight that guides contemporary waste management strategies. The Massachusetts Solid Waste Master Plan aims to drastically reduce annual waste disposal from 5.7 million tons in 2018 to 4 million tons by 2030, and to achieve a 90% reduction by 2050, bringing it down to just 570,000 tons. In support of these goals, Massachusetts has instituted several legislative measures, including the Commercial Food Material Disposal Ban and other Waste Disposal Bans. These laws mandate the recycling and composting of specific materials, promoting a circular economy. State-wide bans are complemented by local initiatives, such as municipal composting services, and public education efforts, including the MassDEP Recycling IQ Kit, which enhances recycling program effectiveness through better public understanding and practices, aiming to increase recycling rates and minimize contamination.
Currently, there are only two active landfills in southeastern Massachusetts: Crapo Hill Landfill in Dartmouth,40 which is expected to reach capacity by 2027, and Middleborough Landfill in Middleborough. The region faces substantial landfill capacity issues, driving the need for enhanced waste diversion and recycling efforts. The Massachusetts Department of Environmental Protection (MassDEP) has highlighted a statewide decline in landfill capacity, projected to be nearly zero by 2030. This situation emphasizes the need for waste diversion strategies such as recycling, composting, and the implementation of the 2030 Solid Waste Master Plan discussed in the previous paragraph.
Innovative waste management and composting initiatives in southeastern Massachusetts include the Crapo Hill Landfill’s landfill gas-to-energy projects in New Bedford and Dartmouth’s comprehensive waste management program,
which includes a landfill gas collection system and composting facilities. The South Shore Recycling Cooperative provides resources and education to promote recycling and composting among member towns, and many local businesses and institutions participate in food waste composting programs, often partnering with local farms and composting facilities.
Table 3. Locations of regional landfills.
Landfill Name
Acushnet LF 561 Main Street
Attleboro Landfill, Incorporated 179 Peckham Street
Acushnet 1963 1987
Attleboro 1975 1995
Carver-MarionWareham Landfill 118 Federal Road Carver 1973 1988
Crapo Hill LF 300 Samuel Barnet Boulevard New Bedford 1995 2027 Open
Dartmouth LF 976 Russells Mills Road
Dartmouth 1945 1994 Closed Fall River Landfill 1080 Airport Road Fall River 1940 2014 Closed
Marion LF Benson Brook Road Marion 1968 1993 Closed Middleborough Landfill 207 Plympton Street Middleborough 1962 2031 Open
New Bedford LF 1103 Shawmut Avenue New Bedford 1921 2000
Taunton SLF 340 East Britannia Street
Taunton 1938 2020
Recycling patterns in southeastern Massachusetts follow general state guidelines, but also include specific practices tailored to the region’s needs. Many towns offer curbside recycling and have drop-off centers for hard-torecycle items. Periodic household hazardous waste collection events are also held in many towns to safely dispose of hazardous waste. Notable recycling centers include the New Bedford Recycling Center and the Fall River Recycling Center, which provide a wide range of recycling services. Local initiatives and programs such as the Beyond the Bin Recycling Directory and Massachusetts RecycleSmart help residents find recycling and reuse options for items that cannot go in the regular recycling bin.
In Southeastern Massachusetts, recycling diversion rates and contamination losses present significant challenges and opportunities for improvement. Detailed data from the Department of Environmental Protection (MassDEP) highlights the efforts made by cities and towns to manage solid waste and recycling. The state has implemented various measures to enhance recycling rates and reduce waste, contributing to a broader goal of sustainable waste management.
Contamination in recycling streams occurs when non-recyclable materials are mixed with recyclables, causing issues at sorting facilities. In Southeastern Massachusetts, common contaminants include plastic bags, food waste, and “tanglers” like hoses and electronic cords, which can jam sorting machinery and increase processing costs. Contamination not only reduces the quality of recyclables but can also lead to entire loads being sent to landfill instead of being recycled.
Table 4. Municipal recycling rates as of CY23. (MassDEP)
Municipality
1. Landfill Capacity Shortages: The existing landfills in southeastern Massachusetts are nearing capacity, with the Crapo Hill expected to reach capacity by 2027 and the Middleborough Landfill by 2031. The statewide landfill capacity is projected to be nearly zero by 2030, creating a significant vulnerability that could lead to waste management crises if not addressed through enhanced recycling waste diversion, and alternative waste management strategies.
2. Recycling Contamination Issues: Contamination in recycling streams is a critical issue, particularly with common contaminants like plastic bags, food waste, and “tanglers” such as hoses and electronic cords. This contamination reduces the effectiveness of recycling programs and can lead to recyclable materials being sent to landfills, exacerbating the landfill capacity problem.
3. Inadequate Recycling Rates: While some municipalities in southeastern Massachusetts have relatively high recycling rates, others fall short. Improving these rates is crucial for reducing waste sent to landfills.
4. Septic System Nitrogen Pollution: The high density of septic systems in towns contributes to nitrogen pollution, impacting coastal ecosystems and water quality in Buzzards Bay. This presents a significant environmental vulnerability, particularly for water quality and marine life in the area.
5. Waste Management Infrastructure: The region’s waste management infrastructure, including recycling centers and sewer systems, is under pressure from increasing waste volumes and aging facilities. For instance, there is a need for more robust infrastructure to handle hazardous waste and recycling more effectively.
6. Public Awareness and Compliance: The effectiveness of waste management programs heavily relies on public participation and compliance. While there are initiatives like the MassDEP Recycling IQ Kit, there is still a need for improved public education and outreach to minimize recycling contamination and increase participation in recycling and composting programs.
T2-T6: Increase access to curbside recycling and drop-off centers for hardto-recycle items. Encourage more municipalities to adopt comprehensive recycling programs to boost recycling rates and decrease reliance on landfills.
Communities should work to increase access to curbside recycling services and establish convenient drop-off centers for hard-to-recycle items, ensuring that residents can easily participate in waste diversion efforts. Encourage municipalities to adopt and expand comprehensive recycling programs that target a wide range of materials, with the goal of significantly boosting recycling rates and reducing dependence on landfills. By promoting these initiatives, communities can enhance environmental sustainability and reduce the overall waste footprint.
San Francisco is renowned for its ambitious Zero Waste by 2020 goal, which aimed to divert all waste from landfills. The city implemented comprehensive curbside recycling and composting programs, along with drop-off centers for hard-to-recycle items, such as electronics and hazardous materials. San Francisco has achieved an impressive waste diversion rate of over 80% significantly reducing landfill dependency. The city’s programs serve as a model for other municipalities, demonstrating the effectiveness of comprehensive recycling and waste diversion initiatives.
T2-T6: Enhance public awareness of proper recycling practices. Strengthen enforcement of waste disposal bans to minimize contamination in recycling streams. Expand public education and conduct regular community outreach through workshops, information campaigns, and school programs to promote recycling, composting, and environmental stewardship.
Funding Opportunities: EPA Environmental Education Grants, State Recycling Education and Outreach Grants, Private Foundation Grants for Environmental Education Programs.
Communities should enhance public awareness of proper recycling practices by emphasizing the importance of source separation to keep recyclables clean and free of contaminants. Strengthen the enforcement of waste disposal bans to minimize contamination in recycling streams, ensuring that recycling efforts are effective. Expand public education initiatives, such as the MassDEP Recycling IQ Kit, and conduct regular community outreach through workshops, information campaigns, and school programs to promote recycling, composting and broader environmental stewardship. By educating and engaging the public, communities can foster a culture of sustainability and improve the effectiveness of recycling programs.
Toronto’s Solid Waste Management Services launched a series of community engagement initiatives to educate residents about popper waste sorting and recycling. The program includes workshops, school education campaigns, and neighborhood outreach efforts, supported by tools like the Waste Wizard, an online resource that helps residents identify how to dispose of various items. The program has significantly reduced contamination in the city’s recycling stream and increased public participation in waste diversion efforts. The educational outreach has fostered a stronger culture of environmental stewardship among residents, leading to higher recycling rates and reduced waste.
RECOMMENDATIONS:
T2-T6: Invest in modernizing and expanding recycling and waste management infrastructure, including upgrading aging facilities and increasing capacity for hazardous waste and complex materials. Explore and adopt alternative waste disposal technologies, such as waste-to-energy and advanced recycling methods, to further reduce landfill dependency.
Funding Opportunities: EPA Recycling Infrastructure Grants, State Environmental Infrastructure Loan Programs, Private-Public Partnerships for Waste Management Technology Development.
Communities should invest in modernizing and expanding recycling and waste management infrastructure to meet current and future demands. This includes aging facilities and increasing capacity to handle hazardous waste and complex materials effectively. Additionally, communities should explore and adopt alternative waste disposal technologies, such as waste-to-energy and advanced recycling methods, to further reduce dependency on landfills and enhance overall waste management efficiency. By prioritizing these upgrades, communities can improve the sustainability and resilience of their waste management systems.
Los Angeles, California, has modernized and expanded its waste management infrastructure as part of the Zero Waste LA program. Key efforts include upgrading recycling facilities, increasing capacity for hazardous and complex waste, and adopting alternative waste disposal technologies, such as waste-to-energy and anaerobic digestion. The city has also partnered with private companies to enhance its capabilities. These improvements have reduced landfill dependency, increased recycling rates, and improved the handling of hazardous materials.
T2-T6: Continue to use GIS data and other advanced technologies to monitor waste generation, recycling rates, and landfill capacity. Use this data to inform policy decisions and infrastructure investments. Regularly assess waste management practices and infrastructure to ensure alignment with long-term sustainability objectives.
Funding Opportunities: Smart Cities Grant Program, State Data and Technology Innovation Grants, Public-Private Partnerships for Technology Development in Waste Management.
Communities should continue to utilize GIS data and other advanced technologies to monitor waste generation, recycling rates, and landfill capacity. This data-driven approach allows for more informed policy decisions and strategic infrastructure investments that align with long-term sustainability objectives. Regular assessments of waste management practices and infrastructure should be conducted to ensure they remain effective and adaptable to evolving needs. By leveraging data for continuous improvement, communities can optimize their waste management systems and enhance environmental outcomes.
New York City’s Local Law 87 requires large buildings to conduct energy audits and retro-commissioning, alongside annual benchmarking of energy and water use. The data collected is used to inform policy decision and improve building performance. The data-driven approach has led to significant energy and water savings across the city, contributing to New York’s broader sustainability goals. By leveraging data, the city has been able to identify key areas for improvement and implement targeted interventions to reduce waste and improve efficiency.
Best Practice #1: Increase forestry management to maintain a healthy tree canopy.
Best Practice #2: Increase funding for preservation efforts.
Best Practice #3: Implement zoning initiatives.
Best Practice #4: Support reforestation and community engagement.
Best Practice #5: Increase public education and stewardship.
Best Practice #1: Promote sustainable land management.
Best Practice #2: Protect prime farmland.
Best Practice #3: Restore and conserve wetlands.
Best Practice #4: Manage cranberry bogs sustainably.
Best Practice #5: Adapt to climate change.
Best Practice #6: Integrate soil quality indicators.
Best Practice #7: Educate and engage communities.
Best Practice #1: EImplement and maintain effective septic, wastewater, and stormwater systems.
Best Practice #2: Preserve and enhance aquatic habitats.
Best Practice #3: Monitor and regulate water quality.
Best Practice #4: Enhance climate resilience.
Best Practice #5: Protect biodiversity and ecosystem connectivity.
Best Practice #6: Prioritize Environmental Justice.
Best Practice #7: Foster community engagement and education.
Forests and tree cover are an integral part of life on Earth. Trees play a large role in the air we breathe and the clean the water we drink; they also provide shade and shelter against the elements, creating habitat for numerous species of plants and animals, absorbing carbon from the atmosphere, and contributing to the visual aesthetic of our communities. The process of absorbing carbon from the atmosphere is critical for keeping the climate on Earth within livable means. Trees play a vital role in this process: they help regulate CO2 in the atmosphere by sequestering CO2 in their woody biomass through photosynthesis.
Massachusetts and the United States both recognize the importance forest cover has on our wellbeing and have developed plans to assist in not only their conservation, but their expansion as well. In 2022, The United States Department of Agriculture (USDA) released the National Forest System Reforestation Strategy Guide, which identifies the guiding principles for reforestation across the United States. In conjunction, the Repairing Existing Public Land by Adding Necessary Trees (REPLANT) Act was signed into legislation on November 15th, 2021. The REPLANT act removed the limit on the former Reforestation Trust Fund, enabling an estimated 1.2 billion trees to be planted each decade.
Massachusetts touches on the importance of reforestation within a few key documents: the Massachusetts 2050 Decarbonization Roadmap; the Resilient Lands Initiative: Expanding Nature’s Benefits Across the Commonwealth; and the Clean Energy and Climate Plan for 2050. The 2050 Decarbonization Roadmap document estimates that the current forests of Massachusetts are able to sequester approximately 7% of the state’s current emissions – approximately half of what the allowable emissions will be in 2050.42 The Clean Energy and Climate Plan for 2050 sets a goal of planting an additional 64,400 acres or more of riparian and urban trees, while also aiming to permanently conserve an additional 685,000 acres (roughly 40% of the Commonwealth).43 The Expanding Nature’s Benefits Across the Commonwealth document, which is a companion piece to
the 2050 Decarbonization Roadmap and the Clean Energy and Climate Plan for 2050, identifies specific actions to implement to achieve the forestry goals set by the state. These actions include:
• Enhanced adoption of Natural Resources Protection Zoning (NRPZ) and related “cluster development” techniques;
• Seeking to enhance adoption of tree protection bylaws;
• Tree planting in buffers along rivers, streams, lakes, and ponds;
• Launching the Climate Smart Forestry Program;
• Evaluating potential amendments to the MA Forest Tax Law;
• Seeking to increase the percentage of long-lived forest products from existing harvests;
• Seeking to create the Forest Viability Program; and
• Exploring expansion of landscape and watershed-scale conservation, stewardship, and restoration projects.
In 2016, the USDA ranked Massachusetts 13th in the United States for the highest percent of forested land cover, at approximately 60% of the state’s land area.44 At that time, the SRPEDD region’s proportion of forested land cover was somewhat smaller, at 43%. According to SRRP analysis, Dighton, Rehoboth, Freetown, and Berkley had the highest forested land cover, with over 50% of each municipality forested, and the City of New Bedford had the least, with approximately 20% forested land cover (see 2016 Forested Land Cover in Southeastern Massachusetts map).
The 2020 Losing Ground Report by Mass Audubon describes land development trends between 2012 – 2017. During this timeframe, approximately 89,349 acres out of the 516,690 acres in the SRPEDD region (17%) are permanently protected from development under Chapter 61. This permanently conserved land is an increase of 13,520 acres (18%) since 2012. Despite the increase in permanently protected land, the SRPEDD region also lost 3,951 acres of land (0.76%) to new development between 2012 – 2017, this rate of development has stayed approximately the same since the 2014 Losing Ground Report by Mass Audubon, which states the SRPEDD region had 4,095 acres (0.79%) of new development between 2005 – 2013.
BioMap, a mapping tool created by MassWildlife and The Nature Conservancy (TNC), identifies “Core Habitats” and “Critical Natural Landscapes,” which are areas of significant importance to protect throughout the Commonwealth. Within Massachusetts, there are 439,500 acres of “Forest Core”, a specific type of Critical Natural Landscape that is extremely important for sustaining biodiversity, carbon sequestration, water filtration, and flooding mitigation, among others. SRRP analysis revealed that approximately 8% of the statewide Forest Core is within the SRPEDD region (accounting for 14% of the land cover within the SRPEDD region), with the largest Forest Cores located in the Freetown-Fall River State Forest, Rocky Gutter Wildlife Management Area, Erwin S. Wilder Wildlife Management Area, and the Haskell Swamp Wildlife Management Area.
Using the TNC Resilient Mapping tool, the primary type of forest found in Southeastern Massachusetts is Oak/Hickory, with some Elm/Ash/Cottonwood, White/Red/Jack Pine, Maple/Beech/Birch, Loblolly/Shortleaf Pine, and Spruce/ Fir mixed in. As of 2010 these forests were estimated to have sequestered carbon between approximately 50 - 120 metric tons of carbon per acre, and by 2050, in an assumed no disturbances scenario, these forests have sequestered between 70 - 120 metric tons of carbon per acre. In Massachusetts it is estimated that an average acre of forests is storing roughly 103 tons of carbon.45
Reforestation across the SRPEDD region could help to increase the amount of carbon sequestration in Massachusetts, and help the state reach their goals. Using TNC research, the Reforestation Hub has identified 93,800 acres of reforestation potential within Bristol and Plymouth counties, primarily within Urban Open Spaces, which are “areas with some human construction (< 20% of cover), but mostly vegetative cover typically in the form of lawn grasses” (see Acres of Reforestation Potential in Bristol and Plymouth Counties table). The reforestation of these areas could remove an additional 0.36 million tons of CO2 per year, the equivalent of removing over 78,000 cars from the road. In the Boston Metro alone, urban forests remove 1.75 million pounds of air pollutants, store 962,000 tons of carbon with an additional 23,000 tons added each year and help to mitigate the impacts of 527 million gallons of stormwater runoff annually.46
Additionally, many of the municipalities within the SRPEDD region have identified forested land cover as a potential vulnerability during their climate resilience planning conducted through the State’s Municipal Vulnerability Preparedness (MVP) program. Nineteen (19) of the SRPEDD region’s 27 municipalities include tree or forest related action items in their MVP plans.
1. Invasive Species and Pests: Once established, invasive species and pests are often hard to eradicate. Prevention and mitigation are critical in managing these species. The current top threats to forests in Southeastern Massachusetts include; Spongy Moth (Lymantria dispar), Winter Moth (Operophtera brumata), Hemlock Woolly Adelgid (Adelges tsugae), Southern Pine Beetle (Dendroctonus frontalis), and Emerald Ash Borer (Agrilus planipennis), as well as diseases, which include Beech Leaf Disease and White Pine Needlecast.47
2. Climate Change: Climate Change is altering weather patterns across the world, changing each region’s average temperature and precipitation. As the weather patterns shift, so do the types of plants that can grow within that area. The U.S. Department of Agriculture has mapped out plant “hardiness zones” which detail what kinds of plants are most likely to thrive in any given location based on that area’s climate. The hardiness zones have been projected for the end of the century assuming a high emissions scenario (RCP 8.5), which shows significant changes in the types of plants growing across the United States.48
3. Development: Trees take several years to grow but can be cut down in an instant for development. Preserving our existing trees and prioritizing the planting of new trees is crucial in keeping our region resilient.
Forest protection is a crucial step in preserving the quality of life in the Commonwealth. As forest cover is lost every year, due to climate change, human development, or other means, we must prevent the loss or deterioration of the region’s remaining forested land. In doing so, the air quality, the health of the climate, and a vital element of the region’s natural beauty may be preserved.
T1-T3: Pursue proactive land conservation and management in coordination with state initiatives, such as the Executive Office of Energy and Environmental Affairs’ (EOEEA) Forests and Climate Solutions; work in partnership with various state departments and programs including, but not limited to Department of Fish and Game’s (DFG) Division of Fisheries and Wildlife, Department of Conservation and Recreation’s (DCR) Division of Water Supply Protection, and DCR’s Public Lands Forestry Program.
T4-T6: Participate in DCR’s Urban and Community Forestry and Greening the Gateway Cities Programs; pursue local zoning, permitting, and siteplanning that minimizes clear-cutting and emphasizes a health urban forest and tree canopy.
Programs and Services for Forest Land-Owners, Grants for Forestry and Forest Fire Control, Forest Stewardship Programs, and DCR Watershed Forestry Program.
Both rural and urban forestry management practices can protect tree health in our forests and neighborhoods. Healthy, mature trees protect local air quality, and are more likely to withstand extreme winds than diseased or damaged trees, reducing the likelihood of blowdowns. Tree blowdowns during storms not only reduce tree canopy, but dead standing wood in forests contributes to wildfire hazards.
Massachusetts and the Federal government currently offer a range of grants and assistance programs for land preservation. Initiatives such as the Landscape Partnership Grant Program, the Local Acquisitions for Natural Diversity Grant (LAND), and the Massachusetts Land and Water Conservation Fund (LWCF) Program are just a few of the many opportunities that local agencies, regional agencies, or nonprofit organizations can utilize for the purposes of forest protection.
These funding efforts can be used to aid in municipal or regional land acquisitions for the purposes of conservation or for future recreational uses.
A viable strategy for forest preservation is to implement municipal rezoning across existing unprotected forests. Many zoning initiatives can be instituted, such as enabling and incentivizing clustered development, which can reduce the pressure for development expansion into forested areas. Additionally, indirect protections can be added, such as the implementation of open space requirements or land coverage restrictions that would inherently limit the development of impervious surfaces upon privately-owned forested land.
Further, regulatory protections can be provided to essential forest land through the rezoning of existing parcels or districts; this can take shape in multiple ways–either through the prohibition of residential, commercial or industrial development on publicly or privately-owned land, or through the rezoning of enveloping districts (commercial, industrial) to reduce the strain on the natural land and to preserve soil and air quality.
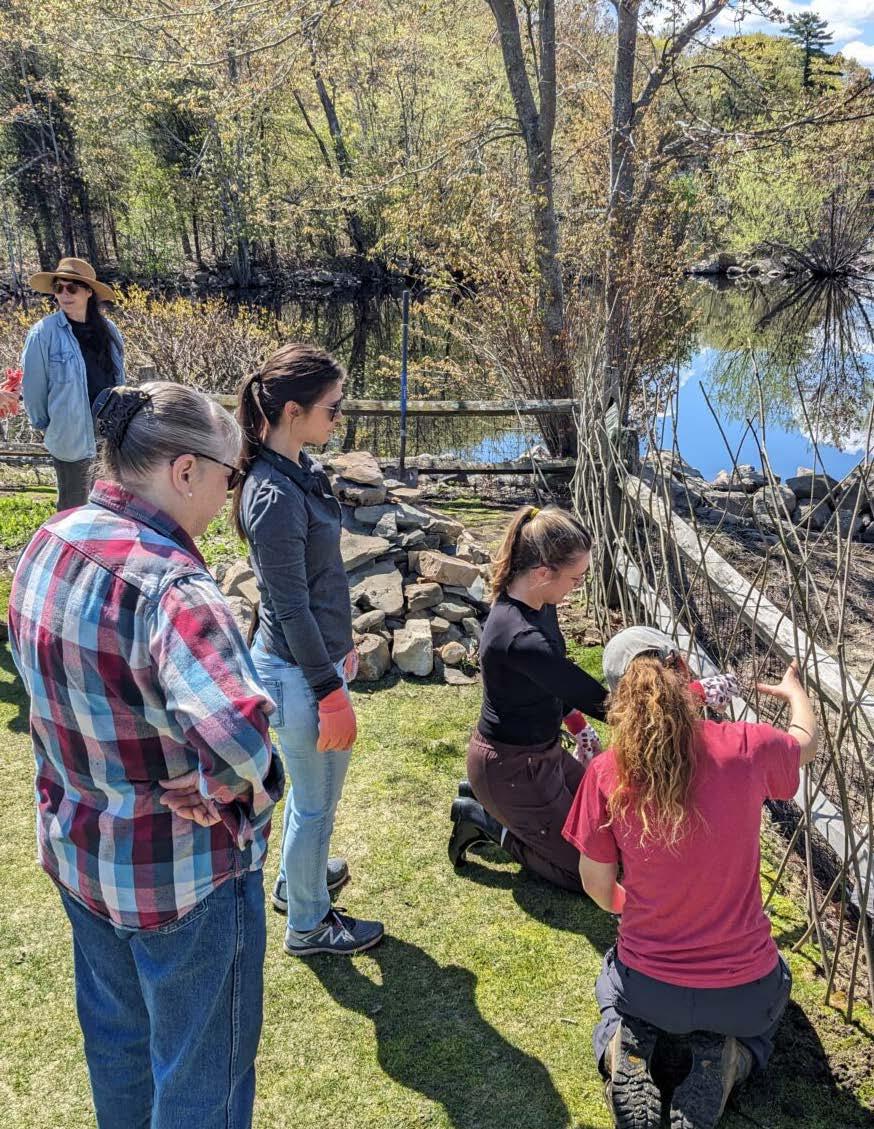
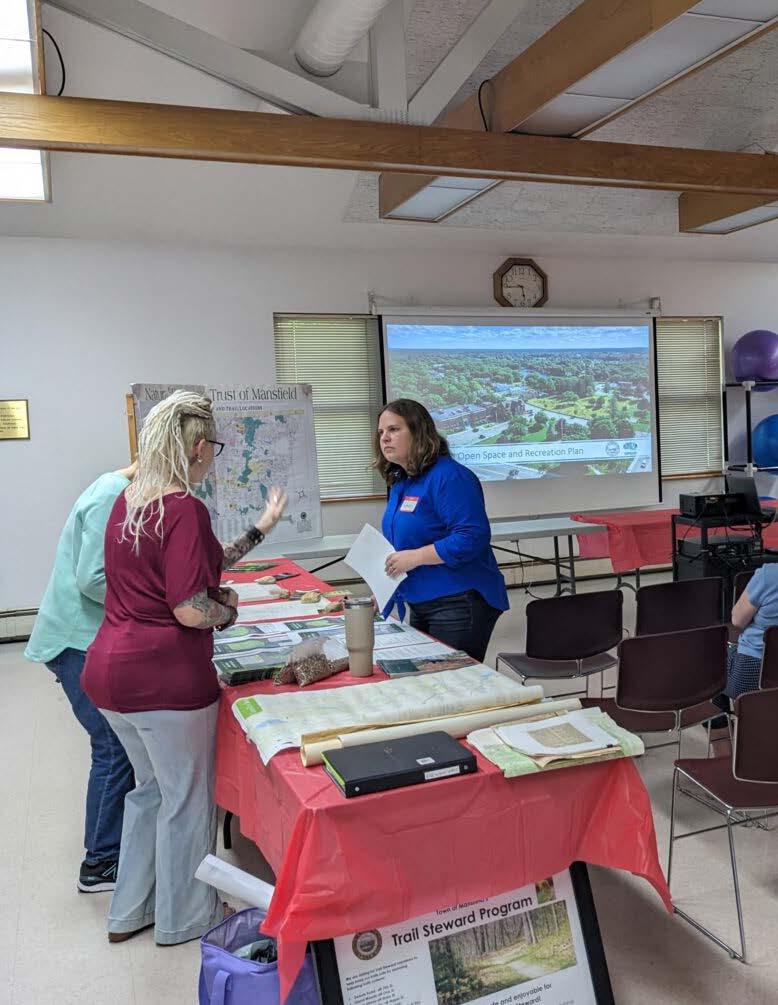
Though the preservation of existing forest is essential, the region can relieve strain upon undeveloped land in other ways. Establishing reforestation efforts, either through the creation of municipal and regional programs or through community involvement can reduce the urgency for preservation efforts. Repurposing unused land or undevelopable land can be a viable strategy in not only increasing forest acreage but indirectly restoring the natural beauty of these tracts of land. In tandem with rezoning initiatives and preservation efforts, forgotten parcels of land can be reforested and subsequently protected for future generations.
Many towns and cities in the Southeast region of the Commonwealth contain forested land with which the public interacts, either directly, through trails, bike paths, or other recreational opportunities, or indirectly, through adjacent/ intersecting human development. Often, these forests are overlooked as an immutable aspect of the municipal landscape. However, human activity can actively degrade the quality of forested land.
Education initiatives can reduce the rate of degradation. In teaching residents the importance of land preservation and stewardship, those living in parts of the region with dense, forested land may be encouraged to engage in their own best practices to healthily coexist with their natural environment. The promotion of waste disposal, limited vehicular (offroad, automotive) use, and active engagement in community preservation efforts (planting trees, reducing litter) can significantly reduce the harms facing the region’s forests at the local scale.
Healthy Soils are full of rooted plants and trees that allow for complete nutrient cycles and carbon sequestering. As plants photosynthesize, they pull carbon and gases into the soil. According to a study published in Environmental Research Letters, “the largest terrestrial source of CO2 emissions is soil where 80% of the total terrestrial carbon is stored.”49 Protecting carbon critical soils will be required for Massachusetts to reach its carbon reduction goals detailed in the Massachusetts 2050 Decarbonization Roadmap. Massachusetts carbon critical soils can be found in farmland, forested land, and wetlands. Each of these unique habitats pulls carbon out of the air and into the soil creating rich plant biodiversity and healthy soils. Further, increasing best management practices for forests and farmland increases the potential ability of soil to sequester more carbon.
The quality of soil, or its capacity to function, is evaluated using inherent and dynamic soil properties. These properties serve as indicators of soil function because it is difficult to measure function directly and observations may be subjective. Inherent (or “use-invariant”) soil properties change very little or not at all with management.50 Inherent soil properties form over thousands of years and result primarily from the soil forming factors: climate, topography, parent material, biota, and time. Examples of inherent properties are soil texture, type of clay, depth to bedrock, and drainage class. Dynamic, or management dependent, soil properties are affected by human management and natural disturbances over the human time scale, i.e., decades to centuries. Significant changes in dynamic soil properties can occur in a single year or growing season.
Scientists use soil quality indicators to evaluate how well soil functions because soil function often cannot be directly measured.51 Measuring soil quality is an exercise in identifying soil properties that are responsive to management, affect or correlate with environmental outcomes, and are capable of being precisely measured within certain technical and economic constraints. Soil quality
indicators may be qualitative (e.g. drainage is fast) or qualitative (infiltration= 2.5in/hr).52
There are three main categories of soil indicators: chemical, physical, and biological. Typical soil tests only look at chemical indicators. Soil quality attempts to integrate all three types of indicators. The categories do not neatly align with the various soil functions, so integration is necessary. The table below shows the relationship between indicator type and soil function.
Table 6. Soil Indicators, Functions, and Measures. (soilquality.org)
Indicator Category
CHEMICAL
PHYSICAL
BIOLOGICAL
Related Soil Function
Nutrient Cycling, Water Relations, Buffering
Physical Stability and Support, Water Relations, Habitat
Biodiversity, Nutrient Cycling, Filtering
Some Measures
Electrical Conductivity, Soil Nitrate, Soil Reaction (pH)
Aggregate Stability, Available Water Capacity, Bulk Density, Infiltration, Slaking, Soil Crusts, Soil Structure and Macropores
Earthworms, Particulate Organic Matter, Potentially Mineralizable Nitrogen, Respiration, Soil Enzymes, Total Organic Carbon
When soil is disrupted through clearing and land conversion, not only does it lose its ability to sequester carbon, but previously stored carbon is also remitted to the atmosphere. According to the Massachusetts Healthy Soils Action Plan (MHSAP), 475,033 acres of soil (9.2%) in Massachusetts have been converted to impervious surfaces such as pavement and buildings. Mass Audubon’s Losing Ground 2020 report ranked the SRPEDD region second out of the 13 regional planning agency districts in the state in terms of total area of newly developed land from 2012-2017 with a total of 3,951 acres developed. With this increase, the region’s total area of development acres is 128,588 of 516,690 acres. The SRPEDD region only ranks 8th out of 13 in the state for total area of permanently conserved land acres totaling 89,349. With increasing pressures for the region to fulfill density and housing needs, rapid development is anticipated to increase.
Southeastern Massachusetts is full of beautiful scenic farm views. These lands are active as they are filled with growing fruits and vegetable crops, cranberry bogs, orchards, and fields of hay for livestock. Prime farmland soils are those that have the best combination of physical and chemical characteristics for
producing agricultural crops, based on soil quality, growing season, and moisture supply. Other important farmland soils that fail to meet one or more of the requirements of prime farmland, but are important for the production of food, feed, fiber, or forage crops are designated as farmland of statewide importance, and lands that produce specific high value food and fiber crops are designated as farmland of unique importance. The Regional Open Space Prime Farmland Soil Map shows characteristics that there is an abundance of state and locally important farmland that should be conserved, especially in our region’s rural areas (Typologies 1 and 2).
Farmland classification of soils identifies land that has the best combination of physical and chemical characteristics for producing food, feed, fiber, forage, and oilseed crops and is available for such use.53 Farmland criteria for soils in Massachusetts include:
• Prime Farmland: Land that has the best combination of physical and chemical characteristics for producing food, feed, forage, fiber, and oilseed crops and is available for these uses. It could be cultivated land, pastureland, forestland, or other land, but it is not urban or built-up land or water areas.
• Unique Farmland: Land other than prime farmland that is used for the production of specific high-value food and fiber crops, such as citrus, tree nuts, olives, cranberries, and other fruits and vegetables. It has the special combination of soil quality, growing season, moisture supply, temperature, humidity, air drainage, elevation, and aspect needed for the soil to economically produce sustainable high yields of these crops when property managed. The water supply is dependable and of adequate quality.
• Farmland of Statewide Importance: Land that does not meet the criteria for prime or unique farmland. The criteria for defining and delineating farmland of statewide importance are determined by the appropriate State agencies. Generally, this land includes areas of soils that nearly meet the requirements for prime farmland and that economically produce high yields of crops when treated and managed according to acceptable farming methods.54
The largest concentration of prime farmland is located in the lower southeastern portion of the region, specifically in Westport, Dartmouth, Acushnet, and Fairhaven. This section shows a dense and widespread distribution of prime farmland, indicating that it is highly valuable for agriculture.
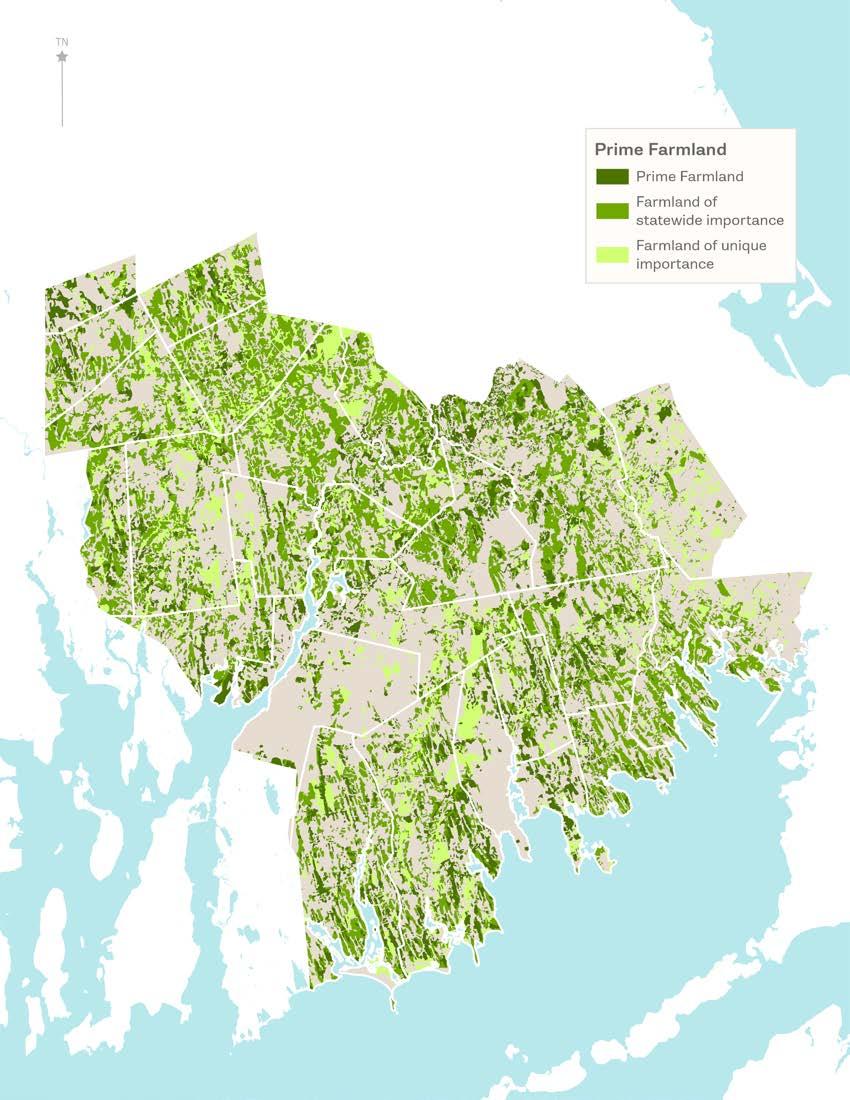

Moving forward as a region, increasing protections on these parcels of land is incredibly important. Programs such as Chapter 61/61A have helped create temporary protection on some of the most vital privately owned land in the region. Towns are exploring the best practices for how to prepare for acquiring Chapter 61/61A lands as they arise for sale and how to keep them in protection long term. The state has also put out several extension programs for farmers teaching the implementation of best practice methods for carbon sequestering through farming for the benefit of the atmosphere, soil and crops.
A larger portion of soil organic carbon (SOC) in Massachusetts is within wetlands, of which Southeastern Massachusetts has the highest concentration of area covered in wetlands. On average wetlands and peatlands hold 6x more SOC than forested soils. From map Wetlands, wetlands are spread out across the entire part of the region mostly consisting of swamps and marshlands.
Wetlands in Massachusetts and specifically in the SRPEDD region face pressures from historically been threatened by development and now climate change. Conservation Commissions prevent the loss of wetlands by ensuring that state and federal regulations are implemented; some communities also adopt local wetland bylaws that can add additional layers of protections and requirements. Additionally, the cranberry bog business in the region historically relied on the conversion of wetlands to bogs. While active cranberry bogs hold some of the same carbon retention, they are at risk of being filled rather than reconverted to their natural state as the Massachusetts cranberry industry faces an uncertain economic future. Saltwater marshes are also a form of wetlands and are losing space as sea level rise pushes water levels inland. In a natural landscape, these marshes would move further “upland;” however, due to intense development in coastal areas there are no natural areas for these marshes to retreat to. Saltwater marshes make up an important range of wetlands and areas able to sequester as much carbon while emitting significantly less methane (MHSAP).
1. Soil Disruption and Carbon Sequestration Loss: When soils are disrupted through clearing and conversion (e.g., to impervious surfaces, such as pavement), they lose the ability to sequester carbon. Additionally, previously stored carbon is released into the atmosphere, contributing to greenhouse gas emissions.
2. Development Pressure: Rapid development in Southeastern Massachusetts, driven by housing and density needs, is leading to the conversion of valuable farmland and natural areas. This results in a decrease in the land available for carbon sequestration and agricultural productivity.
3. Prime Farmland and Soil Conservation: Prime farmland, which has the best combination of physical and chemical characteristics for crop production, is vulnerable to development pressures. While some protection is offered through programs like Chapter 61/61A, long-term protection remains uncertain.
4. Loss of wetlands: Wetlands in the region, which hold a significant amount of soil organic carbon (SOC), are under threat from both development and climate change. Wetlands are particularly important for carbon sequestration but are being lost due to sea level rise and development encroaching on natural retreat areas.
5. Cranberry Bogs and Wetland Conversion: The conversion of wetlands to cranberry bogs has historically been common in the region. As the cranberry industry faces economic pressures, there is a risk of these bogs being filled rather than restored to their natural wetland state, leading to further loss of carbon sequestration capacity.
6. Climate Change: Climate change is exacerbating the vulnerabilities of wetlands and other natural areas. Rising sea levels, changes in precipitation patterns, and other climate-related factors are putting additional stress on these ecosystems, reducing their ability to function effectively in carbon sequestration and other environmental roles.
7. Rising sea levels, increasing storm intensity/frequency: Rising sea levels and increasing storm intensity and frequency exacerbate the vulnerabilities of coastal and wetland ecosystems. As sea levels rise, saltwater marshes and other coastal wetlands, crucial for carbon sequestration, are increasingly inundated, and their natural inland migration is blocked by coastal development, leading to their loss. Intense storms contribute to erosion, soil degradation, and increased flooding, disrupting soil structure, leaching nutrients, and damaging ecosystems. These factors not only reduce the land’s productivity and carbon sequestration capacity but also heighten the risk of long-term soil and ecosystem degradation.
T1-T2: Implement best management practices on farmland and forested areas to enhance soil health and increase carbon sequestration. This includes practices such as crop rotation, cover cropping, reduced tillage, and agroforestry.
Funding Opportunities: USDA Conservation Stewardship Program (CSP), Environmental Quality Incentives Program (EQIP), Regional Conservation Partnership Program (RCPP).
Communities should implement best practices on farmland and forested areas to enhance soil health and increase carbon sequestration. These practices include crop rotation, cover cropping, reduced tillage, and agroforestry, all of which contribute to maintaining soil fertility, reducing erosion, and capturing atmospheric carbon. By adopting these sustainable land management techniques, communities can improve the long-term productivity of agricultural lands and forests while also playing a crucial role in mitigating climate change.
Marsden Farm, part of the University of Minnesota’s agricultural research station, implemented crop rotation and cover cropping as part of a longterm study. The study compared conventional two-year corn-soybean rotations with more diverse rotations including alfalfa and oats, with and without cover crops. The diverse rotations significantly improved soil health, reduced the need for chemical inputs, and increased carbon sequestration. The farm demonstrated that sustainable land management can be both economically viable and environmentally beneficial.
T2-T6: Prioritize the restoration and conservation of wetlands, particularly those with high soil organic carbon (SOC) content. This includes protecting existing wetlands from development and climate change impacts and restoring converted wetlands to their natural state.
Funding Opportunities: Agricultural Preservation Restriction (APR) Program, USDA Farmland Protection Program, State and Local Open Space Bond Programs.
Communities should prioritize the restoration and conservation of wetlands, with a special focus on those with high soil organic carbon (SOC) content. Efforts should include protecting existing wetlands from development and the impacts of climate change, as well as restoring wetlands that have been converted or degraded. By preserving and rehabilitating these vital ecosystems, communities can enhance biodiversity, improve water quality, and increase carbon sequestration, all of which contribute to climate resilience.
California’s Farmland Conservancy Program (CFCP) focuses on conserving agricultural land through conservation easements. The program targets high-quality farmland threatened by urban sprawl. Since its inception, CFCP has protected over 70,000 acres of prime farmland, ensuring that these lands remain available for agricultural use. The conservation easements have provided farmers with financial incentives to preserve their land, supporting local food production and carbon sequestration.

T2-T6: Prioritize the restoration and conservation of wetlands, particularly those with high soil organic carbon (SOC) content. This includes protecting existing wetlands from development and climate change impacts and restoring converted wetlands to their natural state.
Funding Opportunities: Wetlands Reserve Program (WRP), NOAA Coastal Wetlands Conservation Grants, U.S. and Wildlife Service National Coastal Wetlands Conservation Grant Program.
Communities should prioritize the restoration and conservation of wetlands, with a special focus on those with high soil organic carbon (SOC) content. Efforts should include protecting existing wetlands from development and the impacts of climate change, as well as restoring wetlands that have been converted or degraded. By preserving and rehabilitating these vital ecosystems, communities can enhance biodiversity, improve water quality, and increase carbon sequestration, all of which contribute to climate resilience.
The Comprehensive Everglades Restoration Plan (CERP) is a large-scale effort to restore the hydrology of the Everglades, which includes conserving and restoring wetlands with high soil organic carbon (SOC) content. The project has restored thousands of acres of wetlands, significantly enhancing carbon sequestration and improving water quality. It serves as a model for wetland conservation, demonstrating the ecological and climate benefits of restoring natural water flow patterns.
T1-T2: Encourage sustainable practices in cranberry bogs to maintain their carbon retention capacity. Where economically feasible, consider converting inactive or abandoned bogs back to natural wetlands to enhance carbon sequestration.
Funding Opportunities: USDA Natural Resources Conservation Service (NRCS) Environmental Quality Incentives Program (EQIP), Wetland Reserve Enhancement Partnership (WREP), U.S. Fish and Wildlife Service Partners for Fish and Wildlife Program.
Communities should encourage sustainable practices in cranberry bogs to maintain and enhance their carbon retention capacity. This includes implementing water management techniques, reducing pesticide use, and adopting practices that improve soil health. Additionally, where economically feasible, consider converting inactive or abandoned cranberry bogs back to natural wetlands. This conversion not only restores valuable wetland ecosystems but also significantly increases carbon sequestration, contributing to climate mitigation efforts.
The University of Massachusetts Cranberry Station has been working with cranberry growers to adopt sustainable practices, such as integrated pest management (IMPIPM), water conservation, and nutrient management. These practices have helped maintain the ecological integrity of cranberry bogs while improving the carbon retention capacity of the land. Additionally, some inactive bogs have been successfully converted back to wetlands, enhancing carbon sequestration and providing wildlife habitat.

T1-T5: Develop and implement climate adaptation strategies for coastal and wetland areas, focusing on protecting these ecosystems from rising sea levels and increasing storm intensity. This may involve creating buffer zones, restoring natural landscapes, and implementing policies that allow for the inland migration of saltwater marshes.
Funding Opportunities: FEMA Building Resilient Infrastructure and Communities (BRIC) Program, NOAA Coastal Resilience Grants, U.S. Army Corps of Engineers Continuing Authorities Program (CAP).
Communities should develop and implement climate adaptation strategies specifically tailored to coastal and wetland areas to protect these ecosystems from the impacts of rising sea levels and increasing storm intensity. Key actions include creating buffer zones to absorb storm surges, restoring natural landscapes to enhance ecosystem resilience, and implementing policies that facilitate the inland migration of saltwater marshes as sea levels rise. These strategies are essential for preserving the ecological integrity of these areas and reducing the vulnerability of both natural and human communities to climate change.
CASE STUDY: SEA-LEVEL RISE ADAPTATION IN THE SAN FRANCISCO BAY AREA
The San Francisco Bay Conservation and Development Commission (BCDC) has been leading efforts to adapt to rising sea levels through a program called “Bay Plan Amendments.” The plan includes creating buffer zones, restoring natural landscapes, and facilitating the inland migration of saltwater marshes. This adaptive approach has protected critical coastal ecosystems, provided flood protection, and preserved habitats for endangered species. The project is a key example of how coastal areas can be managed to withstand the impacts of climate change.
T1- T2: Use a comprehensive set of soil quality indicators (chemical, physical, and biological) to monitor and manage soil health. This integration ensures a more holistic approach to evaluating soil function and guides better land management decisions.
Funding Opportunities: USDA Conservation Innovation Grants (CIG), Sustainable Agriculture Research and Education (SARE) Grants, Natural Resources Conservation Service (NRCS) Soil Health Initiative.
Communities and land managers should incorporate a comprehensive set of soil quality indicators—encompassing chemical, physical, and biological properties – to monitor and manage soil health effectively. This holistic approach allows for a more accurate evaluation of soil function, guiding better land management decisions that enhance productivity, support ecosystem services, and contribute to long-term sustainability. By regularly assessing these indicators, land managers can implement targeted practices that improve soil health, promote resilience, and optimize land use.
The Cornell Soil Health Testing Laboratory developed a comprehensive soil health assessment framework that integrates chemical, physical, and biological indicators. The holistic approach has been widely adopted by farmers across the U.S. leading to better land management decisions and improved soil health. The case study highlights the importance of using a diverse set of indicators to monitor and enhance soil function.
T1-T6: Increase public awareness and engage local communities in conservation efforts, emphasizing the importance of healthy soils and wetlands for carbon sequestration and climate resilience. Provide resources and support for farmers and landowners to adopt and maintain best practices.
Funding Opportunities: Environmental Education Grants, USDA Conservation Innovation Grants (CIG), National Fish and Wildlife Foundation (NFWF) Conservation Partners Program.
Communities should increase public awareness and actively engage local residents in conservation efforts, with a focus on the critical role that healthy soils and wetlands play in carbon sequestration and climate resilience. This can be achieved through educational programs, workshops, and outreach campaigns that highlight the benefits of sustainable land management practices. Additionally, provide resources and support for farmers and landowners to adopt and maintain best practices, ensuring they have the knowledge and tools needed to contribute to conservation goals. By fostering a culture of stewardship and involvement, communities can enhance environmental outcomes and build resilience to climate change.
The New York City Watershed Agricultural Program (WAP) is an initiative focused on protecting New York City’s water quality by engaging and educating farmers in the upstate watershed regions. The program promotes best management practices (BMPs) that reduce agricultural pollution, improve soil health, and conserve water, ensuring clean drinking water for millions. The program has successfully improved water quality, encouraged the adoption of sustainable practices, fostered community engagement, and provided economic benefits to farmers. It highlights the importance of education, collaboration, and localized support in achieving conservation goals and balancing agricultural production with environmental protection.
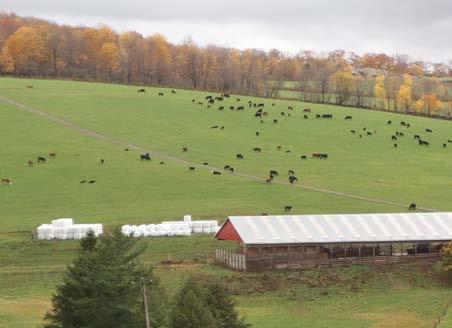
SRRP analysis revealed that there are 23,485 acres of surface waters across the SRPEDD region (not including coastal and tidal areas that do not lie within municipal boundaries), making up 4.5% of the SRPEDD region. The largest natural pond system in the state, the Assawompset Ponds Complex, lies in the towns of Freetown, Lakeville, Middleborough, and Rochester. North and South Watuppa Ponds in Fall River and Westport rank as the second and third largest naturally occurring waterbodies in the state.55 Snipatuit Pond in Rochester, Norton Reservoir in Mansfield and Norton, and Copicut Reservoir in Fall River and Dartmouth, are also among the largest waterbodies in the region; they exist alongside many other smaller surface water bodies in Southeastern Massachusetts. Each body of water provides important resources, including aquatic habitat, recreational opportunity, drinking water supply, and floodwater storage.
Several water bodies provide drinking water supply to the region and are protected for this purpose (see more details about drinking water supply resource areas in the Provide Drinking Water section). Roughly 249,000 acres of land lie within a watershed area that feeds surface water providing either regular or emergency public drinking water service to communities in Massachusetts and Rhode Island. Protecting water quality within these public water supply watersheds in particular is critical to protect current and future public water supplies.
The SRPEDD region is home to diverse fisheries that include saltwater and freshwater ecosystems, including the Taunton River and coastal areas like Buzzards Bay and New Bedford Harbor, with shellfish production being a major focus. Freshwater and saltwater shellfish, invertebrates, and finfish contribute to ex-vessel landings value and are important elements of the region’s economy, culture, and ecosystem. In saltwater areas such as Buzzards Bay and New
Bedford Harbor, key species include scallops, cod, haddock, and lobsters. The New Bedford fishing port has maintained status as the highest valued fishing port in the U.S. for over 20 years108. Total ex-vessel landings in New Bedford valued $443.2 million in 2022, due mostly to scallop, lobster, and oyster harvests109.
Freshwater systems like the Taunton River and the Assawompset Ponds support diadromous fish such as alewife, which are critical to both the aquatic ecosystem and the local economy. Pollution, habitat loss, nutrient runoff, and barriers like dams threaten these fisheries.
Water quality and temperature have a significant impact on a wide diversity of fish and shelfish populations in the region, and their respective commercial fisheries. Scallop, lobster, and oyster populations are highly susceptible to changes in water quality and water temperature and are monitored by the State’s Division of Marine Fisheries (DMF). Acidification and warming of waters inhibit juvenile sea scallop growth and weaken lobster and oyster shells, reducing reproductive ability110. Pollution threatens aquatic life and commercial fisheries in the SRPEDD region. Shellfish producing tidal areas in the region are monitored and closed periodically due to pollution from failed septic systems, agricultural activities, industry and roadways, and stormwater run-off.
The DMF conducts sanitary surveys of shellfish growing areas to ensure that shellfish are safe to eat. These surveys evaluate water quality, pollution sources, and the physical characteristics of the coastal area.
Improvements in water quality have reopened areas of the region that were historically closed for fishing to reopen. For example, the lower Coles and Lees River estuaries in Swansea, which hosted 647 acres of quahog and softshell clam production before they were closed in the 1970s due to pollution, have been allowed to reopen with conditional approval. This means that shell fishing is allowed in these areas, except during certain predictable times, such as following heavy rainfall or during certain times of the year, when expected poor water quality makes the consumption of shellfish unsafe. Water quality is tested before the season reopens each spring, and any rainfall event greater than half an inch triggers an automatic five-day closure. Shell fishing areas are identified in designated shellfish growing areas maps, and local shell fishing regulations are often posted on municipal websites. Residential shellfish permits can be purchased at town clerk’s offices. Water quality improvements have also improved conditions for fin fish, and in areas of the region sport fishing may be
allowed for striped bass, bluefish, squeteague, and winter flounder, though water quality impacts the safety of fish consumption. Addressing water quality issues through coordinated habitat restoration, pollution reduction, and sustainable management is vital for the long-term health of the region’s aquatic resources.
While all of the region’s surface waters serve as habitat for the region’s wildlife, many of the region’s water bodies are identified as providing unique or otherwise significant habitat for certain aquatic species, which may also have cultural, economic, or resilience significance. MassWildlife and the Massachusetts Department of Fish and Game identify habitats that support recreational and commercial fisheries statewide. MassWildlife defines a Coldwater Fish Resource as “a stream, river, or tributary in which reproducing coldwater fish are found.”56 Coldwater fish, including several trout species, Rainbow Smelt, and others, rely on colder waters to complete one or more stages in their life cycle. Stream temperatures are very sensitive to land use and stream flow alterations. Flow interruptions like dams and culverts, loss of buffer vegetation that provides shade, and stormwater runoff can all increase water temperatures, limiting coldwater fish habitat.
Diadromous fish are another unique group of fish species that are monitored by the State’s Division of Marine Fisheries. Diadromous species migrate between fresh and marine waters to complete their life cycle and include river herring, American Eel, and shad.57 Their habitat is limited by barriers such as dams that prevent them from accessing upstream freshwater habitat. Diadromous fish populations are greatly reduced from their historic levels that once supported robust local fisheries, but restoration efforts throughout the region include removing barriers to migration and helping these species to recover by reconnecting them with their freshwater habitat. Today, the Taunton River, which begins in Bridgewater and flows southeast into Mount Hope and Narraganset Bays off the coasts of Somerset and Fall River, and its tributaries host one of the largest river herring runs in the state.58
MassWildlife and The Nature Conservancy collaborated to identify and map habitats across the state that are most important for conserving biological diversity.59 BioMap identifies Core Habitats that include the most significant rare species habitat, exemplary natural communities and resilient ecosystems, by particular habitat types. According to SRRP analysis, fourteen percent of the State’s Aquatic Core Habitat (43,218 acres) are located in the region. An
additional 6,557 acres of local Aquatic Core Habitat that may not rank among the highest quality statewide but have above average native species diversity at the local municipal scale, are located across the region. Vernal Pools, which are extremely important breeding habitat areas for amphibians, as well as other species, are seasonal wetlands that are filled with water in the spring but dry up over the summer.
BioMap identifies the highest quality individual vernal pools as well as clusters of vernal pools and their buffers. There are 33,916 acres of statewide Vernal Pool Core Habitat (14% of the State’s total), and 10,134 acres of local Vernal Pool Core Habitat in the region.
Not only is intact habitat important for biodiversity, but connectivity among these habitats supports migratory species and the natural migration of habitat and wildlife over time, providing for more resilient ecosystems and landscapes. Preserving intact habitat and wildlife corridors ensures a healthy and resilient landscape that will continue to provide resilience benefits to surrounding communities well into the future. BioMap identifies Critical Natural Landscapes, which are large and intact landscape blocks and buffers to core habitats that support connectivity. Aquatic Buffers are a category of Critical Natural Landscapes that include the most intact wetlands and adjacent uplands that support functionality of, and connectivity between, Aquatic Core Habitats. There are 36,432 acres of statewide Aquatic Buffers and an additional 16,366 acres of locally significant Aquatic Buffers in the region.
U.S. EPA and MassDEP together monitor and regulate water quality in Massachusetts. The Clean Water Act codifies the process whereby waters are evaluated with respect to their capacity to support specific uses that are defined in the Massachusetts Surface Water Quality Standards classifications. These uses include aquatic life, fish consumption, drinking water, shellfish harvesting, primary contact recreation (e.g., swimming), secondary contact recreation (e.g., boating), and aesthetics. MassDEP assigns uses, where applicable, to rivers, lakes and coastal waters and determines the minimum water quality criteria required to meet those uses.60
Not all surface waters are evaluated, but waterbodies that are evaluated are designated according to the following categories of uses:
• Class A: waters designated as public water supply sources and their tributaries; excellent habitat for fish and other wildlife; and suitable for primary and secondary contact recreation (i.e. swimming and boating, even if not allowed).
• Class B: waters designated as habitat for fish and other aquatic life and wildlife; and suitable for primary and secondary contact recreation.
• Class SA: marine waters designated as excellent habitat for fish and other wildlife; suitable for primary and secondary contact recreation; and, in some cases, areas approved and conditionally approved for shellfish harvesting.
• Class SB: marine waters designated as excellent habitat for fish and other wildlife; suitable for primary and secondary contact recreation; and, in some cases, restricted and conditionally restricted shellfish areas.61
MassDEP is required to monitor and report to EPA on whether water bodies are meeting their designated surface water quality standards every two years. As such, the MassDEP prepares an “Integrated Lists of Waters” report that further classifies surface waters in Massachusetts, based on water quality data, into the following categories:
• Category 1: “Waters attaining all designated uses”
• Category 2: “Attaining some uses; other uses not assessed”
• Category 3: “No uses assessed”
• Category 4a: “All TMDLs are completed”
• Category 4b: “Impairment controlled by alternative pollution control requirements”
• Category 4c: “Impairment not caused by a pollutant – TMDL not required”
• Category 5: “Waters requiring one or more TMDL(s)” (i.e., the 303(d) List)
• Category 5a: “303(d)-listed waters for which Alternative Restoration Plans have been completed”62
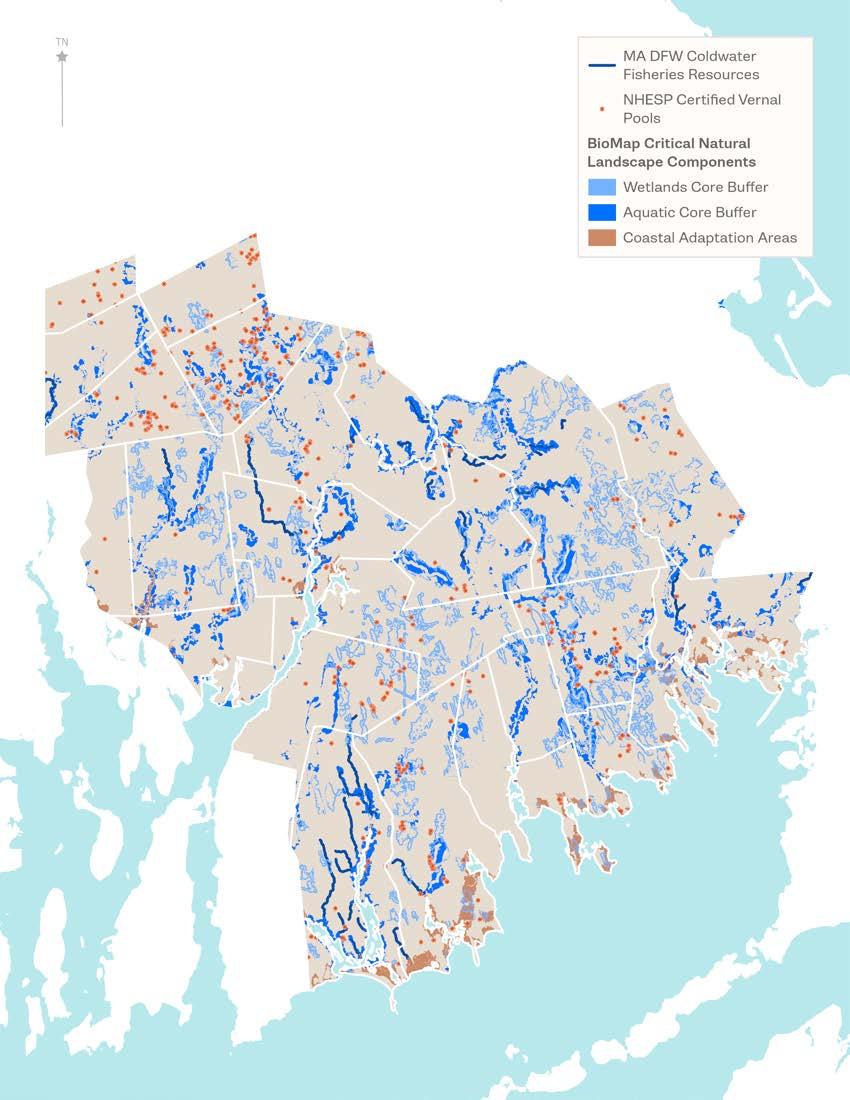
The most recent Massachusetts Integrated Report available is from 2022. Waterbody classifications for the region from this reporting period are portrayed in the MassDEP Integrated List of Waters Map. Occurrences of various water quality impairments across the region are portrayed in the Water Quality Impairment Types Table.
When water quality does not meet the standards identified for the waterbody’s designated use, a Total Maximum Daily Load (TMDL) plan is required. A TMDL “establishes the maximum amount of a pollutant that may be introduced into a waterbody and still ensure attainment and maintenance of water quality standards” and provides a plan for reducing pollutants to achieve those standards.63 TMDL development includes public review and comment and final approval by EPA.
Many waterbodies are impaired by more than one type of impairment. The most common types of impairments impacting the region relate to bacteria (including Enterococcus, E. Coli, and Fecal Coliform), non-native aquatic plants (including Fanwort, Eurasian Water Milfoil, Swollen Bladderwort, and others) and nutrients (including nitrogen, phosphorus, and biological indicators of nutrients). The table below shows the various types of water quality impairments and how many water bodies are impaired by each in the SRPEDD region.
Table 7. Water Quality Impairment Types.
Sources of bacteria to waterways include failing or malfunctioning septic systems, overflow from sanitary or combined sanitary-stormwater sewer systems, leaking sewer pipes, illegal sewer hookups, wildlife and pet wastes, and agricultural runoff.64 Non-native aquatic plants are introduced to Massachusetts waterbodies from elsewhere in the world on boating, fishing, and swimming equipment. Once introduced they can outcompete native plants and spread rapidly, impacting people’s ability to use the water, reducing circulation, degrading habitat, and threatening biodiversity.65 After non-native aquatic plants take over a waterbody, these plants can then easily be spread downstream or to other waterbodies in the region through wildlife or contaminated boats, kayaks, paddles, and fishing gear. Excess nutrients in waterways are primarily introduced from fertilizer use and animal waste (whether from pets, livestock, or wildlife). In turn, these nutrients may fuel algae and aquatic plant growth.
Stormwater runoff contributes to the introduction of each of these pollutants to waterways and is considered the primary source of water pollution in Massachusetts.66 Stormwater comes from rain and snowmelt that flows over land as runoff – often carrying loose debris, chemicals, and other potential pollutants that it picks up along the way. This runoff, along with any pollutants and debris in its path, eventually flows into a nearby river, stream, or pond. As a result, chemicals and fertilizers that are applied to lawns and farms, oil and gas spilled from cars, and potentially countless other pollutants unintentionally find their way to the water. This widespread contribution that cannot be pinpointed to a particular location, but collectively has significant impacts is called nonpoint source pollution.67
There are also point sources where we know pollutants are being introduced to waterways, such as sewer outfall pipes. Sanitary sewers carry wastewater from homes, businesses, and other types of facilities to wastewater treatment plants, where it is treated to remove bacteria and other harmful pollutants, before being released into a water body. Treated wastewater does contain nutrients that may contribute to nutrient impairments.68 Sewer systems may either be combined (where wastewater and stormwater runoff are conveyed and treated within one system), or separate (where wastewater and stormwater are kept and managed separately). In most of the region, the latter is the case; however, some older cities, such as Taunton, Fall River, and New Bedford, still have combined sewer systems. Combined systems are designed to discharge untreated sewage into waterways when excessive rainfall and stormwater overwhelm the system’s capacity. These outfall locations are called combined sewer overflows (CSOs).69
One CSO outfall in Taunton discharges into the Taunton River during large rain events, several in Fall River discharge into the Taunton River, Quequechan River, and Mount Hope Bay, and several in New Bedford discharge into the Acushnet River, New Bedford Harbor, and Clark Cove.
Many communities that aren’t served by sewer infrastructure manage their wastewater in private cess pool or septic systems. A cess pool is an outdated technology that uses an underground pit to settle solids out of wastewater, while doing little else to remove pollutants, allowing this contaminated water to flow into the ground, potentially impacting groundwater and nearby surface waters. Newer systems utilize septic tanks and leach fields to provide additional treatments that remove solids and bacteria from wastewater before it soaks into the ground.70 Conventional septic systems do not remove nutrients from
wastewater, which can pollute groundwater and nearby waterbodies; however, technological advancements are providing additional options for advanced treatment options that further protect groundwater. It is important to note that old and/or improperly maintained septic systems may also fail or become less effective over time, resulting in groundwater pollution. Thus, wastewater can also be a nonpoint water pollution source.
The majority of communities in the region manage stormwater separately from wastewater, in what is called a Municipal Separate Storm Sewer system, or MS4. MS4 systems collect stormwater runoff and convey it into a nearby waterbody, without the same level of treatment that a wastewater treatment facility would provide. The U.S. EPA and, locally, MassDEP regulate stormwater impacts on water quality and require MS4 operators (including municipalities) to take steps to reduce stormwater runoff and prevent the pollutants they carry from entering waterways. Areas that meet EPA’s “urbanized” designation (census blocks containing a density of 1,000 people per square mile or greater) are regulated under the Massachusetts Small MS4 General Permit.
Each community in the SRPEDD region has at least one qualifying census block; however, Rochester has received a waiver from the permit since the size of their regulated population is fewer than 1,000 people. Therefore, all communities in the SRPEDD region, with the exception of Rochester, are subject to MassDEP’s MS4 permit requirements and required to adopt certain “minimum control measures” (MCMs) to reduce stormwater pollution. These regulated “urbanized” areas are identified in the Designated Urbanized Areas Map. There are 243,132 acres in the SRPEDD region (47%) designated as urbanized. These areas are often also correlated with higher development rates and impervious cover, contributing to more local water quality issues.
Due to stormwater having such a large impact on water quality, climate change’s influence on rainfall and storm frequency will also have impacts on local water quality. Eleven (11) communities in the region (41%) identified water quality threats and recommended actions to address these impacts during their local Municipal Vulnerability Preparedness (MVP) planning efforts.
1. Water Quality Degradation: The region’s water bodies are highly vulnerable to a variety of pollutants, including bacteria, invasive aquatic plants, excess nutrients, and other contaminants. Major sources of pollution include malfunctioning septic systems, agricultural runoff, stormwater runoff, and combined sewer overflows (CSOs). These pollutants degrade water quality, threatening aquatic habitats, public health, and recreational opportunities. Nutrient overloading from fertilizers and animal waste contributes to harmful algal blooms and eutrophication, further impairing water quality and disrupting aquatic ecosystems. Stormwater runoff is the primary contributor to water pollution in the region, as it transports debris, chemicals, and other pollutants into water bodies, compounding water quality issues.
2. Habitat Fragmentation and Loss: Cold water fish habitats and diadromous fish populations in the region are at risk due to habitat degradation caused by rising stream temperatures, flow disruptions, and barriers, such as dams, that limit access to upstream habitats. Vernal pools and other critical aquatic habitats are also vulnerable to degradation from land use changes, loss of protective buffer vegetation, and pollution, all of which threaten biodiversity and undermine the resilience of these ecosystems.
3. Infrastructure Vulnerabilities: Aging and poorly maintained septic systems, along with combined sewer systems in cities, such as Taunton, Fall River, and New Bedford, are significant sources of water pollution, leading to untreated sewage discharges into local water bodies during storm events. Many communities rely on Municipal Separate Storm Sewer Systems (MS4s), which convey stormwater without adequate treatment, further contributing to water quality degradation. The prevalence of impervious surfaces in urbanized areas exacerbates these issues by increasing runoff volume and pollutant loads.
4. Climate Change Impacts: Climate change is expected to increase the frequency and intensity of rainfall and storm events, leading to greater stormwater runoff and worsening existing water quality challenges. This presents a significant threat to the region’s aquatic habitats and overall water quality.
5. Biodiversity and Ecosystem Connectivity: Habitat fragmentation resulting from development, barriers, and the degradation of aquatic buffers threatens the connectivity of habitats, which is essential for species migration and ecosystem resilience. The region’s aquatic biodiversity is at risk due to habitat loss, pollution, and the spread of invasive species, which can outcompete native species and disrupt ecosystem dynamics.
6. Inadequate Monitoring and Mitigation: Not all water bodies in the region are consistently monitored, leading to gaps in data collection and reporting that can hinder the effective identification and management of water quality issues. While some communities have recognized water quality threats and proposed mitigation actions, there is inconsistency in the prioritization and implementation of these actions, resulting in potential gaps in comprehensive water quality and habitat protection.
7. Impact on Vulnerable Communities: The degradation of water quality and aquatic habitats disproportionately affects vulnerable communities, particularly those that rely on these resources for drinking water, recreation, and cultural practices. Poor water quality and impaired habitats also pose significant public health risks, especially in areas with inadequate infrastructure and resources to address these challenges.
Best Practice 1: Implement and maintain effective septic, wastewater, and stormwater systems.
T2-T6: Regularly inspect and upgrade septic systems and wastewater infrastructure to prevent failures that lead to pollution. Prioritize the replacement of outdated systems, such as cesspools, with advanced treatment technologies that effectively remove pollutants before they reach groundwater and surface waters. In agricultural areas, promote the adoption of best management practices (BMPs) to minimize nutrient and pesticide runoff into nearby water bodies. These practices include establishing buffer strips, reducing fertilizer use, and implementing cover crops. Additionally, develop and maintain stormwater management systems that efficiently capture and treat runoff before it enters water bodies. Encourage the use of green infrastructure solutions, such as rain gardens, permeable pavements, and constructed wetlands, to reduce pollutant loads from stormwater.
Municipalities in the region can undergo wastewater and stormwater system assessments to identify high priority areas of outdated infrastructure and pollutant outfalls. Collaboration with state agencies and federal agencies, such as the MA DEP and EPA, and universities, such as UMASS Dartmouth, can assist in municipal efforts to establish protocols for water quality testing, and wastewater, sewer, and stormwater system assessments and upgrades. Municipalities can accomplish reductions of pollutants entering waterbodies through integrated systems planning and updates to public and private wastewater infrastructure. State and federal grants, such as the Community Septic Management Program, can support updates in infrastructure to improve resiliency and surface water quality. Municipalities with combined stormwater/ wastewater systems should move to separate systems to reduce CSOs.
Stormwater utilities can be set up to pay for the stormwater management needed to handle increases in stormwater runoff from climate change.
Agricultural runnoff can be addressed with support of financial and technical assistance programs from MDAR and the NRCS, such as the Climate Smart Agricultural Program, which assist farmers in implementing agricultural BMP that reduce runnoff.
Cape Cod faced significant challenges with nutrient pollution due to aging septic systems, which were contributing to water quality degradation in coastal waters. The Cape Cod Commission developed a Comprehensive Wastewater Management Plan (CWMP) to address this issue. The plan included upgrading and replacing outdated septic systems with advanced nitrogen-removing technologies, implementing municipal wastewater treatment systems in high-density areas, and restoring natural water flows to improve water quality. The plan also emphasized the use of green infrastructure, such as rain gardens and constructed wetlands, to manage stormwater and reduce nutrient runoff. This initiative significantly improved water quality and protected the region’s valuable aquatic habitats.
T1-T6: Prioritize the preservation and restoration of cold-water fish habitats by mitigating stream temperature increases caused by land use changes and flow interruptions. This effort involves maintaining buffer vegetation, removing barriers like dams, and adopting practices that prevent stormwater runoff from warming water bodies. Additionally, support initiatives to restore diadromous fish populations by eliminating barriers, such as dams, and improving fish passage to facilitate access to upstream habitats that are essential for their lifecycle.
Municipalities in our region can use the BioMap tool to identify waters supporting cold-water fish habitats and Critical Natural Landscapes, including Aquatic Buffers and Aquatic Core Habitats, within their jurisdictions. Critical Natural Landscapes support cold-water fish by maintaining low temperatures in waters, filtering pollution, providing native aquatic vegetation, and connecting freshwater bodies. Municipalities can update zoning regulations and work with local land trusts, such as Wildlands Trust, to protect and secure conservation restrictions on these key habitats. Master plans can outline strategies for habitat protection, including removal of invasive species and barriers that block fish passage, including outdated dams. Efforts to reduce pollutant loading into water bodies will also help in maintaining low temperatures. Municipalities can collaborate with state agencies and regional conservation groups to secure funding and technical support for restoration and water quality projects. The MA Division of Fisheries and Wildlife, the EPA, and the EEA provide grants and technical support in SE MA for cold-water fish habitat preservation, and towns can apply for assistance to support their habitat preservation endeavors. The EPA Southeast New England Program (SNEP) offers grants that help ensure a resilient aquatic ecosystems and sustainable communities. MDAR and the MA NRCS assist farms in reducing non-point source pollution, and municipalities can work with these groups to connect farmers with financial and technical assistance.
The removal of dams along the Mill River in Taunton, MA, is a landmark example of habitat restoration. The Whittenton Mill and Hopewell Mills Dams, which had been in place for over a century, were significant barriers to fish migration, particularly for species such as river herring and American eel. From 2005 to 2013, after years of advocacy by environmental groups and collaboration with state and federal agencies, these dames were removed, restoring over 30 miles of river habitat. The result was a dramatic recovery of diadromous fish populations, an overall improvement in water quality, and enhanced flood resilience for the surrounding communities. The project highlights the importance of removing barriers and restoring natural river flows to enhance aquatic habitats, providing long-term benefits for both ecosystems and human communities.
The removal of the Edwards Dam on the Kennebec River in Maine is a landmark example of habitat restoration. The dam, which had been in place for over 160 years, was a significant barrier to fish migration, particularly for species such as Atlantic salmon and American shad. In 1999, after years of advocacy by environmental groups, the dam was removed, restoring 17 miles of river habitat. The result was a dramatic recovery of diadromous fish populations and an overall improvement in the river’s ecological health. This project highlights the importance of removing barriers and restoring natural river flows to enhance aquatic habitats.
T1 – T6: Establish a comprehensive monitoring program to regularly assess the water quality of all significant water bodies in the region. Utilize this data to identify pollution sources, evaluate the effectiveness of pollution control measures, and guide future management actions. Develop and enforce Total Maximum Daily Load (TMDL) plans for water bodies that fail to meet established water quality standards, ensuring that pollutant levels are reduced to sustainable levels through targeted mitigation strategies.
Municipalities can work with local watershed coalitions, state agencies, and local research centers to establish comprehensive water quality monitoring programs and goals. SE MA watershed coalitions include the Taunton Watershed Alliance and the Watershed Action Alliance of Southeastern Massachusetts, and local research centers such as UMass Dartmouth, and the MassDEP all provide support in water quality programs. Through the MassDEP Division of Watershed Management-Watershed Planning Program (WPP)municipalities in MA can participate in surface water quality monitoring programs conducted under an EPA-approved, five-year programmatic Quality Assurance Program Plan (QAPP). Water quality monitoring initiatives and goals can be incorporated into municipal Master Plans, and coordination with regional agencies will help ensure implementation and reliable water quality data. Zoning regulations can be revised to better support water quality goals. Once a water quality monitoring program has been established municipalities can work with MassDEP to develop TMDL plans for impaired waters and use data to inform future land use and development decisions.
The Chesapeake Bay TMDL, often referred to as the “pollution diet,” is one of the most comprehensive water quality monitoring and regulation efforts in the United States. Established by the EPA in 2010, the TMDL aims to reduce nutrient and sediment pollution in the Bay by setting strict limits on nitrogen, phosphorus, and sediment loads. The plan involves extensive monitoring of water quality across the Bay’s watershed, with data used to guide pollution reduction strategies in six states and the District of Columbia. The TMDL has led to significant improvements in water quality and habitat restoration in the Chesapeake Bay.

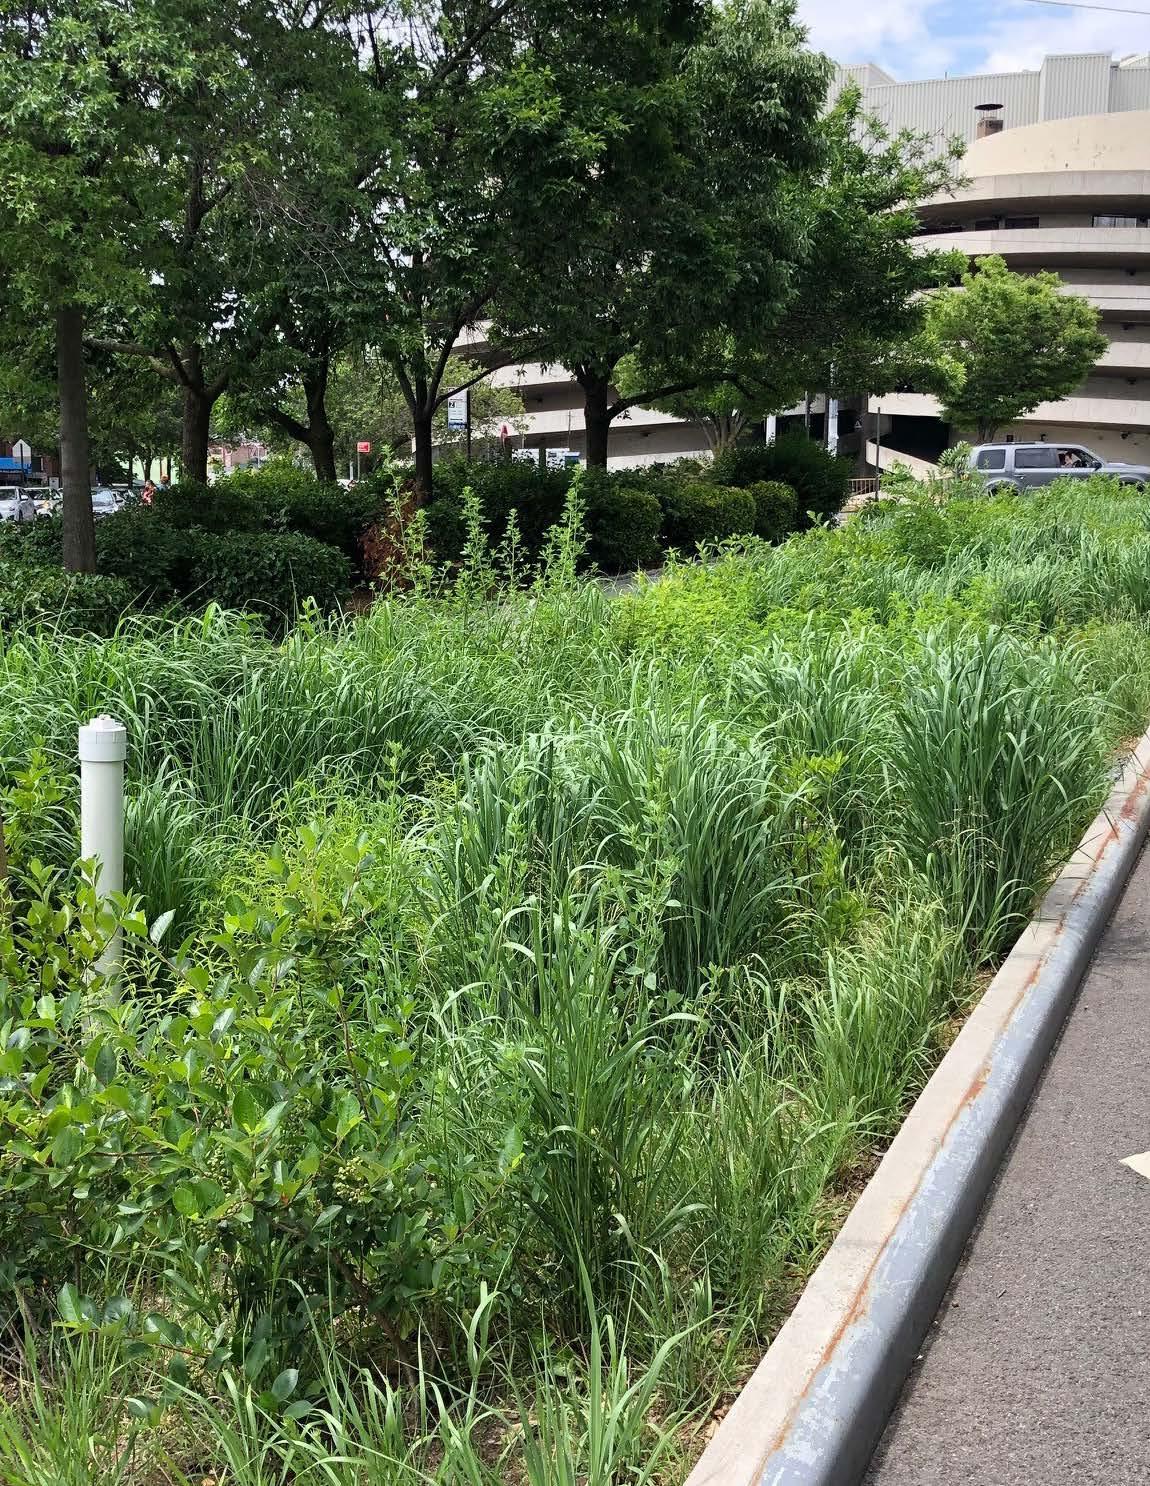
New York City’s Green Infrastructure Plan is a leading example of enhancing climate resilience through urban stormwater management. Launched in 2010, the plan focuses on reducing stormwater runoff by implementing green infrastructure solutions such as green roofs, rain gardens, permeable pavements, and bioswales. These systems help manage increased rainfall and storm frequency, which are expected to worsen due to climate change. The plan also includes upgrading existing stormwater infrastructure to handle larger volumes of water. This initiative has not only improved the city’s climate resilience but has also contributed to better water quality in surrounding rivers and bays.
T1-T6: Upgrade stormwater infrastructure to accommodate the increased rainfall and storm frequency anticipated due to climate change. Implement climate-resilient designs that can withstand more intense storm events and minimize the risk of water quality degradation. Promote the use of green infrastructure in urban areas to manage stormwater, reduce impervious surfaces, and mitigate the impacts of climate change on water quality and habitat connectivity.
Municipalities in our region should review existing stormwater and wastewater infrastructure to identify resilience of infrastructure to increased rainfall and extreme weather events. Pollution impacts from current infrastructure, including impermeable surfaces, should also be assessed. Financial assistance for stormwater and wastewater upgrades can be found through the MA EEA Water Resources Grants and Financial Assistance and other state and federal resources. In coastal areas, the MA Office of Coastal Zone Management (CZM), Coastal Resilience Grant Program offers funding for improvements in water infrastructure in coastal areas. Municipalities can leverage resources from state, federal, and non-profit organizations to remove outdated damns and culverts, improve sewage and stormwater systems, increase areas of permeable surfaces, and install green infrastructure in target zones. Impervious surfaces can be replaced with pervious materials such as pervious pavers and porous asphalt, and green infrastructure such as rain gardens, bioswales, and constructed wetlands can be installed to improve infiltration and reduce pressure on water infrastructure. Master Plans can incorporate a green infrastructure plan and upgrades in hydrologic infrastructure to improve community climate resilience.
T1-T4: Identify and protect critical habitats for aquatic species and vernal pools that are vital for maintaining biodiversity. Focus on maintaining and restoring natural buffers and corridors to ensure habitat connectivity and support the resilience of species that depend on these areas. Implement strategies to prevent the spread of invasive aquatic plants and other nonnative species that threaten local biodiversity. Educate the public on the importance of preventing the introduction of invasive species through activities like boating and fishing.
Municipalities in SE MA can use BioMap and work with the MA Division of Fisheries and Wildlife (MassWildlife) to identify critical habitats and natural corridors supporting local aquatic species. Waterbody restoration activities such as dredging, pollution control, establishment of native species, removal of invasives, and management of development through zoning regulations can improve quality of habitats and maintain corridors that are essential for biodiversity. Maintenance of buffer vegetation and connection of isolated habitats through barrier removal are essential efforts in protecting these critical areas. Collaborating with regional agencies for technical support and funding is essential in conservation efforts. Municipalities can work with local land trusts to secure conservation restrictions on vulnerable areas. Organizations such as Mass Audubon South East, Mass Rivers, and the Nature Conservancy also will support municipal efforts to protect critical areas of aquatic biodiversity. The MA EEA Division of Ecological Restoration, River Instream Flow Stewards (RIFLS), enables communities to document streamflow and investigate signs of flow alteration to restore more natural flow patterns. The MA Office of Coastal Zone Management (CZM) protects native species from population decline and extinction in coastal areas and provides funding for activities that support habitat and corridor restoration. Municipalities can leverage support for public education campaigns to prevent the spread of invasive species, especially in areas popular for fishing and boating
The Yellowstone to Yukon Conservation Initiative is a large-scale effort to protect and connect habitats across a vast region stretching from Yellowstone National Park in the United States to the Yukon in Canada. The initiative focuses on preserving biodiversity and maintaining ecosystem connectivity by protecting critical habitats, restoring wildlife corridors, and reducing barriers, such as roads and development. This approach has been successful in maintaining healthy populations of species such as grizzly bears, wolves, and elk, while also ensuring the resilience of the region’s ecosystems in the face of environmental changes.

T2-T6: Ensure that water quality and habitat protection initiatives address the needs of vulnerable communities, particularly those that rely on water bodies for drinking water, recreation, and cultural practices. Actively engage these communities in planning and decision-making processes to address public health risks and ensure equitable access to clean water and healthy habitats.
Environmental justice communities are more likely to live in areas susceptible to flooding and sewage overflow events; climate-related shifts in hydrological processes heighten these vulnerabilities. Municipalities should consider the effects of floods, CSOs, and poor water quality on EJ communities and prioritize resiliency efforts in these communities in Master Planning and capital improvement initiatives. Many EJ communities are located in areas with aging water and sewage infrastructure and municipalities should prioritize infrastructural changes in these areas. Community outreach, public platforms, and surveys should be provided for EJ communities to express their concerns. Municipalities should also address public health risks by providing education and resources to EJ communities, ensuring equitable access to clean water and healthy environments. The EEA Municipal Vulnerability Preparedness (MVP) Grant Program assists municipalities in making critical changes to support EJ communities in a climate context.
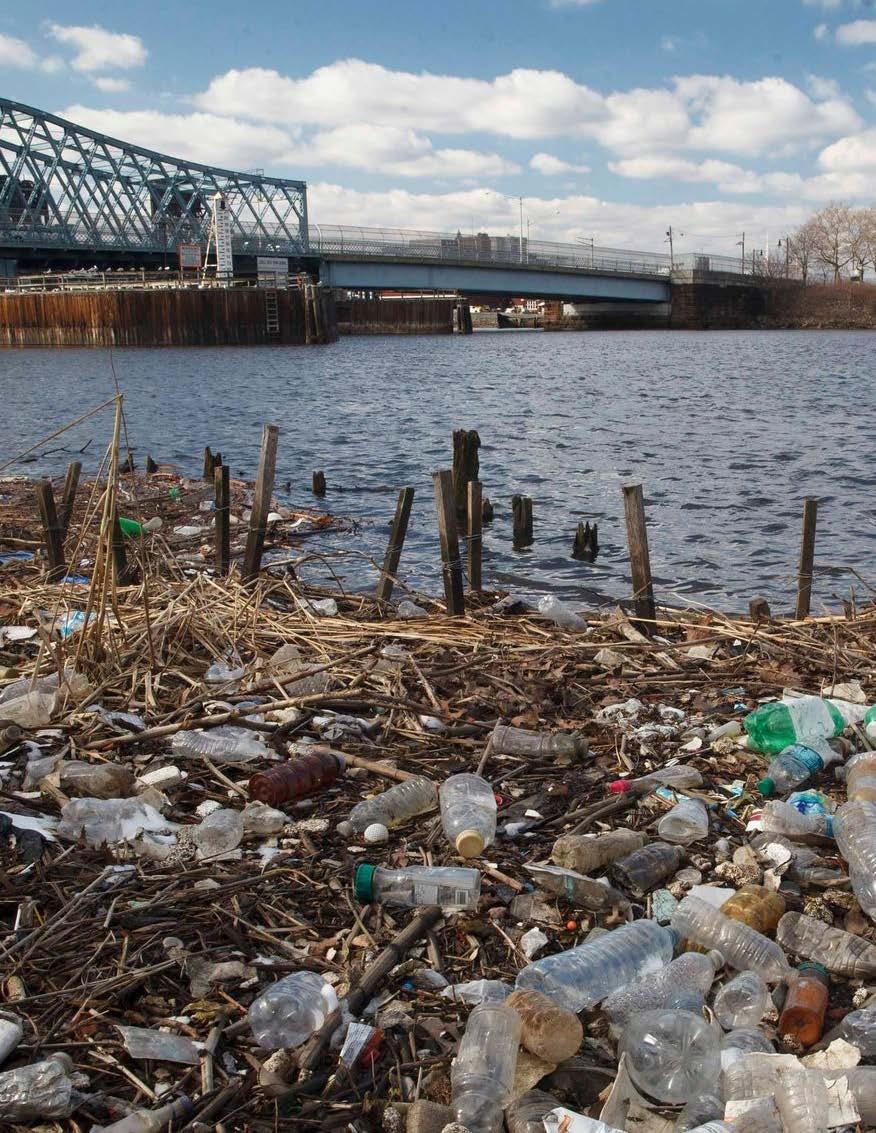
Newark, New Jersey, has been working to address environmental justice issues related to the Passaic River, one of the most polluted rivers in the United States. Historically, low-income and minority communities along the river have borne the brunt of pollution impacts. The Passaic River cleanup effort, led by the EPA in partnership with local organizations, includes removing contaminated sediments and restoring riverbanks. Importantly, the project prioritizes community engagement, involving local residents in the planning and decision-making processes. This ensures that the needs and concerns of vulnerable communities are addressed, and that they benefit from the restoration of a cleaner and healthier river.

T2-T6: Launch educational campaigns to raise awareness among residents about the importance of water quality and the actions they can take to reduce pollution. Focus on reducing nonpoint source pollution, maintaining septic systems, and preventing the spread of invasive species. Encourage communities to participate in Municipal Vulnerability Preparedness (MVP) programs and prioritize actions that address local water quality threats. Provide resources and support for implementing identified MVP actions, such as green infrastructure projects and regulatory updates.
Municipalities in SE MA can foster community engagement and education through supporting local communities in participating in the MVP program and other water quality initiatives. MVP actions should be publicized at public events and functions, and municipalities should generate social media campaigns and create posters and local radio advertisements to help foster community engagement. Local community leaders can be encouraged to rally their constituents and participate in MVP efforts. Schools, hospitals, religious institutions, and other community centers can engage in efforts to increase public participation and awareness for local and regional water quality initiatives.
The Puget Sound Starts Here campaign is a regional public education initiative aimed at raising awareness about the importance of water quality and the steps residents can take to protect Puget Sound. The campaign focuses on reducing nonpoint source pollution, such as stormwater runoff, and promoting actions like proper disposal of household chemicals, maintenance of septic systems, and prevention of invasive species spread. The initiative has been highly successful in engaging communities across the Puget Sound region, leading to increased participation in local environmental programs and improvements in water quality.
1 “Water Science School” United States Geological Survey (USGS).
2 UCI, 2017; from the State Hazard Mitigation Plan, page 4-148.
3 United States Department of Agriculture, Massachusetts Natural Resource Conservation Service (2021). Farmland Soil Classes of Massachusetts. https://efotg.sc.egov.usda.gov/references/public/MA/ FarmlandSoilClassesofMassachusettsFINAL.pdf
4 ibid.
5 ibid.
6 Massachusetts Department of Agriculture (MDAR). 2021. Massachusetts Agriculture Snapshot 2021. https://www.mass.gov/doc/snapshot-of-maagriculture-presentation/download
7 Massachusetts Department of Agriculture (2017). Massachusetts Agricultural Snapshot. https://www.mass.gov/doc/snapshot-of-ma-agriculture-presentation/ download. 2024 Press Release https://www.mass.gov/news/healey-driscolladministration-declares-october-massachusetts-cranberry-month. Plymouth town is also an area of top cranberry acreage in the state.
8 ibid.
9 USDA (2024). 2021 Census of Agriculture, by County. https://www.nass.usda. gov/Publications/AgCensus/2022/Full_Report/Volume_1,_Chapter_2_County_ Level/Massachusetts/
10 USDA 2022 Census of Agriculture. State Profiles. https://www.nass. usda.gov/Publications/AgCensus/2022/Online_Resources/County_Profiles/ Massachusetts/cp99025.pdf, UMASS Center for Agriculture, Food and Environment. Sales in Counties 2017. https://ag.umass.edu/resources/ massachusetts-agricultural-data/market-value/sales-in-counties
11 Mass Audubon. Losing Ground 2020. https://www.massaudubon.org/ourwork/publications-resources/losing-ground/losing-ground-2020-key-findings
12 ibid.
13 Massachusetts Executive Office of Energy and Environmental Affairs. (2023). ResilientMass Plan. 2023 Massachusetts State Hazard Mitigation and Climate Adaptation Plan. https://www.mass.gov/doc/resilientmass-plan-2023/download
14 Mass Audubon. Losing Ground 2020.
15 EEA & MEMA. Massachusetts State Hazard Mitigation and Climate Action Plan. 2018, pages 4-143 to 4-146.
16 ibid.
17 US Government Accountability Office. 2020. K-12 Education: School Districts Frequently Identified Multiple Building Systems Needing Updates or Replacement
18 Natural Resources Defense Council. Occupational Heat Safety Standards in the United States
19 The estimated number of high-risk workers in the NRDC estimates is total employment from six industries with the highest average heat-related deaths per year: Agriculture; Mining, Quarrying, and Oil and Gas Extraction; Construction; Manufacturing; Administrative and Support and Waste Management and Remediation Services; and Transportation and Warehousing.
20 SRPEDD. Comprehensive Economic Development Strategy 2023-2028. 2023.
21 EEA & MEMA. Massachusetts State Hazard Mitigation and Climate Action Plan. 2018, pages 4-160.
22 “Heat Island Effect” EPA Resource Page
23 “Ambient (outdoor) air pollution.” World Health Organization.
24 “Heat and health.” World Health Organization.
25 “Urban Nature for Human Health and Well-Being.” USDA.
26 “Physical activity.” World Health Organization.
27 “Parks and Improved Mental Health and Quality of Life.” National Recreation and Parks Association.
28 “Urban Nature for Human Health and Well-Being.” USDA.
29 “Health Benefits of Contact with Nature.” Washington State Recreation and Conservation Office.
30 As was the case with Taunton’s Mill River in 2005; see “Massachusetts Town Fears Dam Break.” CBS News, and “Going with the flow, 10 years after Taunton’s dam crisis.” Wicked Local.
31 “State of the Coast: South Coast.” On the Coast.
32 “Rising sea levels challenging New Bedford hurricane barrier.”
Commonwealth Beacon
33 “Facing the Future.” On the Coast.
34 “State of the Coast.” 2022. On the Coast.
35 ibid.
36 ibid.
37 “Wareham.” On the Coast.
38 “State of the Coast.” 2022. On the Coast.
39 “Salt Marshes.” On the Coast
40 The Crapo Hill Landfill is physically located in the Town of Dartmouth and accessed through the New Bedford Business Park; it is operated by the Greater New Bedford Regional Refuse Management District, serving New Bedford and Dartmouth.
41 Based on the CY2023 Recycling and Solid Waste Survey and MassDEP’s formula for calculating recycle rates: Residential Recycling Rate = Residential Tons Diverted (recycled + composted + hazardous products collected) Residential Tons Generated (diverted + disposed).
42 Massachusetts 2050 Decarbonization Roadmap, page 72.
43 Clean Energy and Climate Plan for 2050, page 93.
44 USDA Forest Inventory and Analysis Fiscal Year 2016 Business Report.
45 MassAudubon Value of Nature Factsheets - Forests.
46 Clean Energy and Climate Plan for 2050, page 93.
47 “Current Forest Health Threats.” Massachusetts Department of Conservation and Recreation.
48 “Climate Change Pressures in the 21st Century.” USDA Office of Sustainability and Climate.
49 “Amplifying feedback loop between drought, soil desiccation cracking, and greenhouse gas emissions.” Farshid Vahedifard, C Clay Goodman, Varon Paul, and Amir AghaKouchak. Environmental Research Letters
50 “Soil Quality Indicators: Physical, Chemical, and Biological Indicators for Soil Quality Assessment and Management.” USDA Natural Resources Conservation Service.
51 “Global Soil Health Indicators and Assessment.” Food and Agriculture
Organization of the United Nations
52 Doran, J.W. and T.B. Parkin. 1996. Quantitative indicators of soil quality: a minimum data set. In J.W. Doran and A.J. Jones, eds. Methods for Assessing Soil Quality. SSSA, Inc., Madison, Wisconsin, USA.
53 “Farmland Soil Classes of Massachusetts.” USDA
54 “Soil Data Access (SDA) Prime and other Important Farmlands.” USDA
55 “What Ponds, Reservoirs, and Watersheds?” City of Fall River
56 MassWildlife. N.d. “Coldwater Fish Resources.”
57 Division of Marine Fisheries. N.d. “Diadromous Fisheries Project.”
58 MassWildlife. 2023. “Shad stocking underway on the Taunton River.”
59 MassWildlife and The Nature Conservancy. 2022. “BIOMAP: The Future of Conservation in Massachusetts.”
60 Commonwealth of Massachusetts. 2022. “314 CMR 4.00: Massachusetts surface water quality standards.”
61 MassGIS. 2022. Surface Water Quality Standards (314 CMR 4.00), 2013 [dataset]. https://www.mass.gov/info-details/massgis-data-surface-waterquality-standards-314-cmr-400-2013
62 MassDEP. 2022. “Draft Massachusetts Integrated List of Waters for the Clean Water Act 2022 Reporting Cycle.” Prepared by Massachusetts Division of Watershed Management Watershed Planning Program.
63 MassDEP. N.d. “Integrated List of Waters & Related Reports.”
64 Massachusetts Department of Public Health. N.d. “Frequently Asked Questions About Monitoring Water Quality at Beaches.”
65 Massachusetts Department of Conservation and Recreation. N.d. “Managing Aquatic Invasive Plants.”
66 Massachusetts Rivers Alliance. N.d. “Water Pollution.”
67 MassDEP. N.d. “Nonpoint Source Pollution.”
68 Taunton River Watershed Alliance. N.d. “Water Quality Monitoring Program.”
69 MassDEP. N.d. “Sanitary Sewer Systems & Combined Sewer Overflows.”
70 MassDEP. N.d. “Septic Systems/Title 5 Glossary.”

Social resilience is built upon strong social networks and interconnectedness that give community members a sense of belonging and enhance quality of life. Social resilience requires the presence of essential human services and strong support systems that anchor communities; these networks become particularly vital during a disaster or crisis. Social resilience is enabled through stable housing, supportive services, high-quality public healthcare, and engaged governance. In the context of the SRRP, social resilience is defined by the equitable and accessible provision social support systems, emergency response, and a stable governmental system.
Best Practice #1: Support career-connected learning initiatives.
Best Practice #2: Invest in professional development for teachers and educators.
Best Practice #3: Invest in modern educational facilities.
Best Practice #1: Remove barriers to housing production in key areas.
Best Practice #2: Support vulnerable populations through targeted programming.
Best Practice #3: Increase supportive housing initiatives to help alleviate homelessness.
Best Practice #4: Retrofit older housing to increase energy efficiency and safety.
3.1-3
Best Practice #1: Advance health equity measures that reduce health care disparities.
Best Practice #2: Bolster and invest in regional healthcare workforce development
3.1-4
Best Practice #1: Conduct research on food access issues for vulnerable communities.
Best Practice #2: Provide incentives for urban and rural micro-farm and garden initiatives.
Best Practice #3: Assist in improving social, financial and transportation services for vulnerable populations.
SRPEDD’s 2023 CEDS identifies educational attainment and workforce development as one of the economic vulnerabilities in southeastern Massachusetts. Compared to the state, both Bristol and Plymouth Counties have a higher percentage of high school graduates and a lower percentage of individuals with advanced degrees. This relatively lower educational attainment can affect economic competitiveness for the region and limit income potential for households.
For residents 25 and over, Acushnet has the highest proportion of individuals with a high school diploma (or equivalency) at 40%, while Mansfield has the lowest at 20%. Mattapoisett has the highest proportion of those whose most advanced education attainment is a bachelor’s degree at 33%, while Fall River has the lowest percentage at 11%. Marion has the highest proportion of those whose who obtained a graduate degree at 22%, while New Bedford has the lowest percentage at 4%.
Over the last 10 years, trends show school-age populations have decreased. Out of 22 school districts, only 4 (Attleboro, Bridgewater-Raynham, Somerset-Berkely, and Seekonk) saw growth over the last 10 years. The school district with the largest decrease was the Old Rochester School District (Marion, Mattapoisett, and Rochester) at a 41% decrease in school enrollment. The district with the most growth was Bridgewater-Raynham at 5.5%. This speaks to larger trends at the state and national levels, where households are having fewer children, household size is decreasing, and the median age is rising steadily.
In terms of graduation rates, the Freetown-Lakeville School District has the highest percentage at 98%, while Wareham has the lowest at 74%.
Table 1. Educational Attainment Trends, Population 25 years and over, 2022).1 Municipality
Though the number of students is decreasing, districts must contend with the rising cost of educating their students. In Massachusetts, districts spend an average of $20,509.25 per student. Five communities rank above the State average: Mattapoisett, Wareham, Fall River, New Bedford, and Marion. Based on in-district expenditures, Mattapoisett spends the most per student at $24,007.47, while Berkely spends the least in the region at $14,874.17 per student. Out of all of the school districts, Mattapoisett ranked number 4 out of 308 and Berkely ranked 228th.
In summary, current trends show a distinct decline in the number of students in most of the school districts of the region. In combination with rising costs, communities must consider the best use of resources, how to maintain and modernize aging facilities, and the potential of school closures. External pressures exacerbate these challenges, as the number of trained teachers for all levels of education continues to fall due to stagnant wages and the legacy of the COVID 19 epidemic. These factors should be considered for the long-term stability of education in the region.
1. Education Attainment: Lower levels of educational attainment can lead to stalled innovation, stagnant incomes, lack of competitiveness with other regions, and inability to diversify the regional economy.
2. Shrinking Enrollment: Declining school enrollment may lead to lower investment in safe and modern facilities, loss of qualified staff, and missed opportunities to adopt innovative curricula that prepare the region’s children to be qualified participants in the workforce.
3. Aging Facilities: Some school facilities are located in flood prone areas, lack modern climate control, and need maintenance to make them safe and productive learning environments. These facilities also often serve as shelters during emergency events.
Investing in primary and secondary education is crucial for the development of a skilled workforce, social progress, and economic growth. To create resilient education systems, local government should prioritize early childhood education to build strong foundations, invest in teacher training and competitive salaries, improve school facilities, technology, and resources, and address the needs of marginalized and disadvantaged students. Municipalities should establish consistent school funding plans that channel additional resources to marginalized students.
T2-T6: Work with schools to integrate WBL activities into the existing curriculum. This can be done by creating partnerships between businesses and local schools or colleges. Fostering relationships between schools and businesses will create more opportunities for internships and apprenticeships.
Career-connected learning initiatives support skill-based programs that directly link young people to education and career opportunities. These programs serve as a bridge between classroom learning and real-world work experiences to prepare students for careers after school. Raise the Bar: Unlocking Career Success was created under the Biden/Harris Administration to enhance access to high-quality training programs and Work-Based Learning (WBL) opportunities in career fields that are in high demand. The COVID-19 pandemic significantly reduced the availability of WBL, particularly in industries that traditionally employ young workers and support earn-and-learn educational models, such as Registered Apprenticeship. WBL provides young people with opportunities to earn income and connect with professionals in the labor market. Local educational authorities can use the Work-Based Learning Toolkit to develop strategies and guidelines to create effective programs.
T2-T6: Collaborate with local universities and colleges to offer courses, certifications, and degree programs for existing teachers within the region.
Professional development allows teachers to stay updated with the latest teaching methods and educational trends to ensure that they can adapt to changing student needs. Effective professional development helps teachers integrate the newest findings about what works for students by equipping teachers with updated strategies for engaging students. Investing in teachers’ postgraduate studies is a great way to increase professional development throughout the region by offering financial incentives for teachers pursuing postgraduate degrees through scholarships and grants. Municipalities throughout the region should partner with local universities to provide financial support for teachers who want to pursue postgraduate degrees. Tomorrow’s Teachers Scholarship Program is designed to address the teacher shortage in Massachusetts by offering up to $25,000 per year toward college education for those enrolling in a baccalaureate program or post-baccalaureate coursework with the intention of obtaining a teaching license for K-12 public schools. The Massachusetts Professional Development Grant for Educators offers teachers virtual training to educate students on personal finance.
Bridgewater State University provides advanced certification programs, seminars, and workshops for teachers looking to advance their professional development. These courses are made to help teachers improve their teaching abilities and keep up with the most recent developments in education. BSU offers flexible learning choices like evening and online sessions to meet the demands of working educators. This facilitates teachers’ pursuit of higher education without interfering with their duties as professionals. BSU works with the local school districts to provide professional development programs that address the requirements of the teachers working in those districts. BSU makes professional development more accessible for educators by providing a range of financial aid alternatives through grants and scholarships.
T2- T6: Utilize available federal and state funding programs for improving educational infrastructure in outdated schools throughout the region. Pursue incremental tax revenue through economic development and ensure a portion of this revenue supports local schools.
Funding Opportunities: Supporting America’s School Infrastructure (SASI) Program, Bipartisan Infrastructure Law Program, Full-Service Community Schools (FSCS) Grants, Massachusetts School Building Authority (MSBA), Massachusetts Department of Elementary and Secondary Education (DESE).
Well-designed, modernized school facilities create a positive learning environment for students and teachers. Quality infrastructure facilitates better instruction, leading to improved academic performance and reduced dropout rates. Up-to-date facilities ensure student safety and health with modernized ventilation by improving air quality in classrooms. Building new facilities in locations away from flood plains and other natural hazards is important to keeping students and teachers safe; additionally, these facilities often serve as emergency shelters, so it is essential these schools are in geographically desirably locations.
Municipalities throughout the region should prioritize investing in educational facilities that serve undeserved communities to bridge gaps in educational opportunities. Modern facilities follow accessibility standards to ensure all students with physical disabilities can access all areas of the school per Americans with Disabilities Act (ADA) requirements. Many schools in the region are old and need updates to ensure the safety of students and teachers.
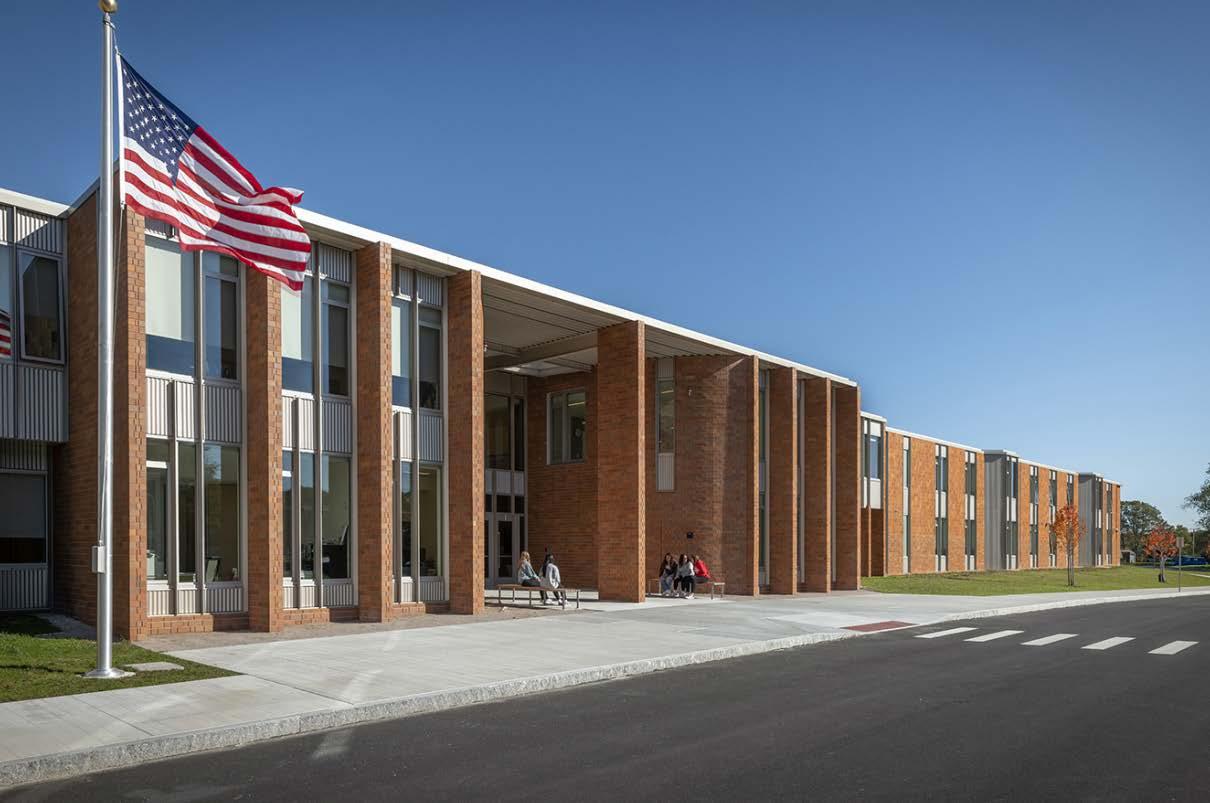
Municipalities also should look to generate and allocate funding to outdated infrastructure, such as heating/cooling systems, roofs and electrical to prevent hazards. MassDevelopment offers tax-exempt bond financing for capital projects, including school facilities. The Massachusetts School Building Authority provides funding for capital improvement projects for Massachusetts public schools and recently awarded Westport a $37.4 million Grant for a new combined middle/ high school. Importantly, municipalities can also strategically increase their commercial and industrial tax-base through active economic development; a portion of these new revenues should fund new educational facilities and other long-term initiatives.
The amount of affordable housing available across the region varies. As of July 2024, only Fall River, Mansfield, New Bedford, Norton, Plainville, Raynham, and Norton are above the State’s 10% Subsidized Housing Inventory (SHI) requirement. Additionally, the towns of Dartmouth, Marion, Middleborough, and Wareham are above 7%. While these numbers may seem substantial, they likely overestimate the number of deed-restricted affordable units that are present throughout the region. As described within 760 CMR 56, all 100% of the units built in a new rental development will count on a municipality’s SHI if 25% of them have deed restrictions. Therefore, many communities’ SHI percentages likely show a much higher number of true “affordable units” than are actually available.
Limited supply is also constraining affordable options for individuals and families across the region. Many consider a healthy housing vacancy rate2 to be somewhere between 5-8%,3 which helps ensure there is a diverse set of options for those seeking new housing opportunities. In Plymouth and Bristol Counties, these rates are 1.31% and 0.49%, respectively - lower than the statewide rate of 1.6%, and reflect a highly competitive market with few options. This scarcity, along with an increasing presence of investors in the Massachusetts housing market,4 make it incredibly difficult for individuals, young families, older adults, and other vulnerable populations to purchase a home or find a safe, affordable place to rent.
At the extremes, these supply issues (coupled with a lack of social safety nets) can push individuals and families into homelessness. Housing authority and nonprofit staff across the SRPEDD region have cited in interviews many instances where applicants seeking affordable housing, even in emergencies, may not be eligible for assistance. Additionally, there is an abundance of red tape that can make it difficult for an applicant to find stable housing. At the statewide level, the most common reason for emergency assistance application denial was not completing a full application.5
Table 2. SHI numbers by Municipality.
Currently, 8 of SRPEDD’s 27 member communities have some number of families enrolled in the Commonwealth Shelter Program, described in the table below.
Table 3. Number of Families Enrolled in the Commonwealth Shelter Program as of July 25th, 2024.6
Community
Number of Families Enrolled in the Commonwealth Shelter Program
Taunton Between 51 and 200.
Fall River Between 51 and 200.
Raynham Between 51 and 200.
Plainville Between 51 and 200.
New Bedford Between 1 and 50.
Attleboro Between 1 and 50.
Norton Between 1 and 50.
Middleborough Between 1 and 50.
There are several non-profit agencies and organizations working with people experiencing homelessness in the SRPEDD region, most notably Father Bill’s and MainSpring. Southeastern Massachusetts is also supported by the South Shore Continuum of Care (CoC), the Attleboro/Taunton/Bristol County CoC, the Fall River CoC, and the New Bedford CoC. CoCs are municipal or regional planning organizations that coordinate responses and strategies to homelessness throughout their designated geographic area.
In addition to these factors, much of the region’s housing is aging, as are its residents. An individual’s housing needs are likely to change as they get older due to changes in their income, mobility, household structure, and so forth. This poses a concern for individuals and families who wish to continue to live in their community as they get older, a goal known as “aging in place.” Many communities will need to evaluate how to support their older adults, either by finding avenues to provide new senior housing options or offering mechanisms and resources to support retrofitting existing homes so that they are “aging-ready.” As a note, some of the features necessary to make a home “aging-ready,” according to the U.S. Census Bureau’s report on the housing needs of older adults,7 are:
• A step-free entryway;
• A bedroom and full bathroom on the first floor;
• At least one bathroom accessibility feature;
• Additional aging-accessible elements that may be useful include:
» Sink handles or levers instead of knobs
» Handrails or grab bars in the bathroom
» Built-in shower seats
» Housing features (such as thermostats, countertops, electrical outlets, etc.) that are at wheelchair accessible heights
These considerations are also important for individuals with disabilities who have mobility, cognitive, or sensory issues.
Beyond physical accessibility, these older homes will need to be retrofitted to become more resilient to heat and cold as the climate continues. Older homes are more likely to have poor insulation, outdated appliances, and unsafe features. Ensuring these issues are remedied will be critical to maintaining an accessible, livable housing stock for the Southeast.
1. High costs of living: Housing has become increasingly expensive in recent years, with Massachusetts having the second highest cost of living in the nation, only behind Hawaii, in 2024.8 The 2023 median home sale prices in Bristol and Plymouth Counties were $445,000 and $550,000, respectively.
2. Limited supply: Vacancy rates are at historic lows in Massachusetts,9 limiting the supply of housing and creating highly competitive markets that are difficult for vulnerable individuals and families to navigate.
3. Housing mismatch: Southeastern Massachusetts has a high percentage of large, single-family homes that may not meet the needs of older adults, recent graduates, and individuals living alone. This housing mismatch can make it difficult for these groups to find adequate housing.
4. Aging stock: The housing stock in the SRPEDD region is aging, leading to safety and energy efficiency issues that can be difficult to remedy without proper programming and assistance.
Resilient housing options must be safe, affordable, and accessible. For the SRPEDD region, achieving this will require incorporating new zoning mechanisms to promote a diverse array of housing options and increasing housing safety nets to prevent individuals and families from falling into unstable housing situations or homelessness.
T2-T3: Smaller suburban and rural communities should focus on identifying areas appropriate for housing development/zoning changes, and what concerns may be relevant throughout the planning process, especially those related to natural resource protection. Upon identifying these areas, these communities should work to gain community support and gather resident feedback through a robust public engagement campaign prior to proposing changes.
T4-T5: Larger suburban communities and communities with dense downtowns should focus on inventorying their existing housing stock and outlining gaps that may limit resident options. These gaps can include a lack of smaller “missing middle” housing options and limited housing options for aging in place. These communities should then pursue the appropriate housing production mechanisms to close the gaps in residents’ needs.
Increasing affordability throughout the Southeast begins with removing barriers to housing development. At its minimum, this entails beginning a proactive planning process, usually through the development of a Housing Production Plan. Several communities within the region are actively planning for housing or recently completed Housing Production Plans.
Table 4. Housing Production Plan Status by Municipality.
Municipality Status
Expiration Date
Acushnet None NA
Attleboro None NA
Berkley None NA
Carver Expired – Updating 06/04/2014
Dartmouth Expired – Updating 02/14/2024
Dighton Expired – Updating 02/17/2019
Fairhaven None NA
Fall River None NA
Freetown None NA
Lakeville Approved 04/03/2029
Mansfield Approved 07/26/2028
Marion Approved 06/13/2028
Mattapoisett Expired 01/27/2016
Middleborough Expired – Updating 06/15/2021
New Bedford None NA
North Attleborough Complete – Approval Required NA
Norton None NA
Plainville None NA
Raynham Expired 03/10/2015
Rehoboth Expired 11/16/2020
Rochester None NA
Seekonk None NA
Somerset None NA
Swansea Complete – Approval Required NA
Taunton None – Planning NA
Wareham Approved 06/13/2027
Westport Expired – Updating 07/26/2017
Beyond planning, communities can pursue zoning changes to allow higher density housing and a wider variety of housing types, including medium and large multifamily. These changes should be supported through a robust public process to increase buy-in; they should also target key areas suitable for new growth or redevelopment. These “key areas” are usually away from natural resources, aquifers, and habitats, and can support new infrastructure, foster walkability, and provide quality of life features.
There are numerous options a community can pursue to encourage new housing production or redevelopment that suits its needs. These include:
• Increasing the diversity of allowed uses: Allowing more diverse residential uses can increase the supply of housing and provide more options for individuals and families. This can include allowing small multi-family (2-4 units), medium multi-family (4-20 units), and large multi-family housing (20+ units), as well as permitting accessory dwelling unit (ADU) development.
• Increasing the maximum allowable density of residential uses: Density is often framed in a negative light, however, higher density housing coupled with strategic conservation initiatives can both increase unit supply while preserving key natural resources. This can include implementing smart growth zoning (such as Chapter 40R/40Y Smart Growth Zoning Overlays), Open Space Residential Design (OSRD) zoning, and Cottage Cluster zoning. This can also be accomplished by reducing unnecessarily high parking minimum requirements, which would otherwise create new impervious surfaces and limit the overall percentage of the lot that can be used for residential development.
• Removing permitting barriers: Requiring special permits for certain residential uses naturally discourages their creation. This is especially common for small- and medium-sized multi-family developments and OSRD/ Cottage Cluster zoning. Cities and towns can encourage the development of these uses by removing special permit requirements.10
• Implementing inclusionary zoning: Inclusionary zoning bylaws require developers to incorporate affordable housing into proposed projects. These bylaws usually specify a percentage of the total number of units required to be affordable, and either apply at a certain unit threshold or to the entirety of a project, regardless of the number of units.
Due to recent amendments to the Zoning Act (specifically M.G.L. c. 40A § 5) via Chapter 358 of the Acts of 2020, all of these zoning changes can be adopted by a simple majority, rather than a two-thirds majority.11
Table 5. Zoning changes eligible for a simple majority vote.12
Zoning Change
Allows for multi-family housing or mixed-use developments “as of right” in an eligible location.
Allows for open space residential development as of right.
Reduces the parking requirements for residential or mixed-use development under a special permit.
Permits an increase in the permissible density of population or intensity of a particular use in a proposed multi-family or mixed-use development that requires a special permit.
Changes dimensional standards such as lot coverage or floor area ratio, height, setbacks, minimum open space coverage, parking, building coverage to allow for the construction of additional residential units on a particular parcel or parcels of land
Provides for the transfer of development rights or natural resource protection zoning in instances where the adoption of such zoning promotes concentration of development in areas that the municipality deems most appropriate for such development, but will not result in a diminution in the maximum number of housing units that could be developed within the municipality.
Adopts a smart growth or starter home districts in accordance with section 3 of Chapter 40R of the General Laws.
Allows by special permit accessory dwelling units in a detached structure on the same lot.
Allows accessory dwelling units, either within the principal dwelling or within a detached structure on the same lot, as-of-right.
T3-T5: Suburban communities should focus on the cost and availability of starter homes and small apartments. Through regional partnerships, these communities can work to form first-time homebuyers’ programs that offer low-to-no interest loans and grants to for first-time buyers. Additionally, these communities should look at the age of their existing affordable housing stock and identify maintenance needs that can be supported through programs like CDBG and CPA funding.
T6: The largest and most dense urban communities should examine their demographics, housing stock, and affordability, with emphasis on maintaining housing stability and preventing displacement. Communities with high rates of evictions and foreclosures should focus their efforts on increasing emergency housing assistance resources with targeted outreach to the most vulnerable residents, and implementing necessary tenant protections to ensure rental housing is free from hazards, well-maintained, and accessible.
Some of the most vulnerable demographics include low-income individuals, those with limited English proficiency, those living with disabilities or severe mental illnesses, minorities, individuals living alone (especially older adults), and veterans. These populations experience higher rates of housing instability, predatory lending practices, and housing instability or homelessness. By implementing new programming specifically targeting these groups, communities can help bridge the gap and ensure everyone has access to stable, affordable, and safe housing.
Some examples of programs communities or regional entities can utilize to support their most vulnerable residents include:
• Foreclosure/Eviction Prevention Programs: Foreclosure and Eviction Prevention Programs provide emergency assistance and confidential counseling to homeowners and renters facing foreclosure or eviction. Municipalities can apply for funds to support emergency assistance or partner with local non-profits.
• First-time Homebuyers Programs: First-time Homebuyer Programs provide first-time prospective homebuyers financial and educational assistance in the form of informational classes, special loan options, and down payment and/or closing cost assistance. Municipalities are best equipped to provide these services when partnering with regional or state entities, banks, or other lenders to assist first-time buyers, as internal funding resources and capacity can be limited.
• Housing Rehabilitation and Repair Programs: Some communities utilize Community Preservation Act funding or Community Development Block Grant (CDBG) funding to provide low interest, long-term loans to eligible borrowers so they can make improvements to properties with code violations, repair or replace heating systems, remove hazardous materials, or replace windows. This allows low- and moderate-income owners of rental or owner-occupied multi-family housing projects to maintain their units in livable, safe, and sanitary conditions without having to take an equity loan on the property.
• Emergency Housing Assistance Programs: Emergency Housing Assistance Programs help individuals or families find shelter in the event of an emergency. These programs are usually operated by the State or nonprofits.
Typically, these programs are supported by State and Federal funding. Some of the main providers of funding for these programs include the Executive Office of Housing and Livable Communities, the Executive Office of Health and Human Services, and the U.S. Department of Housing and Urban Development.
T2-T4: Small communities should evaluate the prevalence of homelessness in their areas through data collection, with the understanding that people who experience housing insecurity and homelessness do so in complex ways. This can include surveying for individuals and families who may be living in their car, “couch surfing,” living in a motel/hotel, or living outside. After evaluating the extent of the need, these communities should work with their CoC and local non-profits to connect residents in need to supportive services and shelter.
T5-T6: Larger communities with known unhoused populations should foster community-based partnerships and resource-sharing to help provide resources to individuals and families in need. Emphasizing housing first, these communities should work to support the production of medium- and long-term supportive housing at varying scales and with the necessary degree of wraparound services.
T2-T6: Municipalities should implement initiatives to assist community members with rebuilding networks of care that may have been disrupted due to housing insecurity or homelessness. Housing is one of many resources necessary for people who have experienced homelessness or housing insecurity to achieve stability. For example, municipalities can partner with organizations that offer support group services. Support groups connect people with shared experiences and shared skillsets, allowing them to build community and develop strategies for economic stability. Municipalities can support organizations that facilitate groups with coordinating free meals, childcare, transportation, etc. to ensure they are accessible for all people interested in participation.
T2-T6: Municipalities can support methods to meet residents’ immediate needs through mutual aid initiatives. Mutual aid refers to “solidarity not charity,” and aims to expand local community connections to meet each other’s needs.13 Examples of mutual aid that can support those transitioning into long-term housing include coordinating carpool, food preparation, childcare networks, sharing skills, building trust with neighbors, emotional support, and more.
To prevent and end homelessness, increasing access to emergency and longterm housing options that meet the needs of those experiencing housing insecurity is essential. For example, the “Housing First” approach is a model that removes barriers to stable housing options for those who may otherwise be denied housing opportunities due to requirements for sobriety, employment, or other factors. These programs are trauma-informed, allowing individuals to access supportive services quickly, voluntarily, and in conjunction with counseling, job training, and more.14 Importantly, Housing First programs can and should be tailored to meet the unique needs of each person experiencing homelessness, such as families, survivors of violence, migrants, and other groups.
The state of Massachusetts is a “right to shelter” state for families or pregnant people without children who meet certain requirements. Currently, many shelters across Massachusetts are near or at capacity.15 Governor Healy announced the Commonwealth’s Emergency Assistance capacity was met at 7,500 families in the fall of 2024.16 Additionally, the Coalition for Homeless Individuals and service providers in Massachusetts report shelter staff shortages, shelter demand increases “on average by 24% over the past year,” and difficulties finding long-term housing options for individuals, families and migrants.17 To address the challenges within the current emergency housing system, the Healy administration seeks to assist families with transitioning out of shelters to long-term housing options, as well as connecting immigrants with “work authorizations, English classes, and [placements] into jobs.”18 Within the Southeastern Massachusetts region, communities can use planning tools, community building, mutual aid, and other initiatives to increase housing options and services appropriate for those transitioning out of emergency shelter systems.
The Veterans Transition House (VTH) is a non-profit in New Bedford that provides transitional and permanent housing alongside wraparound supportive services to homeless veterans across the region.19 Founded in 1990 by a group of Vietnam veterans, the VTH has nearly 100 housing units across the city, with a recent $10 million campus expansion on Purchase Street and Pleasant Street. The VTH has been lauded as a model for the state by the Executive Office of Veterans’ Services secretary and has helped the city achieve zero on-street veteran homelessness.20
T2-T6: Municipalities should work to participate in statewide programs such as Green Communities, as well as surveying residents to determine home heating fuel type, appliance/window age, and energy costs. Using these findings, communities can evaluate the degree of resident interest in programs supporting renewable uptake and upgrades to fully electric HVAC systems and appliances. Staff can then work to match residents to rebate programs and other resources they may be eligible for.
Older homes are a particular concern for climate resilience and safety. This is due to the presence of older building materials that pose health hazards (including asbestos and lead), older home heating and cooling systems that rely on natural gas or oil, and energy efficiency issues caused by drafty windows, aging appliances, and insufficient insulation. As highlighted in the State’s Decarbonization Roadmap, retrofitting these older homes will require upgrading to electric heat pumps, installing new energy efficient appliances, transitioning to induction cooktops, and installing rooftop solar. These changes will occur over decades, giving municipalities time to plan for these efforts and to develop programming that supports their residents. This topic is discussed in detail in the Diversify Local and Regional Energy Portfolios section of this report.
Access to health care plays an integral role in the region’s approach to resilience strategies. Resilient health care systems meet community needs, educate broadly on regional health-related risks, and support timely and effective responses to community health crises. When health care services lack in one or multiple of these areas, community members are at an increased risk of experiencing poor health. Simply put, the resilience of a region’s health care systems is directly related to the region’s social resilience. These services, in addition to other robust and accessible public health services, have the potential to maintain a thriving, equitable, and supported population that can meet its basic health needs. The SRPEDD region must continue to prioritize the resilience strategies of these services, alongside other environmental, economic, and societal stressors, to ensure its communities can lead long, healthy lives.
In April 2006, the Commonwealth of Massachusetts passed one of the nation’s most ambitious and successful health care reform policies (Chapter 58 of the Acts of 2006, An Act Providing Access to Affordable, Quality, Accountable Health Care).21 The Act sought to provide near-universal health care access through multiple levers; the one-of-a-kind law expanded Medicaid services in the state, directed changes in the current health insurance market, and made it a requirement that all adults within the state had health insurance, unless there were no affordable insurance options available.
Soon after the health care reform was passed, Massachusetts became the nation’s most insured state regarding health insurance, and it continues to maintain that title today.1 Uninsured rates in children decreased dramatically, as the percentage of uninsured was more than halved following the reform. Coverage disparities among racial and ethnic groups narrowed following 2006, and individuals with greater health care needs, including individuals with
disabilities, young adults, low-income populations, and women experienced gains in insurance coverage at a faster rate than the general state population. This reform has led to overall improvements of health within the state (particularly among low-income populations), decreases in mortality rates, and increases in individuals reporting experiencing excellent or very good health at greater rates.
While Bristol and Plymouth Counties are geographically similar neighbors, their population demographics vary considerably. Broadly, Plymouth County skews older, wealthier, and with fewer uninsured residents, individuals with disabilities, individuals experiencing poverty, and non-English speaking individuals. Bristol County is slightly more populated, has two major urban hubs across the Southeast (Fall River and New Bedford), and has a greater proportion of vulnerable populations. The following tables outline the specific rates across multiple demographic characteristics:
Table 6. Basic demographics for Bristol and Plymouth Counties.
Table 7. Demographics indicating vulnerability for Bristol and Plymouth Counties.
At any time over the past twelve months, Southeastern Massachusetts has the highest rate of uninsurance rates in the state at 4.9% (compared to the 2.4% statewide average). 19.6% of residents reported financial concerns when paying
medical bills over the past twelve months (compared to the 12.5% statewide average). Similar concerns resulted from affording prescription drugs, with 9.6% of residents reporting difficulties (compared to the 7.9% statewide average).
Over the past ten years, multiple disruptions in normal health care services impacted the Southeastern Massachusetts healthcare ecosystem. Steward Health Care, a Dallas, Texas-based health care corporation, is the nation’s largest private, for-profit hospital chain, with multiple locations across the Southeastern Massachusetts region. In 2014, Steward’s Quincy Hospital permanently closed its doors, citing long term struggles to remain financially healthy, including losses of up to $20 million a year and limited in-patient volume, leading to bed vacancy levels upwards of 80 percent.22 Steward’s nearby Norwood Hospital experienced a flooding incident in June 2020 and closed as a result. This closure was intended be temporary; however, the facilities have not reopened (as of September 2024). Signature Brockton Hospital temporarily closed in February of 2023 following a system electrical fire, yet the facility has been unable to reopen its emergency room over a year later. Later that year, in May of 2023, Quincy-based Compass Medical filed for bankruptcy – the action came almost immediately after a sudden closure, in which 70,000 patients had their care services discontinued.23 This past December, Steward announced another regional facility closure at the New England Sinai Acute Long-Term Care and Rehabilitation Hospital in Stoughton, MA, citing $22 million in operational cost losses.24
On May 6, 2024, Steward Health Care filed for Chapter 11 bankruptcy.25 This decision came with a motion by Steward Health Care to restructure its debt to continue service provision across the US and, specifically, eight hospitals in Massachusetts. In January, it was revealed that Steward had not been paying their Massachusetts-based rents in full for multiple months and had not paid many of its vendors and contract workers. On August 16, 2024, it was revealed that Lifespan (Rhode Island’s largest hospital group who will be changing its name to Brown University Health later this year) would assume ownership of two Steward Hospital Massachusetts locations: Morton Hospital in Taunton and St. Anne’s Hospital in Fall River. Lifespan will receive financial assistance from the state of Massachusetts to afford the transition costs associated with new ownership.26 A hearing, which was supposed to take place on August 22, was delayed, highlighting another barrier in the transition of service provision. In court, Steward had reportedly filed a complaint against its landlord, citing
interference in the hospital sale process.27 While the future of Steward Health Care appears uncertain, communities will face negative consequences should multiple hospital closures begin.
Further disruptions in services can impact access, affordability, the livelihoods of health care workers, and reliable care for patients across the region. The Executive Office of Health and Human Services (EOHHS) provides regional ratings to hospital systems regarding their capacity constraints. The Southeastern Massachusetts Health and Medical Coordinating Coalition (HMCC) region has a current rating designation of Tier 3 – such a rating indicates, “high risk for or active constraints on hospital capacity.”
More than 1.1 million individuals call Bristol or Plymouth Counties home; consequently, Southeastern Massachusetts is comprised of a large and diverse population that requires tailored, competent, and comprehensive care. Most communities in Southeastern Massachusetts have average incomes that fall below the statewide average, with New Bedford and Fall River (the region’s two largest urban centers) having two of the state’s three lowest average incomes. Multiple social vulnerabilities impact individual and community-level access to health care and directly impact quality of life and positive health outcomes. Bristol County communities are older than average and often experience higher rates of disability, unemployment, uninsurance, and households receiving SNAP benefits (16% compared to the statewide 11.6%). These communities also have lower rates of broadband access and per capita income. Plymouth County communities are similarly older than average, have higher percentages of Black or African American residents, and have slightly higher rates of unemployment and slightly lower per capita income than the statewide average.
Workforce trends also continue to be constrained. Workforce shortages lead to difficulties in accessing consistent care and complications in transitioning across care settings. With very few exceptions, both Bristol and Plymouth County have fewer clinicians per capita than the rest of Massachusetts across several specialties. Coming out of the COVID-19 pandemic, employment across care settings within both counties was 4-6% below pre-pandemic levels, while the rest of the state has slightly rebounded and improved over the last few years. Similarly, across the two counties, employment in nursing facilities was more than 20% below pre-pandemic levels.
1. Aging Population: As Southeast Massachusetts’ population continues to skew older, a resilient health care system will need to be responsive to the unique and complex health needs of an aging population.
2. Proximity to Health Care Services: As regional health care hospitals and other services continue to face financial and administrative constraints, continued hospital closures will make the travel length to and from these services longer, and, therefore, more life- threatening.
3. Limited Healthcare System Capacity: Even where community members are close to health care services, system capacities remain strained. Health care systems continue to experience disruptions to services through limited workforce numbers and affordability of health care provision.
Consistent and accessible health care services should provide individuals with the resources and medical expertise necessary to address health-related concerns, avoid negative health impacts, and improve overall quality of life outcomes. Resilient health care systems are sensitive and responsive to community needs, educated on the health risks and social determinants of health that impact community health outcomes, and equipped with the tools and structures necessary to adapt to, and overcome, interruptions in the normal provision of health care services.
T2-T3: Smaller towns and more rural communities should work with regional healthcare service providers to structure transportation services that can help community members, especially at-risk individuals (older adults, youth, and those without access to a personal vehicle), access all necessary healthcare services. Smaller communities can also work with their Boards of Health and Council on Aging to identify and reach disadvantaged community populations that may experience increased barriers to healthcare access.
T4-T6: Larger communities, specifically those with regional healthcare settings, must ensure that all healthcare providers are trained in providing culturally sensitive and competent healthcare services. A well-informed staff can help reduce barriers to healthcare access by understanding the needs of diverse populations. Further, these communities can work alongside healthcare professionals, as well as non-profit organizations and other community-based organizations, to produce a community health needs assessment to identify and improve local and regional blind spots related to healthcare access and provision. These practices can help reduce disparities experienced by local community members.
Southeast Massachusetts is one of the most diverse regions in the state. Similarly, communities across the region experience varying levels of good health. The set of vulnerabilities listed above all impact health equity and the advancement of positive health outcomes. When a regional health care system is responsive to the unique needs of the communities it serves, there can be an improvement in positive health outcomes and an associated improvement in health equity and reduction in negative health disparities. Barriers to accessible and responsive healthcare services that impact health equity can include:
• Limited reliability of transportation options to and from healthcare service destinations, especially for individuals without access to a personal vehicle;
• Limited non-English language proficiency of healthcare service providers;
• Perceived or actual costs associated with seeking healthcare services, especially among economically disadvantaged populations;
• Personal and community-level stigma related to seeking healthcare services; and
• Personal and historical instances of healthcare discrimination, especially among BIPOC and LGBTQ+ populations.28
Regional healthcare services must, then, promote accessible, culturally competent healthcare practices that understand individual and systemic barriers to quality healthcare access. Through the provision of transportation services, bolstered language translational services, and staff-wide cultural competency trainings, healthcare systems can ensure proper service provision for diverse populations.
37. Activists listen to a speaker during a rally organized by the Health Equity Compact outside of the Massachusetts State House. (Craig Walker/The Boston Globe)
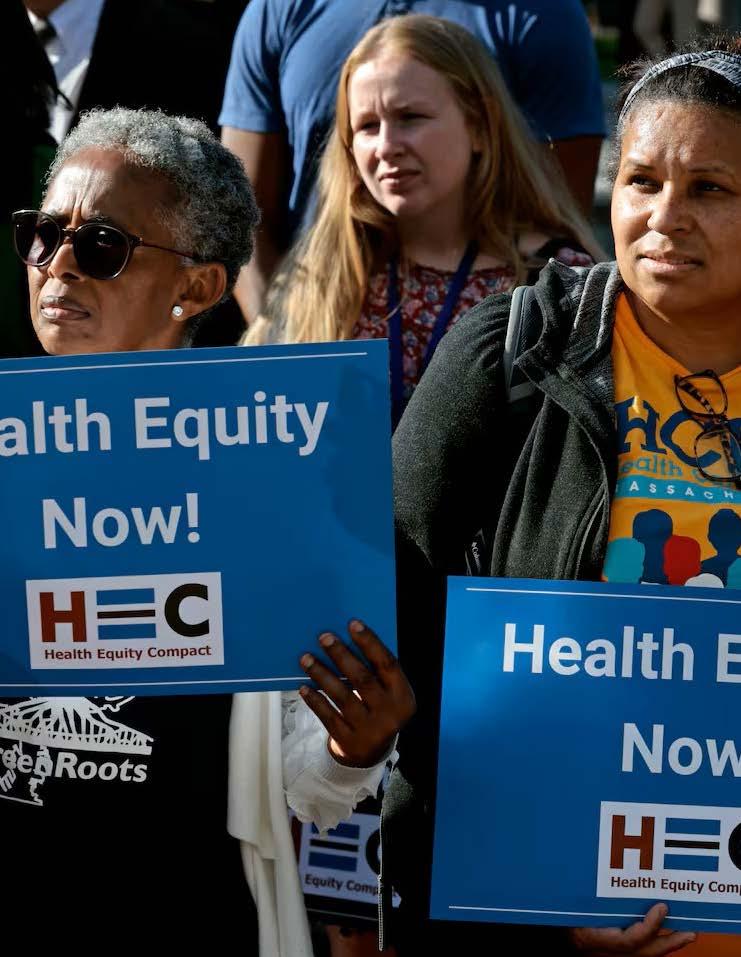
The Massachusetts Health Equity Compact (HEC) has a vision of the “elimination of systemic barriers and creation of new structures and processes that will lead to equitable healthcare and health outcomes for all in Massachusetts,” and a mission to, “realize bold statewide policy and institutional practice changes that center racial justice and health equity.”29 Their policy objectives center around the six following priority areas:
• Governance
• Measurement and Accountability
• Workforce
• Healthcare Payment and Delivery Reform
• Coverage and Access
• Social Determinants of Health
On September 20, 2023, the Massachusetts HEC urged the Massachusetts government to favorably adopt the Act to Advance Health Equity. The Act seeks to advance a multitude of health-related objectives, such as addressing the root causes of inequity, requiring standardized health equity data metrics, reducing the cost burden of medications for chronic conditions, and requiring reimbursement parity for telehealth services for primary and chronic care. The provisions outlined in the Act would help to lessen the disparities experienced by communities across Southeastern Massachusetts and improve overall health outcomes.
T2-T6: Municipalities must work to promote a diverse and resilience healthcare workforce. The American Hospital Association provides multiple structures to help support the healthcare workforce, including:
• Addressing worker well-being and burnout prevention strategies;
• Supporting behavioral help through promoting healthcare services, deconstructing workplace stigma, and building a culture of psychological safety; and
• Prioritizing workplace violence prevention by ensuring a physically and psychologically safe work environment, focusing on prevention by addressing vulnerabilities, and supporting providers experiencing trauma.30
These practices, alongside the provision of employment benefits that make for a competitive employment opportunity, can help to structure and sustain a healthcare workforce that is both supported and prepared to meet the needs of themselves and their patients.
The regional workforce providing health care services to local communities must feel supported in meeting community needs, and the number of practicing individuals, across a variety of specialties, must be able to meet those needs of the communities they serve. After the COVID-19 pandemic, healthcare providers have struggled to manage record workforce shortages and capacity setbacks.
During the pandemic, the Baker-Polito administration allowed recent and soon-to-be nursing school graduates to practice nursing under proper supervision as they awaited their administrative, exam, and licensure process. It was found that this provision helped meet the record-high capacity constraints during the pandemic that continue to persist today. Bill H.3613 seeks to make this measure permanent, which had an expiration date of March 31, 2024.31 In late March, the Bill was reported to the committee on Health Care Financing and a decision on its permanence was extended to July 3, 2024. No new action updates have been provided on the standing of H.3613. In July of 2023, there were still an estimated 19,000 job vacancies across Massachusetts hospitals alone, indicating an immediate need to enact responsive workforce development strategies.32 This Act serves as one of many legislative options available to the state to help bolster, and retain, healthcare talent that can help to reduce workforce shortages and advance health outcomes across the region.
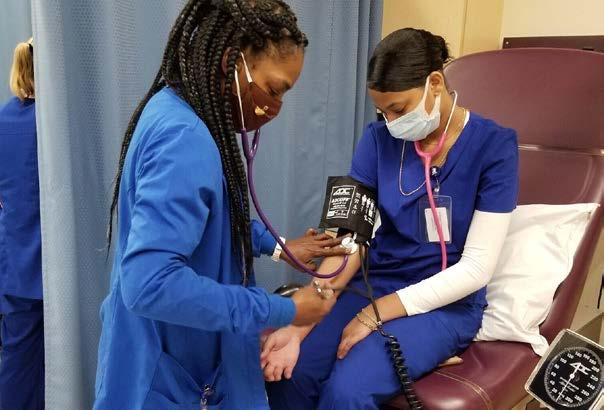
Food insecurity, as defined by the USDA Economic Research Service (ERS), is “[...] the limited or uncertain availability of nutritionally adequate and safe foods or limited or uncertain ability to acquire acceptable foods in socially acceptable ways.”33 Food security is built on four pillars: availability, access, utilization, and stability. Individuals must have sufficient and consistent access to nutritious food of the right dietary mix (quality) to be considered food secure. Hunger, malnourishment, and nutrition-related diseases are often linked to patterns of food insecurity. Poor nutrition significantly contributes to chronic conditions like cardiometabolic disease (CMD) and cardiovascular disease (CVD).34 Addressing food insecurity is crucial in addressing these health problems. The ERS uses household surveys to assess food insecurity, gathering data on experiences of hunger, inability to afford food, and lack of access to nutritious food.
Income disparity is the primary driver of food insecurity in the United States. Although various socioeconomic and demographic factors play a role, lowincome households are disproportionately affected. In 2022, about 37% of households below the poverty line were food insecure.35 Low-income populations are the most likely to experience food insecurity and high levels of food insecurity,36 while other demographic factors may compound food insecurity including single head-of-household status, size of household, age, and race. Demonstrating the correlation between food access and income,

Low-income populations face numerous barriers to food security, including inconsistent access to utilities (such as gas and electricity), medical care, time constraints, transportation, and limited funds for food purchases. These barriers make it challenging to afford and prepare balanced meals. Fresh produce, for example, often requires more frequent shopping trips, more preparation time, and greater financial resources.37 Fresh produce, for example, often requires more frequent shopping trips, more preparation time, and greater financial resources.
Both low-income rural and low-income urban populations experience high levels of food insecurity.38 However, barriers to food access differ between these areas due to variations in food acquisition methods and available markets. Within the SRPEDD region, low-income urban areas like Taunton, New Bedford, Fall River, and Attleboro face significant challenges. Taunton, for instance, has the third highest grocery gap in Massachusetts. While low-income rural areas are less common in the SRPEDD region, a substantial portion of Carver falls within this category. Map 1 illustrates the SRPEDD region’s low-income urban and rural areas. Health issues related to food insecurity may differ in rural vs urban areas based on locationally specific barriers, and other demographic factors.
Compounding these challenges are demographic factors that further influence food access. Nationally, single mothers, Black and Hispanic households, and single fathers experience the highest rates of food insecurity.39 The ERS report Household Food Security in the United States in 2021 highlights the following groups as experiencing significantly higher rates of food insecurity than the national average:40
• Households with children headed by a single female (24.3%)
• Households with Black (non-Hispanic) reference persons (19.8%)
• Households with Hispanic reference persons (16.2%)
• Households with children headed by a single male (16.2%)
• Women living alone (13.2%)
Regional, national, and global crises, particularly within the context of climate change, can exacerbate food insecurity. During the Covid 19 pandemic, Massachusetts saw household food insecurity rates double. Additionally, grocery costs in the state increased by 6.6%, the sixth highest in the nation according to a Consumer Affairs Study. Rising food prices disproportionately impact low-income individuals and families who spend a larger portion of their income on necessities. Climate change further contributes to food insecurity through unpredictable weather patterns and economic disruptions to the food supply. Vulnerable populations, such as low-income women and children, face heightened food access challenges during crises. The 2022 baby formula supply shortage and 17.5% price increase exemplify this vulnerability.
In terms of support for communities facing food insecurity in the SRPEDD region, there are federal, state, regional and local initiatives are working to support vulnerable populations by improving food access. Federal programs that work to improve food security include the Supplemental Nutrition Assistance Program (SNAP), National School Lunch Program (NSLP), and the Women, Infants, & Children Nutrition Program (WIC). SNAP assists low-income families in addressing food insecurity by providing a supplement to their grocery budget so they can afford nutritious food essential to health and well-being. NSLP is a program that offers low-cost or free nutritionally balanced meals to kids who qualify in public and nonprofit private schools. Some NSLP programs even send kids home with meals to feed their families. WIC provides pregnant women,
breastfeeding women, and children under 5 with an additional supplemental grocery budget to SNAP benefit. WIC also supplies nutritional education, breast feeding support, and health care referrals to those that qualify. As single women with children face the highest levels of food insecurity, this program is essential for supporting food access in the SRPEDD region. However, only 61% of women and children who qualify for WIC in Massachusetts receive benefits.41
State-level programs supporting food access in Massachusetts include the Healthy Incentives Program (HIP), the Massachusetts Emergency Food Assistance Program (MEFAP), statewide food security plans such as the MA Local Food Action Plan, and Healey-Driscoll food access grants. HIP is administered through the Massachusetts Department of Transitional Assistance and offers a monthly put-back of $40 to $80 on EBT cards when buying local produce from farmers’ markets, farm stands, and Community Supported Agriculture (CSA) operations that are verified HIP vendors. However, statewide only 6-8% of SNAP recipients use HIP, although 100% could, and in 2024 the state pulled back on its HIP funding by almost 50%. MEFAP provides funds to emergency food providers to ensure they offer a consistent supply of fresh local produce and nutrient dense foods.42 The MA Local Foods Action Plan was accepted by the MA Food Policy Council in 2015 and aims to strengthen food systems and food security in the Commonwealth. Also, the Healey-Driscoll administration approved $8 million in funding in 2024 to strengthen local food systems to address food insecurity through grant-funded projects. Several of these projects are aimed at supporting food access in the SRPEDD region (see Table 8 below).
Table 8. Healey-Driscoll Administration Food Access Grants Programs in the SRPEDD Region.
Municipality
Lakeville
Marion
New Bedford
New Bedford
Recipient
Elliot Farm, LLC
Marion Institute
Grant/Program
Massachusetts Food Venture Program
Local Food Policy Council Program
Groundwork Southcoast Urban Agriculture Program
Coastal Foodshed
Local Food Purchase Assistance Plus
In addition to state and federal efforts, there are also many local and regional initiatives to support food security in Massachusetts. Addressing food insecurity in the SRPEDD region requires a deeper understanding of the specific challenges faced by the region’s food-insecure communities. While national trends provide a starting point, further research is needed at the regional level. Although ERS household food security data isn’t available for the SRPEDD region, some countylevel data exists. The Southeastern Massachusetts Agricultural Partnership (SEMAP) conducted a food security study in 2015 based on data from Bristol, Norfolk, and Plymouth counties. Based on the SEMAP 2015 Food System Assessment, food security data available for Bristol, Norfolk, and Plymouth counties was compiled and some results are shown in the figure below.
As an effort to address issues of food security in the SRPEDD region, SRPEDD is conducting a Healthy Food Access Plan, which is a study on food insecurity trends in the SRPEDD region through the SE MA Metropolitan Planning Organization’s (SMMPO’s) FFY25 Unified Planning Work Program. This study aims to identify the needs of food-insecure populations, determine barriers to food security, and suggest transportation adaptations to support healthy food access. By engaging the public, incorporating core public health principles, analyzing GIS data, and collaborating with regional coalitions, the SRPEDD Healthy Food Access Plan will provide valuable insights and recommendations for enhancing food resilience and equitable access through integrated transportation investments and practices.
Southeastern Massachusetts Agricultural Partnership (SEMAP). (2015). Food System Assessmment Infographic.
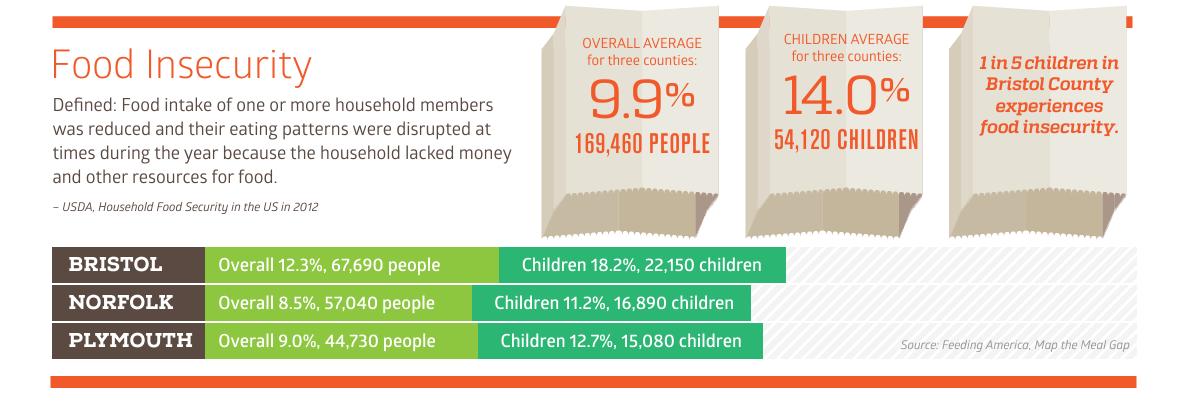
1. Food insecurity in urban centers: Low-income urban residents in the SRPEDD region face increased risks of nutrition-related diseases due to food insecurity. Barriers include limited resources, mobility restrictions, difficulty accessing support programs, and distance from HIP vendors. These barriers contribute to demographic disparities in nutrition-related health outcomes. Women and children in these areas are particularly vulnerable due to specific dietary needs and unique challenges in accessing and preparing healthy meals.43 While the COVID-19-related expansion of the NSLP has aided women with school-aged children, those with younger children remain at risk.44
2. Food insecurity in rural areas: Similar to urban centers, low-income rural residents experience disparities in food access and nutrition-related health issues. Seniors and single mothers face heightened risks due to financial constraints, mobility limitations, and reduced ability to acquire and prepare nutritious food. While low-income rural tracts are less prevalent than low-income urban tracts in the SRPEDD region, Carver has a significant low-income rural population. Additionally, food insecurity can exist within high-income rural areas, hidden within census data that presents income averages per block.
Improving access to fresh produce and nutritious meals in low-income areas is crucial for reducing health disparities and promoting food security. Increasing availability of fresh produce and a selection of seasonal local crops in areas of high food disparity can improve community health and resilience. Supporting local agriculture, community gardens, farmers’ markets with HIP vendors, and programs that incentivize fresh produce purchases with SNAP benefits increases accessibility of nutritious foods. Enhancing social and financial services and expanding transportation options can assist in relieving financial barriers and improve mobility to markets with fresh produce. Also, providing targeted support to vulnerable populations such as single mothers, seniors, Black and Hispanic populations, and single fathers, strengthens food access resilience.
Best management practices (BMPs) should be tailored to the specific needs of low-income urban and rural communities in the SRPEDD region. Research is needed to identify the levels of food insecurity and unique barriers faced by these populations in Southeastern Massachusetts. Collaborative efforts among government agencies, non-profits, businesses, and individuals are essential for addressing systemic food equity problems, promoting sustainable food systems, and bolstering regional food security. Schools, community centers, and online platforms can play a vital role in raising awareness about nutrition and healthy eating.
T2 – T6: Gather data on various demographic groups within low-income urban and rural populations in the SRPEDD region to assess food access issues. This includes determining the prevalence and severity of food insecurity and identifying specific barriers. Conduct household surveys in low-income communities in New Bedford, Fall River, Attleboro, Taunton, and Carver to understand their unique experiences and challenges. Use this information to develop targeted interventions and best practices. Encourage municipalities to establish food access committees that collaborate with regional networks (e.g. the Southeastern MA Food Security Network (SMSFN), SEMAP, and the Coastal Food Shed), local universities (e.g.UMass Dartmouth Leduc Center for Civic Engagement), and the MA Department of Agriculture (MDAR) to conduct a region-wide research project on food access gaps and equity issues.
Understanding the specific food access challenges faced by diverse communities in the SRPEDD region is crucial for developing effective solutions. While national trends provide a foundation, local and regional data is essential for identifying appropriate best management practices (BMPs). Community outreach and surveys can help identify unique barriers faced by food-insecure communities in the region.
Best Practice 2: Provide incentives for urban and rural micro-farm and garden initiatives.
T2-T6: Provide funding and financial incentives, administrative aid, technical assistance, and policy adaptations (e.g. for zoning updates for reduced permitting requirements) to support the development and maintenance of urban and rural micro-farm and gardens in community spaces. Connect individuals interested in growing food with financial and technical assistance. Incentives can take the form of grants, subsidies, reduced permitting requirements, or affordable loans to support the development of community gardens, urban micro-farms, educational opportunities for new farmers and gardeners, installation of raised beds at community centers, and other local food production efforts. Gear efforts towards supporting vulnerable communities. Collaborate with the Massachusetts Department of Agriculture (MDAR), SMSFN, and Farm-to-Institution New England (FINE) to conduct outreach and provide funding for community-based food production and distribution projects.
Increasing food production within vulnerable communities can help address systemic inequities and market failures that contribute to food insecurity. Initiatives to support members of vulnerable communities in developing microfarm and garden operations can assist in narrowing the food security gap. Financial incentives, such as grants and subsidies, and administrative and policy support can encourage the development of urban micro-farms, community gardens, farm-to-school initiatives, repurposing of vacant lots for food production, and creation of raised beds at hospitals, schools and community centers, (as suggested in the Resilient Lands Initiative: Expanding Nature’s Benefits Across the Commonwealth) which increase access to nutritious food for low-income communities.
The Food Project is a non-profit organization that engages youth in urban farming to increase access to healthy food in underserved communities. Their model, which utilizes sustainable practices on both urban and rural farms, has successfully increased food access while empowering youth through agricultural education and community engagement. Their model has been replicated by programs throughout the country.
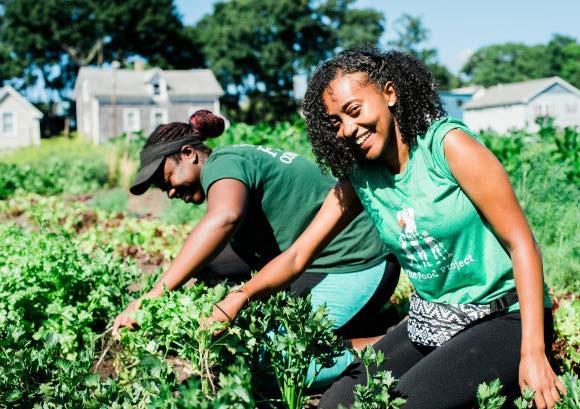
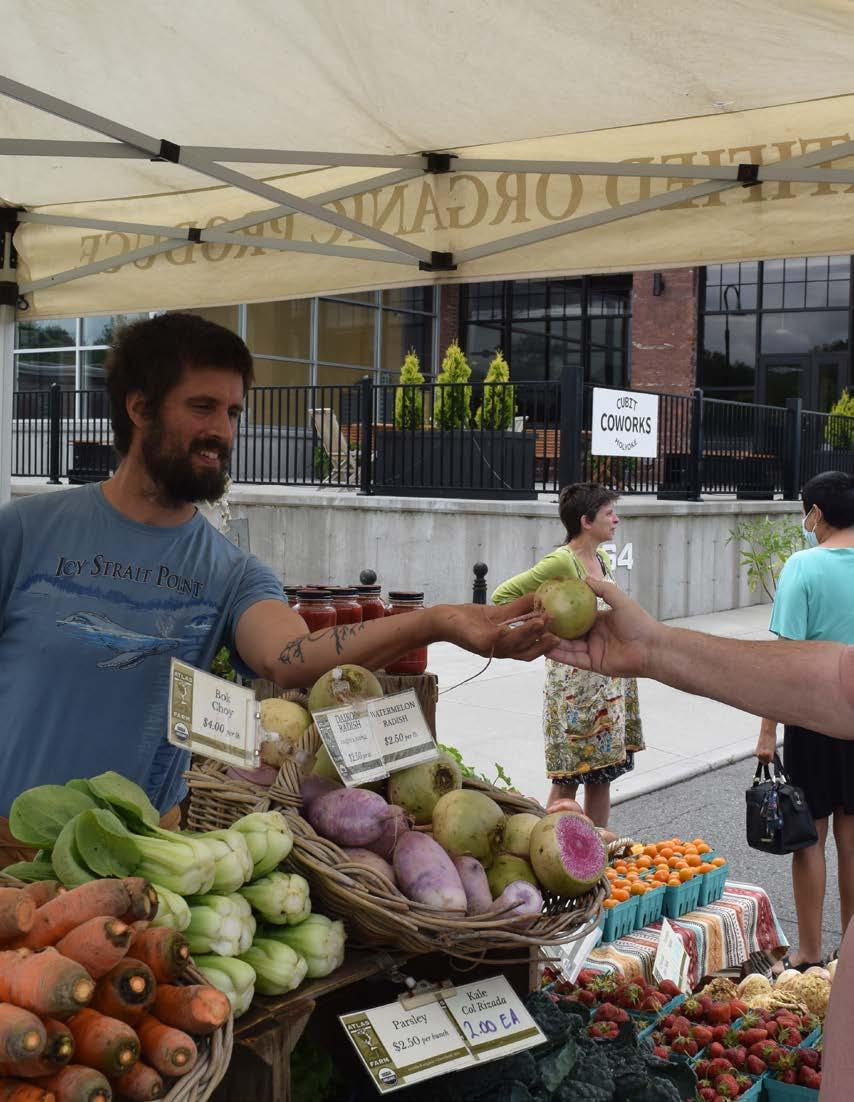
The Massachusetts Food Trust Program offers affordable loans for healthy food projects in underserved areas. The program focuses on providing support to independent businesses that produce, promote, or sell healthy food harvested or caught in Massachusetts. The program puts special focus on projects reaching underserved communities in Massachusetts.
T2-T6: Municipalities should identify sources of nutritious food within their districts and assess barriers faced by vulnerable communities in accessing those sources. Develop food security plans that address these challenges, including strategies to connect vulnerable populations with support services (SNAP, HIP, transportation assistance), promote local food production and sales by HIP vendors, provide nutrition education, and adjust transportation routes and farmers’ market locations to better serve high-traffic, low-income areas. Utilize resources like UMASS Dartmouth, MDAR, SMSFN, and FINE to support these efforts. Leverage state grants, such as the Food Security Infrastructure Grant Program, to improve food infrastructure and support vulnerable communities.
Social, financial, and transportation services are essential for helping vulnerable communities access healthy food. Support from social services is crucial to ensure access to programs like MA HIP, which increases the value of SNAP benefits for fresh produce. Regional financial support is also necessary to expand benefits to low-income communities for the purchase of fresh local goods. Regional programs can increase HIP benefits through providing matching funds. Farm-to-institution and nutritional assistance programs offered through schools, hospitals, and prisons can improve nutrition for those connected to these institutions.
Transportation assistance for seniors and low-income families can improve mobility to markets and improve delivery services of fresh ingredients to senior centers. Coordination between food providers, municipalities and regional agencies can assist delivery mechanisms. Collaboration with transit agencies like the Greater Attleboro-Taunton Regional Transit Authority (GATRA) and Southeastern Regional Transit Authority (SRTA) to optimize bus routes can better serve grocery stores and farmers’ markets in underserved areas. Transit stops and stations can also host pop-up farmers’ markets to increase access to fresh produce.
The Holyoke Farmers’ Market, located in an area of high food insecurity, is one of the oldest farmers’ markets in the country and has implemented several strategies to improve access to fresh, healthy food for vulnerable populations. These include accepting SNAP/EBT benefits, participating in HIP, and providing a wide variety of culturally appropriate produce. The market has successfully increased food access for low-income residents, particularly seniors and families, while also serving as a community hub for nutrition education.
Grow Food Northampton is a non-profit organization hosting SNAP Match, which doubles the value of SNAP benefits used at farmers markets for Hampshire County residents. SNAP Match funds are provided through donations from local businesses, private donations, and the support of other regional partners.
Boston Double-Up Food Bucks offers a 2-for-1 dollar match on fresh produce bought at participating stores in the Boston Metropolitan Area. It is funded by the City of Boston and the USDA Gus Schumacher Nutrition Incentive Program.
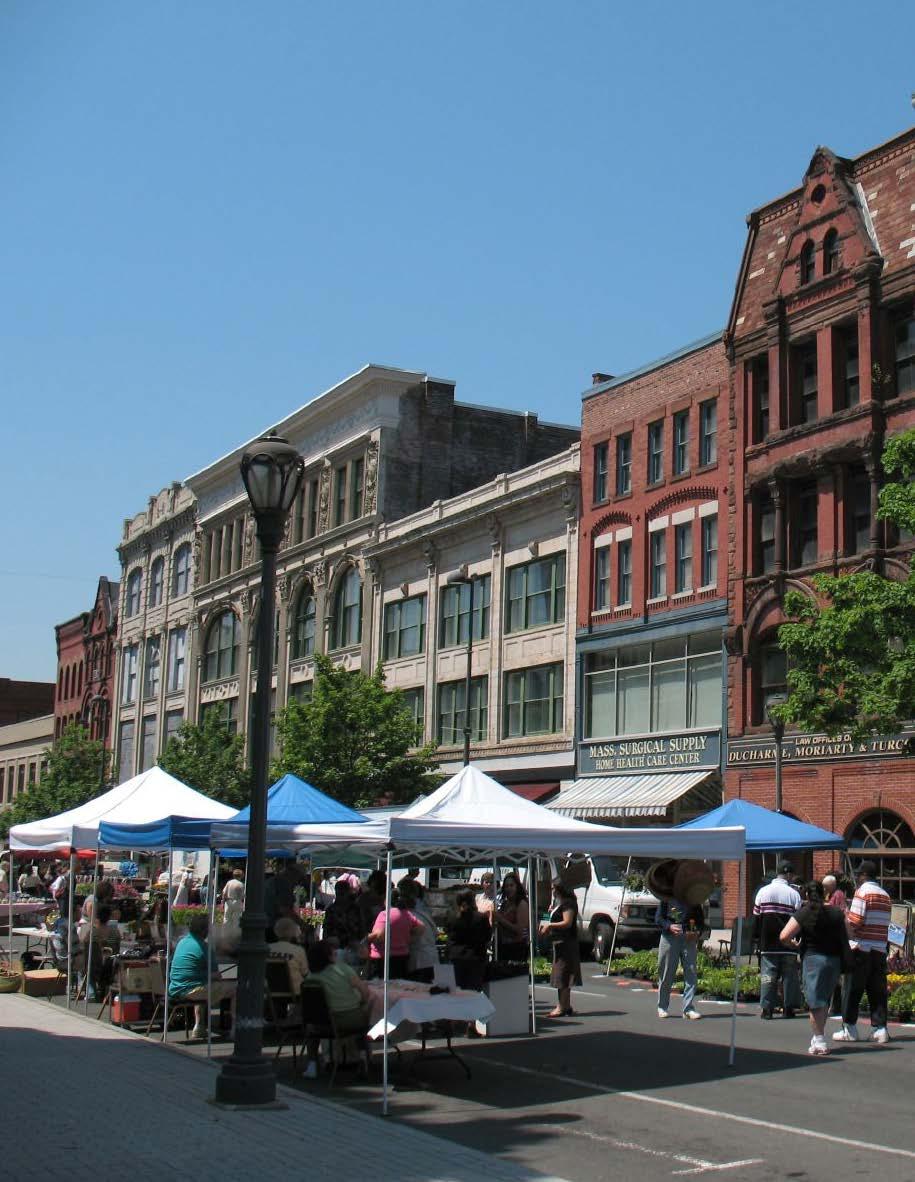
3.2-1 Foster Connections Between Social Service Providers
Best Practice #1: Increase coordination between Emergency Management Directors regionwide.
Best Practice #2: Practice emergency exercises.
Best Practice #3: Establish clear roles and responsibilities among local leaders and emergency service providers in towns and regionwide during emergency scenarios.
Promote Local
Best Practice #1: Continually update local emergency preparedness and recovery plans.
Best Practice #2: Increase awareness among local officials and individuals of recovery resources and funds.
Best Practice #3: Institute a Disaster Service Worker (DSW) program for municipal employees.
3.2-3 Increase Individual Awareness of Available Resources
Best Practice #1: Conduct emergency management public outreach.
Best Practice #2: Provide emergency management educational resources to the public.
The Massachusetts Civil Defense Act requires that every city and town establish a local emergency management program and to appoint an official to oversee the program, typically known as the Emergency Management Director (EMD). Every municipality in the region employs an EMD, though many also function as the police or fire chief as their primary position. EMDs coordinate all components of preparedness and recovery in disaster scenarios on a local level to ensure the safety of their community. Additionally, EMD’s coordinate with Police, Fire, Emergency Medical Services (EMS), Technical Rescue, the Massachusetts Emergency Management Agency (MEMA), Community Emergency Response Teams (CERT) and the American Red Cross to make the proper responses for when emergency scenarios arise. EMDs are responsible for coordinating evacuation routes, emergency shelters, mobilizing local resources, and activating mutual aid agreements with other cities and towns in accordance with emergency plans and procedures developed locally and regionally.
MEMA is the coordinating agency for emergency management in Massachusetts; it sets guiding principles for local emergency management outlined in the state’s Comprehensive Emergency Management Plan (CEMP). MEMA provides training, exercises, and conferences for local Emergency Managers through The Northeast Emergency Management Training and Education Center (NEMTEC) to provide all professionals in the emergency services sector the training resources they need to create a resilient framework of emergency preparedness and recovery for their municipality.
The Southeast Region Homeland Security Advisory Council (SRAC) supports Emergency Managers by helping to meet the core capabilities of homeland security and emergency preparedness set forth by the Department of Homeland Security; to do so, SRAC works collaboratively with the Executive Office of Public Safety and Security (EOPSS), the Metropolitan Area Planning Council (MAPC),
and SRPEDD to develop projects and distribute federal funds throughout the region among various emergency response departments. SRAC makes these resources available to all municipalities in the region in an emergency response situation; in other words, equipment purchased with these federal funds can be utilized by Emergency Managers throughout the region. SRAC maintains various cache sites of equipment in centralized locations throughout the region to be deployed to any localized emergency situation. SRAC has also supported projects throughout the region, such as All-Hazard Position Specific Training Program (to provide advanced training to emergency response personnel for managing incidents of great complexity through MEMA), an Emergency Response Trailer located in Taunton, and supporting the Boston Area Police Emergency Radio Network to maintain interagency radio communications that are used as incident command during emergency events and operations.
As part of SRRP analysis, SRPEDD conducted a survey of Emergency Managers throughout the region. Of those who responded, most indicated they have limited or no full-time staff. Emergency Managers are heavily reliant on volunteers, both CERT and non-CERT, to staff emergency shelters, and many say they would be unable to staff a shelter for longer than 48 hours in the case of a lengthy emergency scenario. Additionally, due to lack of staffing, most Emergency Managers have been unable to carry out emergency shelter plans. Most Emergency managers do have designated evacuation routes, but none have exercised evacuation plans. Emergency managers are not aware of neighboring municipalities evacuation routes or if those routes would involve their municipality.
1. Lack of coordination between Emergency Management personnel among neighboring towns regionwide: Better understanding of available resources and capabilities of neighboring emergency personnel will help EMD response efforts in emergency scenarios that arise, helping them allocate personnel and equipment to address community needs. Understanding emergency plans locally and regionally (e.g., evacuation routes) will help to improve response efforts to any variety of emergency.
2. Lack of personnel for Emergency Managers to staff emergency shelters long term in a disaster scenario: If a major disaster declaration is declared and emergency shelters are opened, these shelters could be open for 24 hours to weeks at a time – and need to be staffed 24/7. The size of the shelter and its capacity will determine how many volunteers are needed to staff and operate them. The majority of EMDs in the region have no full-time staff and are heavily reliant on volunteers who would be responsible for staffing emergency shelters. Lack of staffing or lack of qualified staff can affect decision-making and communication when managing emergency scenarios.
3. Lack of emergency response plans, procedures, and exercises being practiced in towns regionwide: Practicing emergency response plans will give emergency personnel familiarity with procedures to enhance response during actual emergencies. Emergency exercises and plans help to establish a clear framework of roles and responsibilities for emergency personnel; these should be exercised annually.
In general, EMDs throughout the region should meet periodically to discuss capabilities and regional plans like evacuation routes. EMDs of neighboring municipalities should build relationships and open lines of communication to discuss preparedness, response and recovery plans, and efforts for local and regional emergency scenarios. Additionally, whenever possible, EMDs should organize Full-Scale Exercises for their municipality’s emergency responders (Police, Fire, EMS, and so forth) to practice exercises, such as Mass Casualty Incidents (MCI). Local Leaders should periodically meet with EMDs to understand vulnerabilities of their municipality and discuss roles and responsibilities for when emergency scenarios arise.
T2 –T6: Establish an Emergency Manager Committee for the SRAC region to establish relationships among EMs throughout Southeastern Massachusetts and hold annual meetings and workshops to discuss best practices, capabilities, and vulnerabilities.
Communities should encourage EMDs to collaborate regionally by sharing best practices, resources, and information. Regular meetings or workshops with EMDs throughout the region can facilitate this exchange. MEMA has regional offices across the state; these offices can serve as hubs for EMDs to connect and coordinate efforts during emergencies.

Mutual Aid is an agreement that allows local communities within the state to assist each other during emergencies. EMDs across the region should communicate with neighboring EMDs to establish protocols for assistance when emergency scenarios arise locally or regionally. Massachusetts participates in the Emergency Management Assistance Compact (EMAC), facilitating mutual aid across state lines. During disasters or emergencies, states can send response equipment, personnel, assets, and commodities to assist each other. Intrastate Mutual Aid is an agreement that allows local communities within the state to assist each other during emergencies. It ensures that neighboring towns and cities can share resources, personnel, and equipment when needed.
All of our EMDs have spent time planning for the need to evacuate some or all of their populations as preparation or response to an incident. SRPEDD has spent time combining those local approaches into a regionalized Evacuation Route study.
T2 –T6: Conduct Full-Scale Exercises focusing on large-scale emergencies and disasters to ensure Emergency Managers and all emergency responders are familiar with protocols and can work seamlessly when these scenarios arise.
Funding Opportunities: SRAC - Homeland Security Grant Program (HSGP), Emergency Management Performance Grant (EMPG)
Organize joint training sessions and exercises for EMDs. These simulations can improve coordination, response protocols, and familiarity with each other’s capabilities.
DISCUSSION-BASED EXERCISES:
• Seminars: These provide an overview of plans and policies.
• Workshops: Focused on specific issues, workshops aim to build products like standard operating procedures.
• Tabletop Exercises: Test plans using hypothetical events and assess readiness through discussion.
• Games: Simulate operations, often involving competitive teams with rules and procedures.
OPERATIONS-BASED EXERCISES:
• Drills: Test single operations or functions within a single entity.
• Functional Exercises: Validate cooperative group skills in real-time, realistic environments (no actual movement of personnel or equipment).
• Full-Scale Exercises: Occur in lifelike environments, mirroring actual incidents with personnel and resource mobilization.
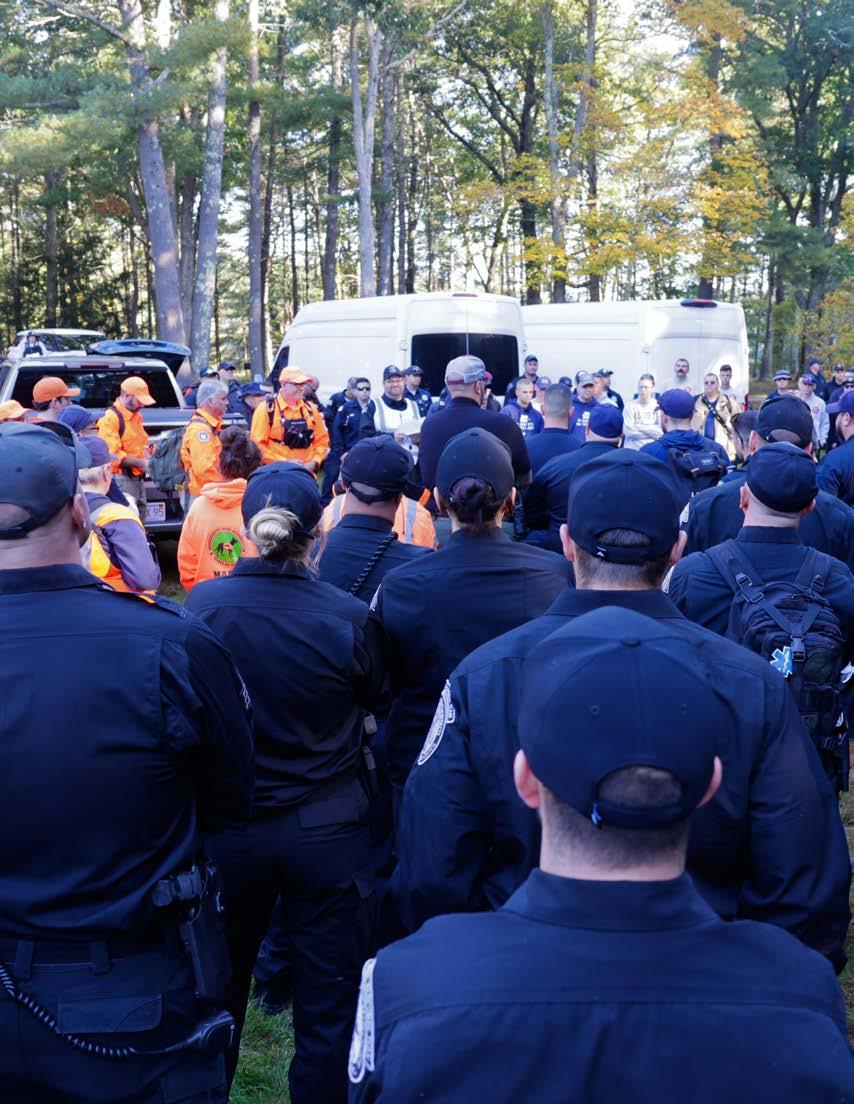
MEMA creates an annual training and exercise plan that aligns with the needs of the response community. This plan aims to enhance the preparedness of cities and towns for all hazards. Free courses are offered to build resilience in local communities. All Emergency Management personnel and local government officials who play roles during emergency scenarios should take the introduction courses on Emergency Management through NEMTEC to establish a basic understanding of procedure.
• L-101: Foundations of Emergency Management
• L-102: Science of Disaster
• L-103: Planning - Emergency Operations
OPERATION JBO - FULL SCALE STATEWIDE SEARCH AND RESCUE EXERCISE
On October 4, 2023, more than two-hundred-and-fifty personnel across at least fourteen state and regional law enforcement, technical rescue, and civilian search and rescue teams came together for a simulated missing persons search in Rutland, Massachusetts. SRPEDD staff organized and led the exercise planning team through a nearly 9-month process. The scenario was two pairs of missing individuals lost in the woods overnight, with search teams coming on scene in the morning. The potential search area covered just over three-square miles of trails and heavy woodland and the subjects ranged from hidden/evasive behaviors to actively responding to searcher callouts. Search teams consisted mostly of search and rescue technicians on foot, but were also supplemented by all-terrain vehicles, certified livefind dogs, and horses. While there were struggles with incident command, communications, and other incident management functions, at the conclusion of four hours of exercise play, two missing persons were found, and teams were closing in on the remaining two individuals.
Best Practice 3: Establish clear roles and responsibilities among local leaders and emergency service providers in towns and regionwide during emergency scenarios.
T2 –T6: Establish continuing education resources for senior local government officials to take the necessary ISC training to be prepared for emergency scenarios.
Funding Opportunities: SRAC - Homeland Security Grant Program (HSGP), Emergency Management Performance Grant (EMPG).
In emergency scenarios, the Incident Command System (ICS) employs organizational structure that can be customized based on the size and complexity of an incident. ICS establishes a clear chain of command, ensuring effective coordination among agencies, responders, and resources. During an emergency, ICS can be activated to create a unified structure for decision-making and resource allocation.
Bridging the gap between local leaders and emergency response personnel during emergency scenarios can enhance response efforts. ICS defines specific roles (Incident Commander, Operations Chief, etc.) for each participant. This helps town officials and responders know their responsibilities, minimizing confusion and duplication of efforts by establishing clear communication channels. Local leaders can relay critical information to responders, and vice versa. This real-time exchange enhances situational awareness and decisionmaking. Local leaders and responders can seamlessly scale up or down based on the situation, to be used during a town- or region-wide emergency scenario.
First responders are intimately aware of, and utilize ICS for regular, frequent responses, but senior officials (executives, elected, and appointed) have a role to play in the ICS chain of command, as well. Specific ICS training for these senior officials exists to provide ready reference and background information for personnel who don’t have their hands in ICS daily.
45. Governor Maura Healey visits North Attleborough after a state of emergency was declared due to unprecedented rainfall totals. (Joshua Qualls/Governor’s Press Office)
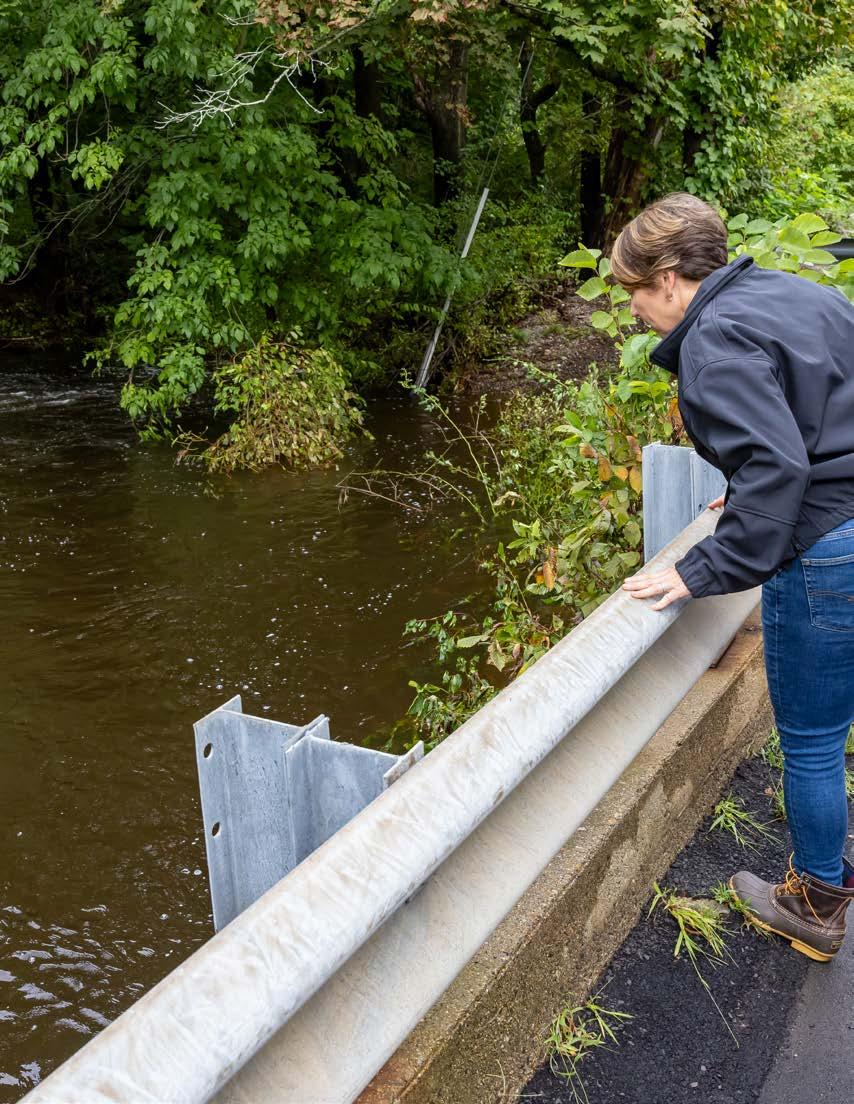
North Attleborough recently declared a state of emergency on September 12th, 2023 after receiving about 10 inches of rain in 72 hours. Unprecedented flooding45 to the town caused significant damage to roads, power outages, and flooding to nearly 200 homes. North Attleboro’s Emergency Operations Center was activated to address the flooding, advising residents to shelter in place and stay off the roads so emergency personnel could work. North Attleborough received mutual aid from over 20 communities in the region as well as help from MEMA, American Red Cross, Southeast Massachusetts Technical Rescue Team, and Mansfield’s CERT team who were all dispatched to help the first responders of North Attleborough in a great showing of interoperability between local and state organizations in an emergency scenario.
Emergency scenarios in the region tend not to be localized; rather, they typically affect the entire region with flooding, hurricanes, winter storms, and other natural disasters common to Massachusetts.
Municipalities are affected in different ways by different emergency scenarios due to highly diversified typologies and geography throughout the region. Coastal and inland communities are affected differently from natural disasters common to our area. Prioritizing emergency preparedness planning helps to reduce costs in recovery from natural disasters. Climate change is associated with increases of severity and frequency of natural disasters and adverse weather. Programs, such as the Massachusetts Municipal Vulnerability Preparedness (MVP) program, provide funding for cities and towns to plan for climate resilience and preparedness. Recent projects funded through MVP in the region include Climate Vulnerability Assessment in Fairhaven, Mattapoisett River Valley Water Supply Resilience Project, New Bedford Green Infrastructure Master Strategy and Implementation Roadmap, and the Regional Emergency Water System Interconnectivity Analysis
Table 9. Recent Massachusetts State of Emergency Declarations.
Declaration Date
9/15/23 9/16/23
Hurricane Lee
9/12/23 9/16/23 Severe Weather & Flooding
8/8/23 Pending Shelter Capacity Crisis
3/10/20 5/11/23 COVID-19 Pandemic
9/14/18 10/4/18
Merrimack Valley Gas Explosion
3/3/18 3/6/18 Coastal Storm
2/9/15 2/25/15 Winter Storm
1/26/15 1/28/15 Winter Storm
2/8/13 2/13/13
Winter Storm
10/27/12 11/1/12 Hurricane Sandy 10/29/11 11/7/11 Nor’easter
8/26/11 9/6/11
Hurricane Irene
6/1/11 6/2/11 & 6/19/11 Tornadoes 1/12/11 1/13/11 Winter Storm
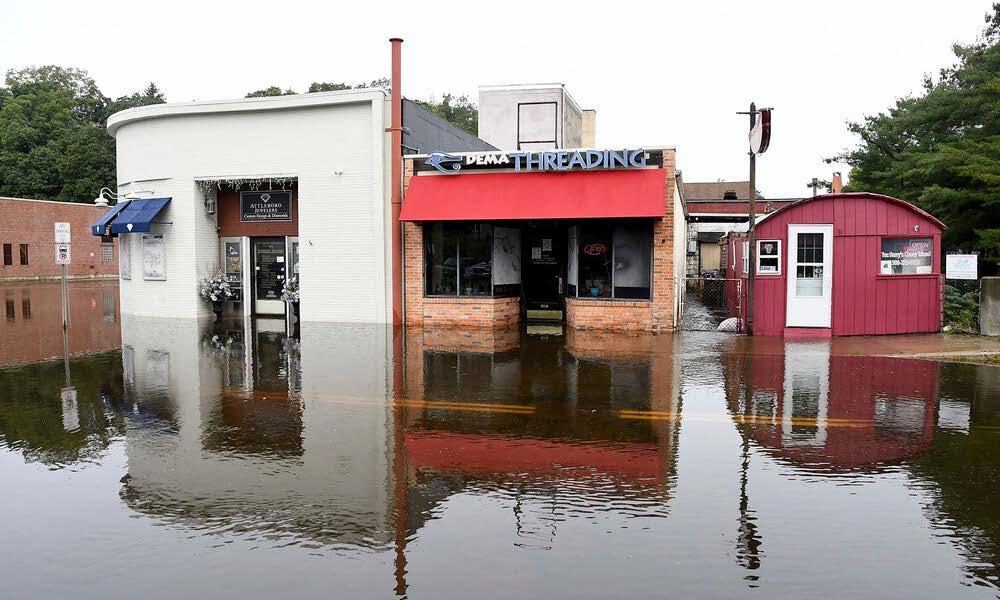
With the wide variation of typologies throughout the region, an emphasis on Local Hazard Mitigation Planning for each municipality is essential. This can ensure that each community is aware of how they can prepare and mitigate damage from disasters before they occur; this is achieved by having a plan that identifies community weaknesses and itemizes what actions can be taken before a natural disaster or emergency scenario. Municipalities in the region have mostly prioritized emergency preparedness by updating their Local Hazard Mitigation Plans.
Table 10. Hazard Mitigation Plan Status by Municipality.
Municipality
Year HMP Completed Status
Attleboro 2021 Up-to-date
Acushnet None No Plan
Berkely 2005 Expired
Carver 2022 Up-to-date
Dartmouth 2015 Expired
Dighton 2020 Up-to-date
Fairhaven 2018 Expired
Fall River 2023 Up-to-date
Freetown None No Plan
Lakeville 2022 Up-to-date
Mansfield 2008 Updating
Marion 2022 Up-to-date
Mattapoisett 2018 Expired
Middleborough 2023 Up-to-date
New Bedford 2016 Updating
North Attleborough 2019 Up-to-date
Norton None Updating
Plainville 2005 Expired
Raynham None No Plan
Rehoboth 2005 Expired
Rochester 2005 Expired
Seekonk 2023 Up-to-date
Somerset 2018 Expired
Swansea 2023 Up-to-date
Taunton 2023 Up-to-date
Wareham 2020 Up-to-date
Westport 2005 Expired

MEMA’s Disaster Recovery Unit coordinates delivery of FEMA Public Assistance, FEMA Individual Assistance and Small Business Administration Disaster Loan Programs. Individuals who own a home or business that took damage from a declared disaster should check if they are eligible for financial assistance from these programs through MEMA.
On September 15, 2023, Massachusetts received an Emergency Disaster Declaration for all counties after Hurricane Lee making federal funding available to local governments and state agencies for disaster related costs for evacuation and sheltering and Emergency Operation Center actions.
1. Outdated or lack of emergency preparedness plans: Emergency preparedness plans should be frequently updated as new vulnerabilities arise and change over time; plans must continue to align with current risks, operational capabilities, and resources. Climate, population, and new infrastructure change over time and introduce new hazards to local communities. Reviewing and revising past plans on a consistent basis allows for the incorporation of past incidents and new guidance.
2. Lack of recovery planning and resources: Vulnerable populations, such as lower-income households and renter groups, struggle to participate in federal recovery programs to access aid. Federal recovery programs lack comprehensive data to identify access barriers. Flood mapping investments are lower in communities with higher social vulnerability and environmental justice communities.46
FEMA outlines the National Preparedness Goal into 5 mission areas with 32 core capabilities. Emergency managers, planners, and local leaders will leverage these mission areas and core capabilities to align with their jurisdictions’ specific risks. Regional preparedness and recovery for emergencies starts at the local level, individual municipalities that lack preparedness plans for emergencies like natural disasters create a more vulnerable region. Regional leaders and planners will focus on addressing holes throughout the region by helping individual municipalities procure the proper resources and plans they lack. The vast variety of typologies throughout the region creates the need for specialized local plans that can then be used to create a more complete level of regional emergency preparedness. Local municipalities that lack emergency plans should create an HMP or CEMP to address their vulnerabilities.
T2 –T6: Prioritize developing and updating emergency preparedness plans, as these help reduce recovery costs. T5-T6 should focus on Comprehensive Emergency Management Plans, as this format is more all-encompassing for natural hazards and man-made hazards more likely to occur in urban areas. All municipalities containing a T2-T6 should have a Hazard Mitigation Plan developed or updated.
Funding Opportunities: Hazard Mitigation Grant Program (HMGP) , Building Resilient Infrastructure and Communities (BRIC), Flood Mitigation Assistance (FMA), Public Assistance (PA) Hazard Mitigation.
Focusing on emergency preparedness can significantly reduce the financial costs in recovery planning from natural disasters and other emergencies. Hazard Mitigation Plans and Comprehensive Emergency Management Plans (CEMP) identify and reduce long-term risks to life and property from hazardous events by prioritizing prevention initiatives and allocating resources effectively. Frequent updates to these plans are just as important as having them in place; this is particularly true as hazards evolve over time due to factors, such as climate change, population growth, and infrastructure development. Regular updates ensure that plans address current risks and identify improvements based on a current set of identified vulnerabilities. While HMPs focus more on emergency preparedness of natural hazards through FEMA, CEMPs focus on all aspects of emergency planning for all hazards, including recovery that was created by MEMA.
awareness among local officials and individuals of recovery resources and funds.
T2-T6: Participate in Preparedness Grant Programs and Public Education.
Funding Opportunities: Community Development Block Grant: Disaster Recovery, Disaster Grants – Public Assistance, Emergency Preparedness, Response and Recovery, Hazard Mitigation Grant Program, Individuals and Households Program.
FEMA collaborates with federal partners to compile a comprehensive resource library for state, local, tribal, and territorial governments, nonprofits, businesses, healthcare institutions, schools, individuals, and households. Users can search by keyword, eligibility, topic area, and resource type to find relevant programs.
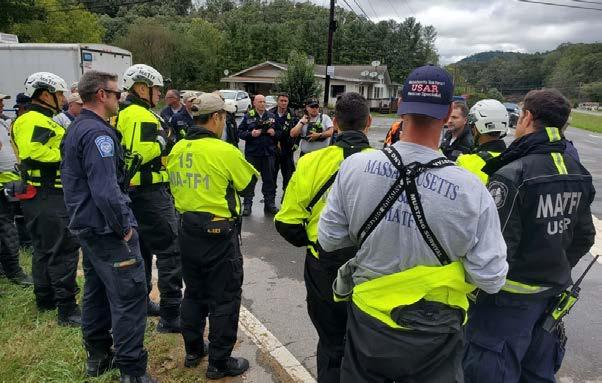
T2 –T6: Establish a basis for a DSW program that defines the roles and responsibilities of municipal employees during disasters. Implement training sessions for all municipal employees to familiarize them with their roles and conduct annual emergency drills to keep employees prepared while identifying any gaps in the response plan.
During an emergency, non-essential public employees (those not required for continuity of operations) can be released from their usual duties so that they can be reassigned to assist with emergency response or recovery. This process requires that municipalities invest in training and annual or bi-annual activation exercises to ensure that when the time comes, employees are ready.
49. Vehicles travel through flooded streets in Leominster. (Rick Cinclair/Worcester Telegram & Gazette)
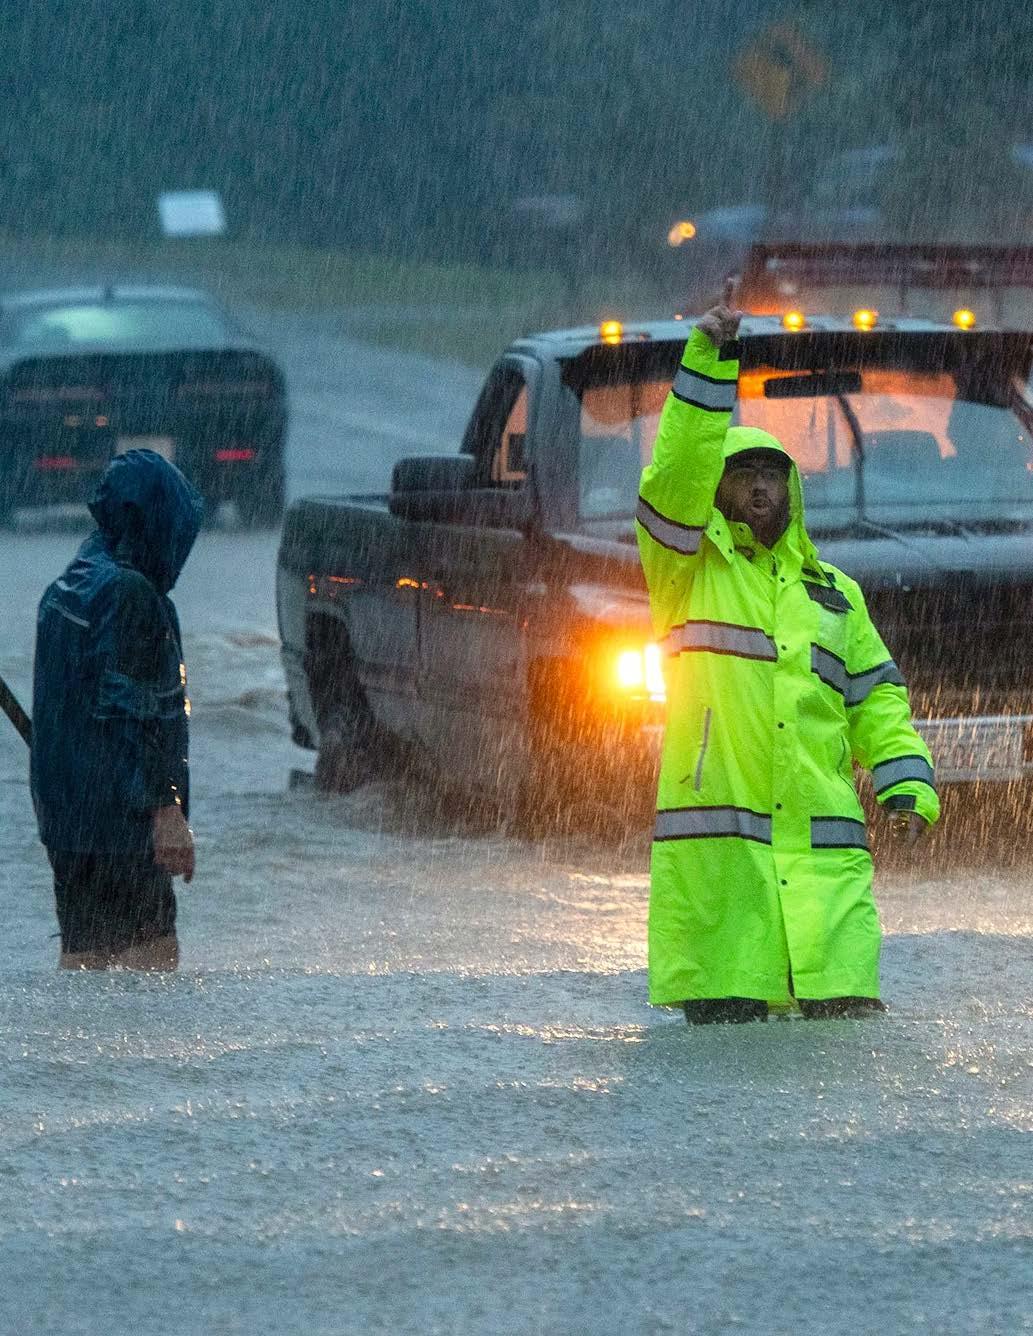
States of Emergencies can be declared by individual town officials or statewide by the Governor of Massachusetts. Communities throughout the region offer emergency response alerts to notify individuals when an emergency scenario is taking place. Residents are encouraged to sign up to receive emergency alerts through their town’s emergency alert system. These systems provide updated information and warnings on whether to shelter in place, evacuate the town/ region, or head to an emergency shelter. Local Emergency Managers and town officials will declare when emergency shelters are opened.
1. Lack of local emergency management outreach to the public: Public outreach ensures that emergency plans and strategies address local needs and vulnerabilities within the community. Through public outreach, EMDs can raise awareness about hazards and preparedness measures for emergency scenarios to individuals within the community. When individuals are informed and/or participate in planning and exercises, they become better equipped to respond to a variety of emergencies. Informed citizens are more likely to take proactive steps before emergency scenarios arise and have a better understanding of what to do when they happen.
2. Lack of emergency management education and information for the public: Some towns in the region lack a dedicated Emergency Management section on their town website. Communities need access to information on emergency preparedness to raise awareness on hazards and educate individuals on how to prepare. When individuals understand risks and how to respond they can take proactive measures to protect themselves, their families, and other members of the community. Outreach materials can provide guidance on evacuation routes, shelter locations, and general preparedness to improve community resilience.
Municipalities throughout the region should have a dedicated Emergency Management section on their website that includes locations of emergency shelters, emergency alert sign up, and general updates of emergency planning actions that are being conducted. The Emergency Management section should include disaster planning materials and information for individuals and families living in the community. All municipalities should include a Special Needs Registration for individuals with handicaps and disabilities so that emergency personnel in the town are aware which residents require assistance during an emergency scenario, such as transportation to an emergency shelter.
Towns should continually update their emergency management website and provide other resources to increase public awareness on what to do when emergencies occur. Public outreach is important when creating disaster preparedness plans so they can involve the entire community during the process to raise concerns to public officials and emergency personnel. Hazard Mitigation Plans require proof of public participation through workshops and meetings in order for the plan to be approved by FEMA. Providing individuals with additional information on emergency services available from their communities’ websites under Emergency Management will increase public education on what to do during an emergency.
T2 –T6: Build CERT teams throughout the region. Offer CERT Basic Training, which includes modules on fire safety, light search and rescue, team organization, and disaster medical operations. Training can be conducted by professional first responders who have completed a CERT Train-the-Trainer course.
Funding Opportunities: Assistance to Firefighters Grants (AFG).
Town officials should make their communities aware if they live in a hurricane evacuation zone to prepare communities and individuals if they are at risk during a hurricane. Every community within the region is a participant in the National Flood Insurance Program managed by FEMA. Flood insurance is a separate policy for property owners that covers building and contents of building both homes and businesses. Individuals throughout the region should be made aware if they live in a flood plain, as homeowners’ and rental insurance policies typically do not cover flood damage.
Additionally, individuals can sign up to become a member of their local Community Emergency Response Team (CERT). The CERT program helps to educate people for disaster preparedness and response. Teams have been called upon in the past to help first responders and emergency officials during various incidents, such as the North Attleboro floods. MEMA also provides resources for individuals living in the region to prepare for emergencies and disasters with an individual and family emergency plans, how to build an emergency kit, safety tips for evacuation and sheltering, power outage safety tips, flood safety tips, and how to prepare your home or business for emergencies.
Best Practice #1: Regionalize or partner across municipalities to create joint positions, increasing salary and flexible work schedules.
Best Practice #2: Offer flexible workplace practices to enhance retention and attract new employees.
Best Practice #1: Strategically invest in public engagement tools to facilitate information-sharing with the public.
Best Practice #2: Effectively facilitate the flow of ideas, information, and understanding by building a culture of transparency within municipal government staff.
3.3-3 Collaborate
Best Practice #1: Explore safety net alternatives to ensure continued services provided by non-profits and volunteer organizations.
Best Practice #2: Implement Volunteer Partnership Agreements to formalize partnerships with non-profits.
To foster a stable government at the local level, municipalities need to invest in their staff and tap into resources to provide efficient and cost-effective services. Most communities in the Southcoast operate under a representative form a government through a Board of Selectmen (BOS, or Select Board). In turn, the BOS hires a town manager or administrator to carry out the day-to-day activities in town. However, town administrators – or mayors in city government – rely on staff across various departments to provide services, maintain town infrastructure, conduct long-range planning, and steward public health, education, and safety. As such, a municipality’s ability to attract qualified staff –and retain them in the long-term – is critical to a resilient government.
Every year, MissionSquare Research Institute publishes the State and Local Workforce Survey Findings, which details municipal labor shortages and creative strategies communities employ to attract and retain public service workers. As many long-term public service workers retire, municipalities struggle to fill these gaps. Many local governments find themselves hiring part time – sometimes bringing back former employees and retirees.
To gain a better understanding of regional conditions in our region, municipal leaders, human resource officers, planners, and finance directors responded to a SRRP survey modeled after the MissionSquare survey to verify that national trends are mirrored locally.47 The results fell very much in line with the findings from the 2023 State and Local Government Workforce Survey. Executives in the region manage anywhere between 50-400 full time and 30 part-time employees. To attract and retain employees, most municipalities offer flexible work hours and feel they offer competitive wages. Municipalities are implementing a variety of workforce strategies to meet their diverse needs including hiring additional full-time staff and conducting a compensation or classification study to reassess wages. To a lesser extent, local governments are also hiring temporary
and contract employees, updating job descriptions to lower or drop degree requirements, provide on-the-job training, while also hiring staff jointly with other municipalities. Despite these efforts, municipalities in the region still struggle to hire staff in human and social services and Financial Operations/Assessors.
Most local government leaders feel as though their wages and salaries are competitive – a rate mirrored in the nationwide survey. However, more than half of municipal leaders cited uncompetitive wages among the top three reasons why employees leave. The disconnect may lie in vesting periods associated with public pension benefits, which are considered to negatively impact short-term employees. Most state and local pension programs require a 10-year vesting period, which reduces the probability that employees will stay until vested by 16 percent, particularly among young employees and those whose wages fell below the private sector.48
SRPEDD provides technical assistance to member communities through various technical assistance programs, including the popular and long-standing DLTA program (District Local Technical Assistance Program) and SMMPO Community Technical Assistance Program, both of which helps towns and cities in the region with transportation planning, comprehensive planning, zoning, economic development, and other municipal functions. These programs directly support municipalities by enhancing staff capacity to undertake critical long-range planning tasks that may not be possible due to day-to-day responsibilities. Additionally, SRPEDD’s work with the MA MVP Program (Municipal Vulnerability Preparedness Program) also aids municipalities by assisting in MVP grant applications, which include a focus on building local capacity to address climate resilience. This can involve training staff, developing new roles, or improving existing municipal resources to better handle climate-related challenges.
1. Staff retention: Municipalities in the region struggle to fill critical positions that ensure stable government processes.
2. Competitive Wages: Most municipalities report offering competitive wages, however compared to the private market, it is still not enough to retain some staff.
3. Traditional Work Practices: Most municipalities do not offer modern workplace practices to entice workers, making hybrid work schedules, private sector wages, and benefit packages more appealing.
As the job market becomes competitive, public-sector employers need to think creatively to attract and retain employees to sustainably meet all municipal obligations.
or partner across municipalities to create joint positions, increasing salary and flexible work schedules.
T2-T3: Rural and suburban municipalities would be best suited to accommodate regional or joint positions across municipal staff, school administration, and public safety. Many communities in the region already subscribe to this model for at least some aspect of municipal government.
To offset costs, some municipalities are hiring joint positions, such as planning, public health, conservation agents, and others. Specific jobs are best suited to this model, and expectations should be carefully coordinated between municipalities and expressed to new hires.
COG is a regional planning organization that supports collaborative efforts among municipalities in the Capital Region of New York. They have established joint positions for regional planners and transportation coordinators, allowing for increased salaries and flexible work arrangements.
Offer flexible workplace practices to enhance retention and attract new employees.
T2-T6: Communities of all kinds benefit from flexible workplace practices to attract qualified staff and should explore ways to create new flexibilities for existing and prospective employees.
Municipalities across the country are implementing 4-day work weeks, regular hybrid scheduling, and flexible work hours to retain and attract existing and new employees. Public perception deters most municipalities from implementing this model. However, this could be offset by creating more accessible hours to members of the public such as staying open later for those who work 9-5 in person.
The Town of Wayland announced a 4-day workweek starting June through August 2024. Between Tuesday and Thursday, Town offices operate between 8:00 AM-5:30 PM. On Mondays, Town offices remain open late into the evening until 7:00 PM to accommodate in-person public needs.
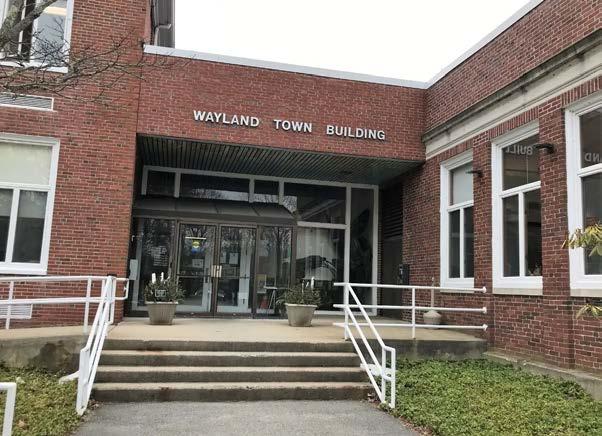
Communication among government actors and the public is critical to sharing information and policy, building trust, and ensuring public safety. Effective communication across all levels of government, enables the success of largescale projects and investments, as well as dissemination of best practices and information about day-to-day operations. Public-facing communication ensures emergency, civic, and community updates make their way to the community.
Municipalities in the Southeast region serve constituencies as large as 100,000 (in New Bedford) and as small as 5,000 (in Marion). Interviews and surveys revealed that municipalities in the region approach internal information sharing differently. Some executives strategically manage the way in which department heads and other staff receive information, holding regular staff meetings or requesting monthly memos to stay up-to-date on the latest activities. Others trust staff to disseminate information to members of the public or to refer them to the executive’s office if an individual staffer cannot or should be the primary source of information. Often, municipalities with fewer resources and staff take a hands-off approach to handling internal communications.
Communicating with the public is challenging for municipalities with limited resources to invest in civic engagement tools and lack of internal capacity to manage communications. Municipalities most commonly engage with residents using the town website, social media, and cable access. These tools are often free and financially accessible for many municipalities. Less common is the use of press releases in local newspapers (often due to a lack of publications). Municipalities with necessary funding employ or assign staff to communications roles and responsibilities. Most communities centralize communications through the chief executive, though larger cities with departments often support communications through each department. Relevant non-profit and community organizations (or even unofficial entities, such as Facebook Groups) also play an important role in disseminating government updates.
“The biggest challenge is the lack of interest from the community regarding municipal issues or events. We have also struggled to get volunteers for boards.”
SRPEDD’s Commission and RESC (Regional Economic Strategy Committee) serve as a communication bridge between SRPEDD and the regional municipal and business community. These organizations focus on disseminating timely and pertinent information and facilitating discussions on best practices and economic development strategies, ensuring that both internal and external stakeholders are well informed and up-to-date.
1. Lack of staff and resources for public engagement: Municipalities with dedicated public engagement staff are limited; this often translates to a decentralized approach to civic engagement and public education.
2. Capacity to manage departments: Municipal departments are given great latitude in handling their own public communications. This can potentially lead to confusion, particularly on town-wide or cross departmental issues.
The public relies on local government for direction on important topics, both during emergencies and day-to-day operations. Municipalities should focus on managing their internal communications practices to ensure the government’s message is the same and proactively conduct outreach to the public.
T2-T3: Smaller and Rural communities should invest in tools and resources that facilitate the sharing of information. Given limited budgets and staff capacity, carefully vetted tools enable communities to share information without hiring additional staff.
T4-T6: Larger and more densely populated communities often serve more diverse populations with varying needs. Some communities should invest in dedicated staff to meet public engagement needs particularly those that are required to meet Title VI.
Municipalities with limited resources should strategically invest and supplement financially accessible engagement tools to magnify their reach in the community. Furthermore, when there is no dedicated public engagement staff, municipalities should share tools and provide staff training to adopt cost-effective best practices.
The City of Bainbridge Island in Washington State created an online engagement site designed to share, discuss, and collaborate with residents about current City topics.
Effectively facilitate the flow of ideas, information, and understanding by building a culture of transparency within municipal government staff.
T2-T6: Communities in the region benefit from implementing mechanisms to share information with staff members. Whether communities are governed by a town administrator, manager, or mayor, major policy decisions and positions should be shared across departments. Most communities utilize staff meetings or individual department meetings.
Effective local government leadership relies on communications and leadership. Key to this is developing a culture of transparency within local government actors. This means strategically connecting with staff across all levels including executives and their department heads – and between department heads and their staff. This ensures better relationships to develop support for policies, programs, or initiatives. At the same time, a culture of transparency also translates into coordinated and confident municipal messaging.
Volunteer and non-profit organizations provide public benefit or further a social cause, filling gaps not addressed by government. Volunteerism plays a key role in several types of non-profit and community-based organizations, though there is a wide range of legal classifications, structures, purposes, and impacts.
It can be challenging to quantify the exact number of volunteer and non-profit organizations in the Southeast region given the informal network and localized service areas within which they operate.. The region’s communities host a total of 317 volunteer and mission-based organizations. Importantly, most organizations are concentrated in some of the region’s largest urban centers.
Table 11. Community contacts by Municipality within the SRPEDD region.49
The volume and scope of volunteer organizations may vary on the character of a given community.
52. New Bedford Fire Department and Firefighters IAFF
Local 841 donate backpacks and school supplies to Boys & Girls Club of Greater New Bedford members. (Boys & Girls Club of Greater New Bedford)
There is a higher concentration of volunteer organizations in the Southeast’s four gateway cities and some suburban communities. Volunteer organizations in these areas may be a part of a larger nationally recognized nonprofit or provide a variety of services to meet the needs of low-income, non-English speakers and young people. Prominent examples include:
Table 12. Examples of major volunteer/non-profit organizations within the region.
Organization
United Way
YMCA
Boys and Girls Club
Coalition for Social Justice
Locations
Fall River, New Bedford, Attleboro/Taunton
Dartmouth, New Bedford, Fall River, Wareham, Mattapoisett, Swansea
Volunteer Opportunities
United Way Day of Action
Host of Volunteer Opportunity DB
Full Plate Project
Taunton, New Bedford, Fall River, Attleboro Mentorship Programs
Fall River, New Bedford, Taunton, Attleboro (includes other Metro Boston Communities)
Door-to-door canvassing
Calling campaigns

Volunteer organizations in more rural areas with aging populations provide services for seniors and veterans, focus more on environmental and historical preservation, and often facilitate community programming in place of local municipalities. Rural communities may also rely on volunteer opportunities provided by local Councils on Aging and Public Libraries. Prominent examples include:
Table 13. Examples of volunteer/non-profits in rural communities in the region.
Organization
Activity In Volunteer Work
Lions Club Somerset, Rehoboth, Fall River, Raynham, Seekonk, Lakeville, Dartmouth, Norton, Middleborough, Rochester, Fairhaven, Plainville, Carver, Mattapoisett, Wareham, Dighton, Raynham
Freetown Historical Society Freetown, Dighton, Berkley
Oak Point Homeowners Alliance Middleborough
Sippican Woman’s Club Marion
Community programming and fundraising
• e.g. Dighton Arts Festival
Historical preservation of artifacts and buildings
Scholarships, fundraising, and yard sales
Scholarships, fundraising, community events
Other organizations operate on a regional basis, providing services or advocating for issues that cross municipal borders. Issues across these types of organizations advance infrastructure improvements and steward environmental protection activities along critical watersheds such as the Taunton River and Buzzards Bay. The three major regional organizations often draft, support, and partner on grant applications and projects that advance their specific missions.
• Taunton River Watershed Alliance
• South Coast Bikeway
• Buzzards Bay Coalition
SRPEDD has worked with several sister regional entities, including the Taunton River Watershed Alliance and Buzzards Bay Coalition, on projects related to water quality improvement, land conservation, and public access to coastal and riverine areas. These collaborations often involve volunteer-driven efforts, such as monitoring water quality and advocating for policy changes.
Just like municipalities, volunteer-based organizations face limitations and challenges, particularly when filling in gaps in public services. Many of these organizations are led by boards or memberships that drive participation. However, as unpaid volunteers with no public affiliation, these organizations are not held accountable to the public in the same way as a municipality would be. It is the responsibility of the individual community to build trust and establish partnerships with these organizations – and to ensure that interests align and that partners uphold standards for volunteers when acting on behalf of or in partnership with the community.
1. Reliance on volunteer organizations to fill gaps in service: Communities that rely heavily on volunteer organizations to provide services are vulnerable should these organizations discontinue service, change leadership or priorities, or experience diminished funding.
2. Organization accountability: There are few mechanisms to hold independent non-profit organizations accountable to the public and ensure they act in good faith.
Volunteer and non-profit organizations can serve to create community; however, municipalities should establish partnerships to protect liability and create long term plans to meet needs through formal partnerships.
safety net alternatives to ensure continued services provided by nonprofits and volunteer organizations.
T2-T6: Each communities utilizes volunteer and non-profit networks for a variety of reasons; however, municipalities should consider tracking the services provided by volunteer networks to determine future needs. This exercise would allow municipalities to be aware of potential budgets and staff skills and capacity needed to deliver the same or similar services.
Though generally positive, communities that rely on volunteer or non-profit organizations for specific services should establish alternatives should the partnership dissolve. This ensures service continuity to meet public needs.
T2-T6: All communities would benefit from volunteer partnership agreements. Communities with smaller populations and similar needs may execute volunteer partnership agreements on a regional basis, as needed. Larger communities with varied volunteer networks and greater needs should integrate tailored language and specific expectations.
Volunteer Partnership Agreements are commonly used to establish the purpose, scope, duration, and terms, as well as the rights and obligations of each party. A formal agreement establishes trust and credibility with partners and stakeholders, particularly when non-profits are funded or acting on behalf of a municipal government.
Photo 54. Volunteers work to assemble welcome boxes for migrant families sheltered in a Middleborough hotel. (Town of Middleborough)

CASE STUDY: UNITED WAY OF MA BAY’S ONLINE APPLICATION FOR SAFETYNET SHELTER GRANT PROGRAM
The United Way’s online application system was created in partnership with the Healey-Driscoll administration to support overflow options for the state Emergency Assistance Shelter Program (EA). The program will support prospective community gathering spaces with restrooms and heat, to provide safe space for families to find short-term congregate shelter, meals, and other basic necessities.
1 Census ACS 5yr Estimates, B06009.
2 Here, we refer to housing that is “for sale” or “for rent only,” not including other types of vacancies.
3 The National Collaborative on Childhood Obesity Research references 5-8%. Strong Towns references the long term norm for vacancy rates to be around 7-8%. The U.S. Lending Company references 5-8%.
4 https://www.mapc.org/resource-library/homes-for-profit/
5 https://www.mass.gov/doc/fy2023-q2-ea-report-0/download
6 https://www.mass.gov/info-details/emergency-assistance-ea-familyshelter-resources-and-data
7 https://www.census.gov/content/dam/Census/library/publications/2023/ demo/p23-219.pdf
8 https://www.forbes.com/advisor/mortgages/cost-of-living-by-state/
9 https://www.mass.gov/doc/regional-listening-sessions-overview/ download
10 For municipalities who wish to still incorporate a review process, they can choose to apply Site Plan Review to certain uses/projects.
11 https://www.mass.gov/info-details/voting-threshold-guidance
12 Key terms such as “multi-family housing,” “mixed-use development,” “accessory dwelling unit,” “transfer of development rights,” “natural resource protection zoning,” and “eligible location” are now defined in section 1A of the Zoning Act. (February 26, 2021).
13 https://docs.google.com/document/d/e/2PACX-1vRMxV09kdojzMdyOfapJ UOB6Ko2_1iAfIm8ELeIgma21wIt5HoTqP1QXadF01eZc0ySrPW6VtU_veyp/pub
14 https://nlihc.org/sites/default/files/Housing-First-A-Critical-Strategy.pdf
15 https://www.wgbh.org/news/housing/2024-03-26/healey-on-emergencyshelters-were-at-capacity
16 https://www.mass.gov/news/healey-driscoll-administration-announceschanges-to-emergency-assistance-prioritization-safety-net-sites
17 https://www.nbcboston.com/news/local/crowded-mass-shelters-arehaving-trouble-finding-and-keeping-staff/3370414/
18 https://www.mass.gov/news/healey-driscoll-administration-announceschanges-to-emergency-assistance-prioritization-safety-net-sites
19 https://www.vetshouse.org/history-values/
20 https://www.southcoasttoday.com/story/news/local/2023/10/18/modelhomeless-veterans-program-is-available-in-new-bedford/71219282007/
21 https://www.bluecrossmafoundation.org/publication/10-years-impactliterature-review-chapter-58-acts-2006
22 https://www.wbur.org/news/2014/11/06/quincy-medical-center-closingat-years-end
23 https://www.patriotledger.com/story/news/2023/06/07/compassmedical-closure-bankruptcy-multiple-lawsuits/70292551007/
24 https://www.wcvb.com/article/new-england-sinai-hospital-stoughtonmassachusetts-closing/46043047
25 https://www.wbur.org/news/2024/05/06/steward-bankruptcymassachusetts-for-profit-hospitals-debt
26 RI’s Lifespan to acquire Morton, St. Anne’s hospitals from Steward (msn. com)
27 Hearing on the sale of Steward Hospitals in Massachusetts delayed (msn. com)
28 Maybe they had a bad day: how LGBTQ and BIPOC patients react to bias in healthcare and struggle to speak out - PMC (nih.gov)
29 https://www.mass.gov/doc/hec-presentation/download
30 Strengthening-the-Health-Care-Workforce-Complete-20220909.pdf (aha. org)
31 https://malegislature.gov/Bills/193/H3613
32 Healthcare Leaders to Testify in Support of Bill Expanding Nursing Practice (mhalink.org)
33 United States Department of Agriculture (USDA), Economic Research Service (ERS). Measurement. Food Security in the U.S. 2023. https://www. ers.usda.gov/topics/food-nutrition-assistance/food-security-in-the-u-s/ measurement/#insecurity
34 Brandt et.al. (2023). Diet and Food and Nutrition Insecurity and Cardiometabolic Disease. Circulation Research.132.12.1692-1706. https://www. ahajournals.org/doi/abs/10.1161/CIRCRESAHA.123.322065
35 USDA, Economic Research Service (ERS). (2024). The prevalence of food insecurity increased in 2022 compared with 2021. Food Security and Nutrition Assistance. https://www.ers.usda.gov/data-products/ag-and-food-statisticscharting-the-essentials/food-security-and-nutrition-assistance/
36 Gundersen, C., Kreider, B., & Pepper, J. (2011). The Economics of Food Insecurity in the United States. Applied Economic Perspectives and Policy, 33(3), 281–303.
37 Rhone et. al. Understanding Low-Income and Low Access Census Tracts Across the Nation Subnational and Subpopulation Estimates of Access to Healthy Food. A report summary from the Economic Research Service. United States Department of Agriculture (USDA).2019. https://www.ers.usda.gov/ webdocs/publications/93141/eib%20209%20summary.pdf?v=6115.7
38 Rhone et. al. Understanding Low-Income and Low Access Census Tracts Across the Nation Subnational and Subpopulation Estimates of Access to Healthy Food. A report summary from the Economic Research Service. United States Department of Agriculture (USDA).2019. https://www.ers.usda.gov/ webdocs/publications/93141/eib%20209%20summary.pdf?v=6115.7
39 Coleman-Jensen, A., Rabbitt, M., Gregory, C., & Singh, A. Household Food Security in the United States in 2021. (2022) Washington, D.C.: USDA Economic Research Service. https://www.ers.usda.gov/webdocs/publications/104656/err309.pdf?v=4100%C2%A0
40 Coleman-Jensen, A., Rabbitt, M., Gregory, C., & Singh, A. (2022).
Household Food Security in the United States in 2021Links to an external site.. Washington, D.C.: USDA Economic Research Service.
41 United States Department of Agriculture, Food and Nutrition Service. (2021). National and State Level Estimates of WIC Eligibility and Program Research in 2021. https://www.fns.usda.gov/research/wic/eligibility-andprogram-reach-estimates-2021
42 Massachusetts Department of Agricultural Resources. (2024). MDAR A to Z Resources. Massachusetts Emergency Food Assistance Program. https://www. mass.gov/info-details/massachusetts-emergency-food-assistance-programmefap#:~:text=MEFAP%20ensures%20a%20consistent%20supply,The%20 Merrimack%20Valley%20Food%20Bank
43 Vilar-Compte, M., Burrola-Méndez, S., Lozano-Marrufo, A. et al. Urban poverty and nutrition challenges associated with accessibility to a healthy diet: a global systematic literature review. Int J Equity Health 20, 40 (2021). https://doi. org/10.1186/s12939-020-01330-0
44 Coleman-Jensen, A., Rabbitt, M., Gregory, C., & Singh, A. Household Food Security in the United States in 2021. (2022) Washington, D.C.: USDA Economic Research Service. https://www.ers.usda.gov/webdocs/publications/104656/err309.pdf?v=4100%C2%A0
45 https://www.boston25news.com/news/local/unprecedentednorth-attleboro-drying-out-after-200-homes-damaged-by-flash-flooding/ NOCGPCPLEFH4RG2KT7HAG5TAQA/
46 https://www.gao.gov/products/gao-22-105488
47 MissionSquare State and Local Workforce Survey, 2023
48 The Impact of Long Vesting Periods on State and Local Workers
49 MassDOT Community Contacts List and combined SRPEDD research