
Swansea Route 6 & 118
Corridor Study


The Southeastern Massachusetts Metropolitan Planning Organization (SMMPO) through the Southeastern Regional Planning and Economic Development District (SRPEDD) operates its programs, services, and activities in compliance with federal nondiscrimination laws including Title VI of the Civil Rights Act of 1964 (Title VI), the Civil Rights Restoration Act of 1987, and related statutes and regulations. Title VI prohibits discrimination in federally assisted programs and requires that no person in the United States of America shall, on the grounds of race, color, or national origin (including limited English proficiency), be excluded from participation in, be denied the benefits of, or be otherwise subjected to discrimination under any program or activity receiving federal assistance. Related federal nondiscrimination laws administrated by the Federal Highway Administration, the Federal Transit Administration, or both prohibit discrimination on the basis of age, sex, and disability. These protected categories are contemplated within SRPEDD’s Title VI Programs consistent with federal interpretation and administration. Additionally, SRPEDD provides meaningful access to its programs, services, and activities to individuals with limited English proficiency, in compliance with US Department of Transportation policy and guidance on federal Executive Order 13166.
Individuals seeking additional information or wishing to file a Title VI/Nondiscrimination complaint may contact the SRPEDD Title VI/Nondiscrimination Coordinator at the contact information here. All such complaints must be received, in writing, within 180 days of the alleged discriminatory occurrence. Assistance will be provided, upon request, to individuals unable to provide the complaint form in writing.
Southeastern Massachusetts Metropolitan Planning Organization (SMMPO)
Title VI Coordinator -SRPEDD
88 Broadway, Taunton, MA 02780
Phone: 508 824-1367 or dial 711 to use MassRelay
Email: aduarte@srpedd.org
Massachusetts Public Accommodation Law (M.G.L. c 272 §§92a, 98, 98a) and Executive Order 526 section 4 also prohibit discrimination in public accommodations based on religion, creed, class, race, color, denomination, sex, sexual orientation, nationality, disability, gender identity and expression, and veteran’s status, and SRPEDD and the SMMPO assures compliance with these laws. Public Accommodation Law concerns can be brought to SRPEDD’s Title VI /Nondiscrimination Coordinator or to file a complaint alleging a violation of the state’s Public Accommodation Law, contact the Massachusetts Commission Against Discrimination within 300 days of the alleged discriminatory conduct.
The SMMPO is equally committed to implementing federal Executive Order 12898, entitled “Federal Actions to Address Environmental Justice in Minority Populations and Low-Income Populations” and Executive Order 13985 (2021) entitled “Advancing Racial Equity and Support for Underserved Communities Through the Federal Government.”
In this capacity, the SMMPO identifies and addresses disproportionately high and adverse human health or environmental effects of its programs, policies, and activities on low-income and minority, including BIPOC, Asian or Pacific Islander populations, as well as religious minorities, LQBTQ+ persons, Limited English Proficient (LEP) persons or those who have a disability. The SMMPO carries out this responsibility by the consistent, fair, just, and impartial treatment of all individuals, and by involving underserved individuals in the transportation process and considering their transportation needs in the development and review of the SMMPO’s transportation plans, programs and projects.
English: If this information is needed in another language, please contact the MPO Title VI Coordinator at 508-824-1367 ext. 235 or at aduarte@srpedd.org.
Spanish: Si necesita esta información en otro idioma, por favor contacte al coordinador de MPO del Título VI al 508-824-1367 ext. 235 o en aduarte@srpedd.org.
Portuguese: Caso estas informações sejam necessárias em outro idioma, por favor, contate o Coordenador de Título VI da MPO pelo telefone 508-824-1367, Ramal 235 ou em aduarte@srpedd. org.
Haitian Creole: Si yon moun bezwen enfòmasyon sa a nan yon lòt lang, tanpri kontakte Koòdonatè a Title VI MPO nan 508-824-1367 ext. 235.
Simplified Chinese: 如果需要其他语言的此信息,请致电 508-824-1367 分机联系 MPO Title VI 协 调员。 235 或发送电子邮件至 aduarte@srpedd.org
Simplified Chinese: 如果需要其他语言的此信息,请致电 508-824-1367 分机联系 MPO Title VI 协调员。 235 或发送电子邮件至 aduarte@srpedd.org
Traditional Chinese: 如果需要其他語言的此信息,請致電 508-824-1367 分機聯繫 MPO Title VI 協調員。 235 或發送電子郵件至 aduarte@srpedd.org
Mon Khmer Cambodian (Khmer): ប្រសិនបើព័ត៌មាននេះត្រូវការជាភាសាផ្សេង សូមទាក់ទង អ្នកសម្របសម្រួល MPO Title VI តាមរយៈលេខ 508-824-1367 ext ។ 235 ឬនៅ aduarte@ srpedd.org
This report was made possible with participation and technical assistance from the following:
Town of Swansea
John P Hansen, Jr , AICP - Community Development Director
Mallory Aronstein - Town Administrator
Swansea Select Board
Robert C. Medeiros, Chairman
Steven H. Kitchin, Vice Chairman
Michael K. Beaudette, Clerk
Christopher R. Carreiro, Chairman (Term End 2024)
Southeastern Regional Planning and Economic Development District (SRPEDD)
Robert Cabral - Director of Housing and Community Development
Lizeth Gonzalez - Director of Economic Development
Maria Jones - Public Engagement and Communications Planner
Danyel Kenis - Urban Design Planner
Grant King, AICP - Deputy Director & Comprehensive Planning Manager
Taylor Perez - Assistant Director of Housing and Community Development
Chris Welch - Senior Comprehensive Planner
FXM Associates
Francis X. Mahady- Principal
Dianne Tsitsos - Senior Consultant
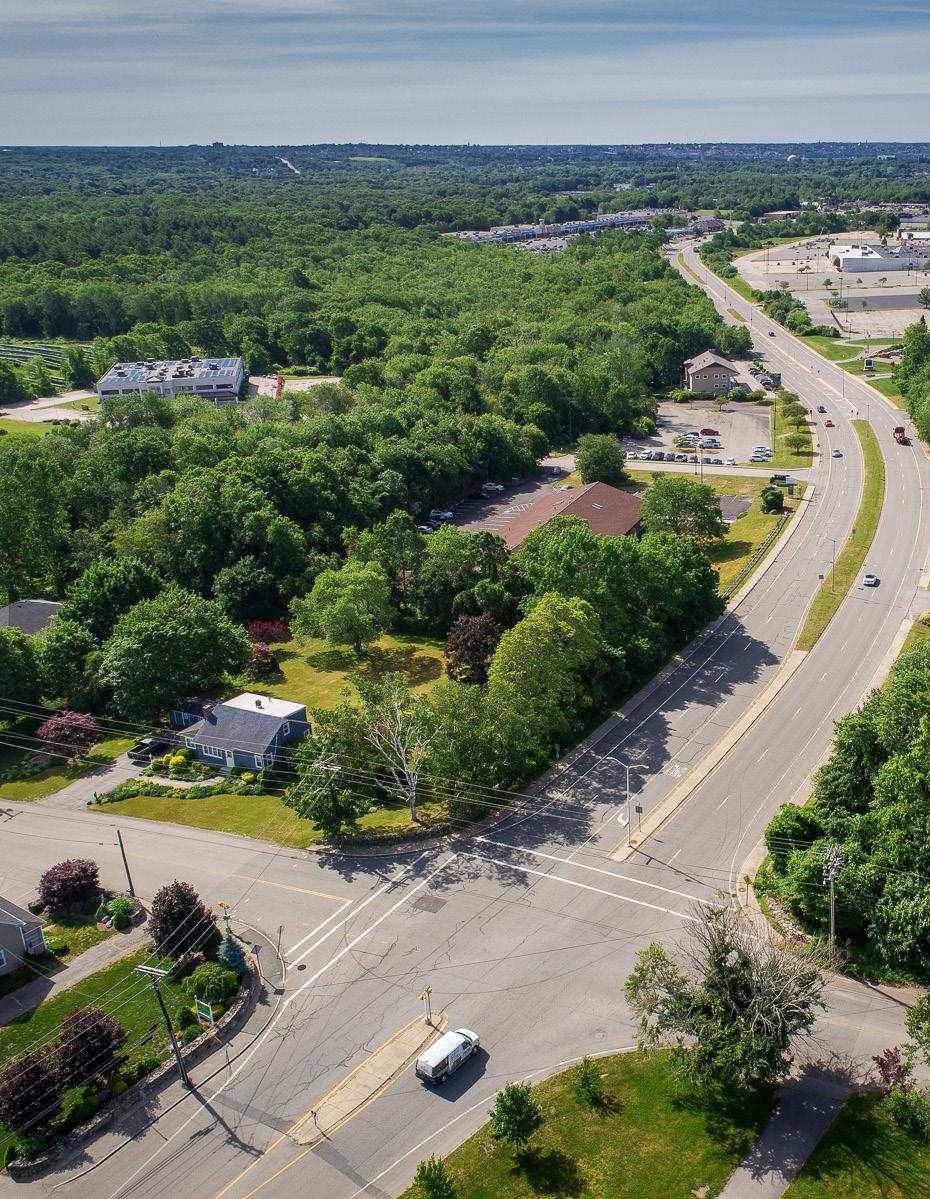

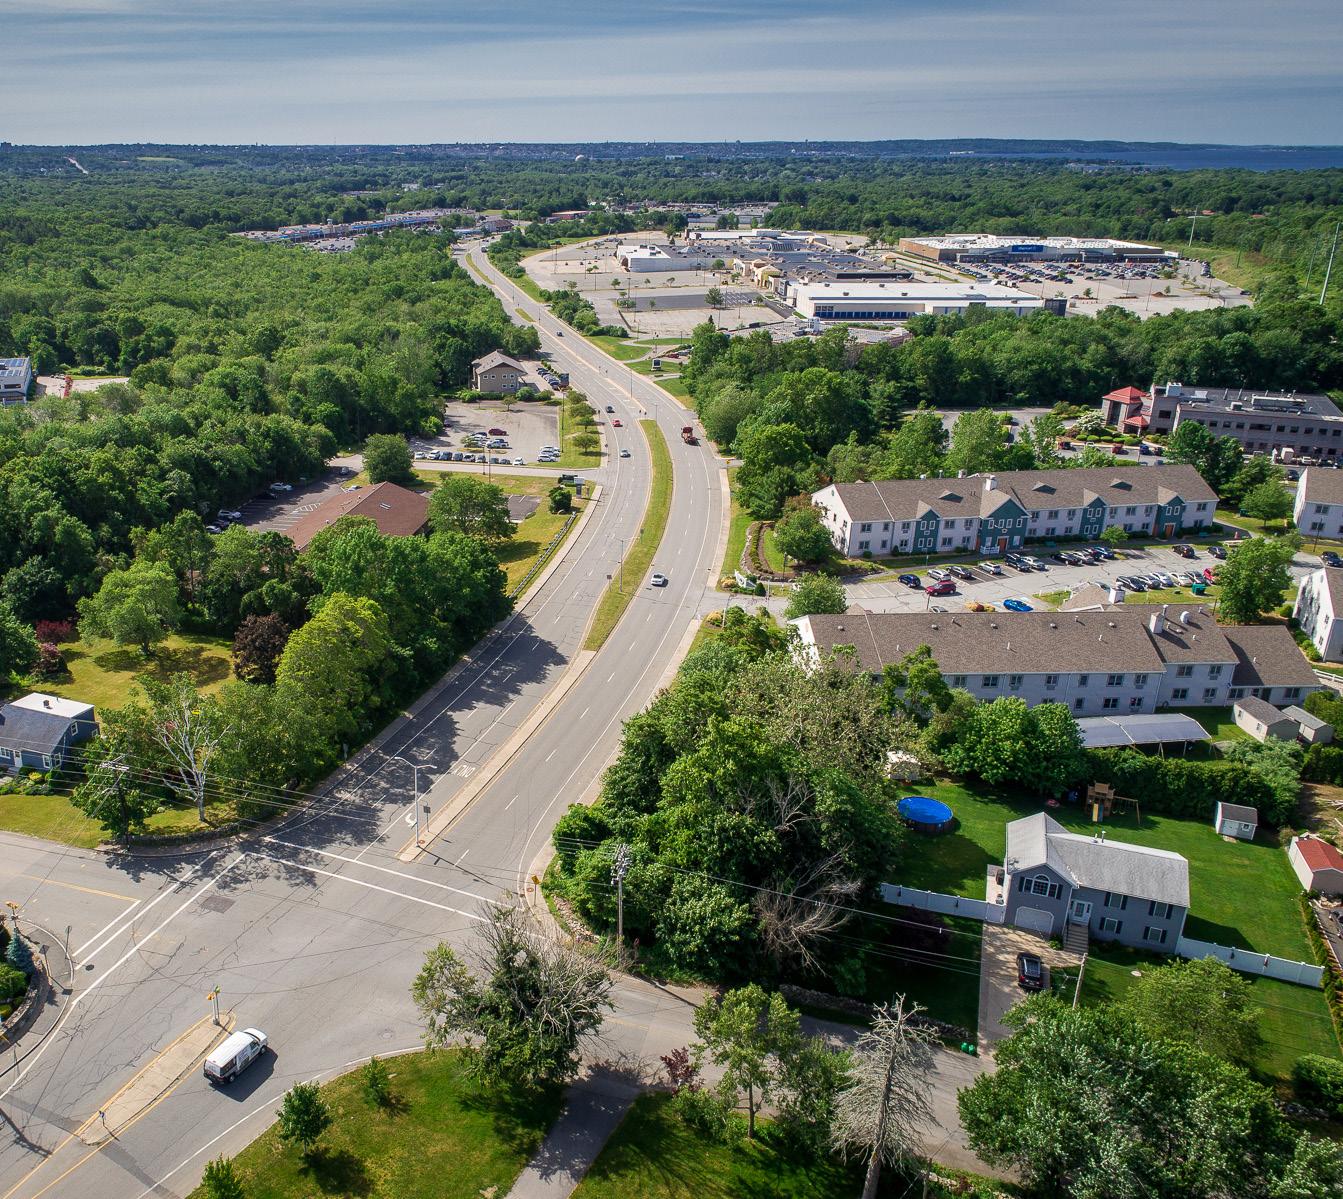
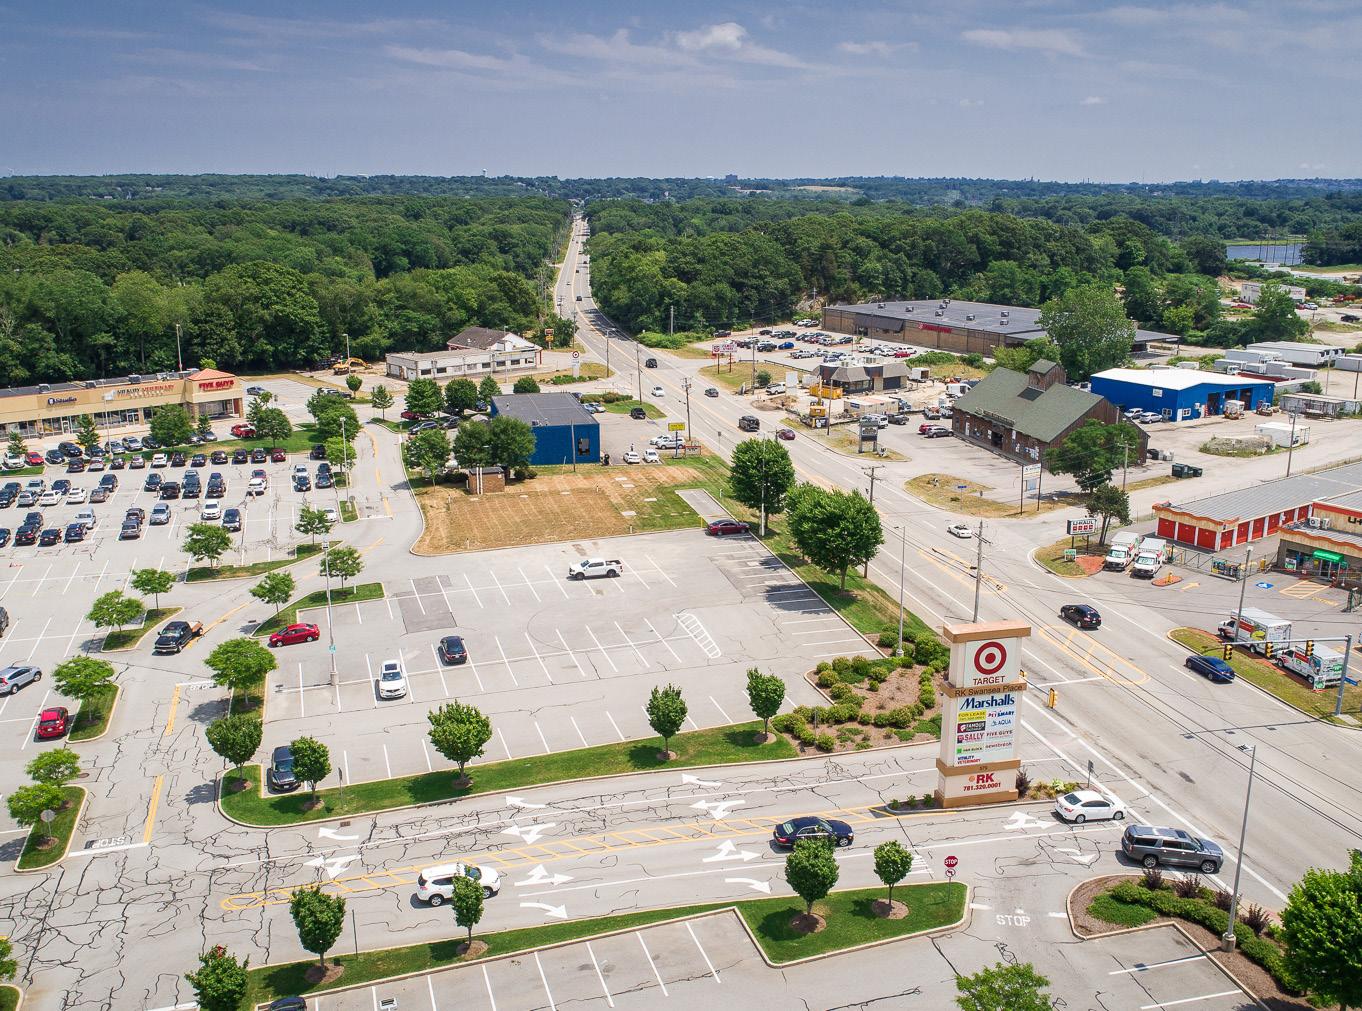
Anticipating development along the Routes 6 and 118 corridors, Swansea seeks to examine zoning, policy, and programmatic changes to achieve the best uses and foster economic development. In 2018, the Economic Development Administration (EDA) awarded the Town of Somerset funding to work with Swansea to negotiate an inter-municipal agreement to extend sewer service along the Route 6 Corridor, and eventually Route 118.
Currently, the lack of sewer and water along Route 6 precludes new development and/or redevelopment, ultimately, preventing private investment and employment opportunities in Swansea and the region overall.
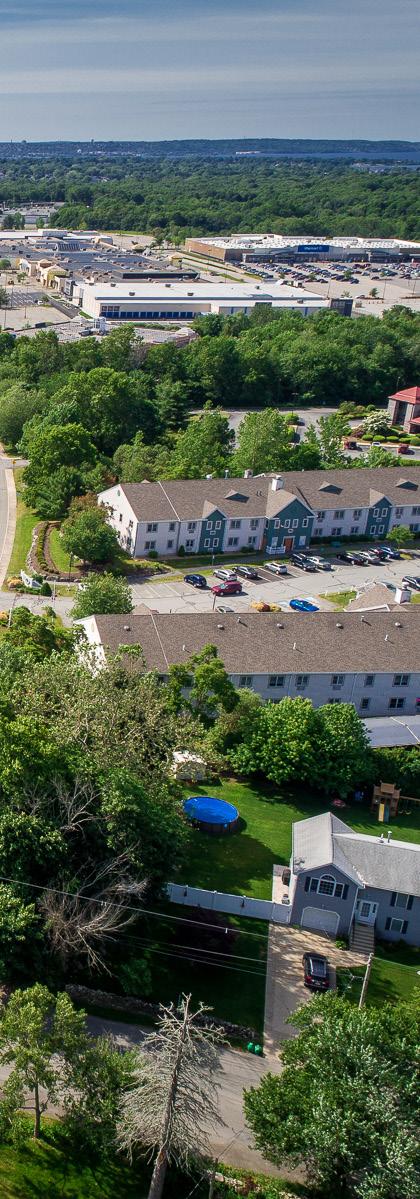
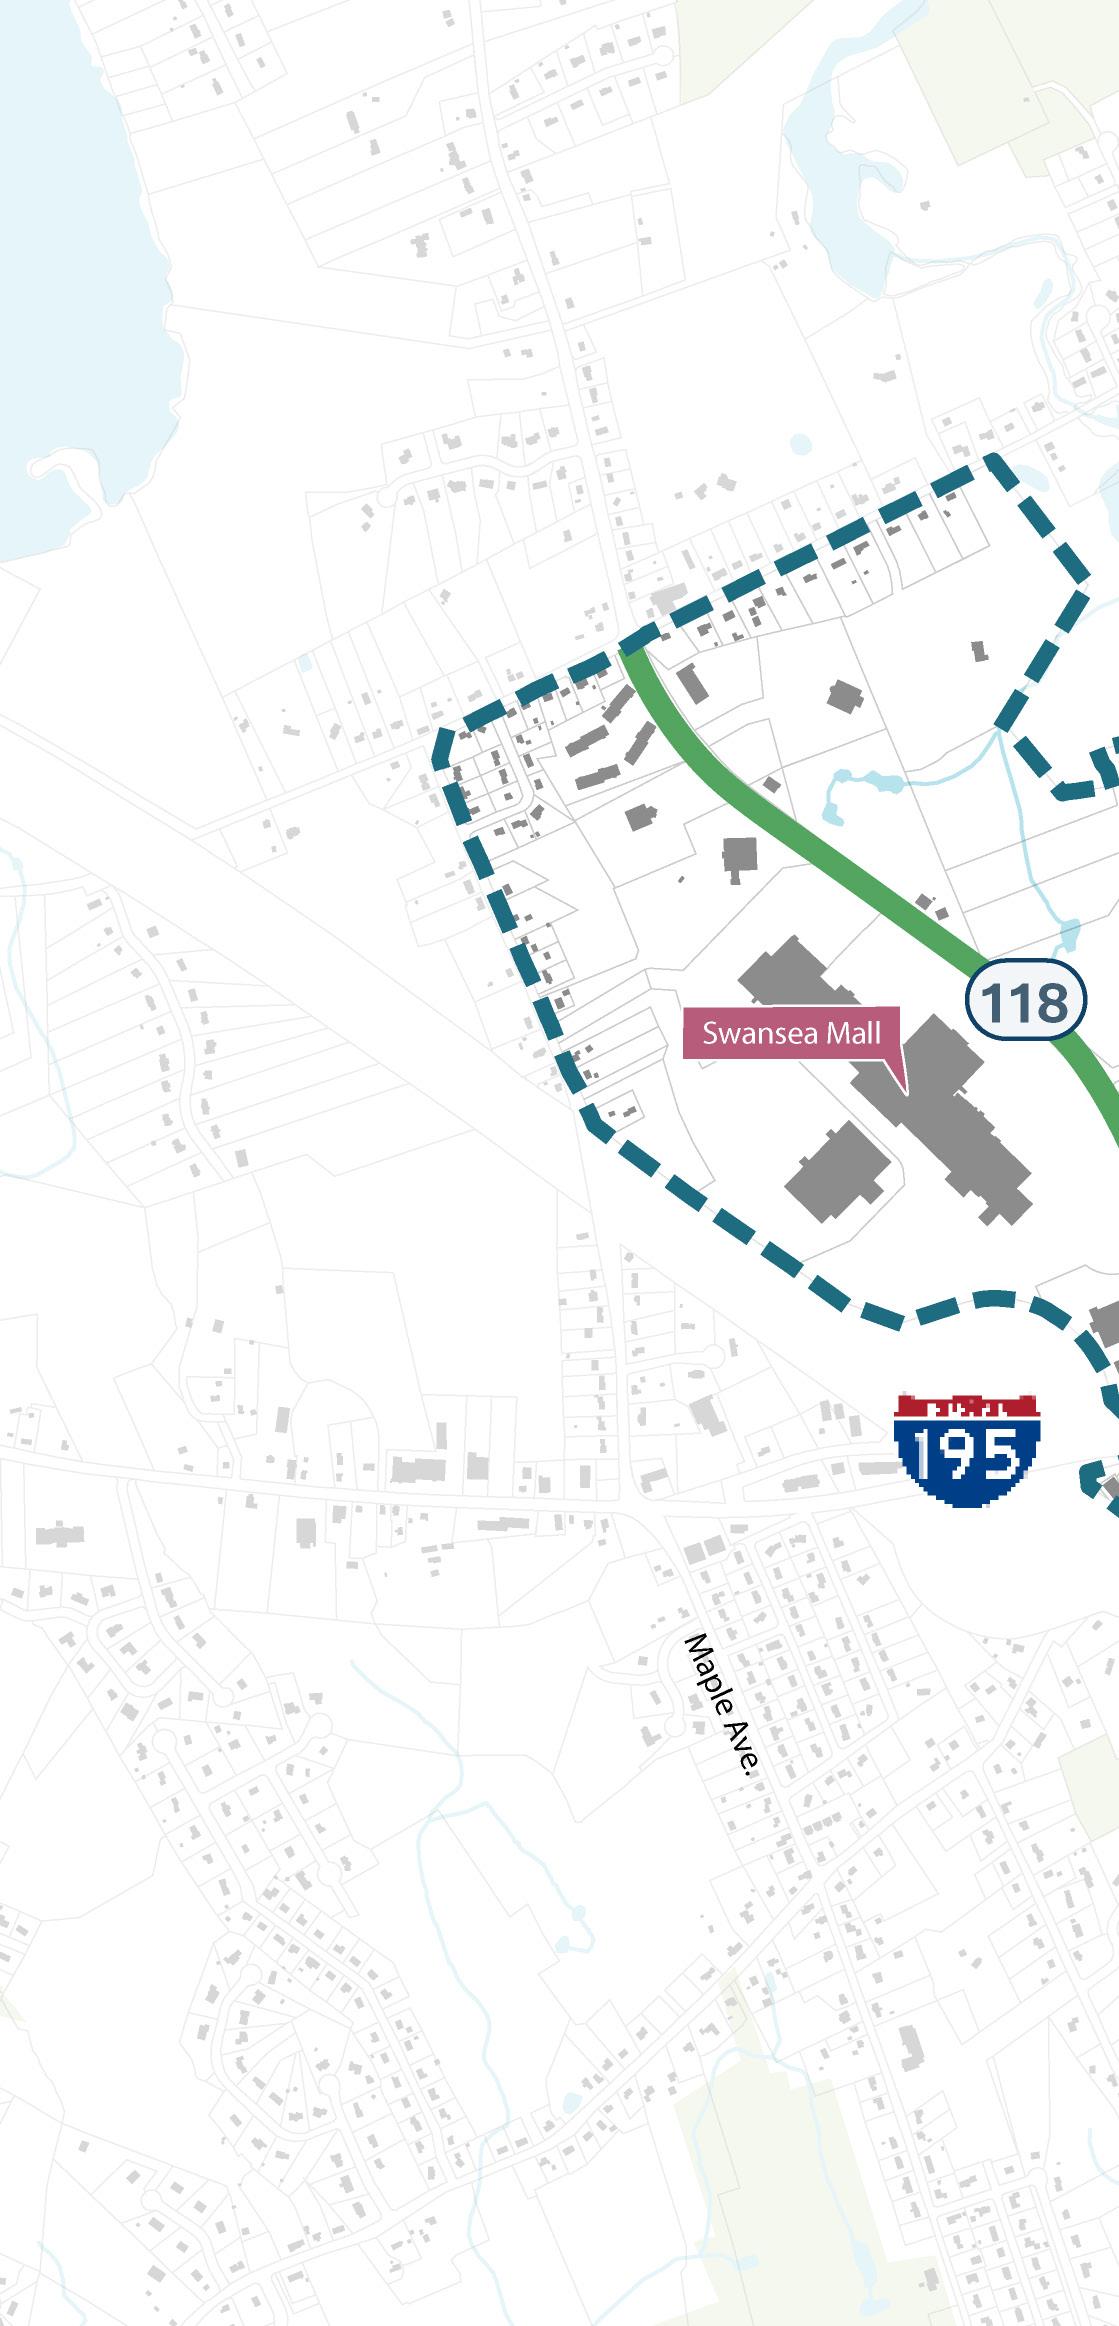
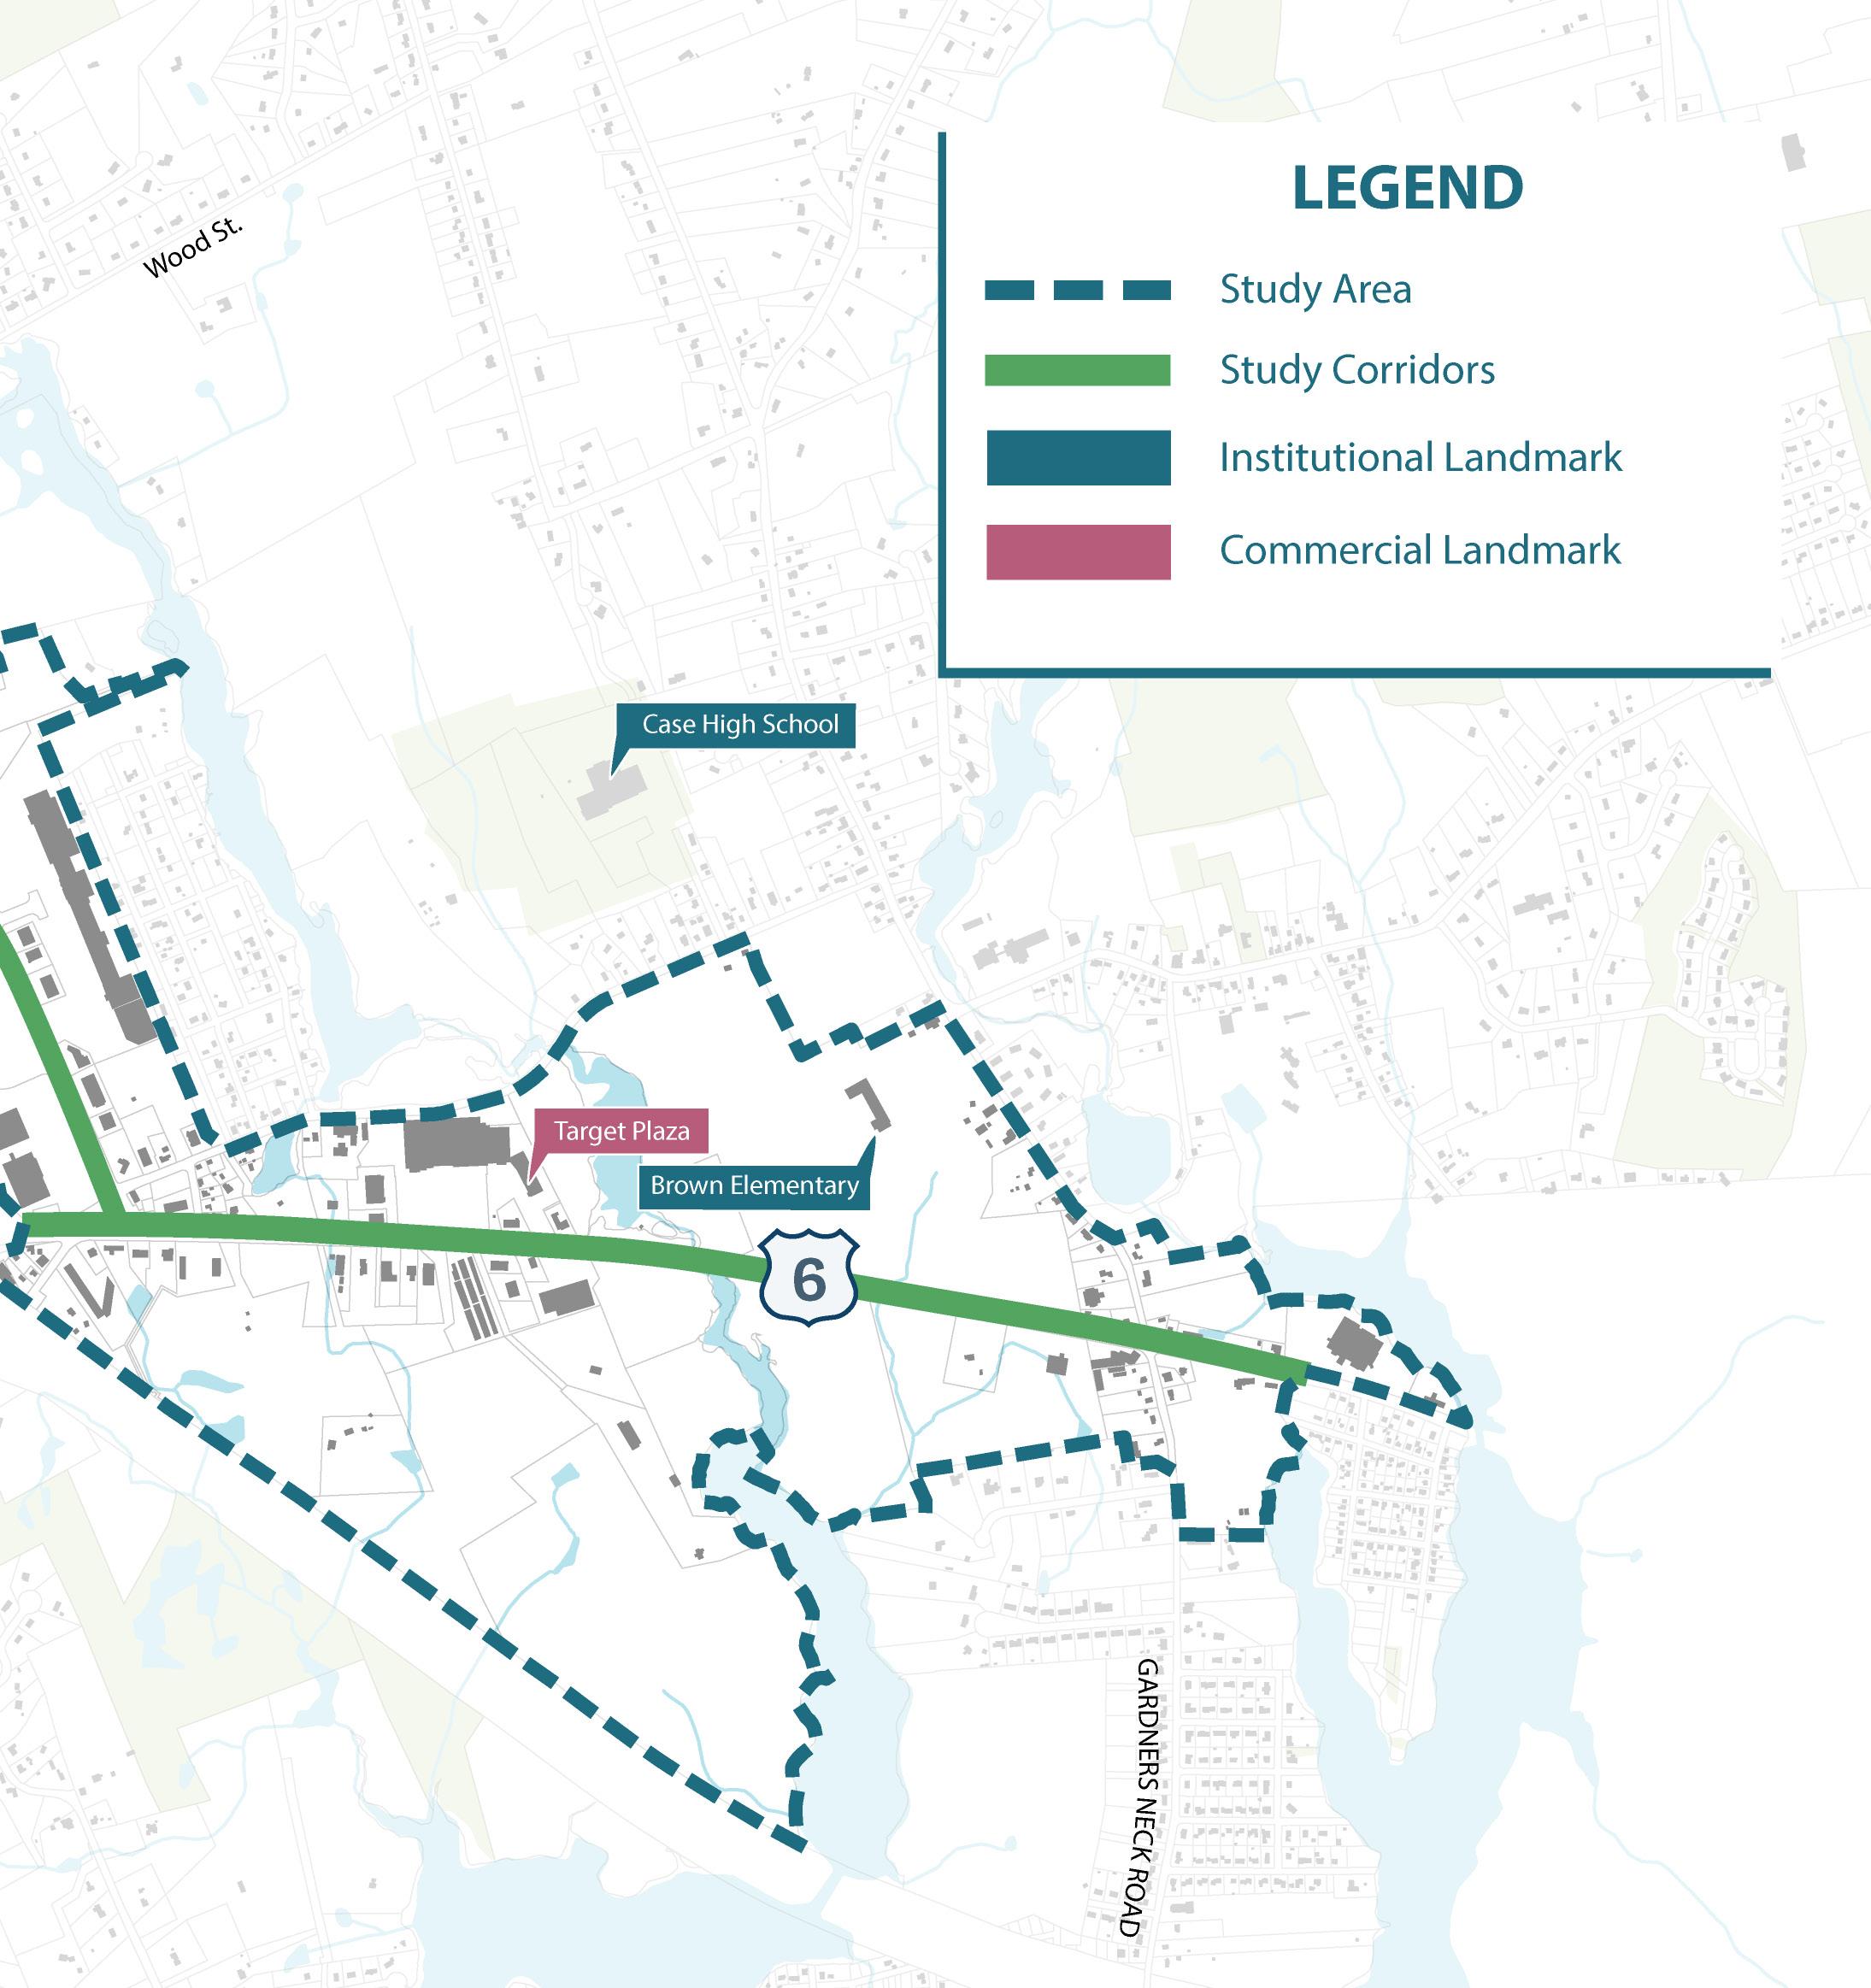
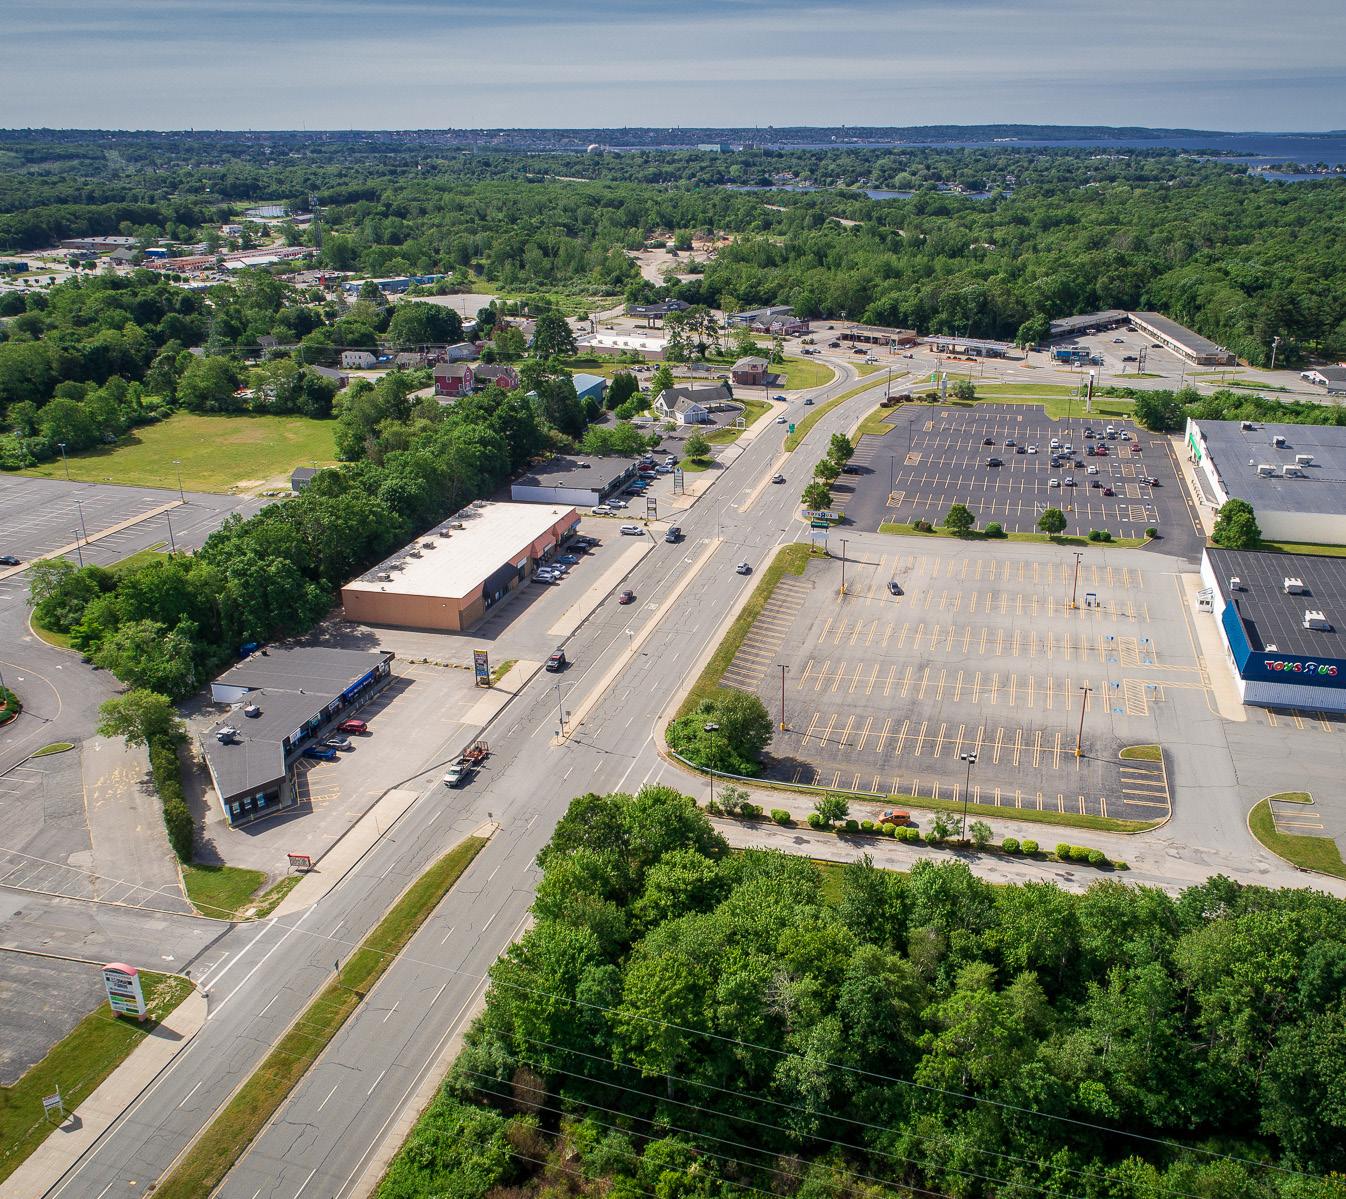
The study area consists of the commercial corridor that traverses Route 6 and Route 118. This project identifies an inventory of project-ready sites for redevelopment targeted for private-sector investment in industrial and commercial projects, while supporting the conversion of underutilized properties and obsolete facilities into modern, tax-generating uses.
To best craft recommendations, this study considers the recent trends and data that affect economic outcomes. Existing conditions explore demographics - to understand Swansea’s workforce and buying power - and economic trends. Utilizing the State and nearby Providence Metropolitan Statistical Area (MSA), which is made up of Rhode Island and Bristol County, MA, this study compares Swansea’s statistics to get a sense of its role in the region.
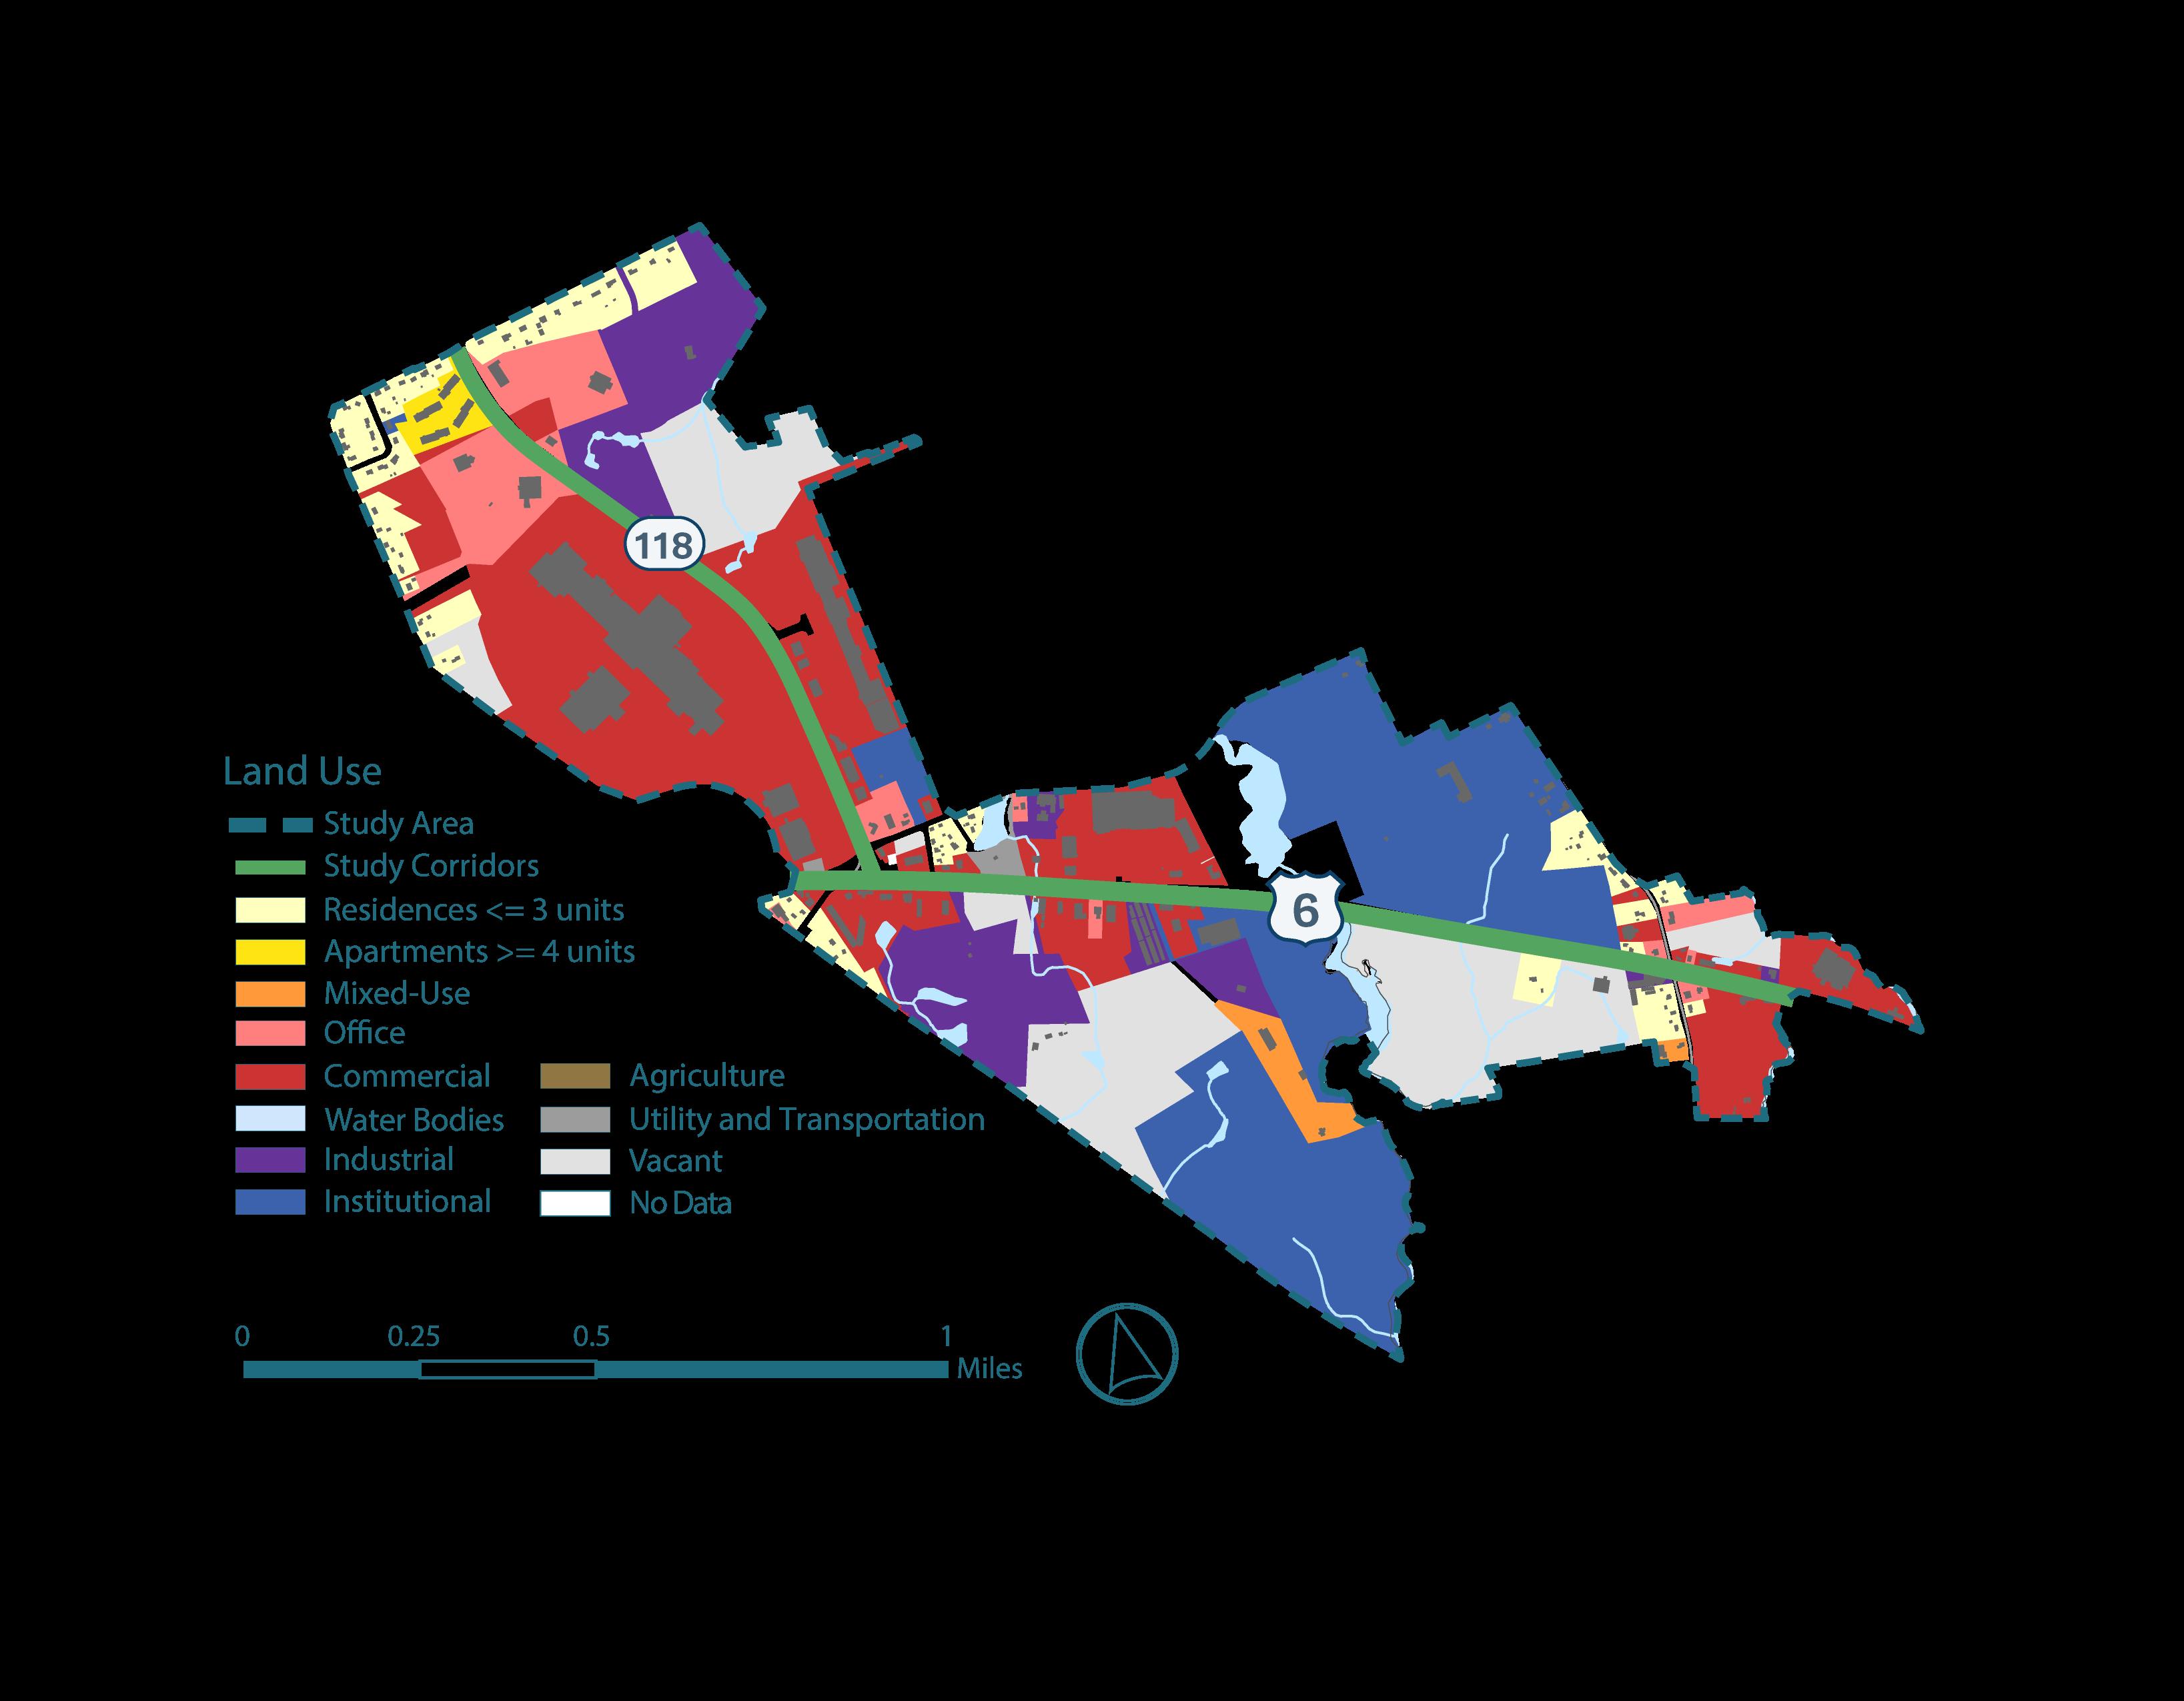
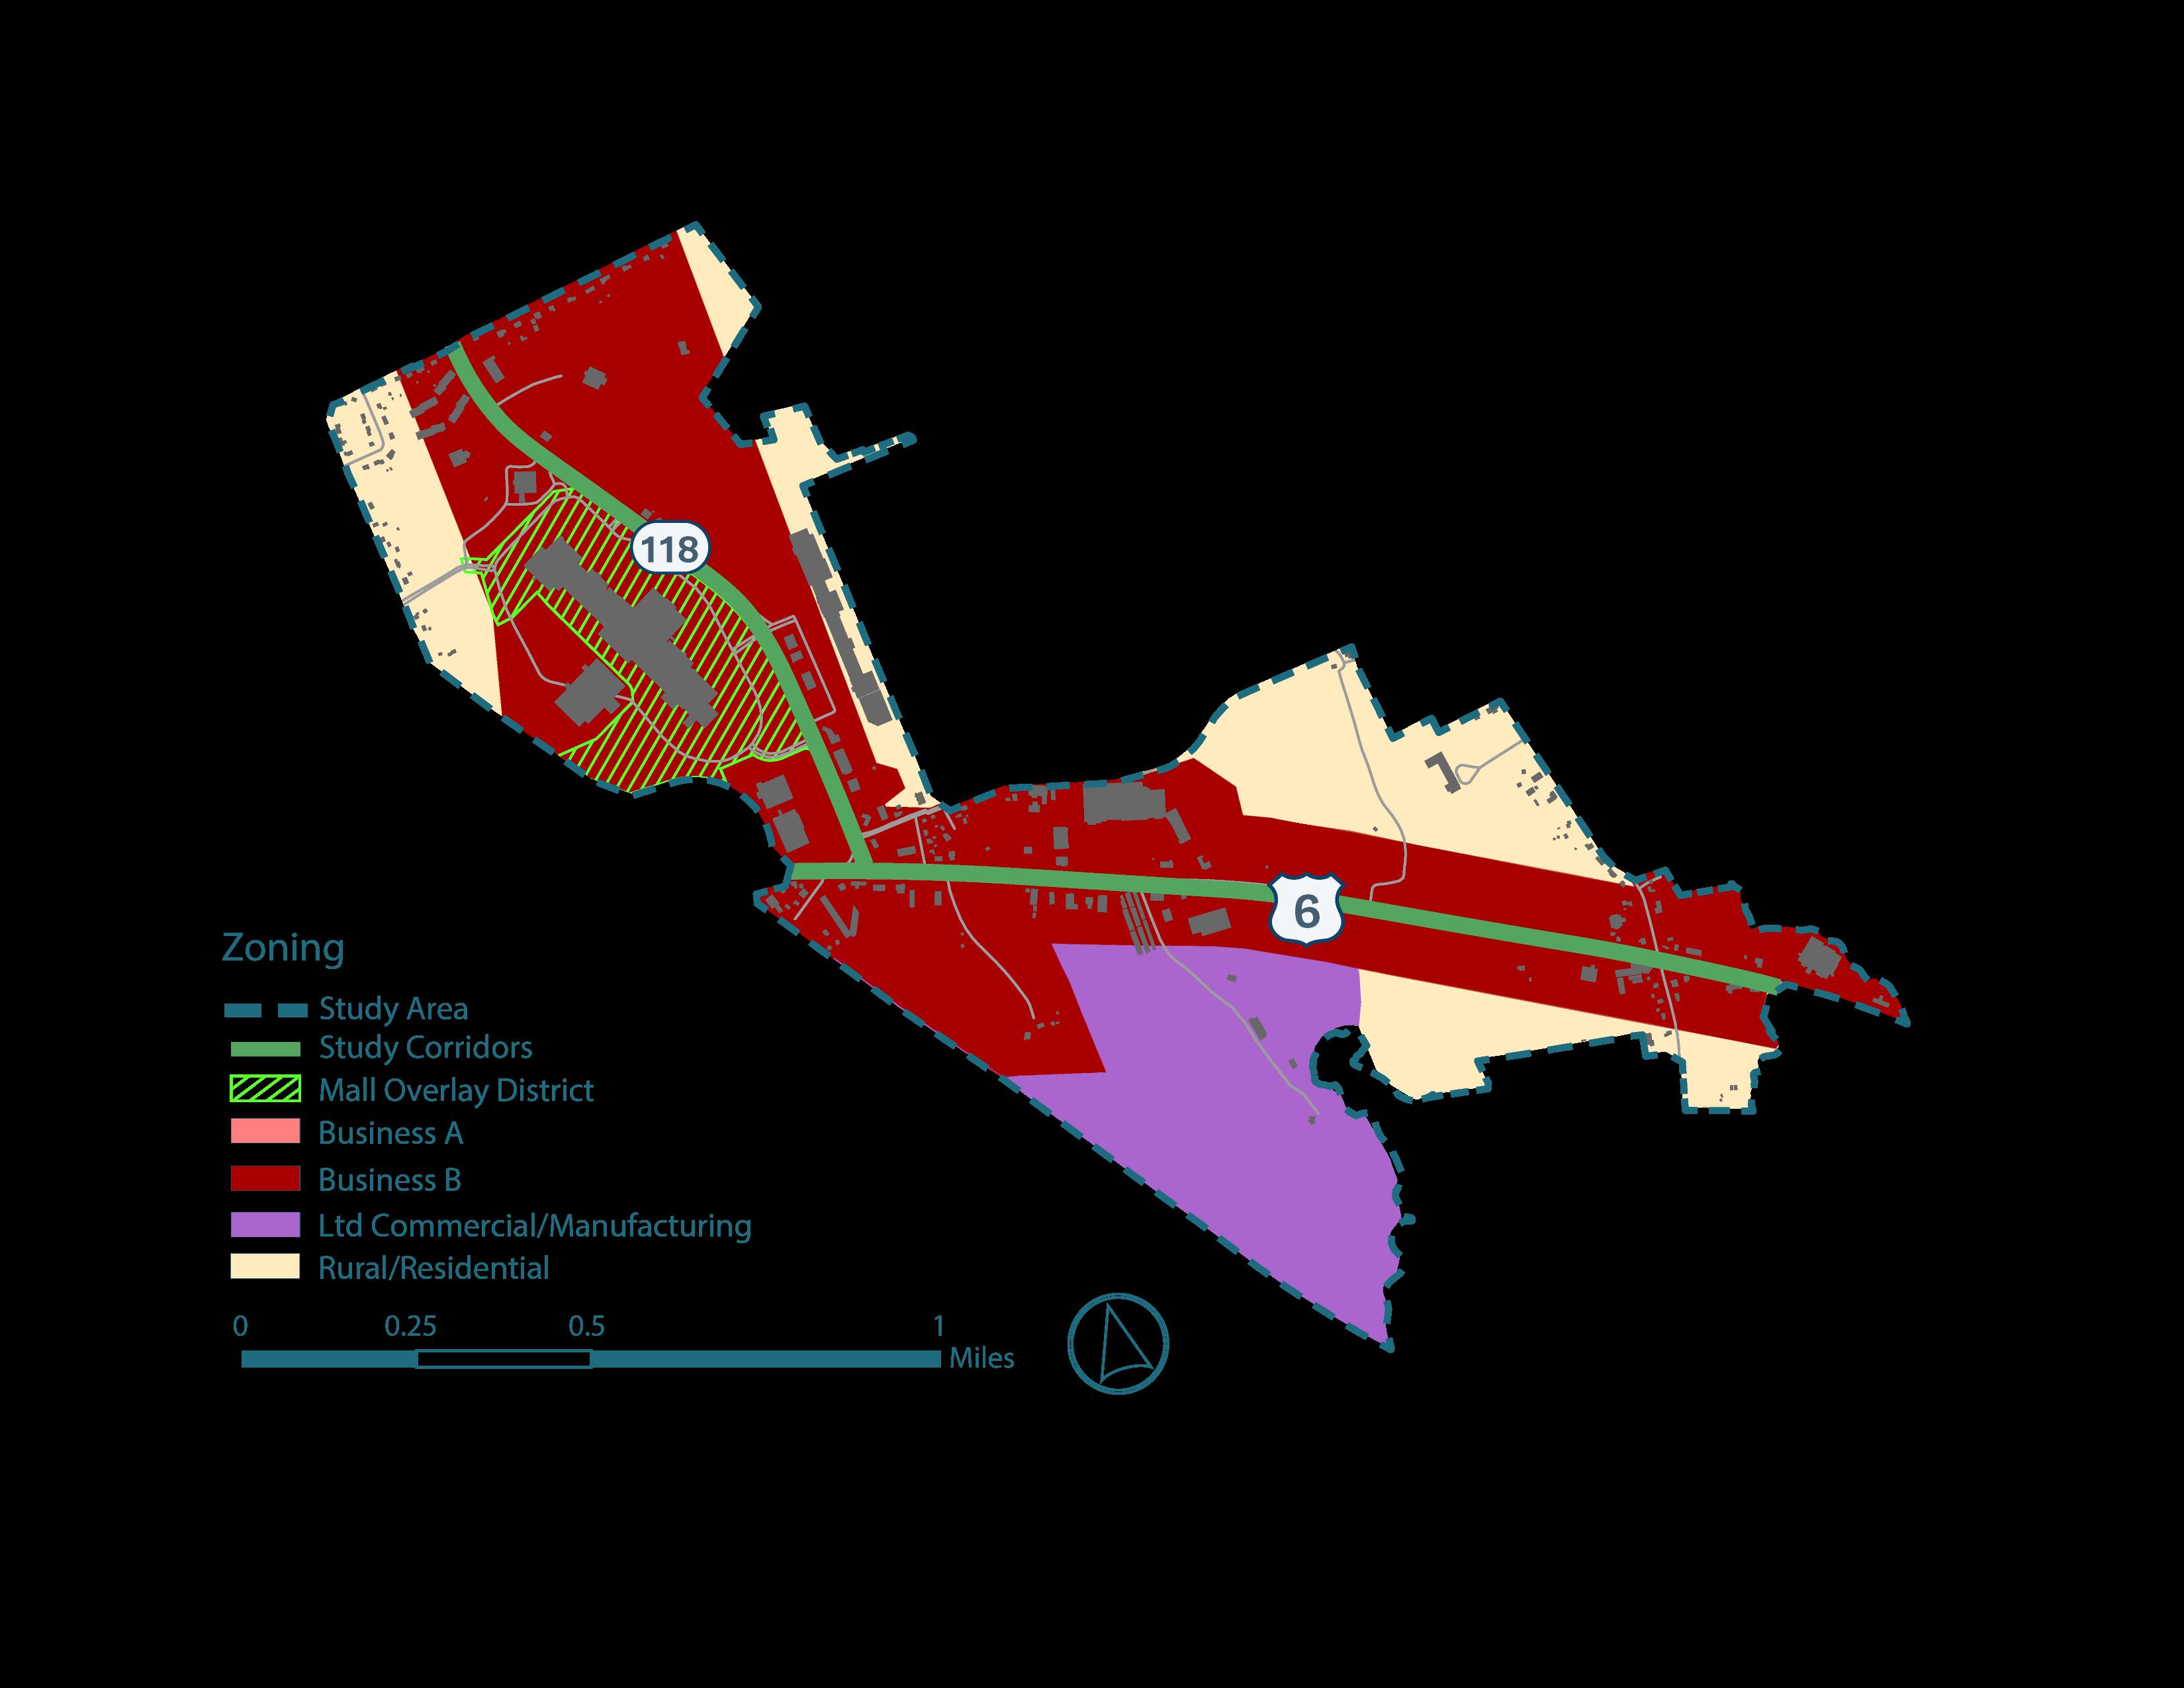
To understand Swansea’s existing and future economic development potential, this study considers land use and zoning, among other spatial data to project growth.
Land use analysis reflects existing development patterns and natural spaces. Zoning, on the other hand, is the town’s legal requirements for the kinds of allowed uses and intensities (such as heights and lot coverage)
in specified areas in town, as well as design and permitting requirements. Together, planning and zoning are powerful tools to guide economic development activities.
Land use in Swansea is predominantly residential. Business and manufacturing land uses also make up a small percentage of the Town. Swansea has four zoning categories, each with a distinct purpose. The intensity of uses across each zoning type ranges from Rural/Residential, to Manufacturing, to Business A
Zoning described the actual use of individual parcels. Development of the study area is largely business or rural residential, with a concentrated portion of light industrial uses at the core.
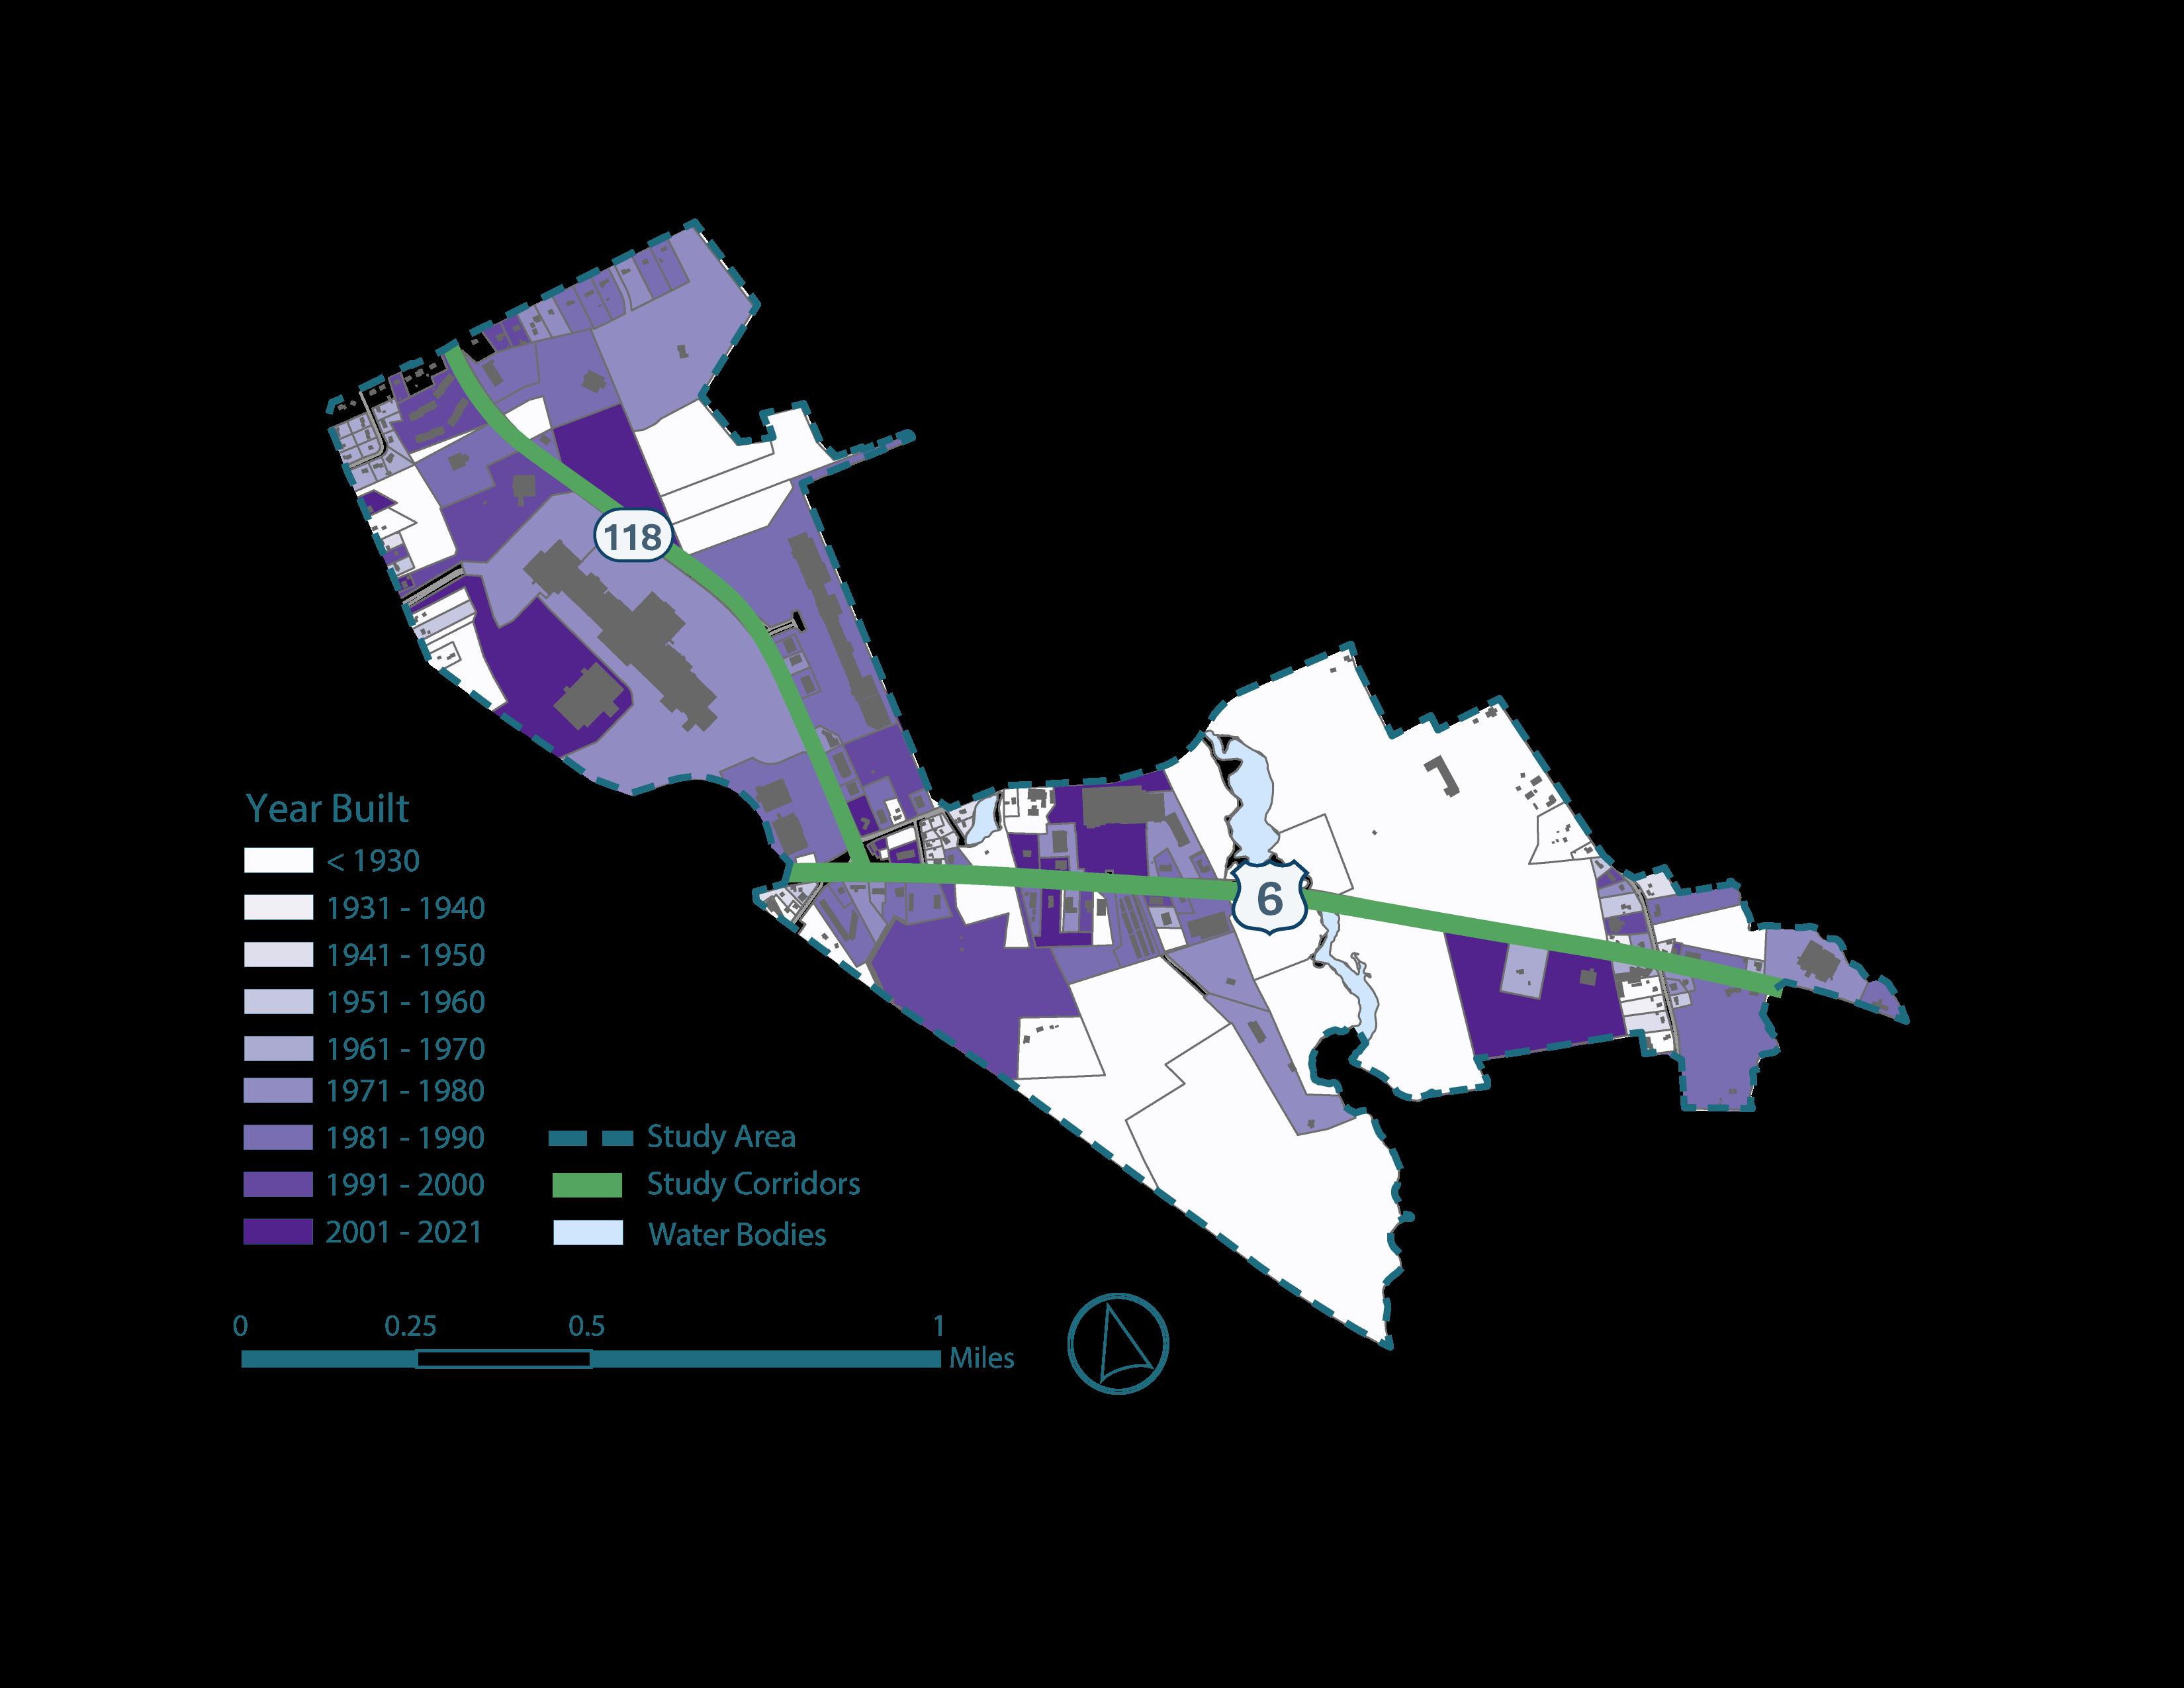
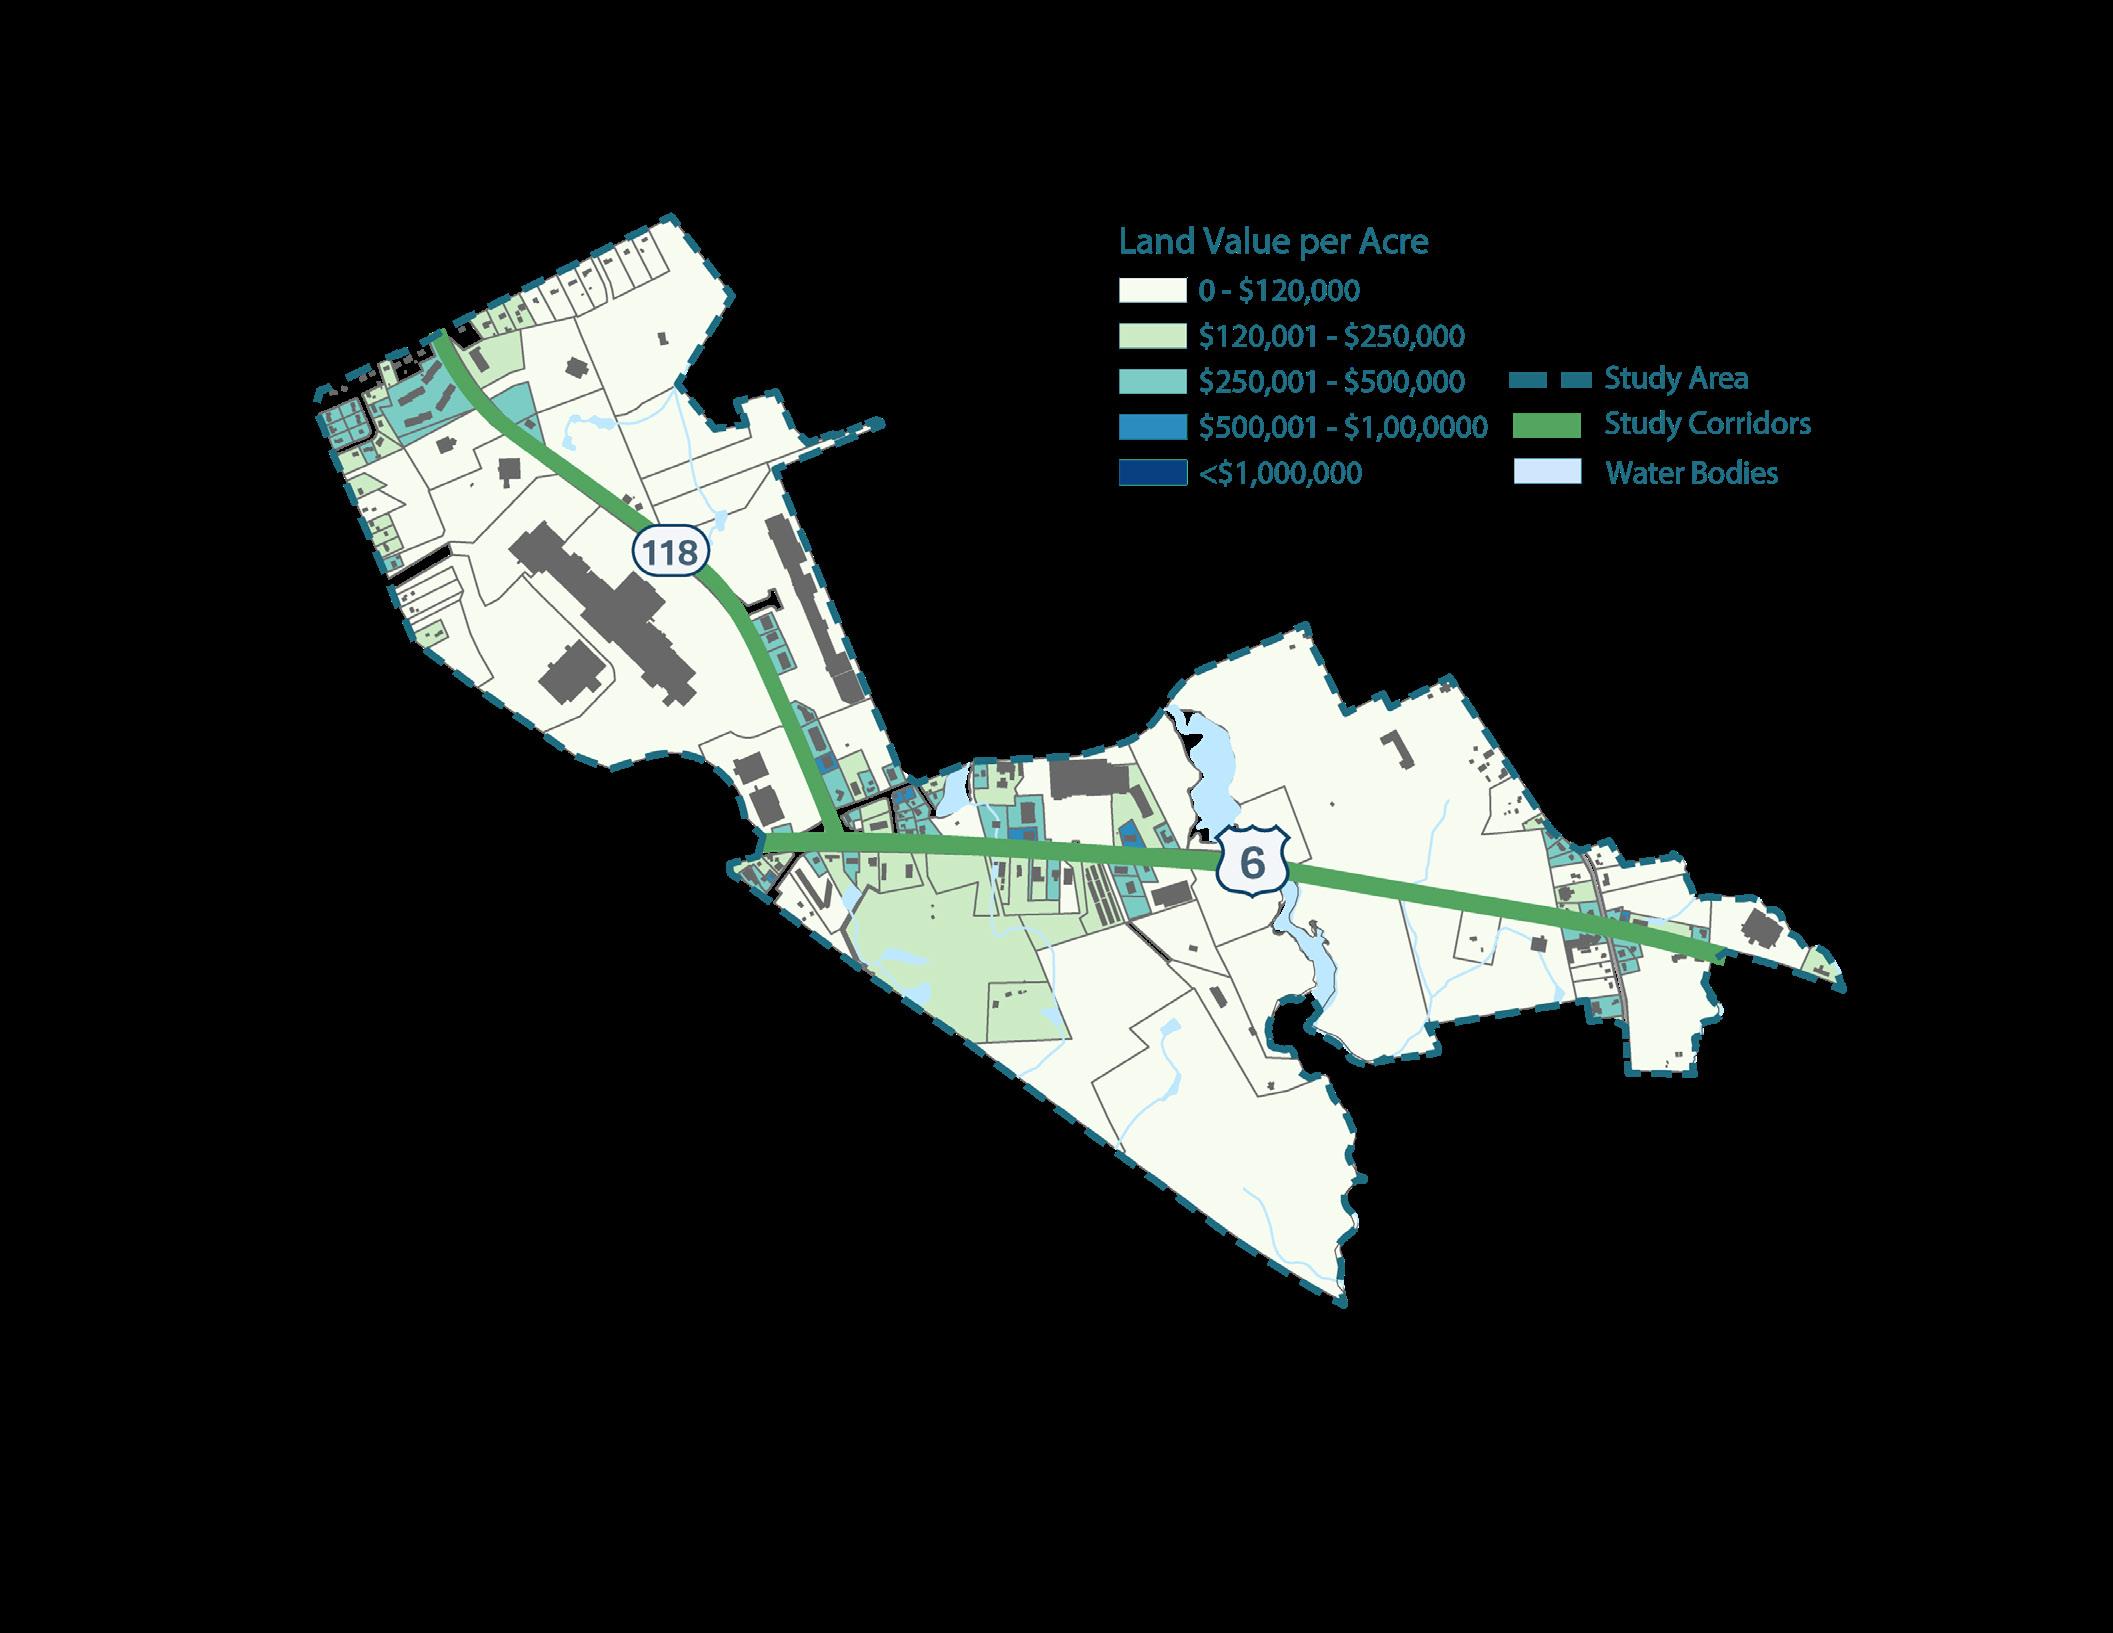
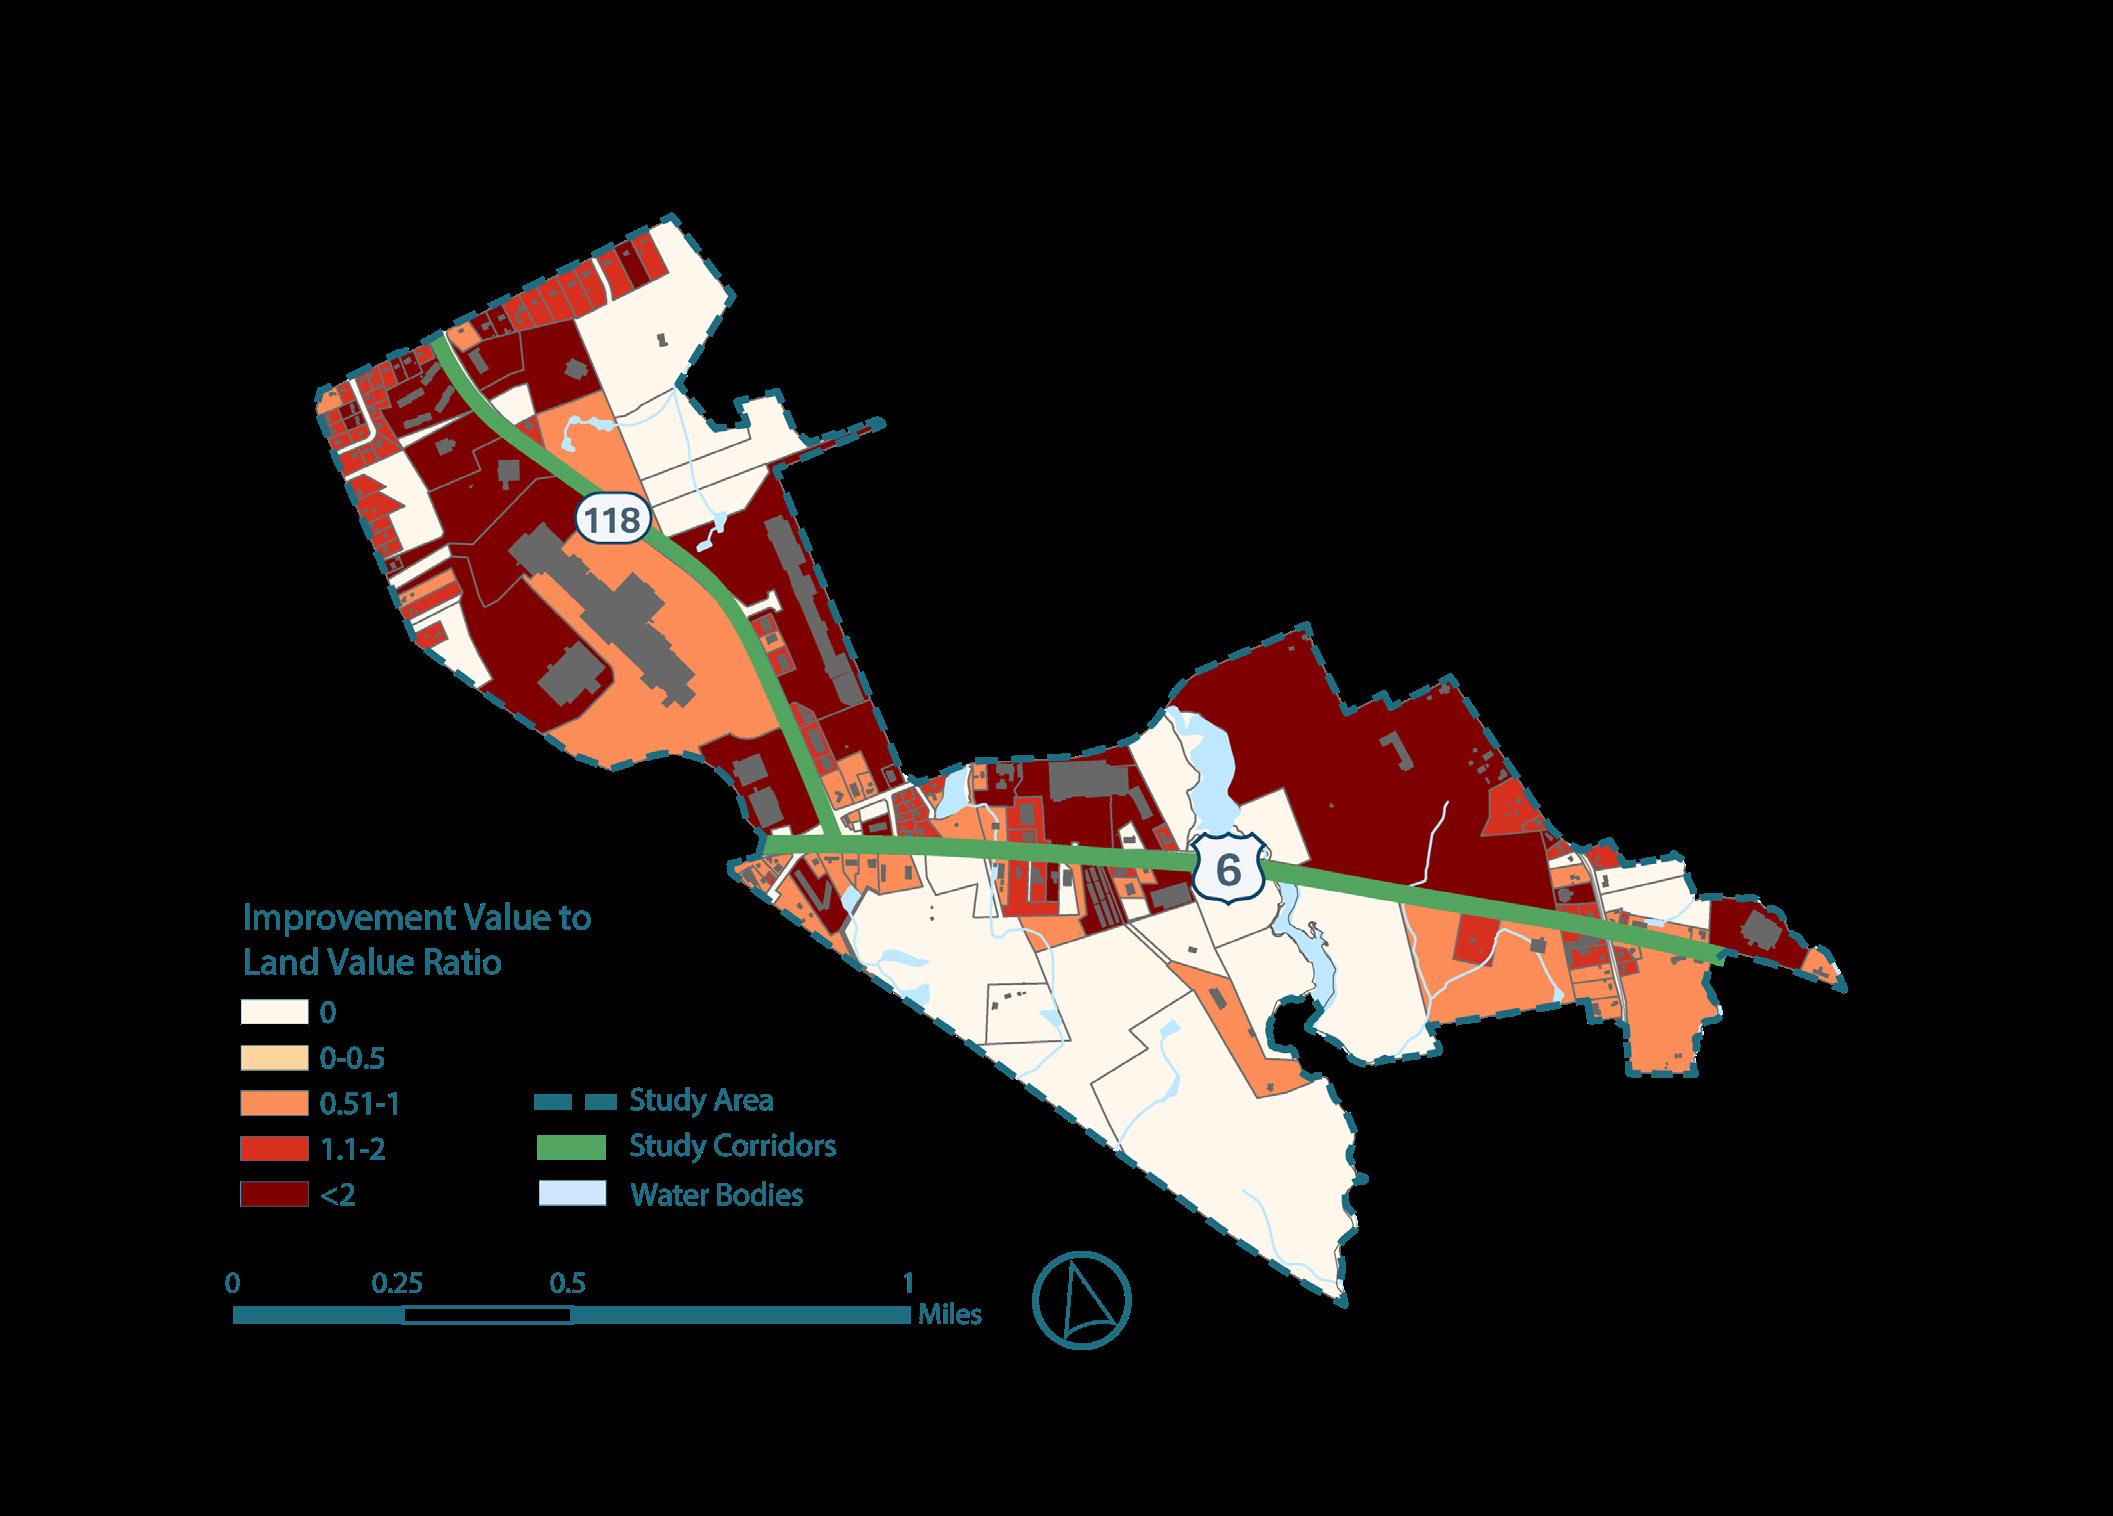
Spatial data can inform development potential by visualizing year built, improvement to land value, and the level or underutilization of a given site.
Assessors data projected on the study area shows that 43% of the Corridor was built between 1960-1990. The average life of a physical building and its use is about 30 years. Many sites in the Corridor may be at the precipice of change given their age and a shifting economy,
Land Value per Acre analyzes parcels based on their value at a comparable scale. Currently, very few parcels in the study area are considered high-value. Those sites are predominatly active and occupied, such as RK Swansea Place. Conversely, the largely vacant mall and strip mall have low values. However, this could change with new occupancies and additional public investments into public water and sewer.
Improvement Value to Land Value Ratio reveals which parcels are under-utilized from a development perspective. The southeastern portion of the study area is the most underutilized. Site vists confirmed the lack of development in this area and the potential for new growth. Given that these sites are zoned for light industrial and manufacturing, these pose the greatest potential for tax revenue generation. Sites with minimal or no existing building footprint offer the most feasible
Swansea’s demographics provide a window into who is living, working, spending, and going to school in town. Swansea is made up of 17,000 residents, growing about 7.5% from 2010-2020. Like many municipalities in Massachusetts, the Town’s population is aging, and household sizes are decreasing. In fact, Swansea’s median age is nearly 5 years higher compared to the State and Providence Metrovpolitan Statistical Area (MSA). During that same timeframe, Swansea’s household size decreased 1.6 percent, a rate or change that exceeds, but mirrors trends in the State and greater MSA, though.
As household size shrinks, Swansea’s school enrollment is also decreasing. Over the last 10 years, school population size decreased 3.7%. The elementary school population aged into middle and high school during this timeframe. Swansea has the lowest share of residents with “Higher Level” education compared to the State and greater MSA.
Household Size
Like many communities across the Commonwealth, Swansea’s housing values and costs are increasing. The town’s housing market saw steady increases in the median sale price for all housing types over the last 10 years. Housing sale volumes have also been steady over the last decade, except for the last 4 years which experienced decreases since 2019.
For the sake of this study, this data showcases Swansea as a desirable community for people to live in. From this data, the project emphasizes the importance of mixeduse zoning practices in expanding economic growth in specific areas of the Corridor, which are covered later in this plan.
$600,000
$500,000
$400,000
$300,000
$200,000
$100,000
$0
Households eligible for varying forms of
Context of Swansea’s economy is key in determining and guiding potential growth scenarios. Examining Swansea’s tax revenue, while simultaneously comparing with nearby communities, can shed light on the Town’s strength, weaknesses, and opportunities.
As with all communities, Swansea generates revenue and operating funds through local property taxes.
Thanks to its split tax rate, Swansea’s commercial and industrial tax base is larger than nearby towns - roughly 16% of the total levy. Like many other towns, most of Swansea’s revenue comes from residential uses. Residential growth contributes to the majority of new tax revenue, while industrial development lags behind. That being said, Swansea’s families bear a small burden compared to nearby communities, with the 2nd lowest residential tax out of its compared communities.
Swansea’s economy is interconnected to various wider markets. Analyzing Swansea’s employment rates and industry share reveal trends that guide future decisionmaking to build on local strengths and address relative weaknesses.
Another important indicator of Swansea’s economic potential is unemployment. Fortunately, Swansea has a low unemployment rate compared to the State and its greater MSA. This likely correlates to job growth over the last decade, which increase by over 300 employees from 2012-2022, or about 9%.
Looking at Swansea’s industries today, the following industries host the greatest share of employees:
1. Retail Trade (28.1%)
2. Health Care and Social Assistance (19.1%)
3. Accommodation and Food Service (9.7%)
4. Educational Services (8.5%)
5. Construction (7.7%)
Examination of the data shows that several notable and rising industries: Manufacturing and Educational Services, experienced net losses in employment over the last decade. These industries continue to represent major economic drivers in Swansea; however declining trends, particularly in these high-wage and skilled industries, are a cause for concern as their impact in Town becomes smaller over time.
Industry data only tells part of Swansea’s economic story. To better understand Swansea’s competitiveness across its strongest and growing industries, we analyzed industry growth compared to the Commonwealth and nearby MSA.
When compared to the state and MSA, most of Swansea’s top 5 industries are not regionally competitive. Only Health Care and Social Assistance and Construction continue to grow at pace with the greater regional economy.
However, Swansea also hosts industries with a growing share of employment that are outpacing the regional economy in:
• Transportation and Warehousing
• Finance and Insurance
• Professional and Technical Services
As part of this study, SRPEDD commissioned FXM to develop a projection of space demand for Swansea’s industries, particularly across the Route 6/118 Corridor. 1
FXM Associates produced a market analysis of the Swansea Route 6/118 study area to determine which industries to highlight in the ongoing Corridor Study. Their key findings include the following:
1. The Corridor study area comprises about 38% of all jobs in Swansea, with Retail representing the largest industry, followed by Health Care and Social Assistance, and Accommodation and Food Services.
2. There are opportunities to develop office space in the study area to accommodate growth in Professional and Technical services, Finance
1 Demographic and Business Characteristics, Market Conditions and Trends, for the Route 6/Route 118 Corridor Study, Swansea, MA
and Insurance, and Health Care and Social Assistance.
3. There are growth prospects for Retail, especially if developed as a part of mixed-use projects. There is an opportunity to capture 70,000 sq ft worth of retail leakage in the Bristol County market area through expansion of existing establishments or new construction.
4. Flex space in Swansea reached its space capacity and has few periods of vacancy. This
To analyze growth beyond job numbers, this study utilized Location Quotient (LQ) analysis which compares the industry’s share of local employment with its share of regional employment. Industries with a high LQ are typically export-oriented industries, which are important because they bring money into the community, rather than circulating money that is already in play, like most retail stores and restaurants. Industries with both high LQ and relatively high total job numbers typically make up a community’s economic base. These industries are important for the jobs they provide, but also for their multiplier effect – the jobs they create in other dependent industries. An LQ above 1 means that there is a greater concentration of employment. While an LQ below one means there is a low concentration of employment.
Compared to the State and MSA, Swansea’s top industries held a larger share of the market, except for Health Care and Social Assistance and Educational Services. Though these industries continue to grow in Swansea, they hold a lower share of employment compared to the State and MSA.
Swansea’s top industry that experienced growth and exhibit higher LQs than the State and MSA was Construction.
These findings are consistent with the FXM analysis and the Town’s own vision for the general scope of redevelopment in the Route 6/118 Corridor. 1 The study area represents a significant proportion of the Town’s employment, and any strategies geared toward the development of specific industries will impact not just the Corridor, but the Town significantly.
1 Demographic and Business Characteristics, Market Conditions and Trends, for the Route 6/Route 118 Corridor Study, Swansea, MA
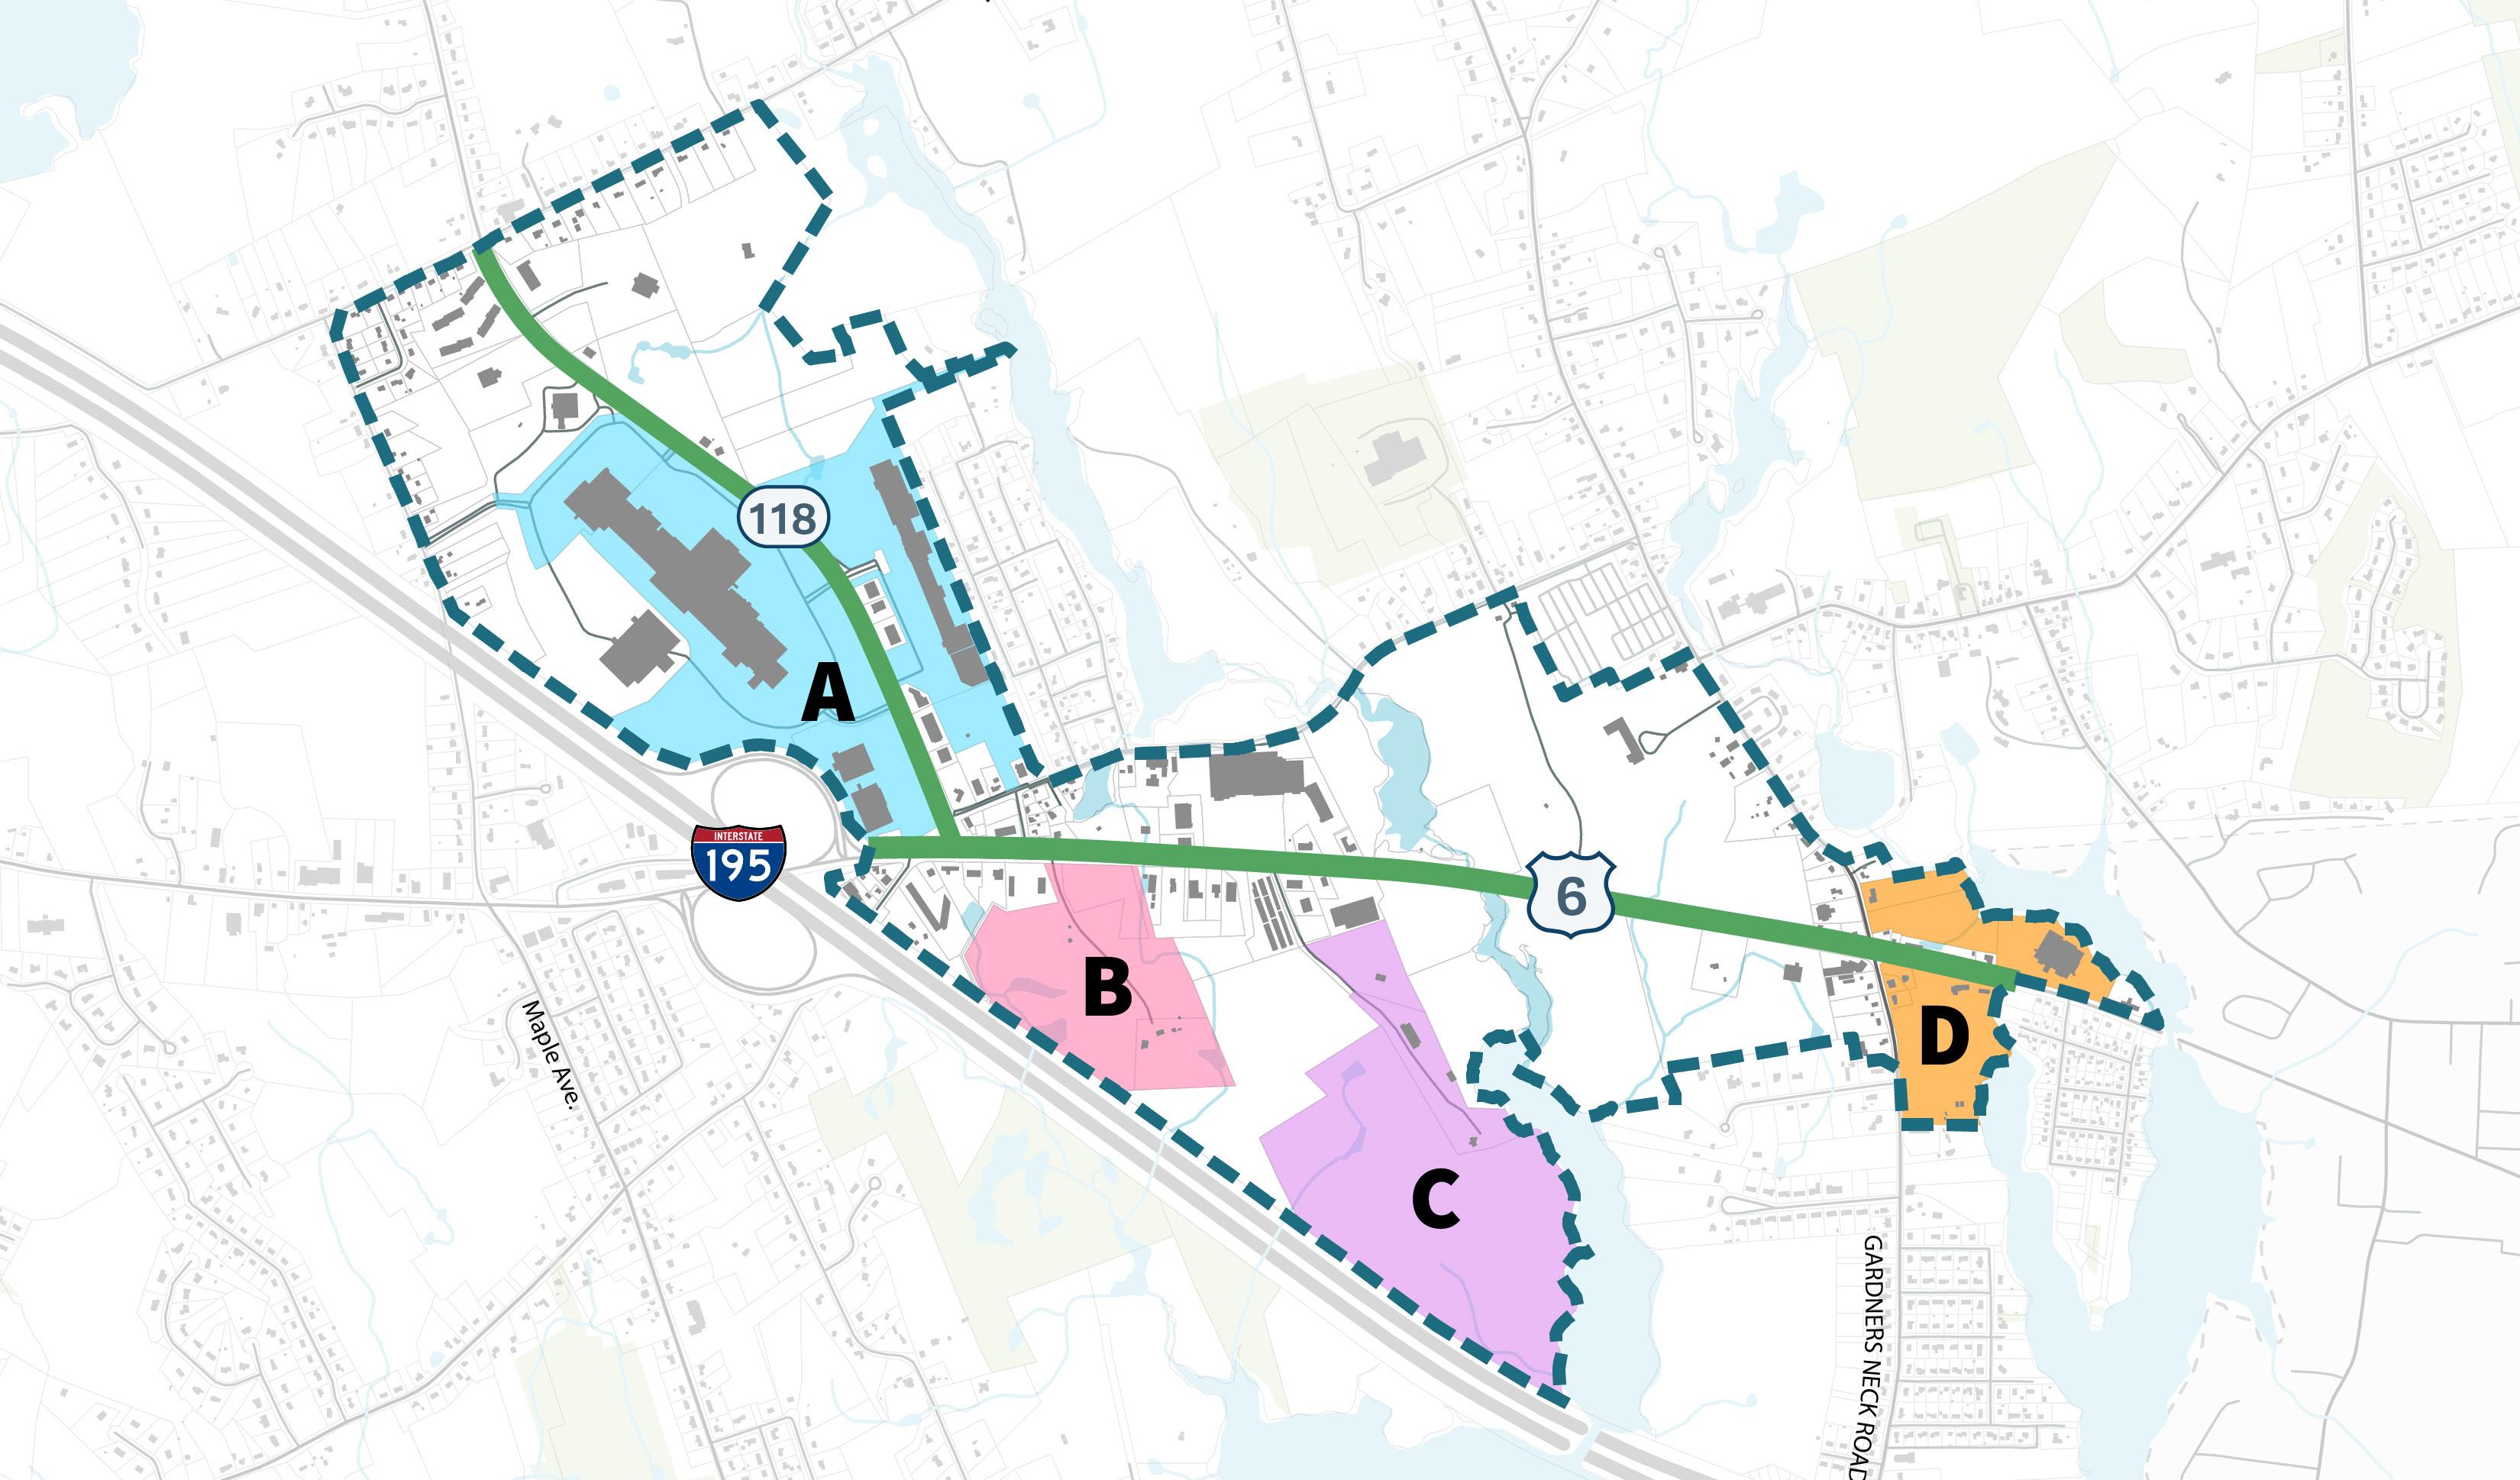
Based on the conditions of study area, the following areas represent Key Sites for development and redevelopment. This includes the potential for infill, parcel assembly, and reconfiguration.
This study considers the public’s development preferences, and where they might be best suited along the Corridor. Utilizing feedback from public engagement, existing site conditions, and the potential impact of future infrastructure changes, this study will craft recommendations for both policy and physical impact.
Based on the combination of SRPEDD and FXM’s market analysis, this study proposes five major “development types” that would be most successful along the Route 6/118 Corridor. 1 These redevelopment types can be categorized as healthcare/services, light industrial, industrial, artisan, and neighborhood.
1 Demographic and Business Characteristics, Market Conditions and Trends, for the Route 6/Route 118 Corridor Study, Swansea, MA
Based on a variety of factors including Town and public feedback, industry trends, and the Space Demand & Market Analysis, this study considered the real potential for development upon Key Sites in town. 1
The following Key Site (A-D) profiles explore the flavor of redevelopment best suited for each site based on physical conditions, spatial layout, and market demand. Vision Statements accompany each profile, detailing growth potential, major activities, and outcomes. 1Demographic and Business Characteristics, Market Conditions and Trends, for the Route 6/Route 118 Corridor Study, Swansea, MA
The table below provides estimates to visualize the ways in which redevelopment might generate employment, broaden the town’s commercial tax base, and generate additional wealth in the community. The development scenarios directly respond to resident and public feedback calling for sensitive development types that meet a greater variety of needs. Regional examples listed, ground the vision in a not-so-distant reality. This ensures that there is also avaiability of relevant expertise in the labor pool, job densities, as well as comparable land and building values.
The redevelopment of the Swansea Mall Complex is well underway. Bradey Sullivan proposed residential development along the Swansea Mall Complex in 2019, bringing new housing and retail opportunities for surrounding underutilized parcels to the west and south. Given incoming residential applications across, the road, Site A can accomodate additional residential uses through office and mixed-use. Home to the former Swansea Movie Theater and Toys R Us respectively, these parcels have great potential given existing structures as well as infill potential within large parking lots. Due to its proximity to neighborhoods and upward trends in Office centric industries, this site would make an ideal fit for Healthcare & Services redevelopment.
The Space Demand & Market Analysis reported that office space supply remained unchanged since 2006 and trends in Town and Bristol County are showing strong increases over the last few years despite the COVID-19 pandemic. These trends in Town and Bristol County differ from what is being observed in Boston, and represent an opportunity, especially in a market with increasing demand and stabilizing vacancy rates. 1
Developers can take several paths to expand office space supply at this site including, redeveloping the existing structures and/or developing new infill buildings in the parking lots. Industries such as Professional and Technical services, Finance and Insurance, and Health Care and Social Assistance have seen an increase in employment in Town over the last 10 years, and with this increase comes demand for office space.
1 Demographic and Business Characteristics, Market Conditions and Trends, for the Route 6/Route 118 Corridor Study, Swansea, MA
Site Information
Current Zoning Business B, Rural, Residential
Current Overlay Districts N/A
Active Use Retail, Storage; large sections underutilized
Size 43 acres
Constraints Split zoned parcels, no water/ sewer infrastructure.
Potential for Redevelopment High
Development Scenarios
Precedent Growth
Proposed Bike Path
Swansea Is well known for its retail industries on the Route 6/118 Corridor, but the Town should support other industries to diversify and strengthen the local economy. The Town should target industries with low vacancy rates and high demand throughout the region. The Space Demand & Market Analysis determined that Swansea has ample ground to expand its supply of flex space.
Flex space, as its name suggests, is a versatile use type that can be described as a hybrid of lab, warehouse, light manufacturing, or office uses. Flex space is in high demand locally and nationally with nearly 160,000 sq ft worth of absorption potential countywide, according to CoStar. The Space Demand & Market Analysis determined that Swansea’s flex space experienced few vacancies since 2011, representing a major opportunity for the Town. 1 The development of flex space would support the Town’s desire to diversify businesses in the Corridor.
1 Demographic and Business Characteristics, Market Conditions and Trends, for the Route 6/Route 118 Corridor Study, Swansea, MA
Site Information
Current Zoning Business B, Manufacturing
Current Overlay Districts N/A
Active Use Gravel pit, underutilized
Size
37 acres
Constraints No infrastructure
Potential for Redevelopment High
Development Scenarios Building
The southeast area of the study area represents some of the most underutilized parcels in the Corridor with the greatest development potential. Through strategic planning, these parcels represent an opportunity to create more productive, taxable parcels.
Site C can accomodate a mulititude of develpment types that leverage growth trends and adjacent Cole River. Parcels around the River were not developed with connections to nature specifically in mind, however the Town has a chance to propose development that enhances accessibility. This site, which abuts Site C, lies right on the Cole River, to the south of Route 6. Still, the area is primed to accommodate natural connections through innovative zoning to jump start investment in underutilized parcels.
Based on local feedback, residents would positively receive natural connections coupled with craft activities and manufacturing, such as a brewery or coffee roaster, increasing overall foot traffic throughout the Corridor.
Additonally, this site envisions a larger development ideal for Industrial given:
• Proximity to major transit networks, such as I-195 and Route 6;
• Parcels are obscured from the street by natural screening such as trees and favorable topography.
The Space Demand & Market Analysis determined a marked decrease in the amount of industrial site supply with a sharp decrease in tenant vacancy in Bristol County over the last 17 years. CoStar also forecasts a significant increase of 300,000 sq ft in new construction in the County over the next 5 years. 1 This represents another opportunity for Swansea to capture forecasted development, which could generate new revenues for the Town.
1 Demographic and Business Characteristics, Market Conditions and Trends, for the Route 6/Route 118 Corridor Study, Swansea, MA
Site Information
Current Zoning Manufacturing
Current Overlay Districts
N/A
Active Use Car Auction, Underutilized
Size
72 acres
Constraints No infrastructure besides an unpaved service road, former landfill
Potential for Redevelopment
High
Local Business Marketplace
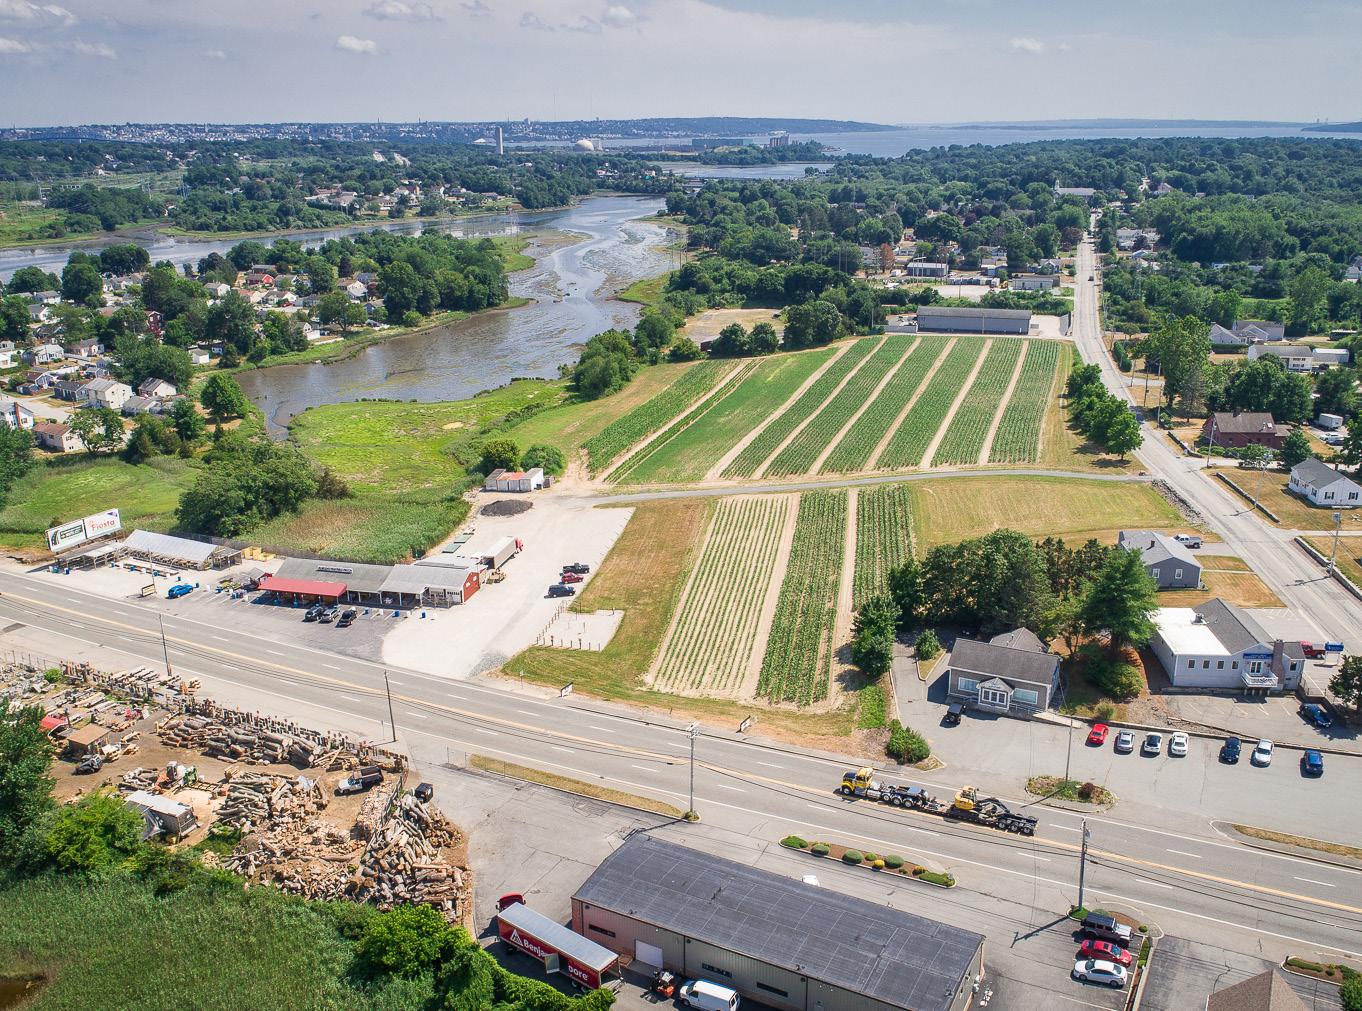
Swansea’s argicultural past is a hallmark of its identity. There are several active farms along the Corridor, including a seasonal produce stand. However, with a changing economy comes the need to adapt. With the impending sale or closure of prominent family farms in the near future, integrating agricultural features into future developments will preserve this history. Parcels on the eastern end of the Corridor represent an opportunity to blend the old with the new. Several of these parcels are underutilized and could potentially form the foundation of a new neighborhood, which could continue to carry elements of the Town’s agricultural past.
Several culminating factors make this site ideal for the development of mixed-use retail and housing, including:
• The presence of underultilized parcels;
• Proximity to valuable natural features;
• Developer interest;
• The timing of future infrastructure projects, such as water and sewer; and
• The timing of availability of parcels for purchase.
The natural features would enable the integration of open space with new development and meet previous Town planning goals.
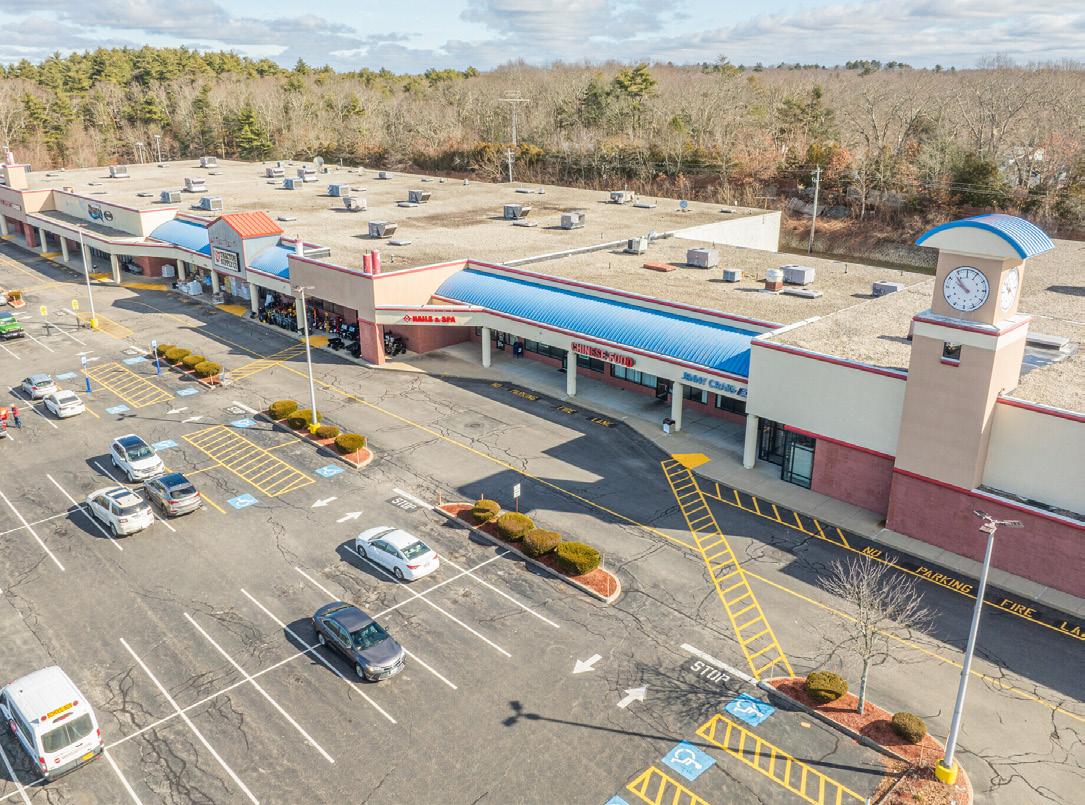
Although Retail has seen a general decline across the three main geographies (Swansea, Bristol County, and Massachusetts) over the last 10 years, this industry still represents an opportunity for the Town because of the desire to develop more mixed-use projects, especially in the eastern side of the study area. Furthermore, the Space Demand & Market Analysis showed significant demand for Retail countywide in the form of 70,000 sq ft of leakage.
Site Information
Current Zoning Business B, Rural/Residential
Current Overlay Districts
N/A
Active Use Agricultural, Retail, Underutilized
Size
29 acres
Constraints High traffic and accident rates
Potential for Redevelopment
High

Scenarios
Based on the Existing Conditions data and trends, Key Sites, and feedback from residents and business owners, this study provides recommendations related to Zoning and Infrastructure . These categories provide a path forward for development and redevelopment along the Corridor.
1 Reduce commercial parking regulations to a level appropriate for each sub-district and encourage shared parking where appropriate.
Parking mandates govern the amount of parking constructed in municipalities to ensure there are enough spaces for patrons. However, in many cases, the minimum parking threshold greatly exceeds dayto-day needs. This is particularly true for shops and restuarants, where minimum parking mandates utilize formulas based on square footage or total seats. In effect, parking minimums assume the busiest times of the day and year for each establishment, creating excess parking that is otherwise valuable real estate.
Route 6 hosts large building footprints that have outsized parking requirements for relatively lowintensity use. The extra buildable space from these high parking minimums, if opened to development, would be an incentive to potential developers looking to build along Route 6.
Considering these factors, the Town should revisit the parking requirements for any existing and proposed overlay districts along Route 6 and consider:
• reducing parking requirements for commercial, restaurants, industrial, and similar uses;
• encouraging shared parking at all commercial spaces; and
• moving parking to the rear of the lot;
These strategies allow developers to accommodate typical volumes and rely on shared parking to provide overflow during peak traffic volumes. Locating parking behind buildings also removes localized traffic circulation from Route 6, reducing time consuming turning movements that can inhibit the flow of traffic along the road.
The Town should explore the usage volumes for properties currently along Route 6 and identify appropriate levels of parking volume reduction. While pursuing rezoning along Key Sites, the Town may consider producing design standards and guidelines to ensure that the design of parking facilities encourages the efficiency and quality of life improvements associated with parking reductions.
Priority Level: Medium
Sites : A, B, E
Case Studies: Post-Covid, many communities reassesse the demand for parking within populat nodes of activity. In 2023, the Town of Greenfield conducted a parking study centered on their downtown. The study found that parking significantly outweighs demand, with roughly half of the nearly 3,000 spots in the downtown being empty at all times. According to the study, the town could instead focus on reducing parking and pursuing infill development on parking lots to ehance the downtown’s vitality.

A single parcel may find itself located across two different zoning districts. While this situation is very common in local zoning, it can present ambiguity, confusion, or the potential for exploitation of the parcel’s use in the hands of a savvy developer. For example, if a town has a parcel located 30% in a residential zone and 70% in a commercial zone, it can raise many questions about the intended use for that location, introduce questions regarding the required setbacks and minimum square footages, and create confusion over the number and types of permits required to develop the property.
Swansea has three significant split zoned properties in the study area – two parcels owned by Gator Properties, along Swansea Mall Drive / Milford Road and a third property located on 110 GAR. All three of these properties are currently subject only to the Town’s base zoning, which identifies a portion of each parcel as commercially zoned under the “Business B” District and residentially zoned under the “Rural Residential” District. By integrating overlay zones (Goals 4, 5, 6, and 8), that includes the entirety of split zoned parcels, the Town can provide a clear and straightforward avenue for their development via the new overlay zoning. Additionally, if the Town wishes to change the zoning boundary of the underlying zone, it could do so to remove any potential ambiguity for those who may wish to follow that path for development. When introducing zoning amendments to these properties, it will be important to consider all adjacent land uses by including adequate setbacks, building heights, and screening requirements.
Priority: Medium
Sites : A, D
Case Study: The Town of Chicopee struggles with split-zoned lots. In particular, developers proposed a Starbucks with drive-thru at 523 James St., which is zoned 70% residential and 30% commercial. In late 2023, the Town reviewed the proposal, which later came to also include residential development where zoning allowed. Despite safety concerns related to an adjacent rotary, the Planning Board approved the site plans given proposed uses fell within allowed zoning.
Manufacturing is arguably one of the highest tax generating uses within communities. Swansea should strategically maximize this zoning designation along the Route 6/118 Corridor. Currently, the parcels between Route 6 and I-95 in the study area are zoned to allow manufacturing, however, the sites are largely underutilized. Further assessment shows parcels that allow manufacturing by right have significant wetlands, which makes development challenging on a scale most manufacturing enterprises require. As such, this study considered scenarios of development in which developers may assemble a series of parcels that would enable manufacturing activities. In order to achieve the vision of the development scenarios outlined in this study, parcels located at 718 GAR Highway would require rezoning to enable development as envisioned. Rezoning these specific commercial parcels would enable parcel assembly, maintain commercial frontage along Route 6, and support higher-use development that would generate taxes and employment.
Responsible Party: Planning Board
Priority: Medium
Sites : B
Case Study: Expanding and adjusting zoning boundaries is a common practice as site uses shift. In 2023, the Town of Milford approved a zoning change along 70 properties in the vicinity of the former Archer Rubber Factory. The former factory, zoned IA Industrial, will shift to BP Business Park and RC Residential. This will enable a more diverse development pattern in the area, primarily as the town seeks to revitalize its tax revenues by integrating manufacturing and office-related activities.
Over the last decade, Swansea’s flex space experienced little vacancy, but no growth. However, demand for flex space – defined as manufacturing space that combines office and lab or warehousing space – soared within the region in the last several years. 1 Swansea can capture regional demand for flex space by encouraging more development. As currently defined, Swansea’s manufacturing zoning allows light and general manufacturing, warehousing and office uses. To support flex space as a distinct development type, Swansea should make amendments to its manufacturing zoning that outlines the combined development types allowed, specifically incorporating language for flex space uses. Flex space would enable the development of bio-manufacturing and manufacturing, while incorporating more attractive facades with functional spaces for staff and visitors.
1 Demographic and Business Characteristics, Market Conditions and Trends, for the Route 6/Route 118 Corridor Study, Swansea, MA (FXM Associates)
Responsible Party: Town Administrator, Town Planner
Sites : B, C
Priority Level: High
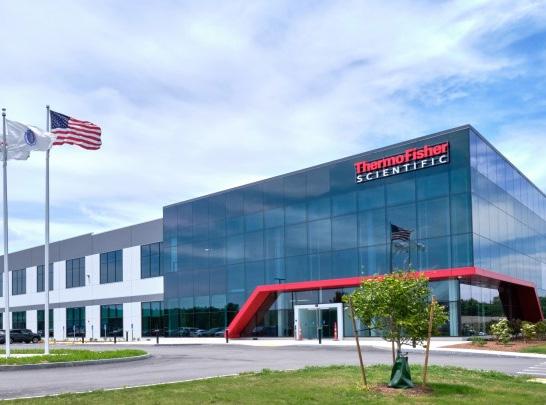
Case Studies: Communities with dedicated business parks attract flex space uses and developers. Thermo-Fischer in Plainville, MA is one of the most successful flex space developments in the region.
Lacking its own industrial park, the Town of Arlington proposed changes to its Industrial Zoning in 2020 to create more diverse and flexible development types. One of the proposed -and approved - changes included a specific description of flex space and its applicability, including the criteria each facility must meet.
5 Implement an Artisan District to support the development of light industrial uses geared toward public consumption.
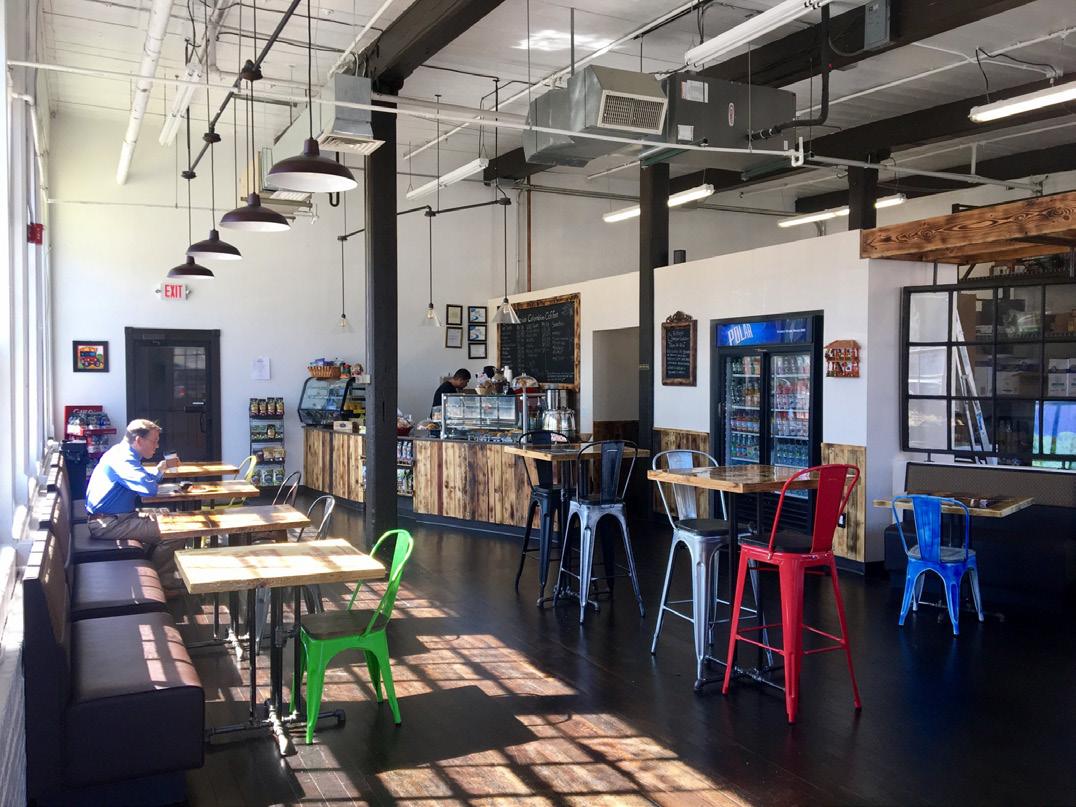
Artisan Zoning is an innovative solution touted by the Urban Manufacturers Alliance to enable small scale manufacturers. Given constraints to water and sewer infrastructure, as well as local interest for smaller and moderate scale developments, Artisan Zoning provides an outlet for creative spaces and local business development. Activities typically within Artisan Zones produce negligible vibrations and noise. Artisan Zoning strategies can support the revitalization of underutilized or vacant sties by enabling the development of high tax generating uses and offering space for public access like breweries, coffee roasters, or other maker spaces.
Though artisan activities can be eligible developments within Manufacturing Zones, the careful creation of an Artisan District offers an opportunity to create a node of small-scale manufacturers that produce goods for sale on site. Feedback during this study showed an interest in breweries and restaurants with a more “local” feel. Development scenarios in this study envision the Artisan Zone along the Cole River, which would also integrate public access connections to the waterfront. The Town could implement this as a new overlay district or sub-district within their existing Manufacturing Zoning.
Responsible Party: Planning Board
Priority: Medium
Sites : C
Case Study: The City of Framingham allows Artisan Production/Creative Enterprises through a number of districts including a number of their business districts. Included as part of the Zoning Use Table, Artisan Production is classified as individual and/or small-scale firms that employ 10 or fewer employees, who are involved in the on-site production of hand-fabricated or hand manufactured parts and/or custom or craft consumer goods through the use of hand tools or small scale, light mechanical equipment. According to the zoning’s definition, artisan production includes apparel manufacturing, confectionery, jewelry making, wood and metal working, pottery and glass making, and equivalents. Showrooms and ancillary sales of goods produced on-premises are allowed.
6 Integrate open space/public water access components to enhance town’s relationship to the Cole River.
The recently completed Swansea Master Plan advocates for additional public access to Swansea’s Riverfronts, including the Cole River which abuts the Route 6/118 Corridor. Manufacturing and Residential uses surround the Cole River waterfront, which puts public access in the hands of private owners and developers. As part of rezoning in the Manufacturing district, and the creation of the Artisan and Creative Enterprise Zone, the Town should integrate language that supports open space connections and provides amenities for public water access. The Town can incorporate general requirements through zoning and negotiate specific configurations and concessions as part of the site plan review process.
Responsible Party: Planning Board
Priority: High
Sites : C
Case Study: The Town of Dartmouth’s Waterfront Overlay District provides harbor dependent uses, prevents encroachment of incompatible uses, and promotes access to the waterfront. Developments that require a special permit must go through the Planning Board to obtain approval and thus can encourage connections to the waterfront.
7 Expand or incorporate a subdistrict to the Swansea Mall Overlay District to the Key Site along Route 6 to allow mixed-use development.
Swansea currently has a singular overlay districtThe Swansea Mall Redevelopment Overlay District (SMROD) to encourage mixed-use development and efficienct parking at the defunct mall. This district allows a maximum height of 4 stories and 60 feet, with 72 dwelling units at 2.3 units per acre. In 2019, Brady Sullivan purchased the Swansea Mall and proposed redevelopment of the property to include new housing as well as retail spaces. Given the imminent redevelopment, Swansea may consider replicating this model across Rt. 6/118 Corridor.
Expanding the overlay district across key sites on Route 6 enable a broader range of uses that respond to current local needs. For example, the SMROD could be applied across the street at Swansea Crossing which is known for the vacant Regal Cinemas, and a select few successful businesses. Additionally, east along Rt. 6, at the Gardner’s Neck Road intersection, several properties are underutilized despite their ideal location to tie into sewer and water service through the Town of Somerset. Both sites represent an opportunity for the Town and developers to capitalize on timing and local interest to create a neighborhood node near retail amenities and natural landscapes. Currently, the majority of these parcels are zoned Business B, which does not allow for mixed-use. In addition, both areas lack pedestrian amenities, such as sidewalks and crossings. Ideally, with the expansion of the overlay district to these areas, walkability would become a focal point of any development.
The Town has two paths to create opportunities for this type of development , by either creating a new overlay district or to expand the SMROD. The former could allow for specific allowable uses, design standards, et cetera; however, by expanding the SMROD it would likely be politically expedient, as there would be less of an onerous process for implementation. Overall, this zoning change would be the most impactful to see desired mixed-use development on these parcels.
Priority Level: High
Sites : A, D
Case Studies: Similar instances of expanding pre-existing overlay districts have seen success both in and outside the region. In the case of the former, Taunton and New Bedford adopted Transit-Oriented Districts, which desire to accomplish similar goals as the Swansea Mall Redevelopment Overlay District on a much larger scale. Outside of the region, Chelmsford’s Village Center Overlay District (VCOD) highlights focused and flexible development, centered on walkability and transit, while also integrating with the municipality’s identity and historical buildings. It is important to note that these examples focus mixed-use development around major transit hubs, but this should not preclude Swansea from focusing on the redevelopment of this site through the expansion of their SMROD.
In 2021, Swansea and Somerset signed an Intermunicipal Agreement (IMA) to expand sewer services within Swansea. The agreement enables Swansea to install sewer infrastructure along Route 6, which is in critical need of infrastructure to support existing commercial activity and expansion. Interviews with property managers and owners along the Route 6/118 Corridor revealed that maintenance of existing septic systems is increasingly a barrier to expansion. Several businesses along the Corridor replaced and rebuilt septic systems and leech fields numerous times over the last several years. This is triggered by a Title V septic failure, which occurs when water processing is limited as a result of a high-water table and nonpermeable soil. Maintenance costs such as these limit the types of businesses that can operate along the Corridor to those that use little to no water. Based on the findings of the industry and space demand analysis, there is potential for additional growth along the Corridor. However, without water and sewer infrastructure, new developments or redevelopments will not materialize.
Responsible Party: Town Administrator, Sewer Commission, Director of Public Works
Priority Level: High
Case Studies: Many communities in the region are actively pursuing the expansion of water and sewer infrastructure. Those communities that have implemented their own IMAs include Dighton and Berkley with Taunton, among others. Many communities struggling with these infrastructure connections also struggle to attract economic development activities.
9 Pursue additional funds for Phase I and Phase II to construct the main sewer line in the Study Area.
In 2024, the Town received $959,752 through the Community Project Funding Program to construct Phase I of the sewer project. Phase I entails the construction of the main sewer line from the Somerset line west on Route 6 to Route 118. The Town should continue to advocate for and pursue additional funds for Phase II, which would enable the construction of new developments, and expand the existing commercial footprint. On May 20, 2024, the Town issued a proposal to residents at Town Meeting to vote to allocate funds for Phase II.
The Town voted to transfer $1,678,384 of available funds for the installation of sewer infrastructure along Route 6 at Gardners Neck Road and Route 6 at Route 118. This timely funding will enable the town to coordinate construction with MassDOT’s anticipated reconstruction of the Garnders Neck Road and Route 6 at 118 intersection.
This endorsement by Town residents shows widespread support for the installation of sewer in town. Coupled with the series of recommendations related to voluntary tie-ins and prioritization of commercial and industrial activities, Swansea is o a path to strategic growth.
Responsible Party: Town Administrator, Sewer Commission
Priority Level: High
Case Studies: In 2022, the Town of Feetown applied for grant funding to pursue a sewer extension in the northern part of town. The State awarded funds through MassWorks to fund the design and permitting of the Assonet Sewer Line extension to expand sewer service northerly along South Main Street and further catalyze economic development and workforce housing. This area abuts the Fall River Innoivation Way Industrial Park, which would enable the town to leverage growth trends next door.
Water and sewer utilities provide municipalities great flexibility for expanding not just housing, but businesses as well. Some businesses - depending on their activities - may be deterred from establishing in a town without adequate water and sewer service. Ultimately, this can impact the town’s overall commercial tax base, which in turn affects the town’s ability to provide services. Although the Town has plans to expand water/sewer access, presently this is impacting businesses in the Corridor.
Property owners along the Corridor described the importance of additional water/sewer capacity to attract new tenants. Currently, properties along the Corridor use septic systems for all their tenants. One management company described that their septic system failed twice in four years, requiring costly replacements. . This represents a major logistical problem for commercial property owners, as replacing commercial septic, which already has a shorter life span than residential systems, is expensive. They also discussed that they have interest in some underutilized properties abutting theirs, but any plans for expansion have been delayed until sufficient water/sewer extension are implemented. A major environmental drawback of continued septic use is the continued flow of pollutants into nearby bodies of water, such as the Cole River. There have been several instances of harmful red algae blooms, which were attributed to an oversaturation of nutrients in the water due to septic systems. Given the burden on commercial property owners to maintain their septic systems and the environmental impacts of their continued use, the Town should prioritize commercial and industrial tie-ins to septic when it is installed. Furthermore, providing this opportunity would increase the likelihood of new commercial and industrial developments, unlocking economic growth in this Corridor.
Priority Level: Medium
Case Studies: The Town of Stoughton prioritized the connection of water/sewer to commercial or industrial properties. Through a consultant, the Town ranked areas that would benefit the most from sewer connection and determined that commercial or industrial properties provided the largest economic incentive. The findings showed that property values increased once a property established a connection to water and sewer service, which also increased the property taxes. Rather than allowing everyone to tie into water and sewer, focusing on entities that stand to provide additional revenue ensures financial feasibility and stability. At the same time, this ensures retention of commercial activity.
11 Implement a voluntary system tie-in for residents who may already be on operating septic systems.
Residents in Town have relied on septic systems for their wastewater needs. As the State implements requirements to protect the environment, the southeast region has a greater need for more efficient water and sewer systems. In 2023, new requirements related to Title V were adopted on Cape Cod to limit nitrogen pollution in specific areas by allowing towns to mandate non-compliant residents to replace their systems. These changes may be expanded to communities outside of the Cape to mitigate impacts from these harmful pollutants.
Septic systems represent a significant investment and cost burden to replace. Depending on the age and efficiency of private septics, some residents may be reluctant to make the switch to public water and sewer systems due to expenses already incurred for their preexisting septic. Allowing residents to opt into the public water/sewer system carries several benefits: it allows residents to maximize their spending while transitioning out of a costly septic system, it bakes in an extended transition timeline for new public water/ sewer system to accommodate needed capacity, and it will limit environmental pollution when residents transition to the new system. Implementing a voluntary opt-in for residential public water and sewer, the town is ensuring the health of the system and stewarding its fiscal maintenance.
Priority Level: Medium
Case Studies: The Town of North Reading successfully expanded their water/sewer network, without mandating their residents to connect to the new system. Through public engagement, the town provided an FAQ for residents to gain a better understanding the impacts of these impending changes. The Town also provided details for residents seeking information on steps to decommission septic systems and resources that could pay for this process.
12 Continue to pursue safety and transit improvements to accommodate redevelopment.
Some of Swansea’s highest crash intersections occur along Route 6. This includes the intersection at Routes 6 and 118, Routes 6 and 138, Route 6 and Maple Avenue, and Route 6 and Gardner’s Neck Road. Proposed land-use changes and economic development initiatives will only be as successful as the transportation designs that complement them (and vice versa). As Swansea explores economic development along one of its most commercialintensive corridors, it will be critical to look at access, circulation, and traffic improvements holistically.
The Town is currently working, alongside Fuss & O’Neill, on a roadway redesign for Route 118 that includes streetscape improvements and the addition of on-road bicycle accommodations. The Town is also implementing safety improvements to Route 6/138. With new developments, the Town should also consider initiatives such as:
• minimizing curb cuts, particularly close to intersections;
• reconciling other dangerous or inefficient turns in the study area;
• providing pedestrian or bicycle infrastructure, where appropriate, along Route 6, or encouraging/requiring pedestrian and streetscape amenities as part of redevelopment proposals for land along the Corridor; or
• coordinating these initiatives with the Town’s current Complete Streets priority list.
In addition to roadway improvements, the Town should consider transit improvements along Route 6. There are currently two primary transit resources for those who do not have access to a car in Swansea: Townfacilitated ride services for seniors and those with disabilities, and the Southeastern Regional Transit Authority (SRTA). The Town should explore expanding available services and infrastructure to meet increased demand resulting from redevelopment along the Corridor.
Case Studies: In 2022, Fall River began the Route 79 Improvements Project demolishing the four-lane highway and rerouting traffic onto existing surface streets. The impacted area is expected to see upgraded sidewalks, shared-use pathways, and crosswalks. The project will also build new cross-streets to re-connect portions of the historic street grid and improve access between the city’s North End neighborhood and the riverfront, which is currently a no-man’s-land of empty lots and underutilized parks cut off from the rest of the city.

Swansea is already charting a path that would support future development. Scenario development along Key Sites in this critical Corridor indicate the highest and best use based on future infrastructure investments and zoning changes. This should signal to land and property owners in and along the Corridor that projects aligned with this vision will be met with general town and administrative support.
Of course, the scenarios laid out in this plan are not a certain future, however a possible one with the proper implementation of recommendations.
Demographic and Business Characteristics, Market Conditions and Trends, for the Route 6/Route 118 Corridor Study, Swansea, MA
To: SRPEDD
From: FXM Associates
Date: November 2023
This Memorandum presents the demographic and business characteristics of the Route 6/Route 118 study area of Swansea, as well as an analysis of current market conditions and trends in employment, commercial space, and retail opportunities within the Swansea market area.
The analyses are based on secondary sources: Claritas Spotlight Reports; Massachusetts Department Economic Research ES-202 data, adjusted by data from the U.S. Bureau of Economic Analysis’s Regional Economic Information System (REIS); and CoStar Property Information System.
The corridor Study Area is comprised of a diverse mix of business establishments and uses, representing 38% of all jobs in Swansea. Retail is the largest sector in terms of employment (58% of Swansea retail jobs), followed by Health Care and Social Assistance, and Accommodation and Food Services (67% of Swansea’s total jobs in this sector). Finance and Insurance is another sector in the study area comprising a large share of that sector’s total jobs in Swansea (59%).
Analysis of employment and real estate supply trends in Swansea and the broader Bristol County market area suggests there will be opportunities to develop some office space, based on historical and projected employment growth in Professional and Technical services, Finance and Insurance, and Health Care and Social Assistance, as well as growth in office space occupancies and low vacancy rates. This may seem somewhat surprising given the work from home phenomenon since COVID, but in fact suburban office space enjoys more stable occupancies and growth prospects than office space in large cities where difficult commutes have largely militated against re-occupancy since the pandemic.
While there is a reported desire to diversify away from the large concentration of retail and restaurant space, it remains a robust cluster and there will be growth prospects, particularly if retail space is developed as part of mixed-use office/retail/recreational/residential projects. The vast majority of retail purchases continue to be at brick and mortar establishments, while restaurants
are a strong cluster on their own in the study area. A retail opportunity/gap analysis shows there is an immediate potential to capture leakage of about 70,000 square feet of additional retail space (not counting Big Box), either through expansion of existing establishments or new construction. While retail jobs are not typically high paying, they do provide opportunities for lower skilled workers as well as part-time work for both primary wage earners and students.
Flex space –defined as primarily open floor plans allowing for office, lab, light manufacturing, and warehouse uses within a single building is now (2023) entirely occupied in Swansea. Flex space, as well as traditional industrial/warehouse space which has been in high demand locally and nationally as de-centralized warehouse space is needed to accommodate more overnight and same day deliveries may offer an opportunity to diversify commercial uses within the corridor albeit at a higher space utilization per employee and lower valuation than office, restaurant, or retail uses.
The following figure shows the corridor study area, as drawn onto a Claritas map to enable collecting data for the specific area. The translation is not an exact science, but it permits making estimated comparisons of the study area to the town, county, and state. Because of limitations in scaling, the study area was divided into two parts, labeled Polygon 1 and Polygon 2. Most of the business and residential activity is in Polygon 1.
Figure 1
Map of Corridor Study Area: Polygons 1 and 2
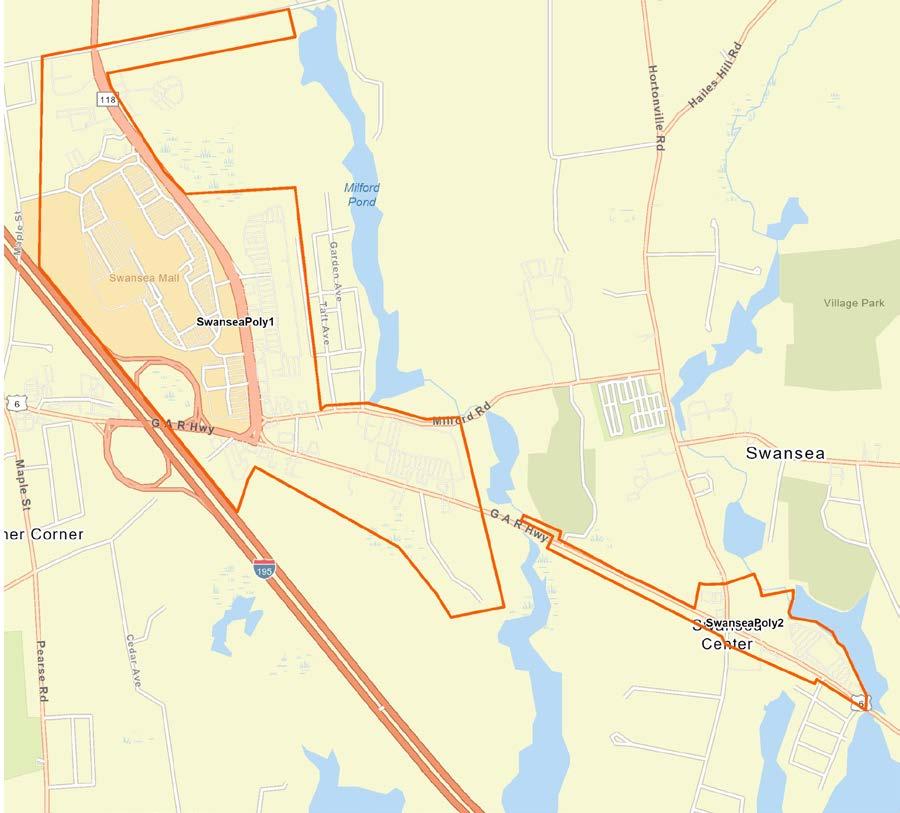
Source: EnvironicsAnalytics, Claritas Spotlight Reports, 2023; FXM Associates.
Demographic Characteristics
Trends in population and households in the study area, town, county, and state appear in the following table. All areas, particularly the small study area, experienced substantial growth between 2010 and 2020, but growth has slowed and is projected to continue at a low rate over the next five years.
Population and Households Compared
Source: EnvironicsAnalytics, Spotlight Reports, 2023 estimates; FXM Associates
The characteristics of the population and households, estimated as of 2023, appear in the Table below.
Note that the numbers in the table are percentages, except for those otherwise marked. The study area’s relatively small population of residents is considerably older than those in the other three geographies, with a median age of 58. The population is White, with a small number of Hispanic people. Most households speak English at home, but with approximately 15.5% speaking an Indo-European language, possibly Portuguese, as 25% of households in the study area are of Portuguese ancestry, by far the largest single proportion in the data.
Study area incomes are higher than in the other three geographies, and the poverty rate is the lowest of the four: under 1%. About one-third of the study area population have a high school diploma, and a little less than a third have a bachelor's degree or higher, which is slightly more than in the town and county, but less than in the state.
Demographic Characteristics Compared
Source: EnvironicsAnalytics, Spotlight Reports, 2023 estimates; FXM Associates
There are three ways to compare the business characteristics of the study area, town, county, and state: by number of establishments, employment, and sales. These highlight different features of the business community, so all three are shown in the following tables.
Health Care and Social Assistance is the sector with the greatest number of establishments, followed by Retail Trade and Other Services (repair and maintenance, personal care, and laundry, etc.).
Business Profiles Compared: Number of Establishments
Source: EnvironicsAnalytics Claritas Spotlight Reports, 2023 and FXM Associates
Comparing employment numbers is, however, more meaningful for understanding the local economy, as seen in Table 4 below. The study area contains 37% of the total jobs in Swansea. Retail Trade is the largest employer in both the study area, where it employs over a third of the jobs in the area, and 58% of all retail jobs in the Town of Swansea. Retail overall in Swansea accounts for 22% of all jobs, while retail accounts for 17% of all jobs in Bristol County and 11% in Massachusetts overall. In Bristol County and the state, Health Care and Social Assistance employs the most people. This sector is the second largest employer in the town. In the study area, Accommodation and Food Services takes second place in number of jobs, followed by Health Care and Social Assistance
Fully two thirds (67%) of all jobs in Accommodation and Food Services (mostly restaurants) In Swansea are within the corridor study area.
4
Business Profiles Compared: Employment
Source: EnvironicsAnalytics Claritas Spotlight Reports, 2023 and FXM Associates
Sales constitutes the third measure of business activity. Table 5 shows that the largest generator of sales in the study area is the Retail Trade sector. In the town, Wholesale Trade is largest, but is closely followed by Retail Trade. Wholesale Trade is also the leading sector for Bristol County and the State of Massachusetts, while in both places, Retail Trade is second. (Note that there are only two Wholesale Trade establishments with a total of 13 employees in the study area.)
Table 5
Business Profiles Compared: Sales
53:
Mining, Quarrying, and Oil and Gas
Utilities
$
Source: EnvironicsAnalytics Claritas Spotlight Reports, 2023 and FXM Associates
669,078,000,857 $
The picture that emerges of the study area from the above data is one of a predominantly commercial area, which supplies almost a third of the jobs in the town Retail Trade in the study area represents almost half of the town’s total retail sales and is the largest employer in the study area and in the town. The Accommodation and Food industry is also an important sector for both the study area and the town, where it is the second and third largest employer, respectively.
Given the foregoing business profiles of the study area and town, this section will examine historical and projected trends in employment in key industries identified and project demand for commercial space using square footage per employee industry norms.
The measure most used for commercial market trends analyses is employment because jobs are a good indicator of the status and future direction of a given industry. Increasing employment indicates industries that are growing, whether through expansion of existing businesses or opening of new ones. Also, reasonably reliable historic data are readily available and can be used to project employment trends. The sources used here for all the employment trends graphs are the ES202 reports from the Massachusetts Department of Labor and Workforce Development, adjusted by data from the U.S. Bureau of Economic Analysis Regional Economic Information System, which includes self-employment data. 2021 is the most recent year for which actual jobs data are available, so the projections shown to 2028 are for seven years.
When using historical data to produce future projections, such as the linear regression technique used here, it is important to consider the reliability of a given data set. A statistic commonly used for this purpose is called the R2 calculation and is presented alongside each projection given in the charts below. The closer the R2 value is to 1, the better the predictive value of past performance. A limiting factor on 2028 projections is the influence of the 2020-2021 pandemic, which is still being felt in some sectors and which may also affect the R2 values for employment projections. For example, a sector might be showing strong growth since 2010 but the volatility introduced by the pandemic-related job losses could pull down the sector’s projected growth and lower the R2 value of the projection. Also note that, because of the relatively small number of jobs in Swansea compared to Bristol County, the predictive value of history may be weak across all sectors. Fewer data points mean less reliability in the trend lines. Nevertheless, the general trend of the projections is useful for assessing future potential.
The first chart shows trends and projections in total employment in Swansea and Bristol County. Both trends have been generally upwards since 2006, though with considerably variability from the 2006-2008 recession and the 2020-2021 pandemic. These factors will also appear in the subsequent industry graphs, but the graphs also show rapid recoveries from those setbacks in most cases, reflecting a resilient economy at local levels.
Here the analysis of historical employment data projected to 2028 is positive for both Swansea and Bristol County. Note that the R2 value for the county is much higher than that for the town, because of the much larger number of jobs in the county.
Employment Trends Swansea & Bristol County
2006-2028
TOTAL ALL INDUSTRIES
Jobs in Swansea
Swansea Bristol County
Jobs in Bristol County
Trends in Retail Trade are of particular interest because of the sector’s importance in both the study area and the town. The graph below shows those trends for Swansea and Bristol County, projected to 2028. First, the reliability of both trend lines is low, with R2 values under .2. Swansea’s projection is slightly positive and the R2 is slightly higher than that of the county, which is low given its high variability since 2006. Bristol County is projected to lose jobs in this sector through 2028.
3
Employment Trends in Swansea and Bristol County 2006-2028
Jobs in Bristol County Jobs in Swansea
The next two graphs show trends in Construction and Manufacturing, two industrial sectors. Transportation and Warehousing, usually a component of this sector, is not shown because there are virtually no jobs data for Swansea.
In Construction, Swansea employment is projected to grow, with an R2 of .5. Bristol County is also expected to gain jobs, although at a somewhat lower level of reliability.
4
Employment Trends in Swansea and Bristol County 2006-2028
In Manufacturing, on the other hand, Swansea’s trend is positive, but at a low level of reliability, while Bristol County is projected to lose jobs, as it has been declining fairly steadily since 2006. Note again the dips in 2006-2008 and again in 2020-2021, along with the recoveries.
5
Employment Trends in Swansea and Bristol County 2006-2028
The next group of graphs constitute the Office-Using sectors: Information, Finance and Insurance, Real Estate and Rental & Leasing, Professional and Technical Services, and Administrative and Support.
The Information sector has been in a steady decline in Bristol County, as reflected in the high R2. Its history in Swansea has been extremely variable, so the trend line and projection is not at all a good predictor of what might happen in this industry.
Employment Trends in Swansea and Bristol County 2006-2028
Bristol County trends in Finance and Insurance are strongly positive, suggesting this sector will grow in the future. Swansea’s trendline is also positive, but at a much lower level of reliability, so assessing future prospects in this sector is difficult. Since the dip in 2014, however, the trend has been more strongly positive, so this sector may indeed offer growth possibilities for Swansea.
2006-2028
Trends in Real Estate and Rental and Leasing Services have been very variable in Swansea, but the downward trend is at a reasonable level of reliability, so prospects for growth appear limited. Conversely, in the county, the upward trend is strongly positive. The strong county trend suggests that Swansea might be able to attract some of that growth.
8
Employment Trends in Swansea and Bristol County
2006-2028
REAL ESTATE AND RENTAL & LEASING
Jobs in Bristol County Jobs in Swansea
Professional and Technical Services is a growth sector for both Swansea and Bristol County. Trends are upward for both, and the R2 indicate their forecast reliability.
Employment Trends in Swansea and Bristol County 2006-2028
PROFESSIONAL AND TECHNICAL SERVICES
Figure 9 R² = 0.5847
R² = 0.75162,000 4,000 6,000 8,000 10,000 12,000 14,000 16,000 18,000
Bristol County is projected to gain jobs in this sector, while in Swansea this is a declining sector, despite the slight upward tick after the pandemic.
Figure 10
Employment Trends in Swansea and Bristol County 2006-2028
ADMINISTRATIVE AND SUPPORT SERVICES
Jobs in Swansea
= 0.3493
= 0.6622,000 4,000 6,000 8,000 10,000 12,000 14,000 16,000 18,000 20,000
Jobs in Bristol County
The remaining industries examined for employment trends are Health Care and Social Assistance; Arts, Entertainment, and Recreation; Accommodation and Food; and Other Services.
Health Care and Social Assistance is a major driver of the Massachusetts economy overall. Bristol County reflects that, with the greatest number of jobs found in this sector, which is also growing with a high level of reliability. In Swansea, the trend is also upwards, but at a much lower level of reliability This sector experienced dips in 20102011, 2018, and 2020 (a COVID year), making it difficult to predict where employment in this sector is headed in Swansea At the county level jobs in health care and social assistance have been trending upwards throughout the analysis period, except for a dip during the pandemic. Even with this dip the R2 is strongly positive.
Figure 11
= 0.1667
= 0.821
Arts, Entertainment, and Recreation trends are upward in both Swansea and Bristol County. The reliability values are higher for Swansea than for the county, but it is not a major employer in the town.
Figure 12
Employment Trends in Swansea and Bristol County 2006-2028
Accommodation and Food Services in Swansea and Bristol County are comprised mostly of food services and drinking places. In Swansea, the sector has been in decline historically, except for a post-COVID upturn, mirroring that of Bristol County. The sector in Bristol County overall has been growing historically, except for the COVID drop. The positive projection for the county, however, is at a low level of reliability, while the projected decline in Swansea is at a much higher level of reliability. In other words, it is highly likely that jobs in this sector will decline in Swansea, and it is very uncertain where the sector is headed in Bristol County.
13
Employment Trends in Swansea and Bristol County 2006-2028
ACCOMMODATION AND FOOD SERVICES
= 0.1733
Jobs in Swansea
= 0.6708
5,000 10,000 15,000 20,000 25,000
Jobs in Bristol County
Other Services covers repair and maintenance, personal and laundry services, and nongovernment (e.g., religious and civic) organizations Employment in both Swansea and Bristol County is trending upwards, somewhat more strongly in the county than in the town, but both have experienced positive growth, with the exception of COVID years, since about 2014.
14
Employment Trends in Swansea and Bristol County 2006-2028
OTHER SERVICES (EXCEPT PUBLIC ADMINISTRATION)
Jobs in Bristol County Jobs in Swansea
Using the trends and projections shown in the preceding charts, in turn based on historic estimates of jobs in each sector, estimates of future commercial space needs can be made. The projected space demand estimates should be viewed with some caution, depending on the reliability of the sector projections shown in those charts. The following table shows these estimates.
Table 6
Swansea Projected Space Demand Through 2028 Based on Historical Employment Trends
Scource: Massachusetts Department of Labor and Workforce Development, ES202 reports (adjusted by REIS) 2021; FXM Associates Space Demand Model
For example, the Retail Trade sector in Swansea is expected to add approximately 190 new jobs by 2028. Using industry norms for square footage per employee, there would be a projected demand for about 95,031 square feet of new retail space to accommodate this expanded employment. Conversely, in Bristol County, the retail sector is projected to lose 1,451 employees, in theory vacating 725,406 square feet of retail space because of reduced demand.
Overall in Office-Using industries, Swansea is projected to lose jobs, while Bristol County would gain over 7,000 employees, resulting in demand for new office space of almost two million square feet.
In the final group in in the table, all sectors except Accommodation & Food Services in Swansea are expected to increase employment, with commensurate increases in demand for commercial space.
In addition to the assessment of potential growth in demand for commercial space attributable to projected employment growth, trends in the inventory, vacancies, occupancies, and lease prices of commercial space are analyzed. The source of data in the following section is CoStar Property Information Services, a subscription data provider generally accepted by property owners, developers, and brokers as the most reliable and comprehensive commercial real estate information. In the following sections historical trends are examined for office space, retail, industrial, and flex space within Swansea and the broader Bristol County market area.
Figure 15 shows historical trends in the inventory of office space in Swansea and Bristol County. The inventory of office space in Swansea has remain unchanged since 2006 at 292,000 square feet, while 287,000 square feet of office space has been added in Bristol County since 2006, a 2.1% increase. Over the next five years (2023-2028) about 86,000 square feet of office space is projected to be added to the Bristol County inventory (0.6% increase) at an average annual rate of 17,000 square feet.
15
Source: CoStar Property Information Services, 2023, and FXM Associates
Figure 16 shows historical trends in office space vacancies in Swansea and Bristol County, while Figure 17 plots the percentage of vacancies within the office space inventory. Both show a sharp increase in office vacancies in the COVID years.
Figure 16
Office Space Vacancies
Swansea & Bristol County SF
Figure 17
Office Vacancy % Swansea & Bristol County
Source: CoStar Property Information Services, 2023, and FXM Associates
As is clear from the data in both graphs, office space vacancies are trending downward at both the county and community level. In Swansea, there is now (2023) virtually no
office space available for rent. As shown by the employment trend graphs, much of this demand appears to be generated by recent employment growth in Finance and Insurance (Figure 7), Professional and Technical Services (Figure 9), and Health Care and Social Services (Figure 11). These apparent office space occupancy gains are also illustrated in Figure 18. While the R2 for Swansea is weak in this graph, the significant drop during COVID belies an otherwise solid upward trend, also apparent for Bristol County overall. The predominately suburban office market in Bristol County and Swansea is decidedly different from that being observed in Boston and other large central cities where working from home to avoid crowded commutes has resulted in increasing vacancies.
Figure 18
Office Space Occupancy
Swansea & Bristol County SF Swansea Occupancy SF
= 0.1951
Bristol County Occupancy Swansea Occupancy
= 0.9051 11,500,000 12,000,000 12,500,000 13,000,000 13,500,000 14,000,000 14,500,000
Occupancy SF
Source: CoStar Property Information Services, 2023, and FXM Associates
Figure 19 graphs trends in average per square foot per year lease rates for office space in Swansea and Bristol County. Rents are trending upward, but not significantly, thus constraining prospects for new construction. CoStar is forecasting flat rents, new construction, and net absorption over the next five years. The current market cap rate of 9.8% is hardly suggestive of significant investor interest. Nevertheless, extremely low
vacancies portend opportunities for limited development of office space, particularly as part of mixed-use commercial/recreational/residential projects where premium rents might be achieved.
Figure 19
Office Space Gross Rent
Swansea & Bristol County
$30.00
$25.00
$20.00
$15.00
$10.00
$5.00
$0.00
Source: CoStar Property Information Services, 2023, and FXM Associates R² = 0.3466 R² = 0.6194
Industrial Space
Figure 20 graphs trends in the inventory of industrial/warehouse space in Swansea and Bristol County. The industrial space inventory in Swansea is less now than it was it 2006, as is industrial space in Bristol County overall.
Figure 20
Industrial Space Inventory
Swansea & Bristol County SF
Swansea Industrial Space SF
Swansea Inventory SF Bristol Inventory SF
Source: CoStar Property Information Services, 2023, and FXM Associates
Bristol Industrial Space SF
Figure 21 shows the historical trend in vacant square feet. It is not known why Swansea shows such a dramatic increase in industrial space vacancies in 2021, even as vacancies are declining in Bristol County overall.
Figure 21
County
Figure 22 shows trends in industrial space occupancy in Swansea and Bristol County. In the broader market area (Bristol County) demand for and occupancy of industrial space is strongly positive, as it has been in most markets nationally for the past 10 years. The rise of e-commerce and overnight deliveries has spurned demand for de-centralized warehouse space. CoStar is forecasting 311,000 square feet of annual net absorption of industrial space in the market area over the next five years, including over 300,000 square feet now under construction. The long-term trend-line (2006-2023) projects even higher annual net absorption, with a very strong R2. With a current 6.7% cap rate, investor confidence in the value of industrial space is higher than for other commercial real estate. Figure 23 shows trends in average lease process for industrial space. The Swansea case appears anomalous but the corridor should not be ruled out for potential warehouse space development given strong regional demand. CoStar is forecasting $12 per square foot rents within the next three years. 0 1,000,000 2,000,000 3,000,000 4,000,000 5,000,000 6,000,000 7,000,000 8,000,000 9,000,000 10,000,000
Source: CoStar Property Information Services, 2023, and FXM Associates
22
Industrial Space Occupancy Swansea & Bristol County SF
= 0.4512
Source: CoStar Property Information Services, 2023, and FXM Associates
23
Industrial Space Rent
Swansea & Bristol County
Source: Co Star Property Information Services, 2023, and FXM Associates
Flex space is defined as predominately open floor plates capable of being adapted to combinations of office, lab, and warehouse uses within the same building. Figure 24 shows historical trends in the inventory of flex space in Swansea and Bristol County.
As shown in figure 24 the inventory of flex space has not changed in Swansea since 2006, even as it has increased by over 200,000 square feet in Bristol County overall.
Figure 24
Flex Space Inventory
Source: CoStar Property Information Services, 2023, and FXM Associates
Unlike the case of industrial space, however, the inventory of flex space is Swansea is virtually entirely occupied as shown in Figure 25.
Figure 26 below plots occupancy in flex space, but because of virtually 100% occupancy, a trend line extrapolation is no indication of potential future absorption, assuming flex space can be newly constructed in Swansea. CoStar is forecasting 160,000 square feet of annual absorption in the market area, with 338,000 square feet now under construction. Rents are forecast to increase to $15 per square foot by 2028. Figure 27 shows historical trends in flex space rents per square foot per year.
Figure 25
Figure 26
7,500,000 7,600,000 7,700,000 7,800,000 7,900,000 8,000,000 8,100,000 8,200,000 8,300,000
Source: CoStar Property Information Services, 2023, and FXM Associates
$16.00
$14.00
$12.00
$10.00
$8.00
$6.00
$4.00
$2.00
$0.00
Source: CoStar Property Information Services, 2023, and FXM Associates
As previously discussed, retail is the largest employer in the corridor and holds a higher percentage of total employment in Swansea (22%) compared to Bristol County (17%) and Massachusetts overall (11%). While diversification is sought within the commercial corridor, prospects for increased retailing should not be discounted as a potential enhancement of municipal revenues and a source of employment for less skilled workers and persons seeking a second (or third) part-time job. In this subsection the broader market conditions for retailing in Swansea are assessed while a subsequent retail opportunity/gap analysis identifies immediate prospects for expansion.
Figure 28 graphs historical trends in the inventory of retail space in Swansea and Bristol County. As shown in Figure 28 the inventory of retail space in both Swansea and Bristol County has steadily increased, with the exception of a slight dip at the county level during the pandemic. Based on long-term trends, the inventory of retail space in Swansea is projected to increase by about 47,000 square feet per year through 2028, and 190,000 square feet per year in Bristol County overall. Figure 29 plots vacant square feet while Figure 30 shows historical vacancy rates.
Inventory
Figure 29
Swansea & Bristol County SF
Source: CoStar Property Information Services, 2023, and FXM Associates
30
Swansea & Bristol County
Source: CoStar Property Information Services, 2023, and FXM Associates
Figure 31 shows historical and projected occupancies. In Swansea the trend-line extrapolation suggests an average annual occupancy increase of 38,000 square feet per year, 173,000 square feet per year for Bristol County overall. Retail rents are plotted in Figure 32. CoStar is forecasting less average annual net absorption of retail space in the market area, 111,000 square feet compared to the 173,000 square feet in the long-term trends projection, while rents are forecast to remain relatively stable at an average of $18 per square foot per year. While development of retail space is clearly more challenging now than historically, people still favor brick and mortar retailing for over 75% of their shopping and a properly developed retail component in a mixed-use project will be feasible in Swansea.
Figure 31
Retail Space Occupancy Swansea & Bristol County SF
500,000 1,000,000 1,500,000 2,000,000 2,500,000 3,000,000
Figure 32 R² = 0.3739 R² = 0.6047
Source: CoStar Property Information Services, 2023, and FXM Associates
$25.00
$20.00
$15.00
$10.00
$5.00
$0.00
Swansea & Bristol County
= 0.3891
Source: CoStar Property Information Services, 2023, and FXM Associates R² = 0.0071
Another approach to assessing potential opportunities for expanding retailing is a retail opportunity gap/surplus analysis, a tool used by major retailers and chain restaurants to gauge market demand and competition within a specified geographic area. The analysis presents a snapshot of current consumer spending on various retail categories alongside actual retail store sales in those same categories within the same geographic area. Where expenditures by households in the market area exceed sales in that market area, a gap or opportunity exists for existing or new stores within the market area to “capture” more of those household expenditures. (This loss of potential sales is also called “leakage.”)
Conversely, where market area household expenditures are less than actual sales categories, it indicates that stores in that retail category in the market area already attract consumer dollars from outside the market area, and opportunities for additional retail activity would be more limited.
The retail gap analysis is a picture of current opportunities for retailers to newly locate or expand facilities based on a well-established principle drawn from many empirical studies showing that people will typically purchase goods and services within the shortest available walking or drive time from where they live. The principle applies to comparable and competitive goods, services, and pricing: there is no guarantee of success based strictly on location advantage, which simply presents the opportunity.
Retailers typically define market areas in terms of drive times, with the lowest drive time defined as the maximum time consumers would be willing to drive to smaller, convenience type retailers. The next drive time is that considered essential for most medium sized stores and restaurants, and the maximum drive time is that which consumers would be willing to drive for all but the largest stores and store types. In considering the market areas for the Swansea Corridor, the 10-, 15-, and 20-minute drive times seem to represent the most likely distances potential consumers would drive under the above definitions. If a specific category of retail sales opportunity were shown for the 10- and 15-minute market areas, then most retailers would consider market conditions favorable – from a demand standpoint – to locating or expanding a store within that market area.
The following figure shows the market areas defined by the 10-, 15-, and 20-minute drive times.
Retail Gap Market Areas
According to Claritas Spotlight Reports, a subscription data service widely used in the real estate industry and by professional analysts, within a 20-minute drive time of the Route 6/Route 118 corridor these expenditures totaled about $8,774,024,809 (demand by market area residents, including purchases at restaurants and other food services in addition to retail stores) in 2023, as shown in Table 7 below. For each drive time market area, overall retail and restaurant sales exceed the purchases made by households living within those drive times from the approximate center of the corridor (the intersection of Swansea Mall Drive and US Route 6). Stores are pulling in sales from outside the drive time areas, so there is no overall gap in retail/restaurant supply, with the surplus shown in Table 7.
Table 7
Opportunity/SurplusGap Market Overview
Source: Environics Analytics, Claritas Spotlight Reports, 2023, and FXM Associates
Notwithstanding these large surplus sales beyond local demand, a retail gap analysis suggests opportunities for existing or new retail stores in selected categories to capture about $348,000,000 in sales currently leaking outside the market areas, potentially supporting about 649,000 square feet in expanded or newly constructed space. Table 8 presents the results of the comparison of spending and sales in selected retail store types, along with the translation of the gap, or “leakage,” into square footage which could support new or expanded businesses. (In practice, this area would be expected to capture only a part of the current sales leakage shown, some of which may be captured by stores outside the area or not recaptured at all.) All the selected gaps shown are for the 15- or 20-minute drive time, depending on store type.
Table 8
Source: EnvironicsAnalytics, Claritas Site Reports, 2023 estimates; FXM Associates
The retail gap analysis is used by developers, property owners and brokers to recruit tenants, and economic development professionals seeking to expand existing businesses and recruit new ones as part of an economic revitalization program (including mixed use development with residential uses, for example). All the caveats that would apply to successful stores anywhere – good maintenance and attractive premises, managed supply, competitive prices, good services, sufficient parking, and transportation access – apply as well to realizing potential gap opportunities.