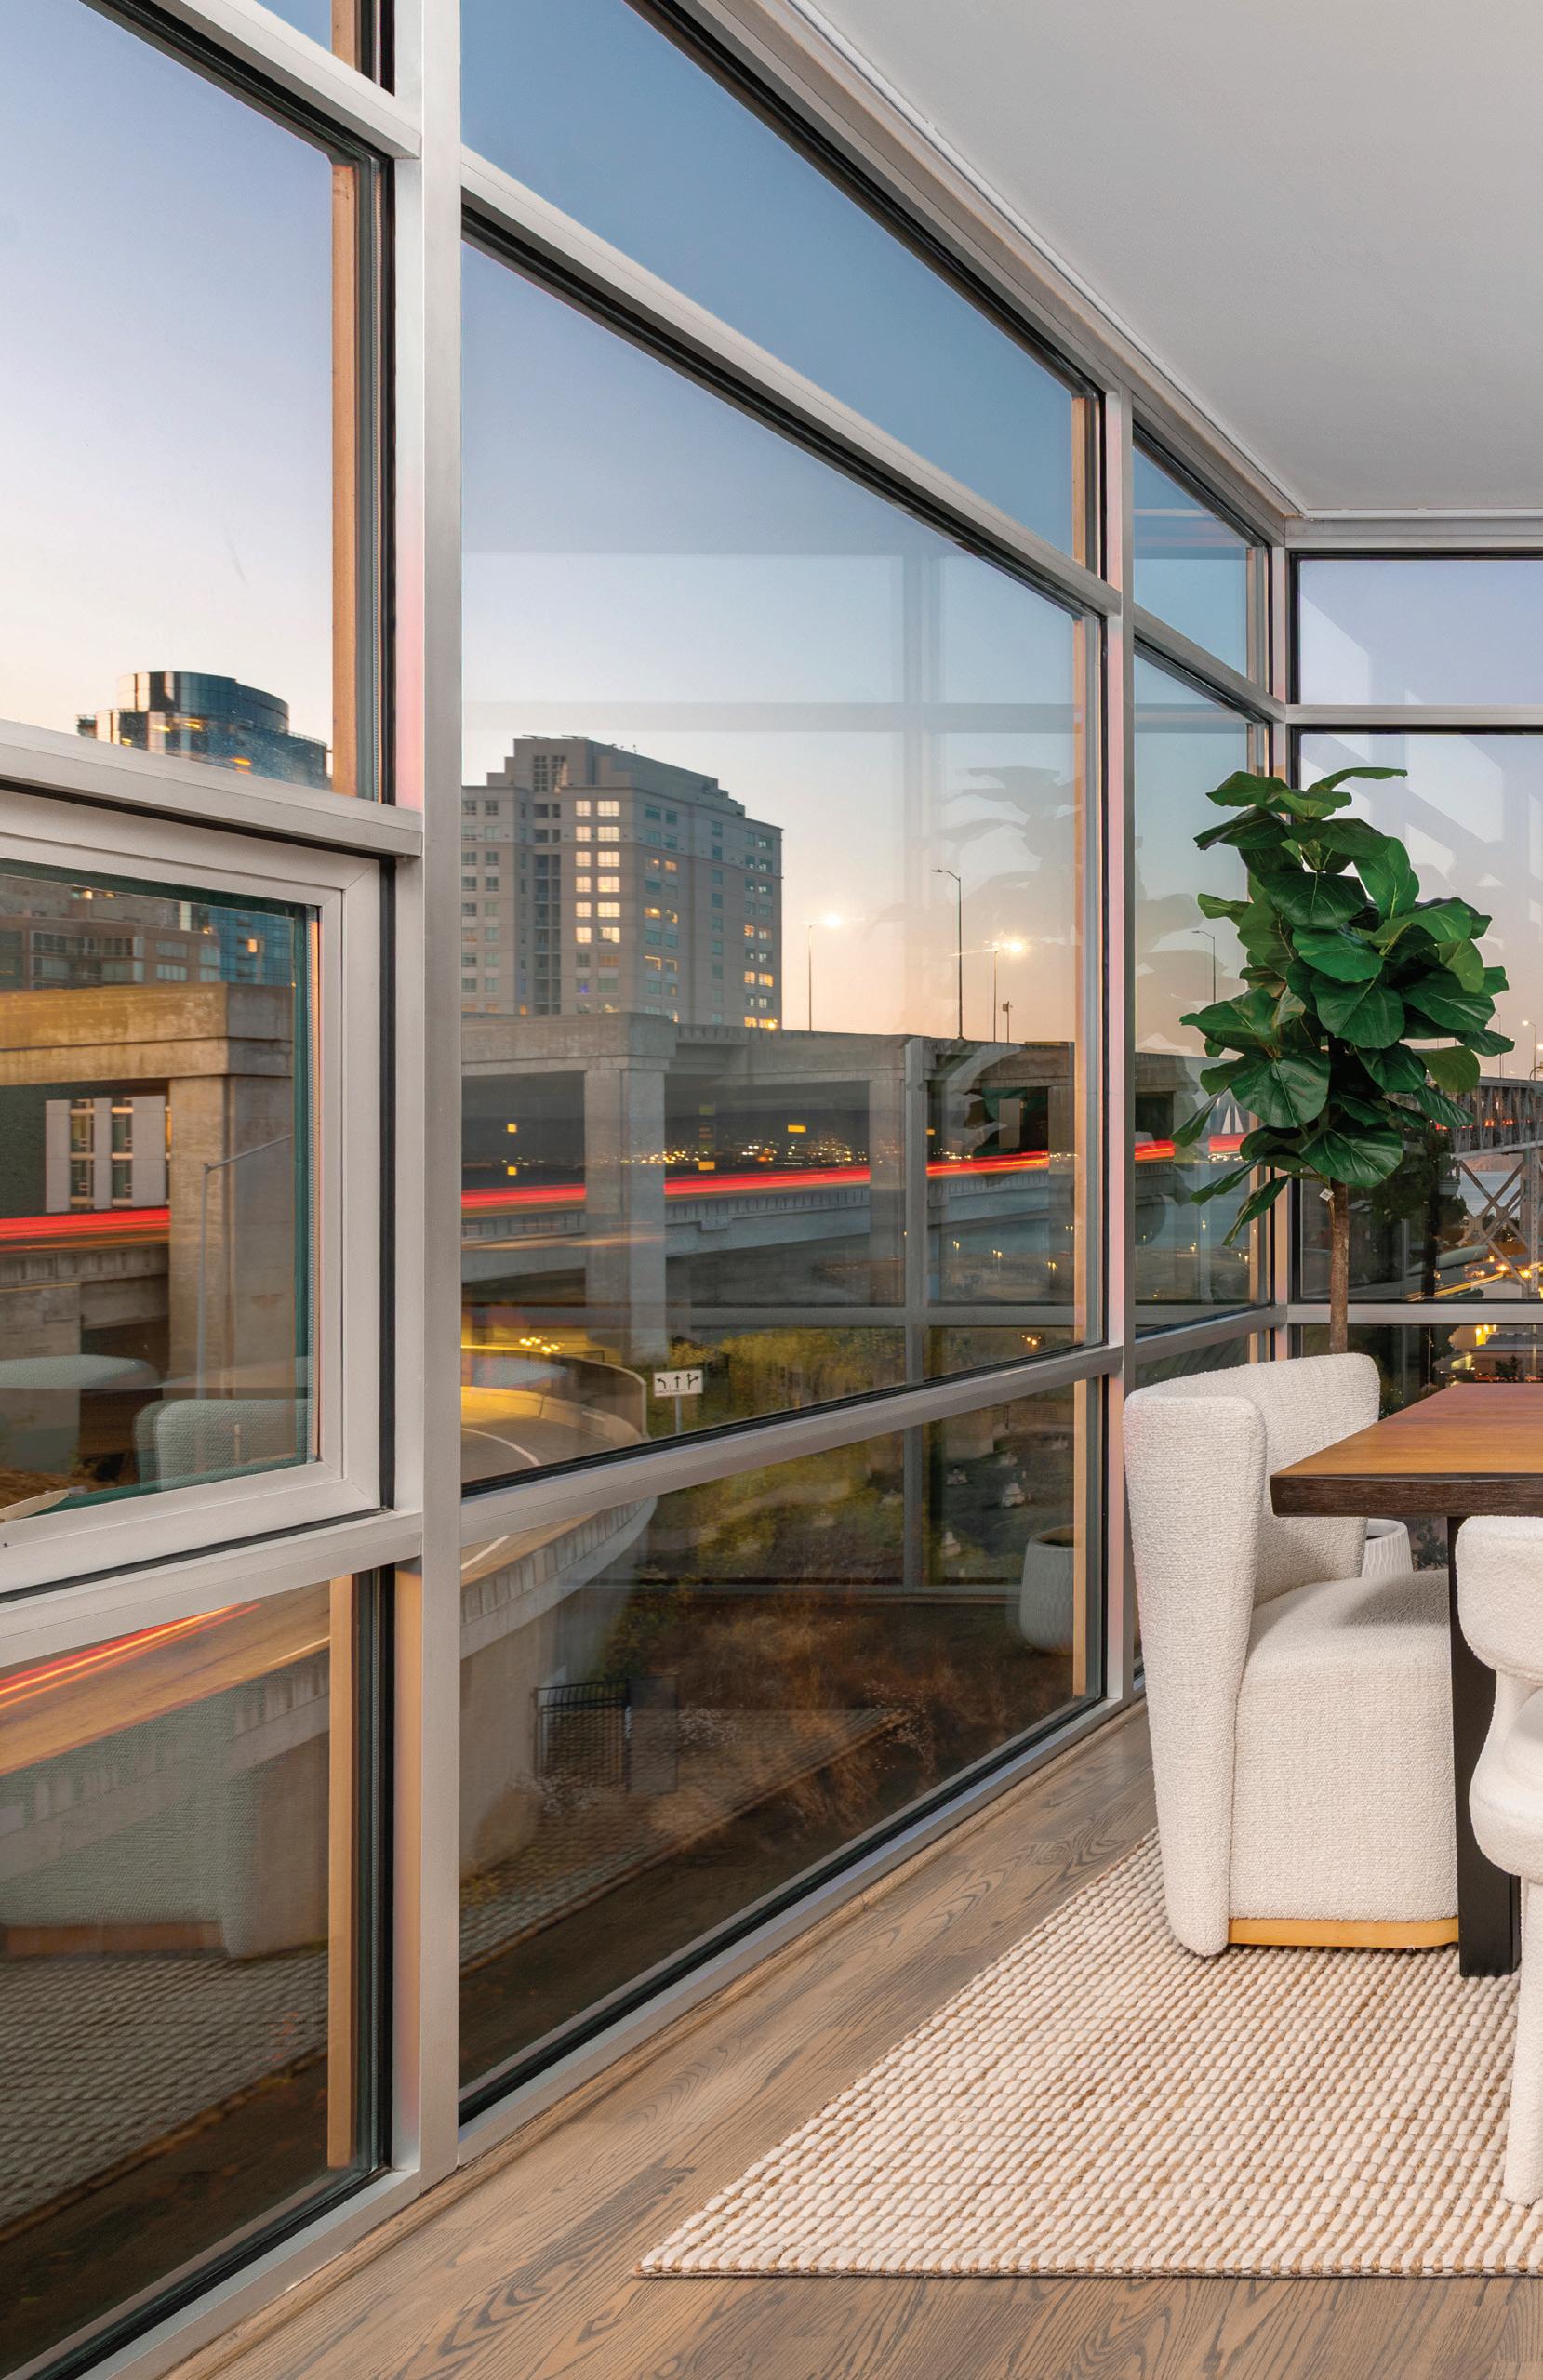


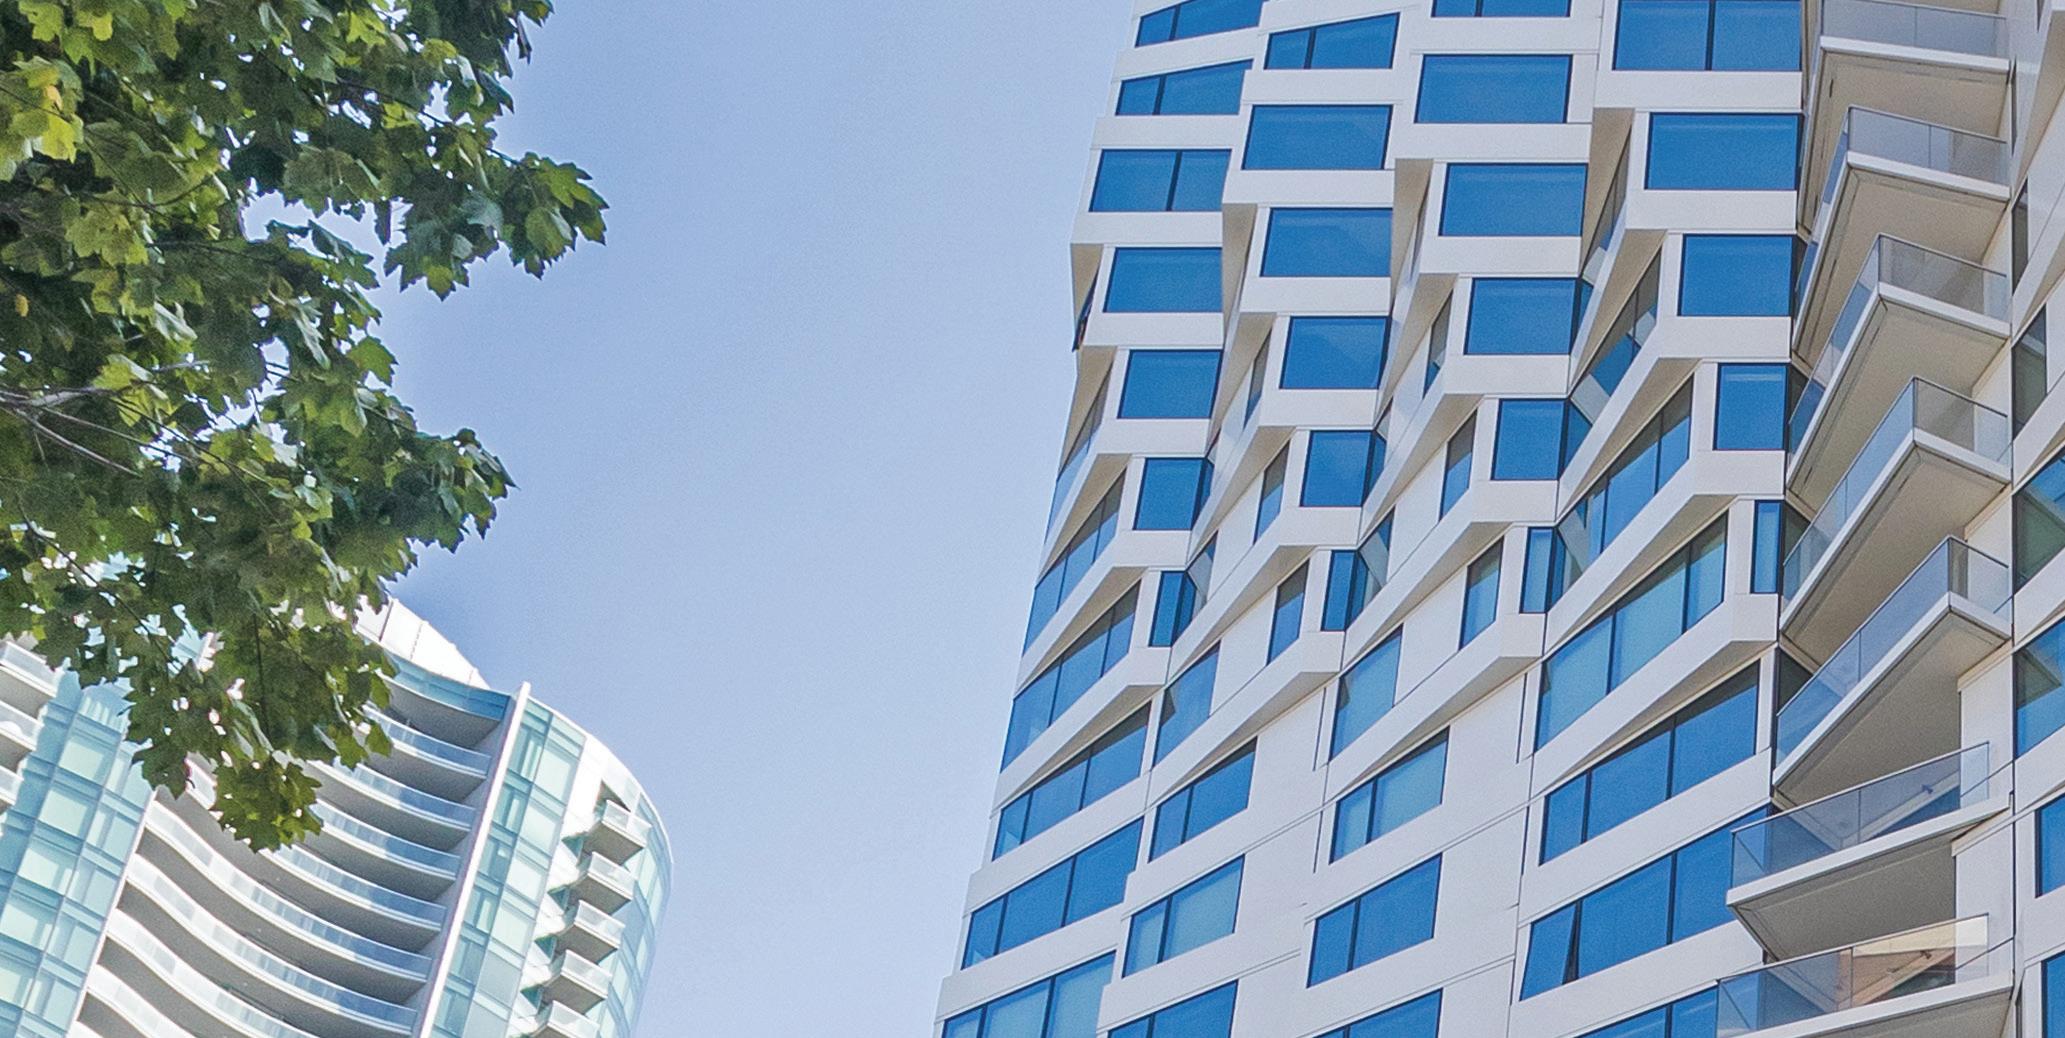
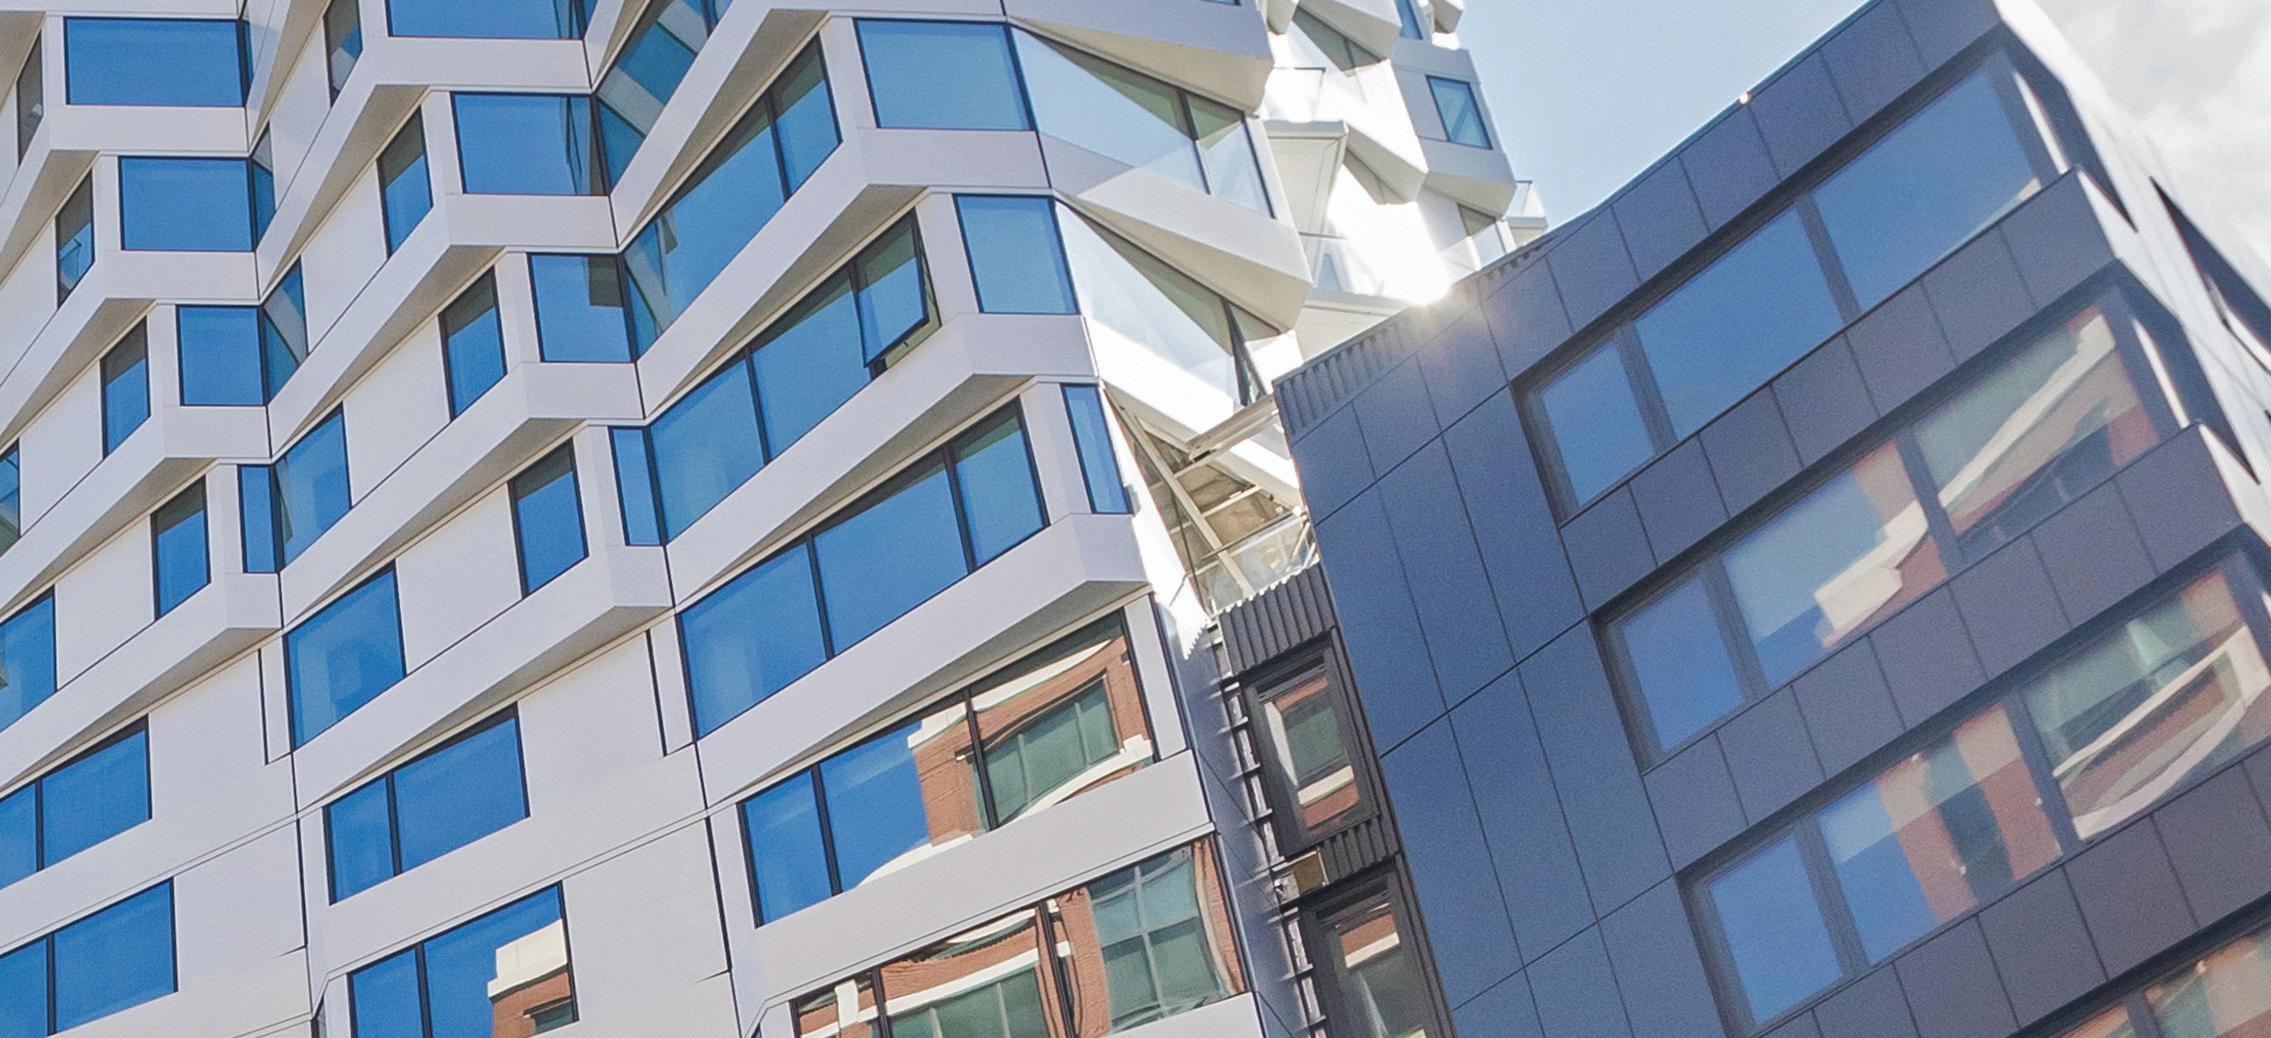
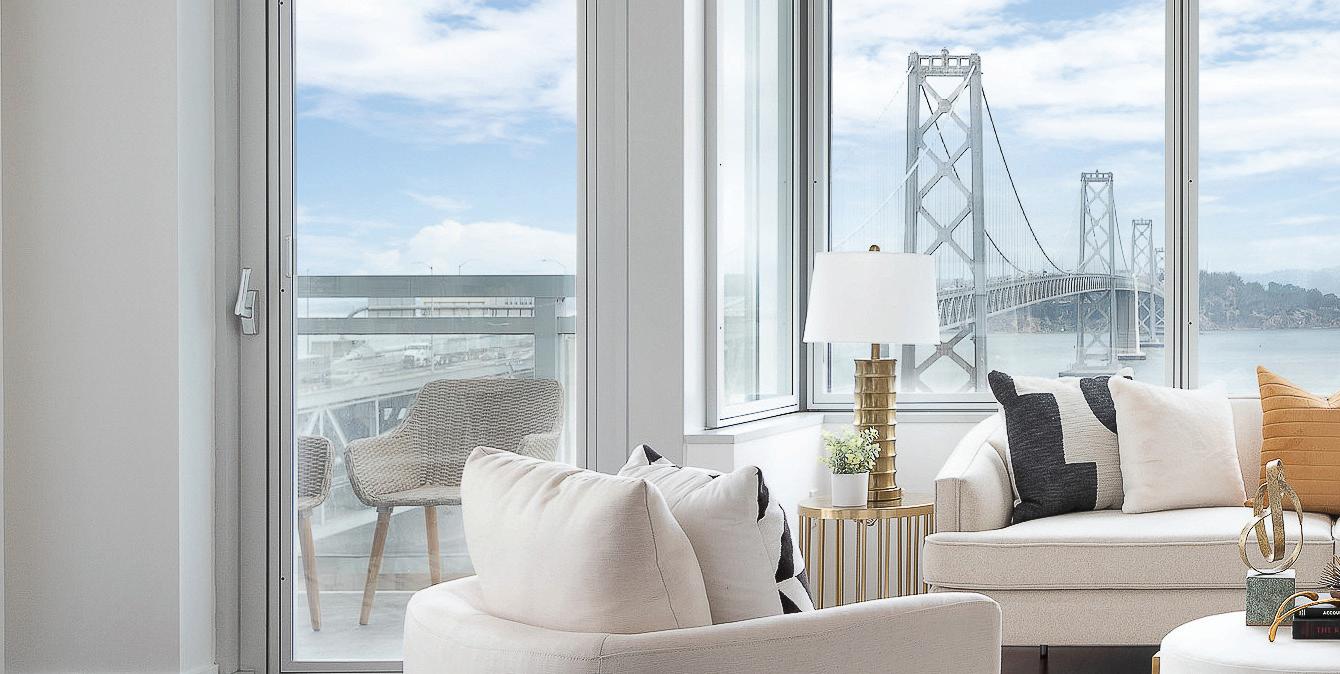
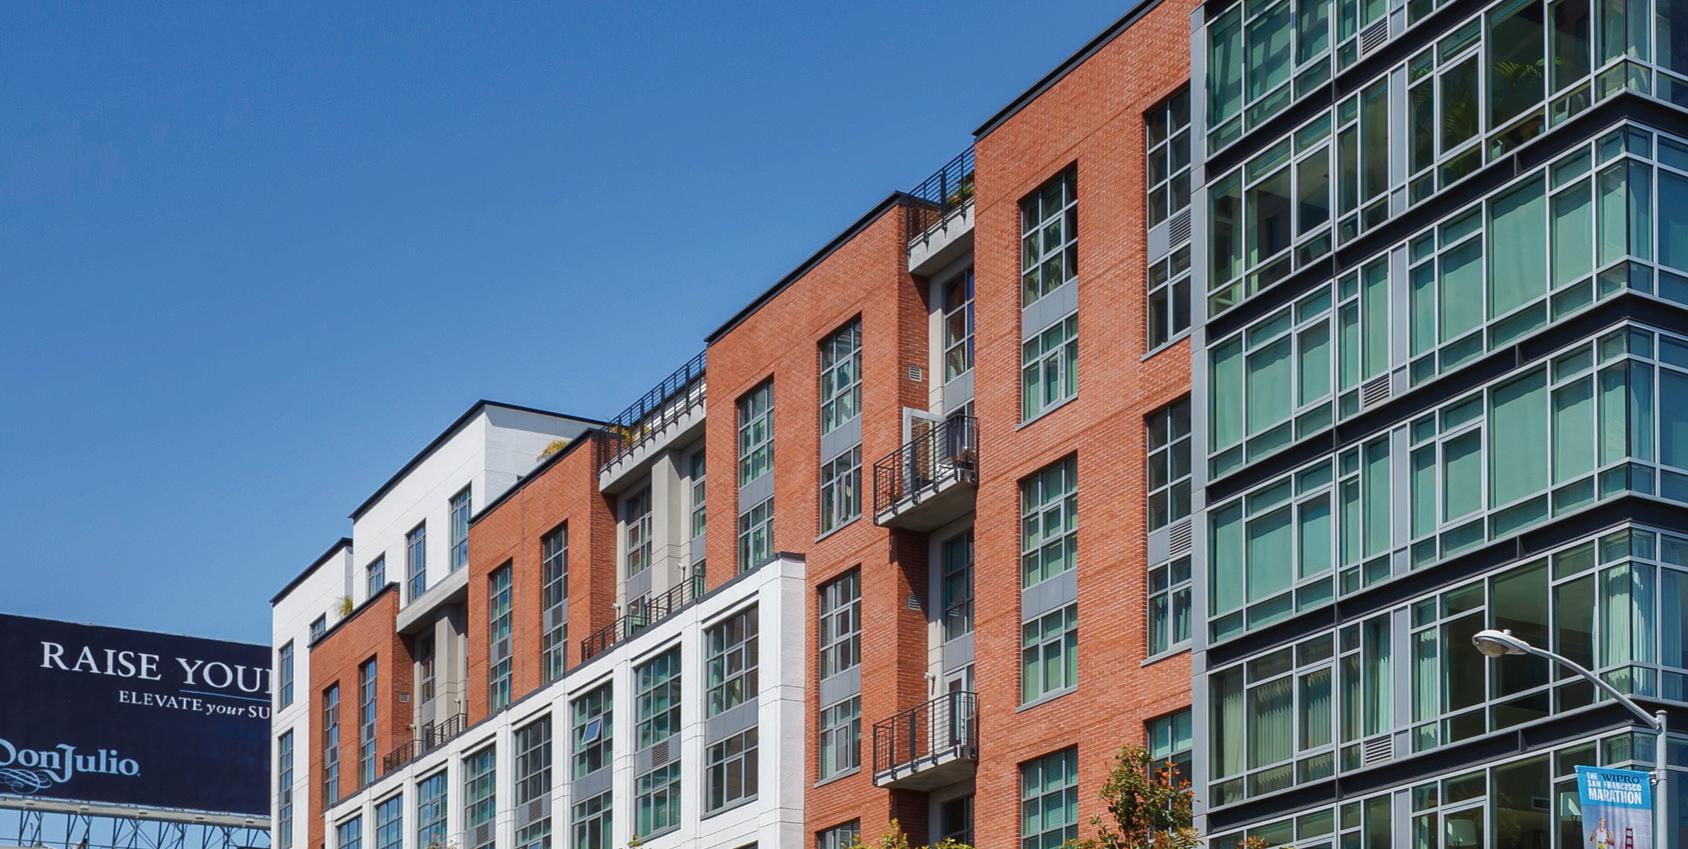
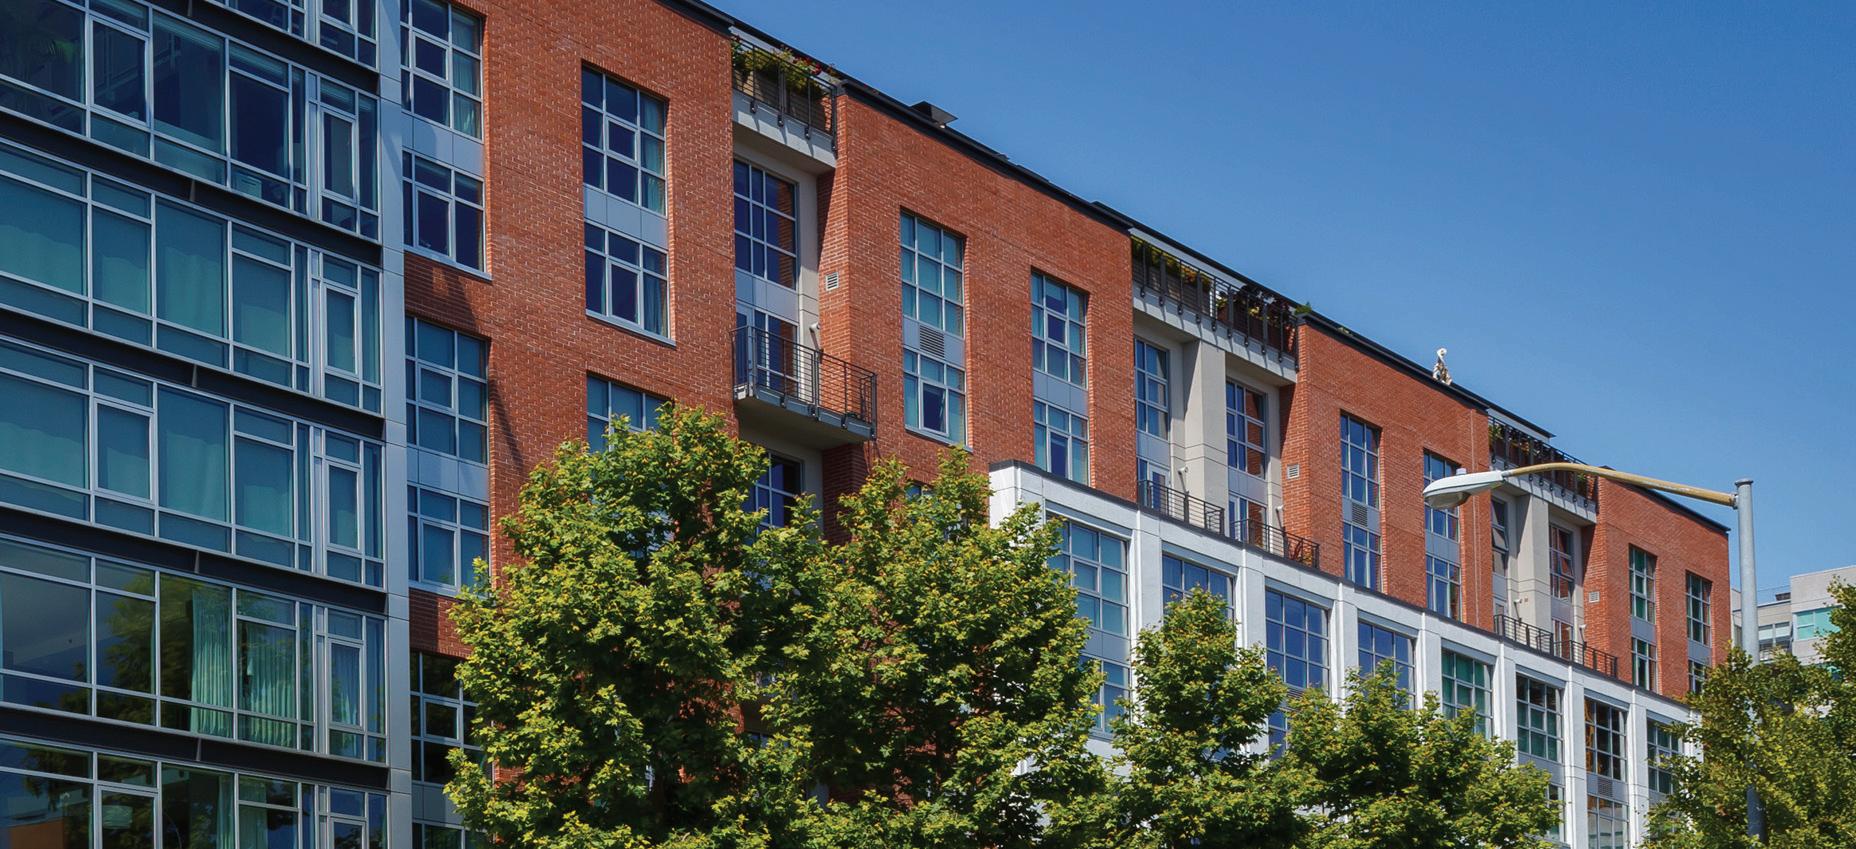
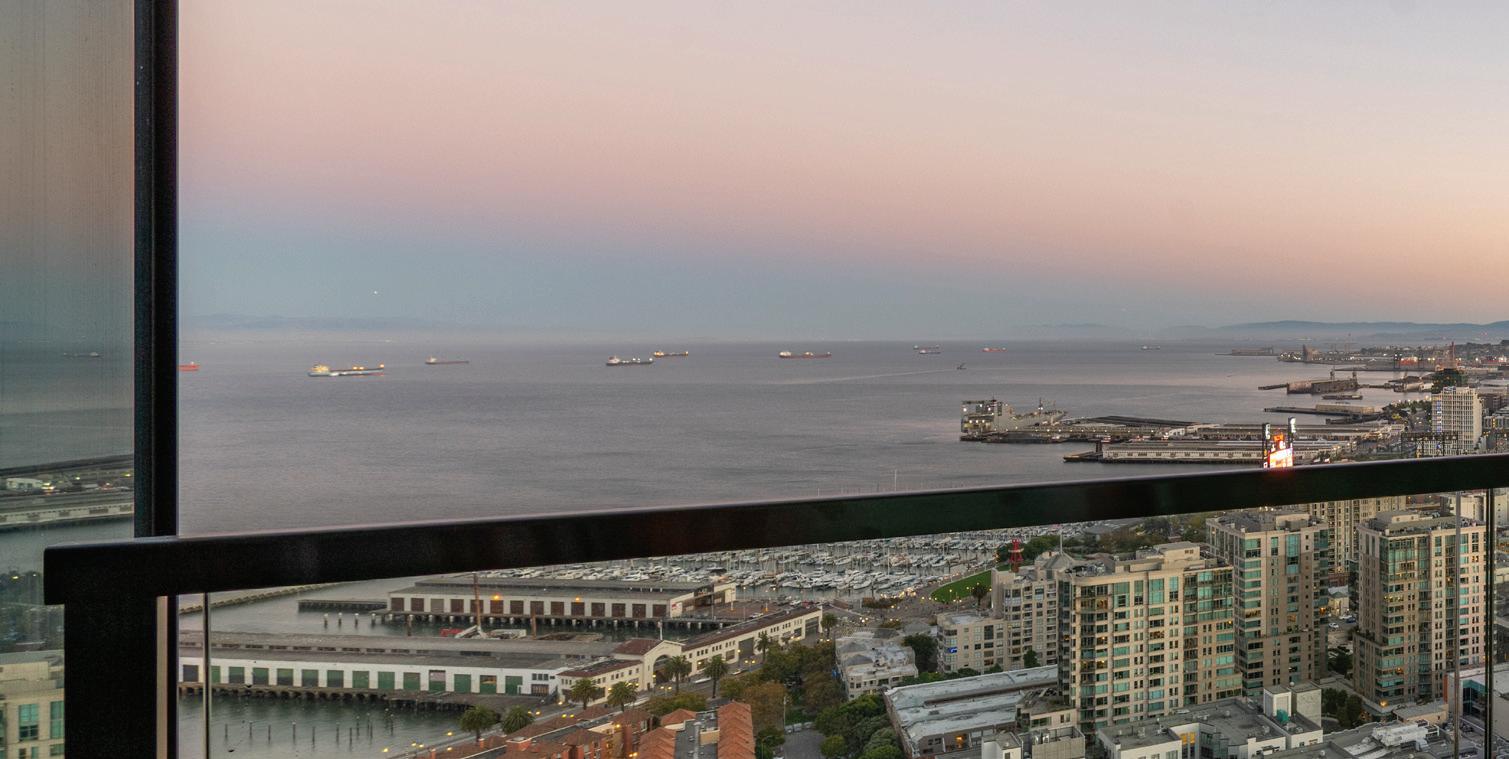
The South Beach condo market showed signs of optimism at the beginning of Q3, with new city leadership, a rapid increase in AI companies leasing office space, and significant residential rent increases.
By the end of Q3, there was a noticeable rise in pedestrian and vehicular traffic. Additionally, inventory for sale trended down, as did inventory for lease. The combination of increasing rents and low inventory for sale sets the stage for future price appreciation, suggesting that 2026 will bring more workers to San Francisco and increased demand for real estate.
Please contact me to discuss your personal goals for leasing, buying or selling real estate. We will come up with a great plan for you!
Best Regards, Paul Hwang, Ranked #1 in South Beach | 415.216.8746
This document has been prepared by Skybox Realty for advertising and general information only. Skybox Realty makes no guarantees, representations or warranties of any kind, expressed or implied, regarding the information including, but not limited to, warranties of content, accuracy and reliability. Any interested party should undertake their own inquiries as to the accuracy of the information. Skybox Realty excludes unequivocally all inferred or implied terms, conditions and warranties arising out of this document and excludes all liability for loss and damages arising there from.
South Beach & Yerba Buena Q3 Snapshot
# of Transactions
68
26% YOY / 17% QOQ
Average Sales Price
$1,220,032
$1,070
9.2% YOY / 12% QOQ 3.3% YOY / 4.7% QOQ
Average Days on the Market
76
YOY / 65% QOQ * Does not include new construction.
* Median Price $1,100,000
Average Price per Square Foot
# of Transactions 29
QOQ
Average Sales Price $932,592
Median Price $800,000
Average Price per Square Foot $827
Average Days on the Market 58
* Includes new construction marketed on MLS.
|
|
|
# of Transactions
YOY / 10% QOQ
/
QOQ
$1,145,000
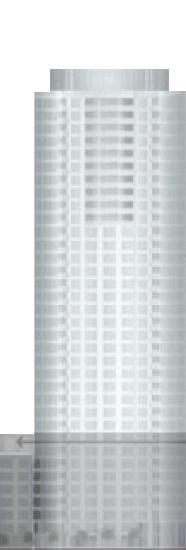
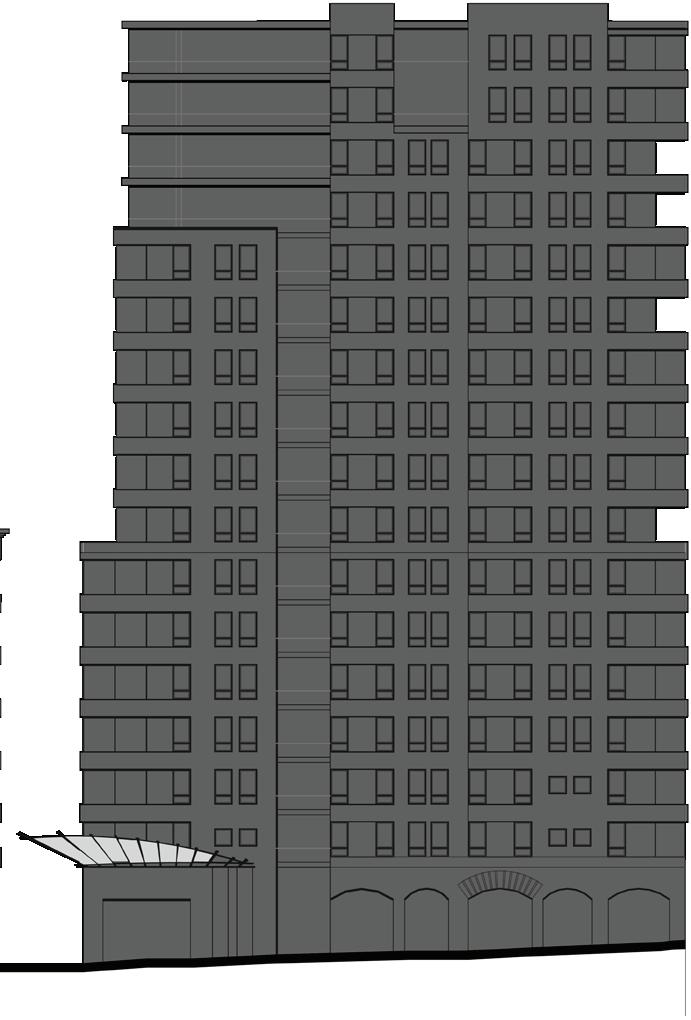
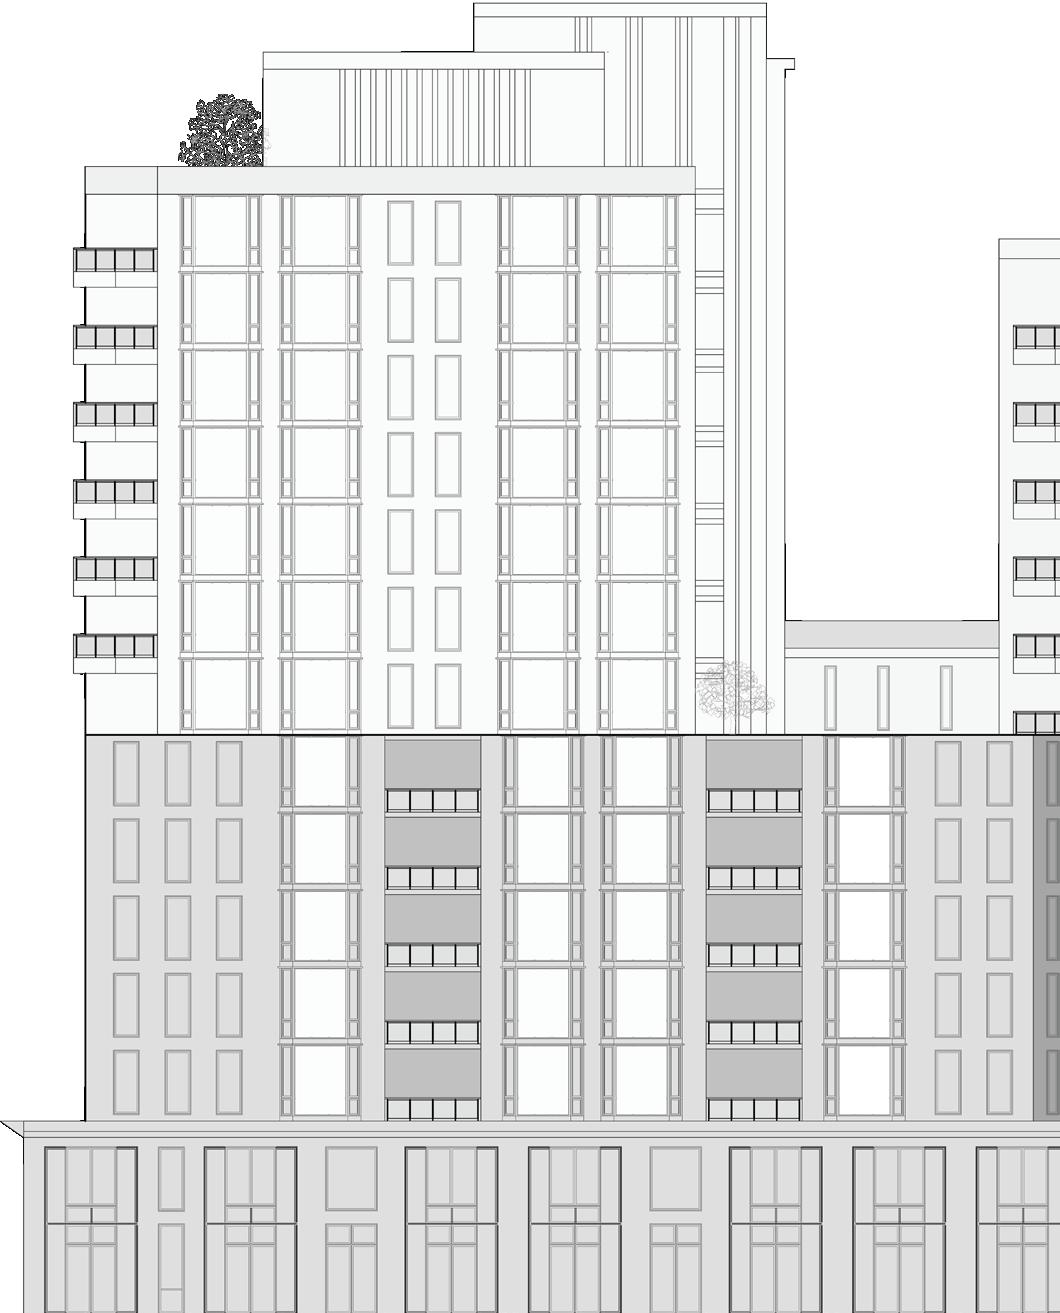
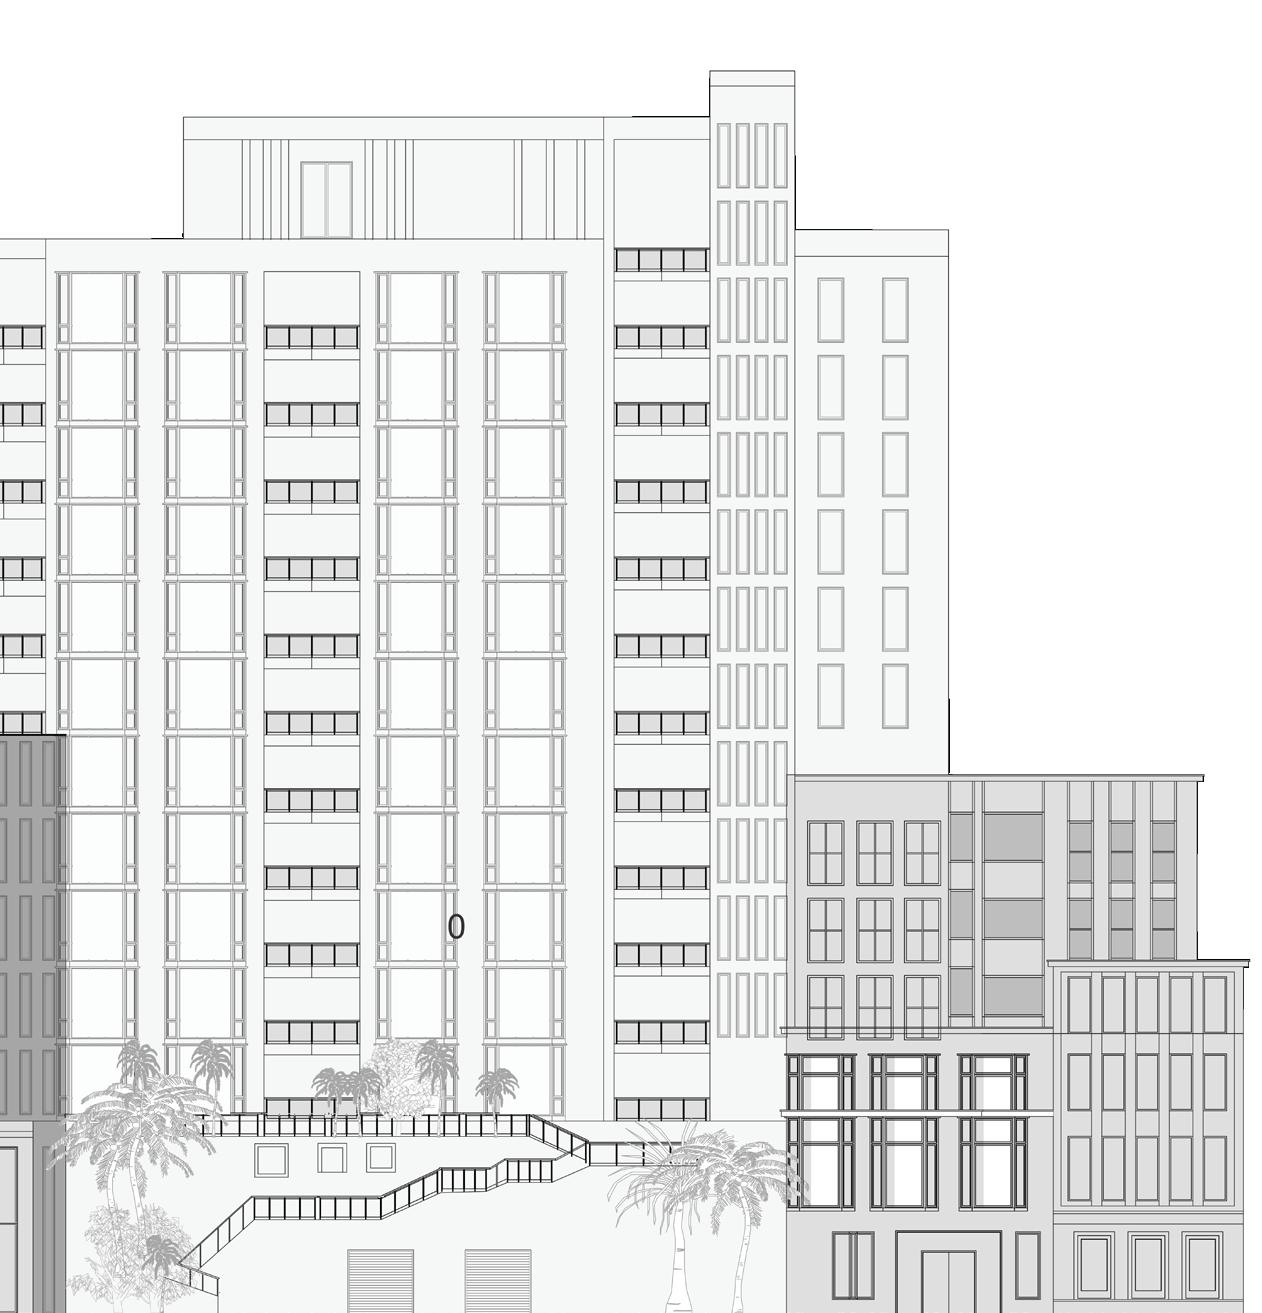
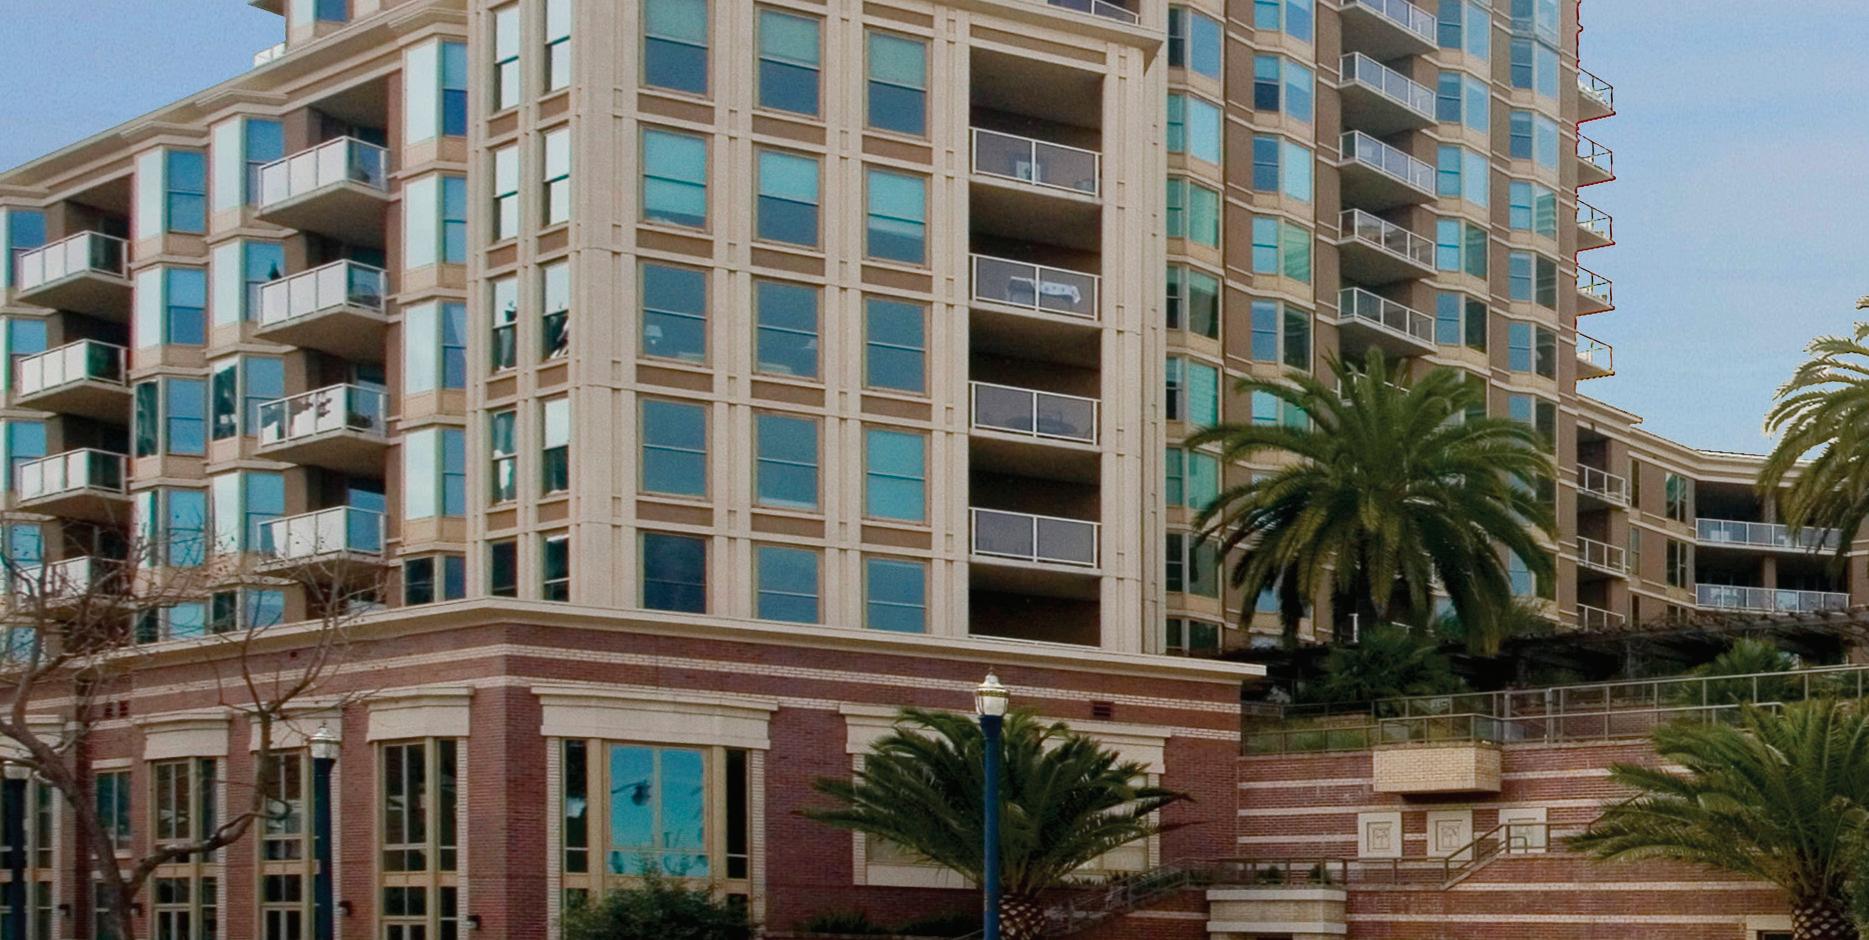
301 / 333 Main, 318 / 338 Spear
Average $/SF
$1,009
Buyer Demographic
Average Days on Market
D27A | $2,700,000 (2BR) $1718/sf
A7A | $711,000 (1BR) $1069/sf
B41C | $14,888,000 (3BR) $2850/sf
B38E | $3,150,000 (3BR) $1766/sf
B33a | $2,700,000 (2BR) $1722/sf
B20E | $2,050,000 (2BR) $1501/sf
| $1,749,000 (2BR) $1280/sf
| $1,715,000 (2BR) $1254/sf
| $799,000 (2BR) $----/sf
318 / 338 Main, 333 Beale, 201 Folsom
Average $/SF
$1,121
Buyer Demographic
Average Days on Market 35
* Indicates Remaining Developer Inventory
| $2,250,000 (2BR) $1533/sf
25E | $2,400,000 (2BR) $1840/sf
| $1,635,000 (2BR) $1066/sf
# of Transactions
Average Sales Price $2,017,500 49% YOY / 44% QOQ * Median Price $2,017,500 Q3 Q2 Q1 Q4
Average $/SF $1,453
Buyer Demographic
Average Days on Market 84
48C | $2,425,000 (2BR) $1526/sf
46B | $7,799,000 (3BR) $2427/sf
45C | $2,375,000 (2BR) $1495/sf
44A | $2,900,000 (2BR) $1760sf
25F | $1,198,000 (1BR) $1443/sf
23C | $1,895,000 (2BR) $1421/sf
6G | $899,000 (1BR) $1122/sf

# of Transactions
Average $/SF $1,378
Buyer Demographic
Average Days on Market 115
425 1st, 489 Harrison
Average $/SF $1,231
Buyer Demographic
Average Days on Market
67
Average $/SF
Average Days on Market

# of Transactions
* BMRs not included in data below
Average $/SF
$1,165
Buyer Demographic
Average Days on Market
103
# of Transactions
219 / 229 / 239
Average $/SF $1,224
Buyer Demographic
Average Days on Market
190
Average $/SF $923
Buyer Demographic
Average Days on Market 89
303 | $1,000,000 (1BR) $717/sf
| $7,250,000 (2BR) $2187/sf 16J | $1,1900,000 (2BR) $956/sf
| $1,695,000 (2BR) $1117/sf 14E | $825,000 (2BR) $726/sf

Buyer Demographic
of Transactions
Median Price $962,500
Buyer Demographic
Average $/SF $919 Average Days on Market
506 | $999,000 (2BR) $963/sf 2006 | $1,195,000 (2BR) $984/sf
506 | $999,000 (2BR) $963/sf 1907 | $1,249,000 (2BR) $1066/sf
506 | $999,000 (2BR) $963/sf 1102 | $750,000 (1BR) $1111/sf
506 | $999,000 (2BR) $963/sf 905 | $675,000 (1BR) $815/sf
506 | $999,000 (2BR) $963/sf 801 | $999,000 (2BR) $817/sf
506 | $999,000 (2BR) $963/sf 403 | $381,171 (1BR) bmr
* BMRs not included in data below
Average $/SF
Buyer Demographic
Buyer Demographic
# of Transactions
Average $/SF
$1,097
Buyer Demographic
Average Days on Market
40
200 Brannan
Average $/SF $871 Average Days on Market 25
219 Brannan 3E
501 Beale 18E
318 Main 7A
301 Main 5F
333 Main 2A
333 Main 4J
338 Main 3D
333 1st N307
401 Harrison 25A
425 1st 3301
425 1st 3401
425 1st 4208
333 Beale 2G
333 Beale 5I
333 Main 7B
301 Main 4A
318 Main 4E
338 Spear 16E
425 1st 1506
229 Brannan 11J
301 Main 10H
338 Spear 10H
501 Beale 19B
425 1st 3104
425 1st 1402
338 Main 6E
1,013 1,114 1,113 1,163 1,098 1,147 1,238 1,412 1,317 1,323 1,019 1,261 1,309 1,382
* Only showing sold homes in buildings featured in this book. Does not include new construction or bmrs.
$510,000
$670,000
$711,000
$750,000
$750,000
$799,000
$912,200
$917,500
$935,000
$940,000
$945,000
$965,000
$1,040,000
$1,098,000
$1,110,000
$1,145,000
$1,151,000
$1,242,500
$1,308,000
$1,357,000
$1,380,000
$1,380,000
$1,475,000
$1,500,000
$1,555,000
$1,625,000
$/SF
$1,071.43
$882.74
$1,069.17
$937.50
$688.07
$959.18
$1,044.90
$931.47
$1,113.10
$1,123.06
$1,129.03
$1,278.15
$1,026.65
$985.64
$997.30
$984.52
$1,048.27
$1,083.26
$1,056.54
$961.05
$1,047.84
$1,043.08
$1,447.50
$1,189.53
$1,187.93
$1,175.83
Address
333 Beale 7G
201 Folsom 9A
219 Brannan 12H
301 Main 24F
425 1st 1902
338 Main 19G
425 1st 4202
219 Brannan 3G
229 Brannan 10A
401 Harrison 45C
401 Harrison 48C
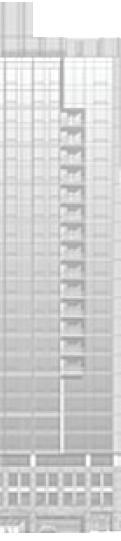
1 Hawthorne 6F
1 Hawthorne 15B
301 Mission 12B
1 Hawthorne 17B
301 Mission 16H
72 Townsend 301
38 Bryant 605
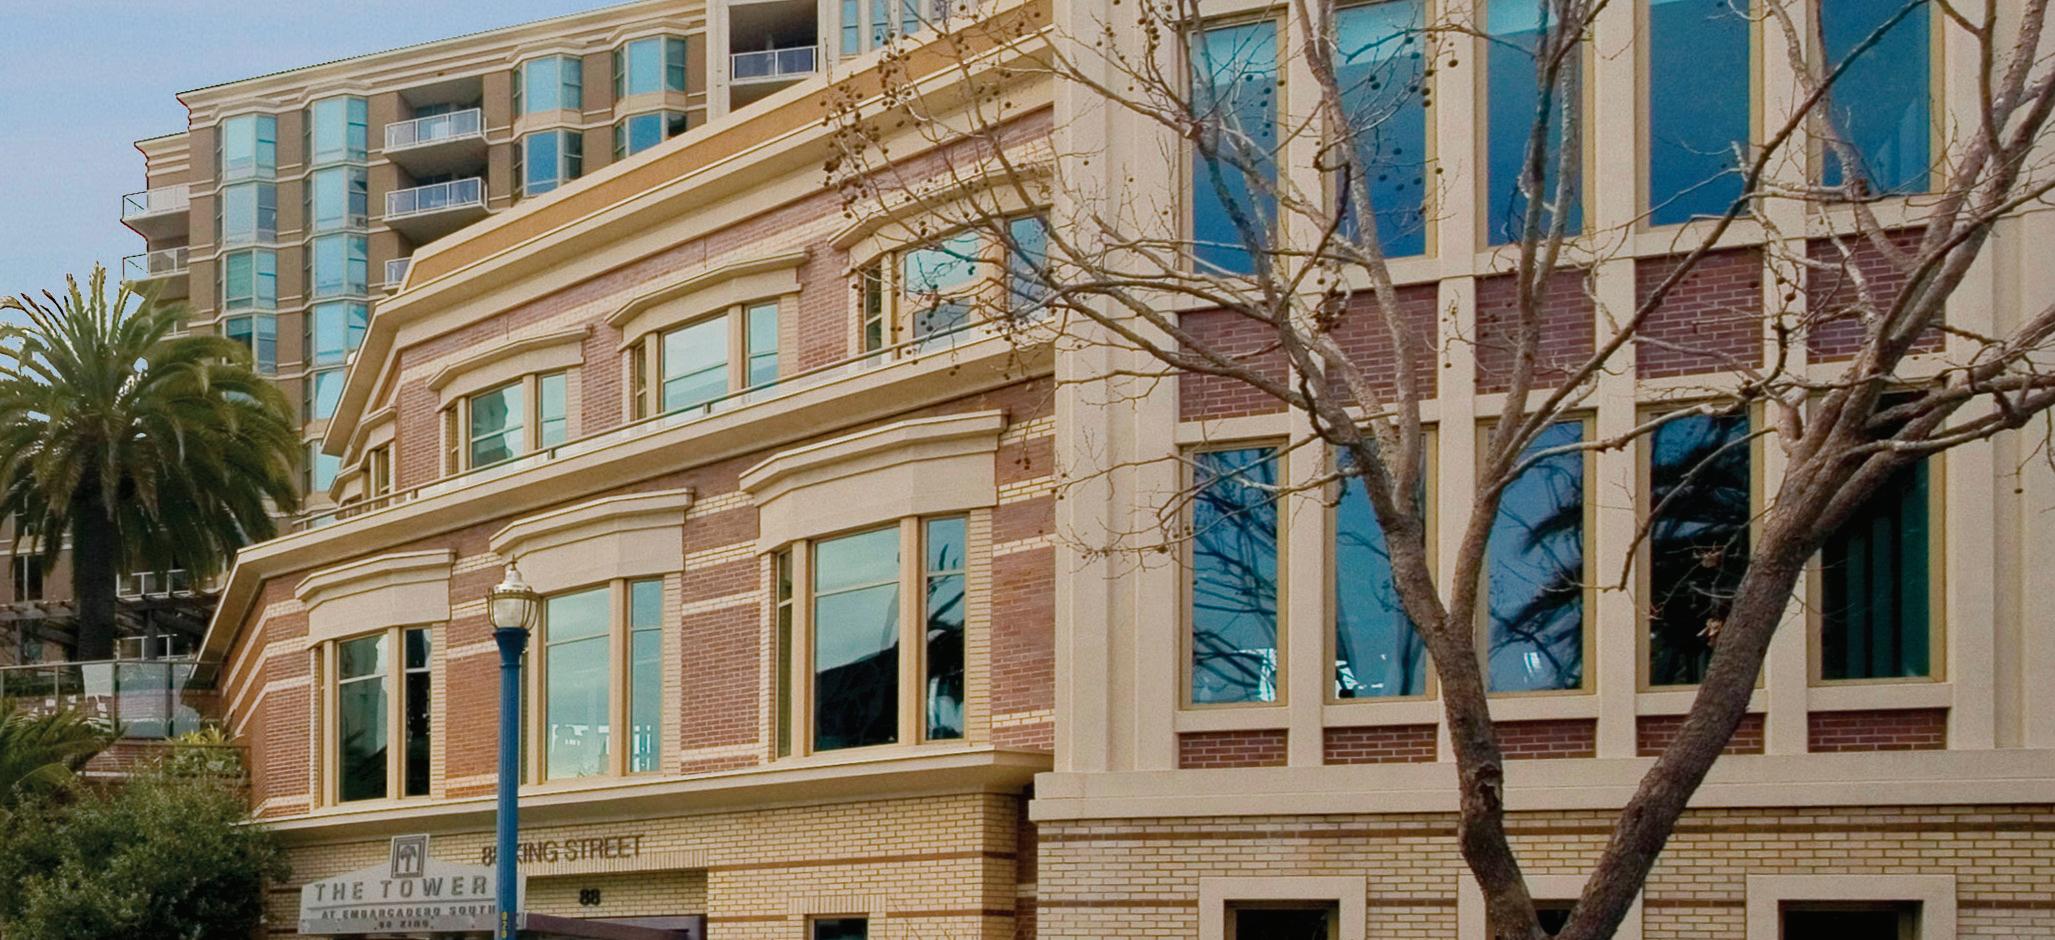
88 King 705
301 Mission 8E
301 Mission 20E
301 Mission 14E
403 Main 413N 400 Beale 1007 301 Mission 30A
SQFT 1,414 1,368 1,103 1,307 1,309 1,401 1,309 1,694 1,654 1,589 1,589 504 558 668 668 773 766 722 925 1,098 1,027 1,136 811 1,102 1,520
* Only showing sold homes in buildings featured in this book. Does not include new construction or bmrs.
$1,626,000
$1,715,000
$1,750,000
$1,750,000
$1,800,000
$1,875,000
$1,980,000
$2,050,000
$2,135,000
$2,375,000
$2,425,000
$470,000
$475,000
$588,000
$590,000
$640,000
$700,000
$710,000
$795,000
$800,000
$820,000
$825,000
$850,000
$945,000
$987,500 $/SF
$1,149.93 $1,253.66
$1,586.58
$1,338.94
$1,375.10
$1,338.33
$1,512.61
$1,210.15
$1,290.81
$1,494.65
$1,526.12
$932.54 $851.25
$880.24
$883.23 $827.94
$913.84
$983.38 $859.46
$728.60
$798.44 $726.23
$1,048.09
$857.53 $649.67
Address
301 Mission 14A
88 King 302
38 Bryant 405
403 Main 215N
200 Brannan 204
88 King 303
1 Hawthorne 14C
301 Mission 35A
72 Townsend 302
88 King 909
1 Hawthorne 8H
301 Mission 34F
1 Hawthorne 12F
301 Mission 31C
88 King 1122
2
2 2 / 2 2 / 2 2 / 2 SQFT 1,479 1,092 1,429 1,207 1,263 1,244 1,313 1,517 1,198 1,090 1,380 1,601 1,381 2,170 1,369
* Only showing sold homes in buildings featured in this book. Does not include new construction or bmrs.
Sale Price
$1,020,000
$1,025,000
$1,050,000
$1,100,000
$1,100,000
$1,160,000
$1,175,000
$1,200,000
$1,225,000
$1,250,000
$1,270,000
$1,305,000
$1,400,000
$1,900,000
$2,200,000
$1,022.54
$1,146.79
$920.29 $815.12
$1,013.76 $875.58 $1,607.01
# of Units 118 Monthly Absorption
# in Contract / Sold
.9 Units
# of Units
# in Contract / Sold
42+
146 Monthly Absorption
1.1 Units
# of Units
# of Stories
# Sold 54+
Paul Hwang | 415.216.8746 | paul@skyboxrealty.com
Call me to find out how we can feature your off market listing to all of our prospective buyers in our Quarterly Reports!
Paul Hwang Leasing Activity