2025 Q2 / Mission Bay Condo Report

Page 1


Hello Neighbors,

Condominium sales in Mission Bay surged 35% quarter-overquarter, reflecting renewed buyer confidence and increased transactional activity in the area. At the same time, the average price per square foot rose 8.4% compared to Q1. Inventory remains high and the market is competitive. It is a buyer’s market, but well-priced units are moving swiftly.

The leasing market has shown significant strength this quarter. Rents have risen sharply, and quality rental units are being snapped up quickly—a clear sign of both local and seasonal demand returning in full force. For investor-owners, this presents a compelling income opportunity.

Beyond the numbers, the broader tone of the city is shifting. Mayor Lurie’s efforts to clean up the streets and enforce existing laws are beginning to yield visible results. Residents and visitors alike are spending more time outdoors, enjoying the vibrancy of the city. This improving quality of life is starting to positively influence both sentiment and spending.

Adding further momentum, several large office leases were recently signed in Mission Bay. This commercial investment could serve as a leading indicator for rising condo prices, as renewed job growth and business activity often precede residential real estate appreciation.

Mission Bay may be setting the stage for its next cycle of appreciation. Watch this space.

Best Regards, Paul Hwang, Ranked #1 in South Beach | 415.216.8746

This document has been prepared by Skybox Realty for advertising and general information only. Skybox Realty makes no guarantees, representations or warranties of any kind, expressed or implied, regarding the information including, but not limited to, warranties of content, accuracy and reliability. Any interested party should undertake their own inquiries as to the accuracy of the information. Skybox Realty excludes unequivocally all inferred or implied terms, conditions and warranties arising out of this document and excludes all liability for loss and damages arising there from.

BLVD

Mariposa

307 | $1,200,000 (2BR) $972/sf
# of Transactions
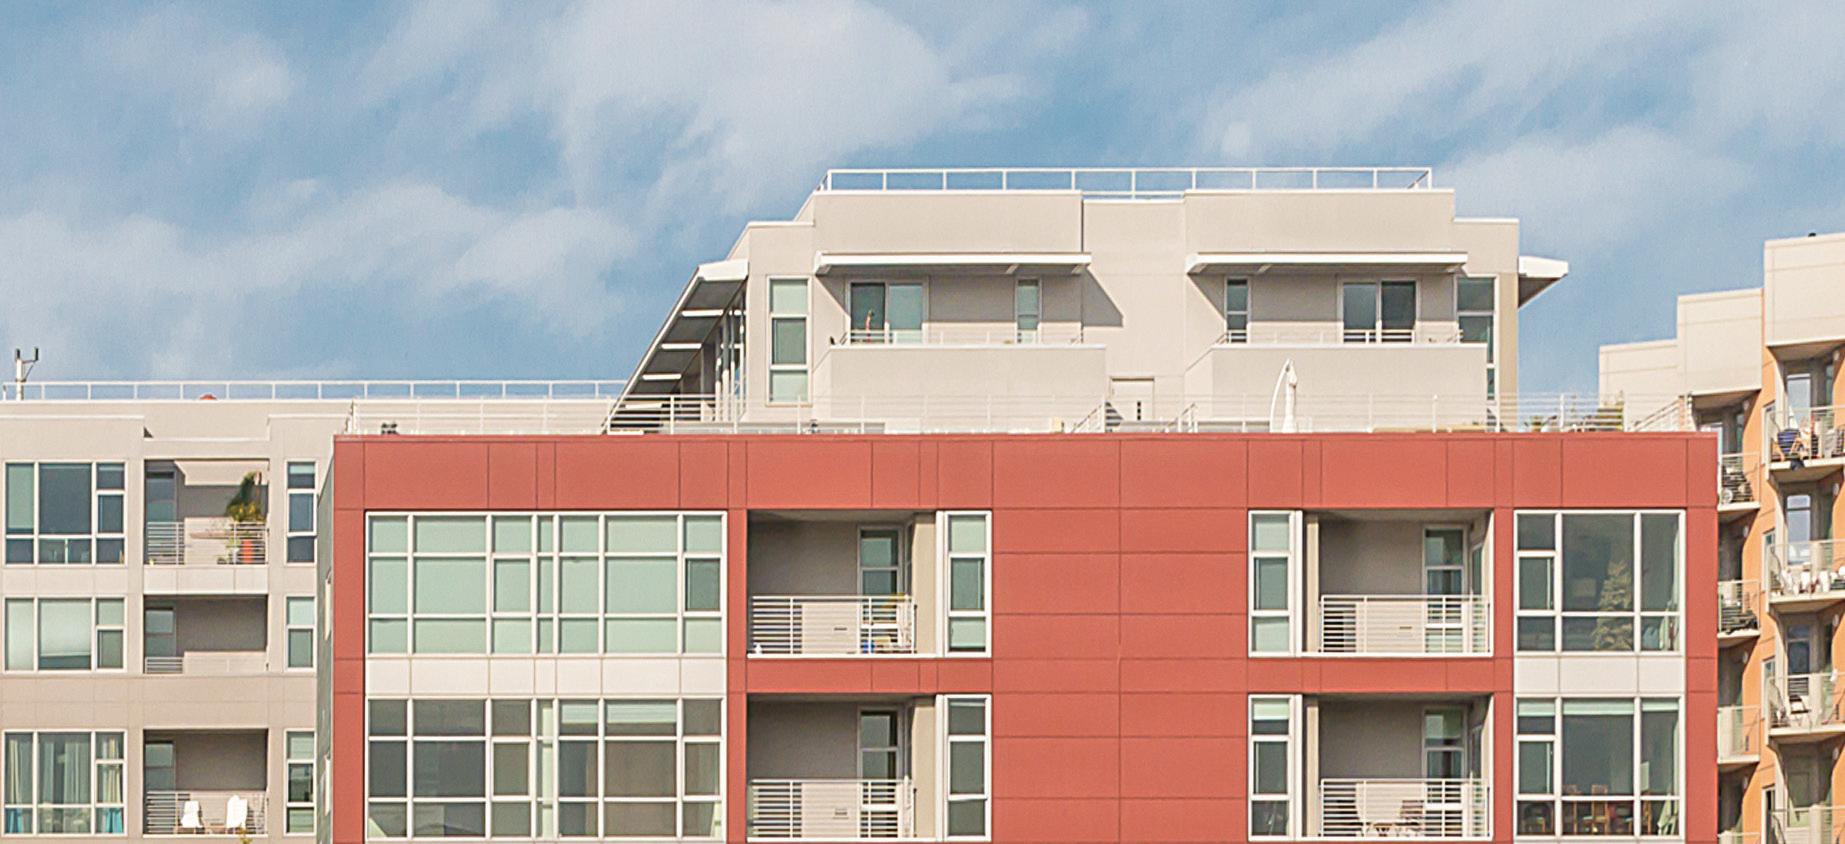
514 | $1,500,000 (2BR) $978/sf 310 | $1,379,000 (2BR) $951/sf
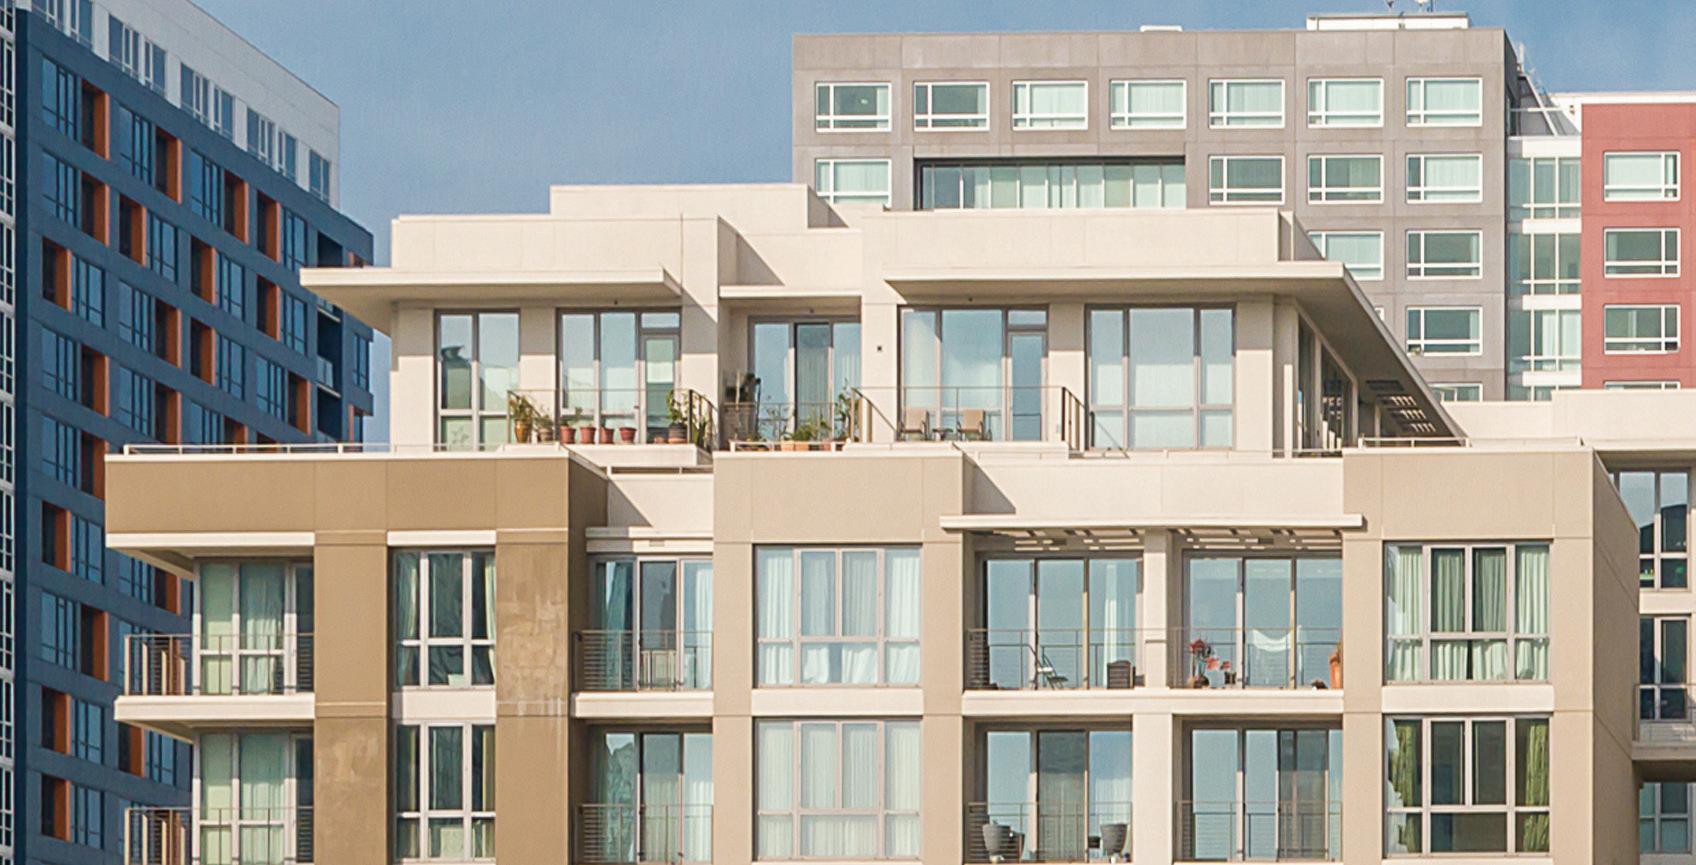
# of Transactions

Average Sales Price $1,439,500
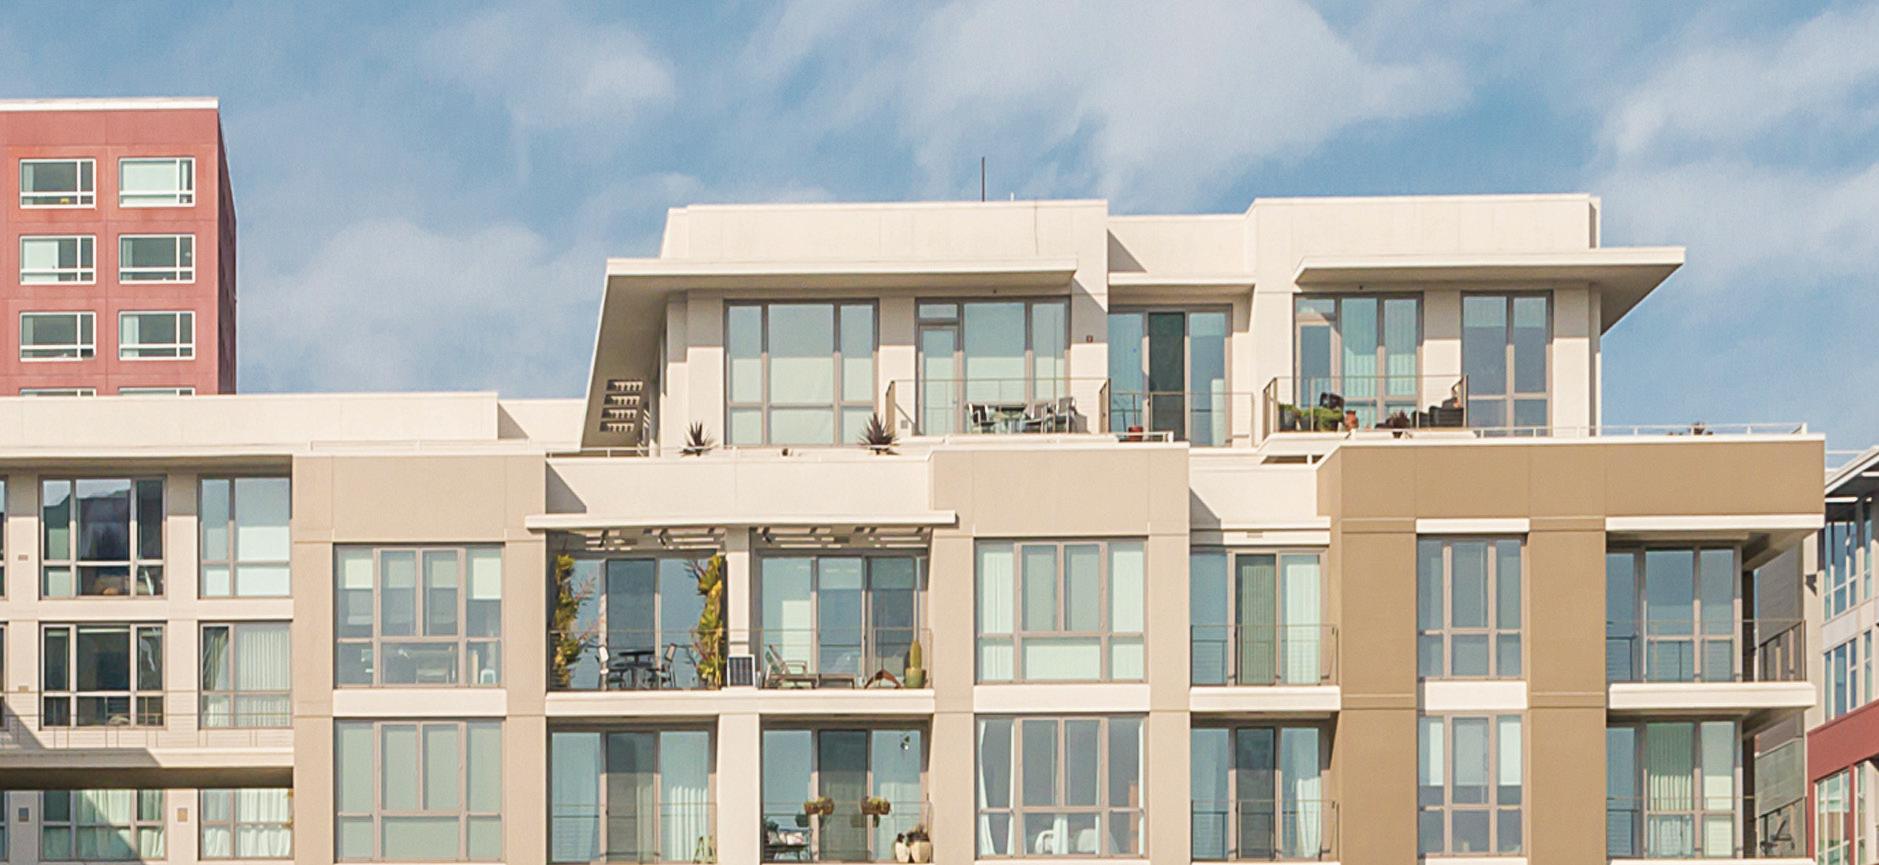
Average $/SF $965

Buyer Demographic

Average Days on Market
611 | $950,101 (2BR) $1027/sf

YOY / 50% QOQ

Average $/SF $1,027 Average Days on Market 12

Buyer Demographic

Park Terrace

715 | $895,000 (1BR) $1058/sf

Park Terrace

# of Transactions

100%YOY / ---- QOQ Average Sales Price

$1,685,000 100% YOY / 119% QOQ * Median Price $1,685,000 Q2 Q1 Q4 Q3

Average $/SF $1,015

Buyer Demographic

Average Days on Market 17
The Beacon

250 / 260 King

Average $/SF $854 Average Days on Market 84

Buyer Demographic

708 | $1,642,000 (2BR) $1290/sf

631 | $1,825,000 (3BR) $1146/sf

# of Transactions

420 / 480 Mission Bay, 435 China Basin

Average $/SF $1,268

Buyer Demographic

Average Days on Market 38

605 | $1,298,000 (1BR) $1335/sf

Transactions

330 Mission Bay, 325 China Basin

Average $/SF $946 Average Days on Market 47

Buyer Demographic

# of Transactions

Average $/SF $1,403 Average Days on Market 26

Buyer Demographic

One Mission Bay

One Mission Bay

# of Transactions

1000 3rd, 110 Channel

Average $/SF $1,274 Average Days on Market 25

Buyer Demographic

2025 Q2 Sales

Address

250 King 1104

250 King 1008

250 King 668

250 King 1508

260 King 1411

250 King 622

300 Berry 611

110 Channel 324

110 Channel 532

325 China Basin 310

110 Channel 424

255 Berry 310

255 Berry 514

708 Long Bridge 1411

480 Mission Bay 611

110 Channel 420

718 Long Bridge 317

325 Berry 328

420 Mission Bay 1504

708 Long Bridge 1508

435 China Basin 631

1000 3rd 1207

250 King 952

SQFT 587 787 795 787 810 1,126 925 833 887 1,281 1,183 1,450 1,533 1,018 1,187 1,101 1,308 1,660 1,332 1,216 1,593 1,639 2,450

* Only showing sold homes in buildings featured in this book. D oes not include new construction or bmrs.

Sale Price

$499,000

$625,000

$630,000

$709,000

$740,000

$890,000

$950,101

$1,030,000

$1,068,000

$1,212,000

$1,320,000

$1,379,000

$1,500,000

$1,525,000

$1,550,000

$1,585,000

$1,610,000

$1,685,000

$1,800,000

$1,800,000

$1,825,000

$2,250,000

$2,290,000

$1,027.14

$1,236.49

$1,204.06

$946.14

$1,115.81 $951.03

$978.47

$1,498.04

$1,305.81

$1,439.60

$1,230.89 $1,015.06

$1,351.35 $1,480.26

$1,145.64

$1,372.79

$934.69

Paul Hwang Activity (2021-2025 Sales)

Paul Hwang

Paul Hwang | 415.216.8746 | paul@skyboxrealty.com

Call me to find out how we can feature your off market listing to all of our prospective buyers in our Quarterly Reports!

Paul Hwang Leasing Activity

Turn static files into dynamic content formats.

Create a flipbook
Issuu converts static files into: digital portfolios, online yearbooks, online catalogs, digital photo albums and more. Sign up and create your flipbook.