Dear Neighbors, 2025 began with increased traffic at open houses and condo sales picked up alongside the stock market. With OpenAI’s new offices in Mission Bay and Databricks doubling its office space at One Sansome, there was a lot of excitement, however, as the quarter progressed and the stock market became more volatile, traffic and sales declined due to a shift in buyer sentiment. Yearover-year transactions showed significant increases (+32% in South Beach / +183% in Yerba Buena), but average sales prices (-7.5% in SB / -9.1% in YB) and price per square foot (-3.1% in SB / -13% in YB) decreased. On a brighter note, rents have remained strong, with quick showings and units staying on the market for less than 30 days.
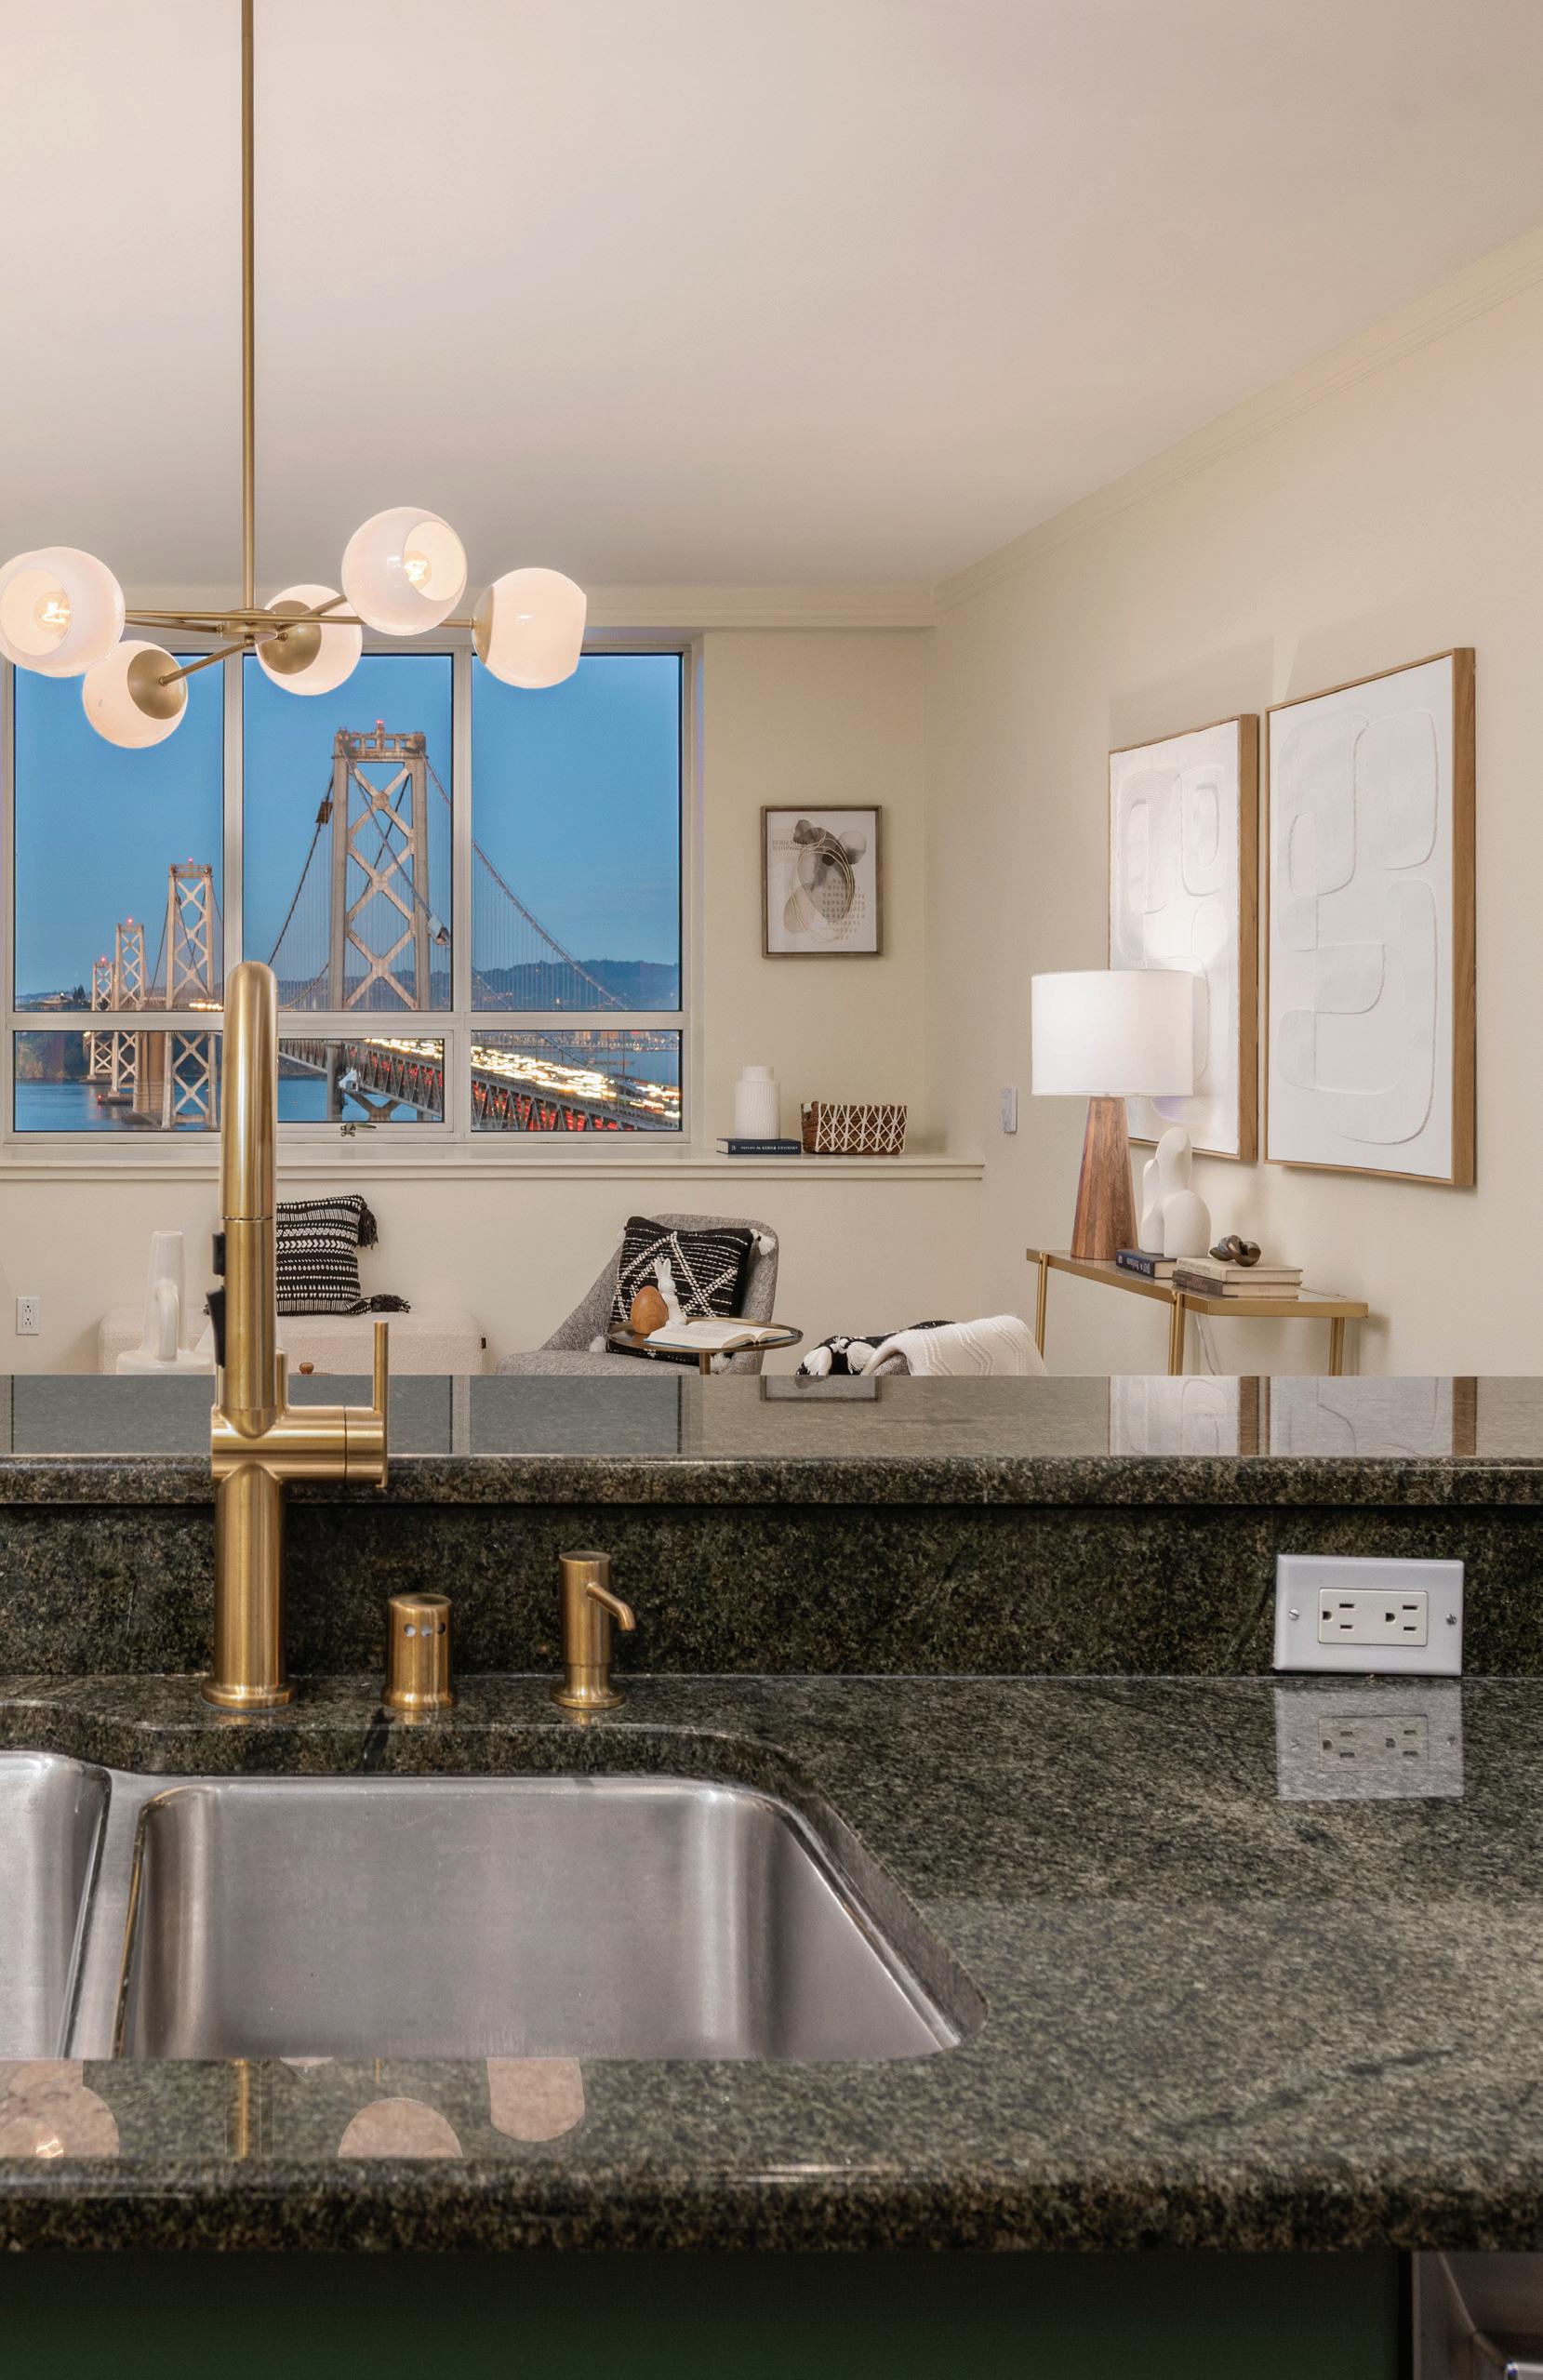
There is palpable new energy in San Francisco with the new city leadership. Mayor Lurie is focused on cleaning up the streets, enforcing laws, and making San Francisco more business-friendly. The free concerts and public art installations are attracting people to the city, and we’ve been receiving new inquiries about vacant retail spaces in Union Square. Our beautiful city is poised to reclaim its position as a cultural leader locally, nationally, and globally. I am confident that San Francisco will shine again!
Thank you to everyone who contacts me with words of encouragement for my team’s work; it means a lot to us! I look forward to assisting you and your family with all your real estate needs..
Best Regards, Paul
Hwang
, Ranked #1 in South Beach | 415.216.8746
This document has been prepared by Skybox Realty for advertising and general information only. Skybox Realty makes no guarantees, representations or warranties of any kind, expressed or implied, regarding the information including, but not limited to, warranties of content, accuracy and reliability. Any interested party should undertake their own inquiries as to the accuracy of the information. Skybox Realty excludes unequivocally all inferred or implied terms, conditions and warranties arising out of this document and excludes all liability for loss and damages arising there from.
South Beach & Yerba Buena Q1 Snapshot
South Beach 2025 Q1 # of Transactions
49
Average Sales Price
$1,222,051
Average Price per Square Foot
$1,070
59 32% YOY / 4.3% QOQ 7.5% YOY / 32% QOQ 3.1% YOY / 10% QOQ
Average Days on the Market
YOY / 13% QOQ * Does not include new construction. * Median Price $961,000
Yerba Buena 2025 Q1 # of Transactions 17
Average Sales Price $1,410,618
9.1% YOY / .79% QOQ
Average Price per Square Foot
$902
Average Days on the Market 69 183% YOY / 55% QOQ
Median Price $690,000
Historical Data * Includes new construction marketed on MLS.
The Infinity D16F | $1,469,000 (2BR) $1115/sf
D21D | $2,999,000 (2BR) $2270/sf
D8H
|
| $1,299,000 (2BR) $951/sf
|
|
| $899,000 (1BR) $1111/sf
| $1,489,000 (2BR) $1131/sf
| $1,199,000 (2BR)
C2A | $869,000 (1BR) $797/sf
B5F | $799,000 (1BR) $999/sf
B7B
$1,650,000 (2BR) $911/sf
C8E
$650,000 (0BR) $1144/sf
C5E
B11C
B4A
$1031/sf
C7B | $1,249,000 (2BR) 1122/sf
B29C | $3,200,000 (3BR) $1831/sf
B33C
$3,295,000 (3BR) $1885/sf
B10H
# of Transactions 4 100% YOY / ---- QOQ Average Sales Price
$1,627,375 25% YOY / 16% QOQ * Median Price $1,275,000 Q1 Q4 Q3
301 / 333 Main, 318 / 338 Spear
Average $/SF
$1,165
Buyer Demographic
Average Days on Market
Lumina | $3,198,000 (3BR) $1786/sf
| $1,180,000 (1BR) $1225/sf
D27A | $2,700,000 (2BR) $1718/sf
| $990,000 (1BR) $1134/sf
| $780,000 (1BR) $848/sf
| $920,000 (1BR) $1077/sf
| $1,478,000 (2BR) $1251/sf
D35E
D10D
C8F
D33D
D3F
D7H
B38E | $3,299,850 (3BR) $1850/sf
318 / 338 Main, 333 Beale, 201 Folsom
Average $/SF $1,191
Buyer Demographic
Average Days on Market
63
* Indicates Remaining Developer Inventory
39A | $3,500,000 (3BR) $1669/sf
39B | $3,750000 (3BR) $1694/sf
37B | $3,495,000 (3BR) $1592/sf
31B | $965,000 (1BR) $1190/sf
30C | $1,750,000 (2BR) $1361/sf
25E | $2,798,000 (2BR) $2176/sf
23C | $1,695,000 (2BR) $1408/sf
12C | $1,399,000 (2BR) $1168/sf
10C | $1,449,000 (2BR) $1146/sf
8B | $1,440,000 (2BR) $1114/sf
2Q | $875,000 (2BR) $1064/sf
1F | $849,000 (2BR) $1032/sf
Mira Resales # of Transactions
100% YOY / 100% QOQ
Average Sales Price $1,750,000 100% YOY / 100% QOQ * Median Price $1,750,000
Average $/SF $1,361
Buyer Demographic
Average Days on Market 1
The Harrison 17B | $1,415,000 (2BR) $1079/sf
16A | $950,000 (1BR) $1131/sf
7A | $1,349,000 (2BR) $961/sf
48C | $2,700,000 (2BR) $1699/sf
46B | $7,799,000 (3BR) $2427/sf
44A | $3,100,000 (2BR) $1881/sf
41B | $2,999,888 (3BR) $1818/sf
40A | $1,749,000 (2BR) $----/sf
38C | $2,285,000 (2BR) $1713/sf
31B | $1,535,000 (2BR) $1171/sf
17D | $1,750,000 (2BR) $1349/sf
16E | $769,000 (1BR) $1088/sf
7G | $985,000 (1BR) $1187/sf
4E | $745,000 (1BR) $1054/sf
# of Transactions
---- YOY / 40% QOQ
$1,566,667 92% YOY / 2.3% QOQ * Median Price $1,535,000
Average $/SF $1,200
Buyer Demographic
Average Days on Market 114
One Rincon Hill 4402 | $2,289000 (2BR) $1749/sf
4202 | $2,269000 (2BR) $1733/sf
3702 | $2,198,000 (2BR) $1679/sf
4405 | $789,800 (1BR) $1112/sf
(1BR) $1411/sf
(1BR) $1459/sf
(1BR) $1125/sf
(1BR)
| $835,000 (1BR) $1106/sf
(2BR) $978/sf
One Rincon Hill # of Transactions
50% YOY / 100% QOQ
$1,055,000 27% YOY / 39% QOQ * Median Price $1,055,000
425 1st, 489 Harrison
Average $/SF $892
Buyer Demographic
Average Days on Market 19
The Metropolitan S1103 | $669,000 (1BR) $1182/sf
S710 | $749,000 (1BR) $1110/sf
Average $/SF
Buyer Demographic
Average Days on Market
Watermark 12D | $1,799,000 (2BR) $1429/sf
| $428,206 (2BR) bmr
| $1,505,000 (2BR) $1297/sf
# of Transactions
Average $/SF
$1,297 Average Days on Market
111
Buyer Demographic
The Brannan 17A | $2,500,000 (3BR) $1552/sf
16A | $961,000 (1BR) $1118/sf
12H | $1,850,000 (2BR) $1677/sf
3G | $1,999,000 (3BR) $1180/sf
3E | $550,000 (1BR) $1155/sf
2F | $1,649,888 (2BR) $1286/sf
18E | $1,850,000 (2BR) $1749/sf
15D | $2,015,000 (2BR) $1708/sf
9A | $2,250,000 (3BR) $1360/sf
2D | $1,450,000 (2BR) $1033/sf
12D | $1,199,000 (2BR) $1022/sf
7J | $1,649,000 (2BR) $1078/sf
The Brannan # of Transactions
Sales Price $1,637,000 5.5% YOY / 1.3% QOQ * Median Price $1,450,000
219 / 229 / 239 Brannan
Average $/SF $1,234
Buyer Demographic
Average Days on Market 60
One Hawthorne 18F | $1,650,000 (2BR) $1195/sf
One Hawthorne Average $/SF $820 Average Days on Market 23
Buyer Demographic
Millennium Tower GPA | $9,000,000 (2BR) $1797/sf
PHD | $4,995,000 (2BR) $2240/sf
56B | $4,000,000 (2BR) $1207/sf
46E | $1,800,000 (2BR) $1071/sf
45F | $1,450,000 (2BR) $961/sf
35E | $1,695,000 (2BR) $989/sf
34F | $1,495,000 (2BR) $923/sf
28A | $1,289,000 (2BR) $850/sf
23D | $650,000 (1BR) $824/sf
20E | $877,777 (1BR) $855/sf
18E | $850,000 (2BR) $754/sf
17H | $615,000 (1BR) $796/sf
16C | $649,000 (1BR) $779/sf
6G | $788,000 (2BR) $621/sf
3F | $1,000,000 (2BR) $542/sf
Millennium Tower # of Transactions
$2,449,000
Average $/SF $941
Buyer Demographic
Average Days on Market 104
72 Townsend 902 | $2,650,000 (2BR) $1539/sf
806 | $1,698,000 (2BR) $----/sf
302 | $1,310,000 (2BR) $----/sf
# of Transactions
Average Sales Price $2,650,000 * Median Price $2,650,000 Q1 Q4 Q3 Q2
Average $/SF $1,539
Buyer Demographic
Average Days on Market 25
403 Main, 38 Bryant
Average $/SF $858
Buyer Demographic
Average Days on Market 161
Bridgeview 1413 | $850,000 (1BR) $995/sf
| $1,500,000 (2BR) $1339/sf
| $949,000 (1BR) $1146/sf
| $699,000 (1BR) $840/sf
| $999,000 (2BR) $963/sf
| $1,100,000 (2BR) $1024/sf
| $322,707 (2BR) bmr
# of Transactions
$1,500,000
Average $/SF $1,339
Buyer Demographic
Average Days on Market
Baycrest | $899,000 (1BR) $1360/sf
| $799,000 (1BR) $1090/sf
| $640,000 (2BR) $803/sf
312 | $410,000 (0BR) $960/sf
Buyer Demographic
The Towers # of Transactions
YOY / 50% QOQ
$1,050,000 .3% YOY / 15% QOQ * Median Price $1,050,000
Buyer Demographic
200 Brannan 200 Brannan # of Transactions
100% YOY / ---- QOQ Average Sales Price
$1,625,000
100% YOY / 7.2% QOQ * Median Price $1,625,000
200 Brannan
Average $/SF
$1,046
Buyer Demographic
Average Days on Market
14
2025 Q1 Sales Address 333 1st N706
338 Spear 8H
425 1st 2501
333 Beale 8F
338 Spear 4J
219 Brannan 16A
318 Main 7I
338 Main 33D
489 Harrison 302
401 Harrison 17B
229 Brannan 2D
338 Main 3F
501 Beale 11A
401 Harrison 31B
301 Main 7B
401 Harrison 17D
280 Spear 30C
201 Folsom 31A
219 Brannan 17A
301 Main 29C
201 Harrison 312
201 Harrison 111
/ 2 2 / 2 2 / 2 2 / 2 2 / 2 2 / 2.5 2 / 2 2 / 2 2 / 2 3 / 2 3 / 3 0 / 1 1 / 1 SQFT 506 733 837 920 1,021 860 938 963 1,542 1,311 1,404 1,181 1,160 1,311 1,812 1,297 1,286 1,568 1,611 1,748 635 749
/
/ 2.5
* Only showing sold homes in buildings featured in this book. D oes not include new construction or bmrs.
Sale Price
$430,000
$759,500
$760,000
$780,000
$900,000
$961,000
$1,030,000
$1,180,000
$1,350,000
$1,415,000
$1,450,000
$1,478,000
$1,505,000
$1,535,000
$1,650,000
$1,750,000
$1,750,000
$2,400,000
$2,500,000
$3,200,000
$410,000
$505,000
$1,036.15
$908.00 $847.83
$881.49
$1,117.44
$1,098.08
$1,225.34
$875.49
$1,079.33
$1,032.76
$1,251.48
$1,297.41
$1,170.86 $910.60
$1,349.27
$1,360.81 $1,530.61
$1,551.83
$1,830.66
$960.19
$936.92
2025 Q1 Sales cont... Address 301 Mission 17H
201 Harrison 710
201 Harrison 620
301 Mission 23D
201 Harrison 713
1 Hawthorne 3D
301 Mission 6G
38 Bryant 804
38 Bryant 604
301 Mission 17A
88 King 717
301 Mission PH6
400 Beale 2507
200 Brannan 502
72 Townsend 902
301 Mission 56B
301 Mission GPHA
SQFT 1,919 1,124 797 789 736 841 1,268 1,065 1,073 1,479 1,163 1,633 1,120 1,554 1,722 3,315 5,009
* Only showing sold homes in buildings featured in this book. D oes not include new construction or bmrs.
$615,000
$640,000
$641,000
$650,000
$665,000
$690,000
$788,000
$875,000
$960,000
$990,000
$1,050,000
$1,100,000
$1,500,000
$1,625,000
$2,650,000
$4,000,000
$9,000,000
$902.84
$673.61
$1,339.29
$1,045.69 $1,538.91 $1,206.64
$1,796.77
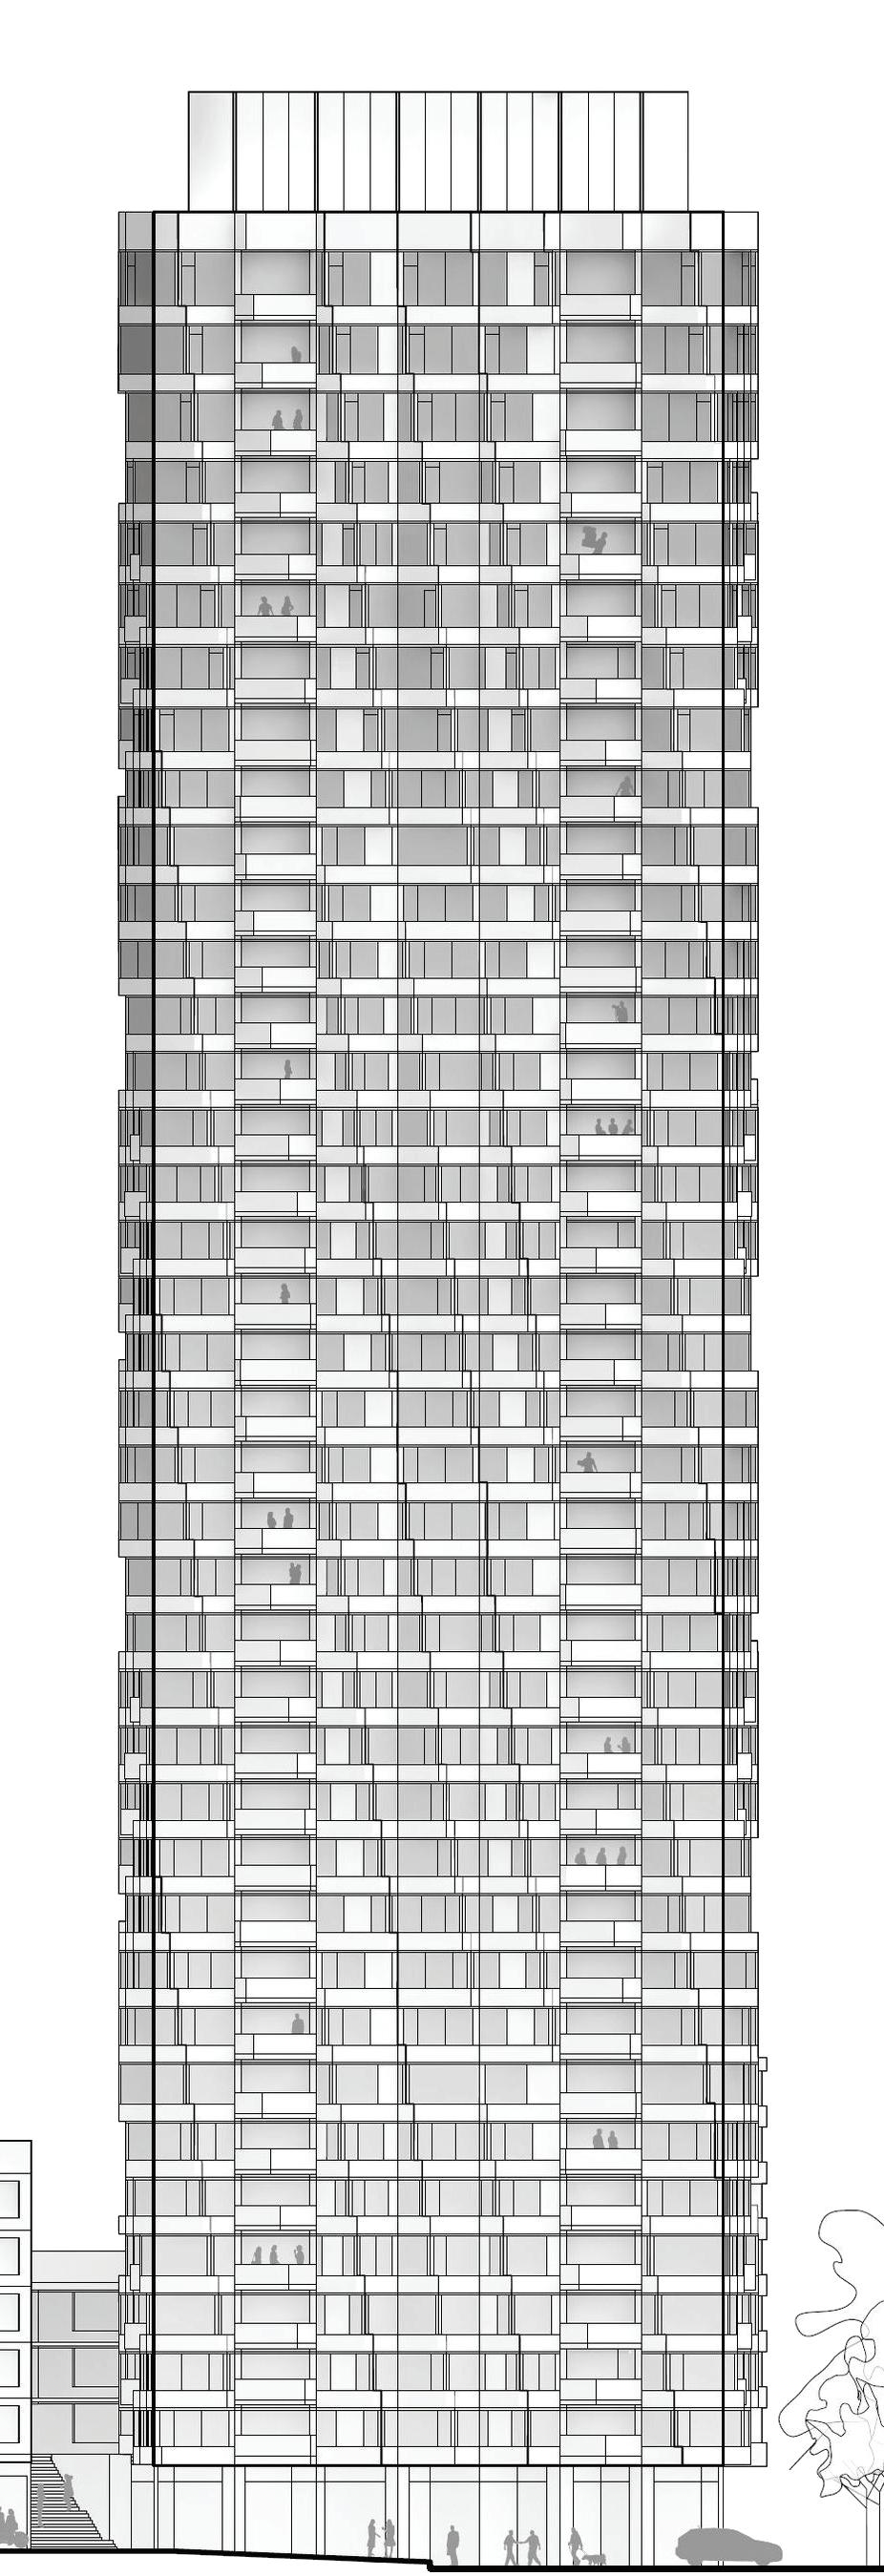
181 Fremont Manus The Avery Architect OMA # of Units 118 Monthly Absorption
# in Contract / Sold 73+
.9 Units
Four Seasons Residences # of Units
# in Contract / Sold
42+
146 Monthly Absorption
1.1 Units
One Steuart Lane # of Units
# of Stories
# Sold 48+
Paul Hwang
Paul Hwang | 415.216.8746 | paul@skyboxrealty.com
Call me to find out how we can feature your off market listing to all of our prospective buyers in our Quarterly Reports!
Paul Hwang Leasing Activity