


Condominium sales in South Beach surged 21% year-overyear and 18% quarter-over-quarter, reflecting renewed buyer confidence and increased transactional activity in the area. At the same time, the average price per square foot rose 4.9% compared to Q1. Inventory remains high and the market is competitive. It is a buyer’s market, but well-priced units are moving swiftly.
The leasing market has shown significant strength this quarter. Rents have risen sharply, and quality rental units are being snapped up quickly—a clear sign of both local and seasonal demand returning in full force.
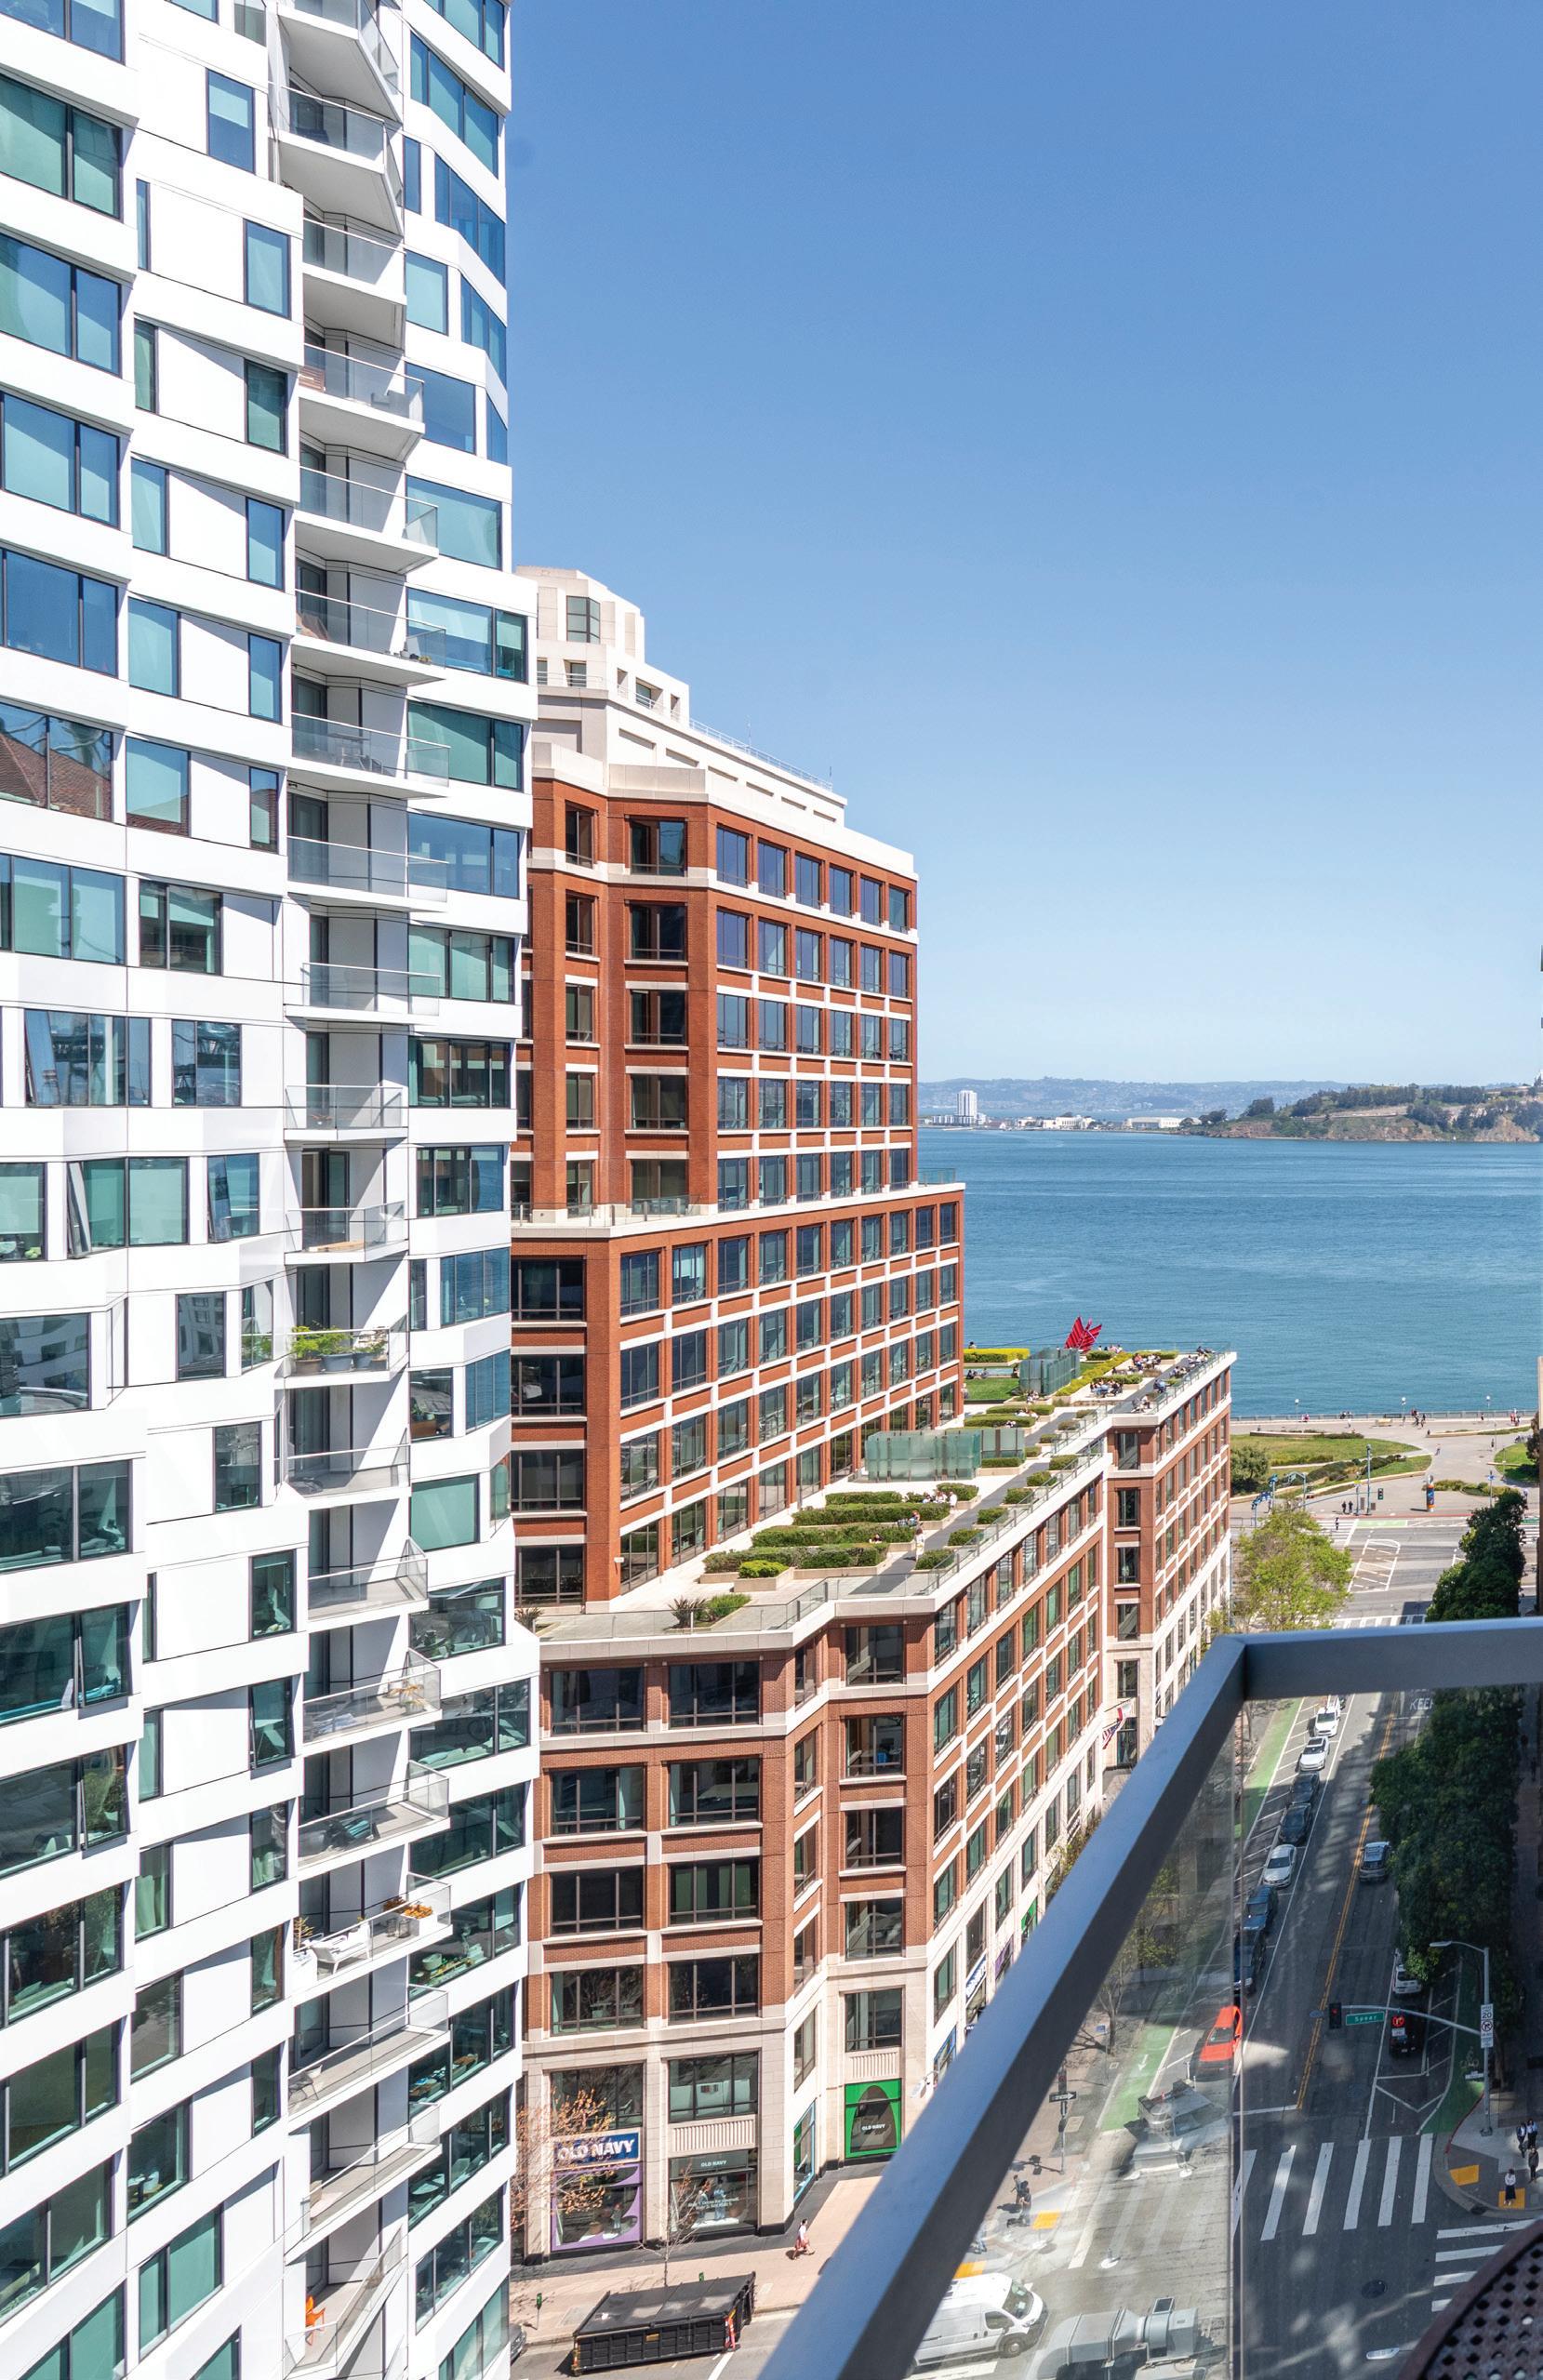
Beyond the numbers, the broader tone of the city is shifting. Mayor Lurie’s efforts to clean up the streets and enforce existing laws are beginning to yield visible results. Residents and visitors alike are spending more time outdoors, enjoying the vibrancy of the city. This improving quality of life is starting to positively influence both sentiment and spending.
Adding further momentum, several large office leases were recently signed in the South Financial District. This commercial investment could serve as a leading indicator for rising condo prices, as renewed job growth and business activity often precede upward pressure in residential real estate.
South Beach may be setting the stage for its next cycle of appreciation. Watch this space.
Best Regards, Paul Hwang, Ranked #1 in South Beach | 415.216.8746
This document has been prepared by Skybox Realty for advertising and general information only. Skybox Realty makes no guarantees, representations or warranties of any kind, expressed or implied, regarding the information including, but not limited to, warranties of content, accuracy and reliability. Any interested party should undertake their own inquiries as to the accuracy of the information. Skybox Realty excludes unequivocally all inferred or implied terms, conditions and warranties arising out of this document and excludes all liability for loss and damages arising there from.
South Beach & Yerba Buena Q2 Snapshot
# of Transactions
58
21% YOY / 18% QOQ
Average Sales Price
$1,387,175
6.8% YOY / 14% QOQ
* Median Price $1,237,500
Average Price per Square Foot
$1,122
Average Days on the Market
46
5.4% YOY / 4.9% QOQ 25% YOY / 22% QOQ * Does not include new construction.
# of Transactions 16
Average Sales Price $1,128,003
Median Price $870,000
Average Price per Square Foot
$988
Average Days on the Market 94
* Includes new construction marketed on MLS.
# of Transactions
43% YOY / 150% QOQ
YOY / 13% QOQ * Median Price $1,225,000
301 / 333 Main, 318 / 338 Spear
Average $/SF
$1,176
Buyer Demographic
Average Days on Market
D36AB | $6,500,000 (3BR) $1711/sf
D35E | $3,198,000 (3BR) $1786/sf
| $2,700,000 (2BR) $1718/sf
| $1,899,000 (2BR) $1355/sf
| $990,000 (1BR) $1134/sf
| $920,000 (1BR) $1077/sf
| $1,675,000 (2BR) $1212/sf
| $1,748,000 (2BR) $1236/sf
| $1,095,000 (1BR) $983/sf
| $1,048,000 (1BR) $1035/sf
B41C | $14,888,000 (3BR) $2850/sf B38E | $3,298,850 (3BR) $1849/sf B34D | $1,255,000 (1BR) $1291/sf
| $2,150,000 (2BR) $1532/sf
| $2,050,000 (2BR) $1501/sf
| $899,000 (1BR) $1138/sf B20D | $1,100,000 (1BR) $1256/sf
| $1,830,000 (2BR) $1306/sf
318 / 338 Main, 333 Beale, 201 Folsom
Average $/SF
$1,461
Buyer Demographic
Average Days on Market
29
* Indicates Remaining Developer Inventory
37B | $3,495,000 (3BR) $1592/sf *
39B | $3,575,000 (3BR) $1615/sf *
25E | $2,648,000 (2BR) $2031/sf
23C | $1,589,000 (2BR) $1320/sf
12C | $1,315,000 (2BR) $1098/sf
8B | $1,285,000 (2BR) $994/sf
2Q | $849,000 (2BR) $1033/sf
1B | $980,000 (2BR) $1028/sf
9A | $41,699,000 (2BR) $1108/sf * 1F | $799,000 (2BR) $971/sf
# of Transactions
Average Sales Price $1,396,333 100% YOY / 20% QOQ * Median Price $1,315,000 Q2 Q1 Q4 Q3
Average $/SF $1,137
Buyer Demographic
Average Days on Market 64
48C | $2,500,000 (2BR) $1573/sf
46B | $7,799,000 (3BR) $2427/sf
45C | $2,499,000 (2BR) $1573/sf
41B | $2,900,888 (3BR) $1465/sf
38C | $2,285,000 (2BR) $1713/sf
35D | $2,150,000 (2BR) $1658/sf
25F | $1,249,000 (1BR) $1505/sf
16E | $754,500 (1BR) $1067/sf
8D | $729,000 (1BR) $1201/sf
4E | $737,000 (1BR) $1042/sf
# of Transactions
150% YOY / 67% QOQ
Sales Price $1,323,300 33% YOY / 16% QOQ * Median Price $900,000

Average $/SF $1,118 Average Days on Market 52
Buyer Demographic
| $2,289,000 (2BR) $1749/sf

425 1st, 489 Harrison
Average $/SF $1,121
Buyer Demographic
Average Days on Market 77
| $1,150,000 (2BR) $1211/sf
| $1,199,000 (2BR) $1220/sf
| $925,000 (2BR) $939/sf
S2503 | $1,928,000 (2BR) $1303/sf
S710 | $769,000 (1BR) $1139/sf
Buyer Demographic
| $1,650,000 (2BR) $1421/sf
| $720,000 (1BR) $949/sf
14A | $1,999,800 (2BR) $1361/sf 12D | $1,605,000 (2BR) $1275/sf 11F | $428,000 (2BR) bmr 10B | $1,348,000 (2BR) $1323/sf 20A | $2,100,000 (2BR) $1430/sf
Transactions
* BMRs not included in data below
Average $/SF $1,275 Average Days on Market 95
Buyer Demographic
| $1,750,000 (2BR) $1587/sf
3E | $550,000 (1BR) $1155/sf 2F | $1,549,888 (2BR) $1172/sf
18E | $1,799,000 (2BR) $1700/sf
12C | $2,150,000 (2BR) $1550/sf
12H | $1,850,000 (2BR) $1677/sf 9A | $2,180,000 (3BR) $1317/sf 15D | $1,949,000 (2BR) $1652/sf 11J | $1,450,000 (2BR) $1027/sf

# of Transactions
YOY / 33% QOQ
Sales Price $1,426,000
YOY / 13% QOQ
Median Price $1,312,500
219 / 229 / 239 Brannan
Average $/SF $1,061
Buyer Demographic
Average Days on Market 93
18F | $1,599,000 (2BR) $1158/sf
# of Transactions
200% YOY / 200% QOQ
$1,007,667 30% YOY / 46% QOQ * Median Price $890,000
Average $/SF
$1,056
Average Days on Market 61

| $1,695,000 (2BR) $1117/sf
| $650,000 (1BR) $841/sf
46E | $1,700,000 (2BR) $1012/sf
45F | $1,450,000 (2BR) $961/sf
40D | $3,000,000 (2BR) $1537/sf
39C | $2,200,000 (2BR) $1014/sf
35E | $1,685,000 (2BR) $983/sf
34F | $1,495,000 (2BR) $923/sf
31C | $2,099,000 (3BR) $967/sf
28A | $1,289,000 (2BR) $850/sf
20E | $857,000 (1BR) $834/sf
18E | $850,000 (2BR) $754/sf
17B | $629,900 (1BR) $943/sf
16C | $649,000 (1BR) $779/sf
14A | $1,200,000 (2BR) $811/sf
12B | $588,000 (1BR) $880/sf
8E | $829,000 (2BR) $755/sf

# of Transactions

Buyer Demographic
806 | $1,875,000 (2BR) $1600/sf
301 | $750,000 (1BR) $979/sf
# of Transactions
Average Sales Price $1,875,000
Median Price $1,875,000
Average $/SF $1,600
Buyer Demographic
Average Days on Market 10
# of Transactions
403 Main, 38 Bryant
Average $/SF $887
Buyer Demographic
Average Days on Market 22
1413 | $850,000 (1BR) $995/sf
1007 | $945,000 (2BR) $858/sf

| $999,000 (2BR) $963/sf
| $1,100,000 (2BR) $1024/sf
| $322,707 (2BR) bmr
Buyer Demographic
302 | $450,000 (0BR) $1042/sf
Buyer Demographic

906 | $998,000 (2BR) $911/sf
507 | $1,160,000 (2BR) $1039/sf
421 | $1,150,000 (2BR) $1056/sf
302 | $1,025,000 (2BR) $939/sf
# of Transactions
Average $/SF $1,081
Buyer Demographic
Average Days on Market 16
407 | $1,295,000 (2BR) $849/sf
204 | $1,198,800 (2BR) $949/sf
# of Transactions
Buyer Demographic
425 1st 1904
425 1st 4405
401 Harrison 4E
401 Harrison 16E
425 1st 1508
318 Spear 8E
318 Spear 8G
301 Main 11C
239 Brannan 7G
401 Harrison 16A
318 Spear 5H
239 Brannan 12D
425 1st 4007
338 Spear 11F
333 Main 5E
201 Folsom 34D
280 Spear 8B
280 Spear 12C
401 Harrison 7A
338 Spear 16F
239 Brannan 7J
280 Spear 23C
501 Beale 12D
835 1,173 819 1,318 1,366 972 1,293 1,198 1,404 1,318 1,530 1,204 1,259
* Only showing sold homes in buildings featured in this book. D oes not include new construction or bmrs.
Sale Price
$627,000
$731,250
$737,000
$754,500
$765,000
$850,000
$862,875
$899,000
$899,000
$900,000
$900,000
$1,125,000
$1,149,000
$1,200,000
$1,250,000
$1,255,000
$1,285,000
$1,315,000
$1,325,000
$1,400,000
$1,500,000
$1,589,000
$1,605,000 $/SF
$1,036.36
$1,029.93
$1,042.43
$1,067.19
$1,013.25
$1,054.59
$1,081.30
$1,111.25
$987.91
$1,071.43
$1,077.84
$959.08
$1,402.93
$910.47 $915.08
$1,291.15
$993.81
$1,097.66 $943.73
$1,062.22 $980.39
$1,319.77 $1,274.82
Address
301 Main 19B
201 Folsom 19G
338 Spear 35E
201 Folsom 24E
201 Folsom 26C
229 Brannan 9A
318 Main 7F
401 Harrison 41B
301 Main 33C
338 Main 36B
201 Harrison 429
201 Harrison 302
1 Hawthorne 18B
301 Mission 16C
400 Beale 2202
38 Bryant 409
301 Mission 18E
1 Hawthorne 22D
88 King 507
88 King 402 1 Hawthorne 18F
72 Townsend 806
301 Mission 39C
1,317 1,401 1,340 1,366 1,403 1,655 1,797 1,980 1,748 3,800 432 432 558 833 675 887 1,098 846 1,116 1,092 1,381 1,172 2,170
* Only showing sold homes in buildings featured in this book. D oes not include new construction or bmrs.
$1,757,250
$1,830,000
$1,850,000
$2,050,000
$2,150,000
$2,180,000
$2,565,000
$2,900,000
$3,200,000
$6,500,000
$400,000
$450,000
$534,000
$649,000
$670,000
$829,270
$850,000
$890,000
$1,160,000
$1,250,000
$1,650,000
$1,875,000
$2,200,000 $/SF
$1,334.00
$1,306.21
$1,380.60
$1,500.73
$1,532.43
$1,317.22
$1,427.38
$1,464.65
$1,830.66
$1,710.53
$925.93
$1,041.67
$956.99
$779.11 $992.59
$934.92
$774.13
$1,052.01
$1,039.43
$1,121.79
$1,157.86
$1,599.83 $1,013.82
# of Units 118 Monthly Absorption
# in Contract / Sold
.9 Units
# of Units
# in Contract / Sold
42+
146 Monthly Absorption
1.1 Units
# of Units
# of Stories
# Sold 51+
Paul Hwang | 415.216.8746 | paul@skyboxrealty.com
Paul Hwang Activity (2021-2025 Sales)
Paul Hwang | 415.216.8746 | paul@skyboxrealty.com
Call me to find out how we can feature your off market listing to all of our prospective buyers in our Quarterly Reports!
Paul Hwang Leasing Activity